


-
Our previous trend analysis of 15-year breeding records (2005−2019) showed that the Washington State University apple breeding program (WABP) has been selecting apples with improved eating quality and storability[1]. Improved eating quality was indicated by increased fruit crispness, increased outer cortex fruit firmness, marginally higher acidity, and soluble solids concentration comparable to that of commercial cultivars. Improved storability (i.e., retention of fruit firmness through cold storage) was indicated by increased inner cortex fruit firmness. Improvements in both eating quality and storability represent two of the three overarching WABP's breeding targets, alongside desirable fruit appearance[2].
Extended fruit storability is a critical target[3] to meet the year-round consumer demand for high-quality fruit in the market. When an apple fruit is harvested, it undergoes metabolic and physiochemical changes during storage, such as changes in appearance (e.g., shriveling), composition (e.g., water content), texture (e.g., softening from inside out), flavor (e.g., acidity and aroma compounds), and nutritional content[4]. As texture degradation in storage is usually a result of fruit softening, instrumental firmness measurements after a specified storage duration can be used to phenotype fruit storability.
In most apple breeding programs worldwide, fruit firmness is phenotyped using mechanical/computerized penetrometers. A Mohr™ Digi-Test (MDT) computerized penetrometer has been used in the WABP to measure fruit texture, such as firmness since 2009[5,6]; prior to that, a Magnus-Taylor-type penetrometer was used[7]. The MDT's fruit firmness data outputs are calculated based on a two-region anatomy model of peeled apple fruit[8]. Region one (R1), the area measured with industry-standard Magness-Taylor-type penetrometers, is a fixed 8-mm depth from the outermost region of the apple fruit cortex. Region two (R2), between R1 and the apple core, covers the bulk of edible cortex material[8]. Penetrometer-measured fruit firmness outputs relevant to this work are maximum hardness in R1 (termed M1), and maximum hardness in R2 (termed M2). Henceforth, M1 and M2 are described interchangeably as outer cortex firmness and inner cortex firmness, respectively. Since 2005 and 2009, M1 and M2 measurements, respectively, have been collected, thereby enabling multi-year trend analysis to reveal WABP's selection criteria and progress.
Instrumental measurements have predominantly targeted the outer cortex fruit firmness (i.e., M1), while other metrics remain largely unused. To our knowledge, no literature outside of our breeding program has reported M2 as a measure to describe fruit storability.
Since the WABP's inception in 1994, the program has amassed substantial breeding records, as part of its routine evaluation and selection[2]. The most rigorous data collection occurs in Phase Two (P2), where promising Phase One unreplicated seedlings that were selected/advanced are evaluated on replicated plantings (in a randomized block design) at three sites. Planting of P2 selections is accompanied by planting of commercial cultivars (e.g., Cripps Pink, Gala, Honeycrisp) to provide a baseline reference for how fruit from P2 selections compare. Collectively, these reference/commercial cultivars and P2 selections are known as P2 accessions or simply accessions. A detailed breeding regime of the WABP was previously described[2,9].
Unlike an experimental study with pre-defined design, parameters, and germplasm, a perennial fruit breeding program is in a constant flux of genetic materials. At P2 of the WABP, the germplasm composition changes every year due to the culling of undesirable accessions and the addition of new selections. A strategy to quantify the year-to-year varying compositions of P2 germplasm is average allelic representation (AAR).
Allelic representation describes pedigree relatedness by estimating the proportion of genetic contribution from a progenitor. For example, a seedling from a cross between 'Cripps Pink' and 'Honeycrisp' has 0.5 AAR of each breeding parent. Extending the concept to a germplasm set with various accessions originating from different crosses, the overall proportion of a progenitor's (e.g., 'Honeycrisp') genetic contribution is estimated by averaging the allelic representation (attributed to that one progenitor) over all accessions, hence the term 'average allelic representation'[10]. For example, a germplasm set with ten accessions from 'Cripps Pink' × 'Honeycrisp' and ten accessions from 'Gala' × 'Honeycrisp' has 0.25 AAR of 'Cripps Pink', 0.25 AAR of 'Gala', and 0.50 AAR of 'Honeycrisp'.
This work expands on the previous 15-year trend analysis by Teh et al.[1] but focuses on after-storage retention of fruit firmness among P2 selections in light of AAR contributions from important cultivars/breeding parents. The objectives of this study were to: (1) characterize multi-year trends in after-storage retention of fruit firmness; (2) describe the cultivar representation in P2 germplasm; (3) understand desirable/undesirable contributions of cultivars regarding fruit firmness; and (4) broadly assess the WABP's progress in breeding for improved fruit storability.
-
This investigation is based on assessments of plant material that originated as part of the breeding program's routine operation in making crosses, evaluating seedlings, culling undesirable seedlings, and advancing selections for further testing.
Apples belonging to 160 accessions were harvested from 2005 through 2019. Of these accessions, 125 were Phase Two (P2) selections, while 35 were reference accessions consisting of eight unique cultivars (Braeburn, Co-op 15, Cripps Pink, Fuji, Gala, Golden Delicious, Honeycrisp, and Scifresh) that were planted in different years to coincide with P2 plantings. All accessions were of similar tree ages during fruit harvest and evaluation.
Accessions were grown at three sites in central Washington state, representing the North, Central, and South regions of production. At each orchard/region, there were five replicate trees per accession, planted as randomized blocks. Trees at each site were managed similarly, on M9-type-vigor rootstocks, with crop load management guided by the 'Young Apple Thinning Gauge'[11].
WABP's harvest regime was previously detailed[12,13], and is summarized here for one accession. Given that an accession's optimal harvest timing was unknown, fruits were harvested when a change in background color was observed, and when starch indicators between 3 to 5 of the Cornell 1-8 starch-iodine scale[14], with up to three harvests over three weeks. During each harvest, up to 30 fruits (depending on fruit availability) were sampled.
The first subset of ten fruits was evaluated at-harvest (termed 'at-harvest' [H]). The second subset of ten fruits, termed 'after-storage' (S), was stored in refrigerated cold rooms at 1−2 °C for 2 months. From the 2012 harvest season onwards, stored fruits (i.e., second subset) were subsequently held at room temperature of ~25 °C (for 1 week to simulate 'shelf-life') before fruit quality evaluations.
Fruit firmness measurements
-
While various fruit quality measures were evaluated in the WABP, this study was centered on fruit firmness. From each 10-fruit 'H' or 'S' sample, one subset of five apples was subjected to fruit firmness measurements, while the rest was subjected to sensory assessment. For samples subjected to fruit firmness measurements, one intermediate (i.e., not sun-exposed or shaded) side of each fruit was peeled and analyzed with a penetrometer.
From 2005 to 2008, a TA-TX2 Texture Analyzer (Texture Technologies, Scarsdale, NY, USA) equipped with a standard mechanized Magness-Taylor 11-mm diameter probe was used to measure outer cortex fruit firmness. From 2009 to 2013, fruit firmness was measured using the Mohr™ Digi-Test Model 1 (MDT-1; Mohr and Associates Inc., Richland, WA, USA), a computerized penetrometer with an 11-mm probe[5,12]. From 2014 onwards, the Mohr™ Digi-Test Model 2 (MDT-2) was used to replace MDT-1. Note that no statistical difference was detected in fruit firmness outputs between MDT-1 and MDT-2[12].
Fruit firmness outputs collected were M1 and M2, as described above.
Average allelic representation
-
AARs were estimated for five important reference cultivars, namely Cripps Pink, Fuji, Gala, Golden Delicious, and Honeycrisp. Due to dynamically changing compositions of the breeding germplasm (i.e., selecting, and culling accessions) from year to year, AARs of these cultivars were estimated for each year from 2005 to 2019.
Statistical analysis
-
The 15-year data set of 160 P2 accessions contains a total of 3,186 samples (1,593 'H' and 1,593 'S' samples). Each sample represents a composite of fruit from up to five replicate trees from a P2 accession that were harvested at any one WABP orchard/region on a particular harvest date of a year. Firmness data points (M1 or M2) were averaged trait values from the five fruit samples.
In summary, for one accession for one year at one site, there were typically six data points per trait: 'H' and 'S' trait values at harvest #1, #2, and #3. To reduce the impact of including data from fruit sampled either too early or too late (as starch levels are not always the best indicator for optimum harvest date), the analysis was restricted to include data from only one harvest date for each accession. The choice of data to include was based on the sample of each accession with the highest eating quality score, a 9-point scale described by Evans et al.[5]. If samples from two or three harvests had the same highest score, data from the earlier/earliest harvest was used. This filtering criterion was necessary to: (1) best reflect firmness values at optimal harvest timing; (2) remove uneven representation of accessions with two vs three harvest dates; and (3) discard samples that were harvested too early or late.
All calculations, analyses, and plots were carried out in R version 4.0.3[15] using RStudio version 1.4.1103[16]. As described above, the data set was split between 'at-harvest' and 'after-storage' (1,593 samples each). Within each data subset, it was further split between selections (1,031 samples from 125 unique selections) and reference cultivars (562 samples from 35 references). Annual averages and standard errors for M1 and M2 were calculated and visualized to describe trends from 2005 to 2019. Trend analyses and figures were generated using ggplot2 package version 3.3.3[17]. All figures were compiled and rendered in Adobe Illustrator CS2 (Adobe, San Jose, CA).
-
Phenotypic distribution of M1 'at-harvest' ('H') samples was generally consistent across years (Fig. 1). Most M1 'H' values were in the range of 16−22 lbs. Higher variance was observed in 2012−2014 and 2017, while lower variance was observed in 2007−2009. In all years, M1 values of 'after storage' ('S') samples were lower than those of 'H' samples, as expected. Most M1 'S' values were in the range of 14−22 lbs. In general, the variance or data spread of 'H' samples was also reflected in 'S' samples. Median differences between 'H' and 'S' samples were more significant in earlier years (2005−2008) than later (2018−2019).
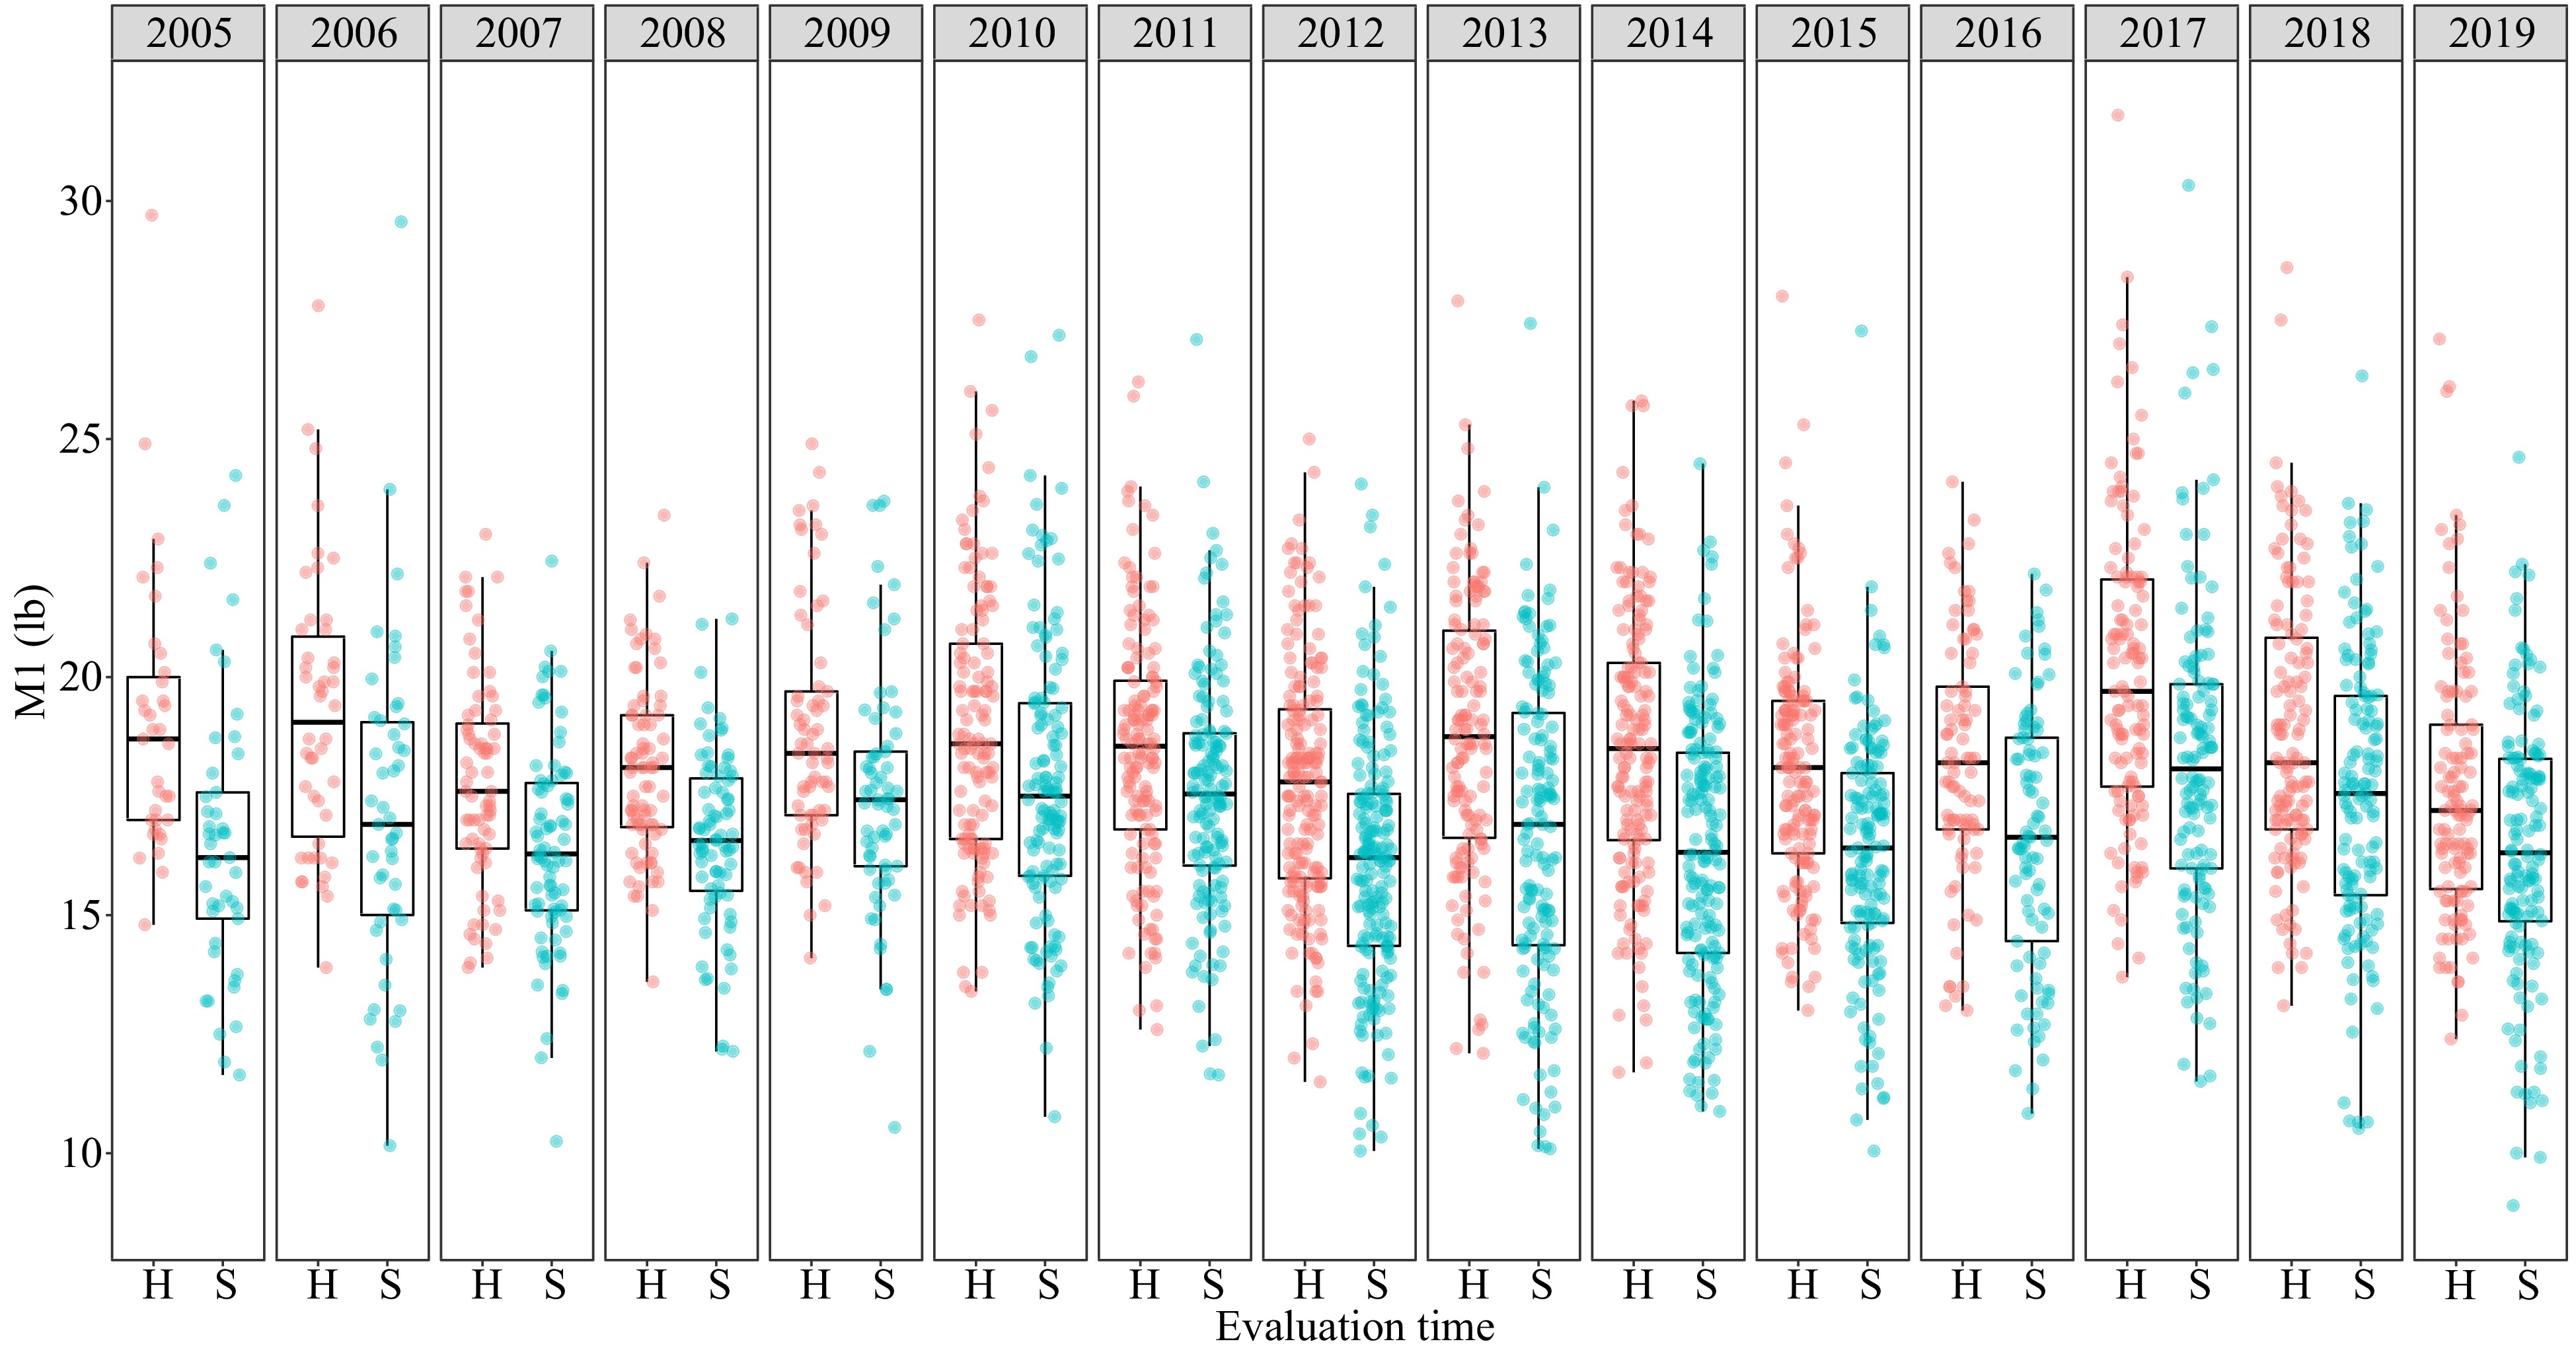
Figure 1.
Boxplots and data distribution of outer cortex fruit firmness (M1 – maximum hardness at region one) for 'H' – at harvest (i.e., before storage) and 'S' – after storage (i.e., after 2-month cold storage) apple samples of Phase Two accessions from 2005 to 2019.
Phenotypic distribution of M2
-
Phenotypic distribution of M2 'H' samples was somewhat consistent across years, except in 2017−2018 (Fig. 2). Most M2 'H' values were in the range 24−31 lbs. Similar to the M1 data set, all M2 'S' values were lower than M2 'H' values, as expected. Median differences between 'H' and 'S' samples were significantly greater in 2012 onwards, compared to prior (i.e., 2009−2011), likely due to the week at room temperature added after cold storage to the WABP protocol from 2012 onwards.
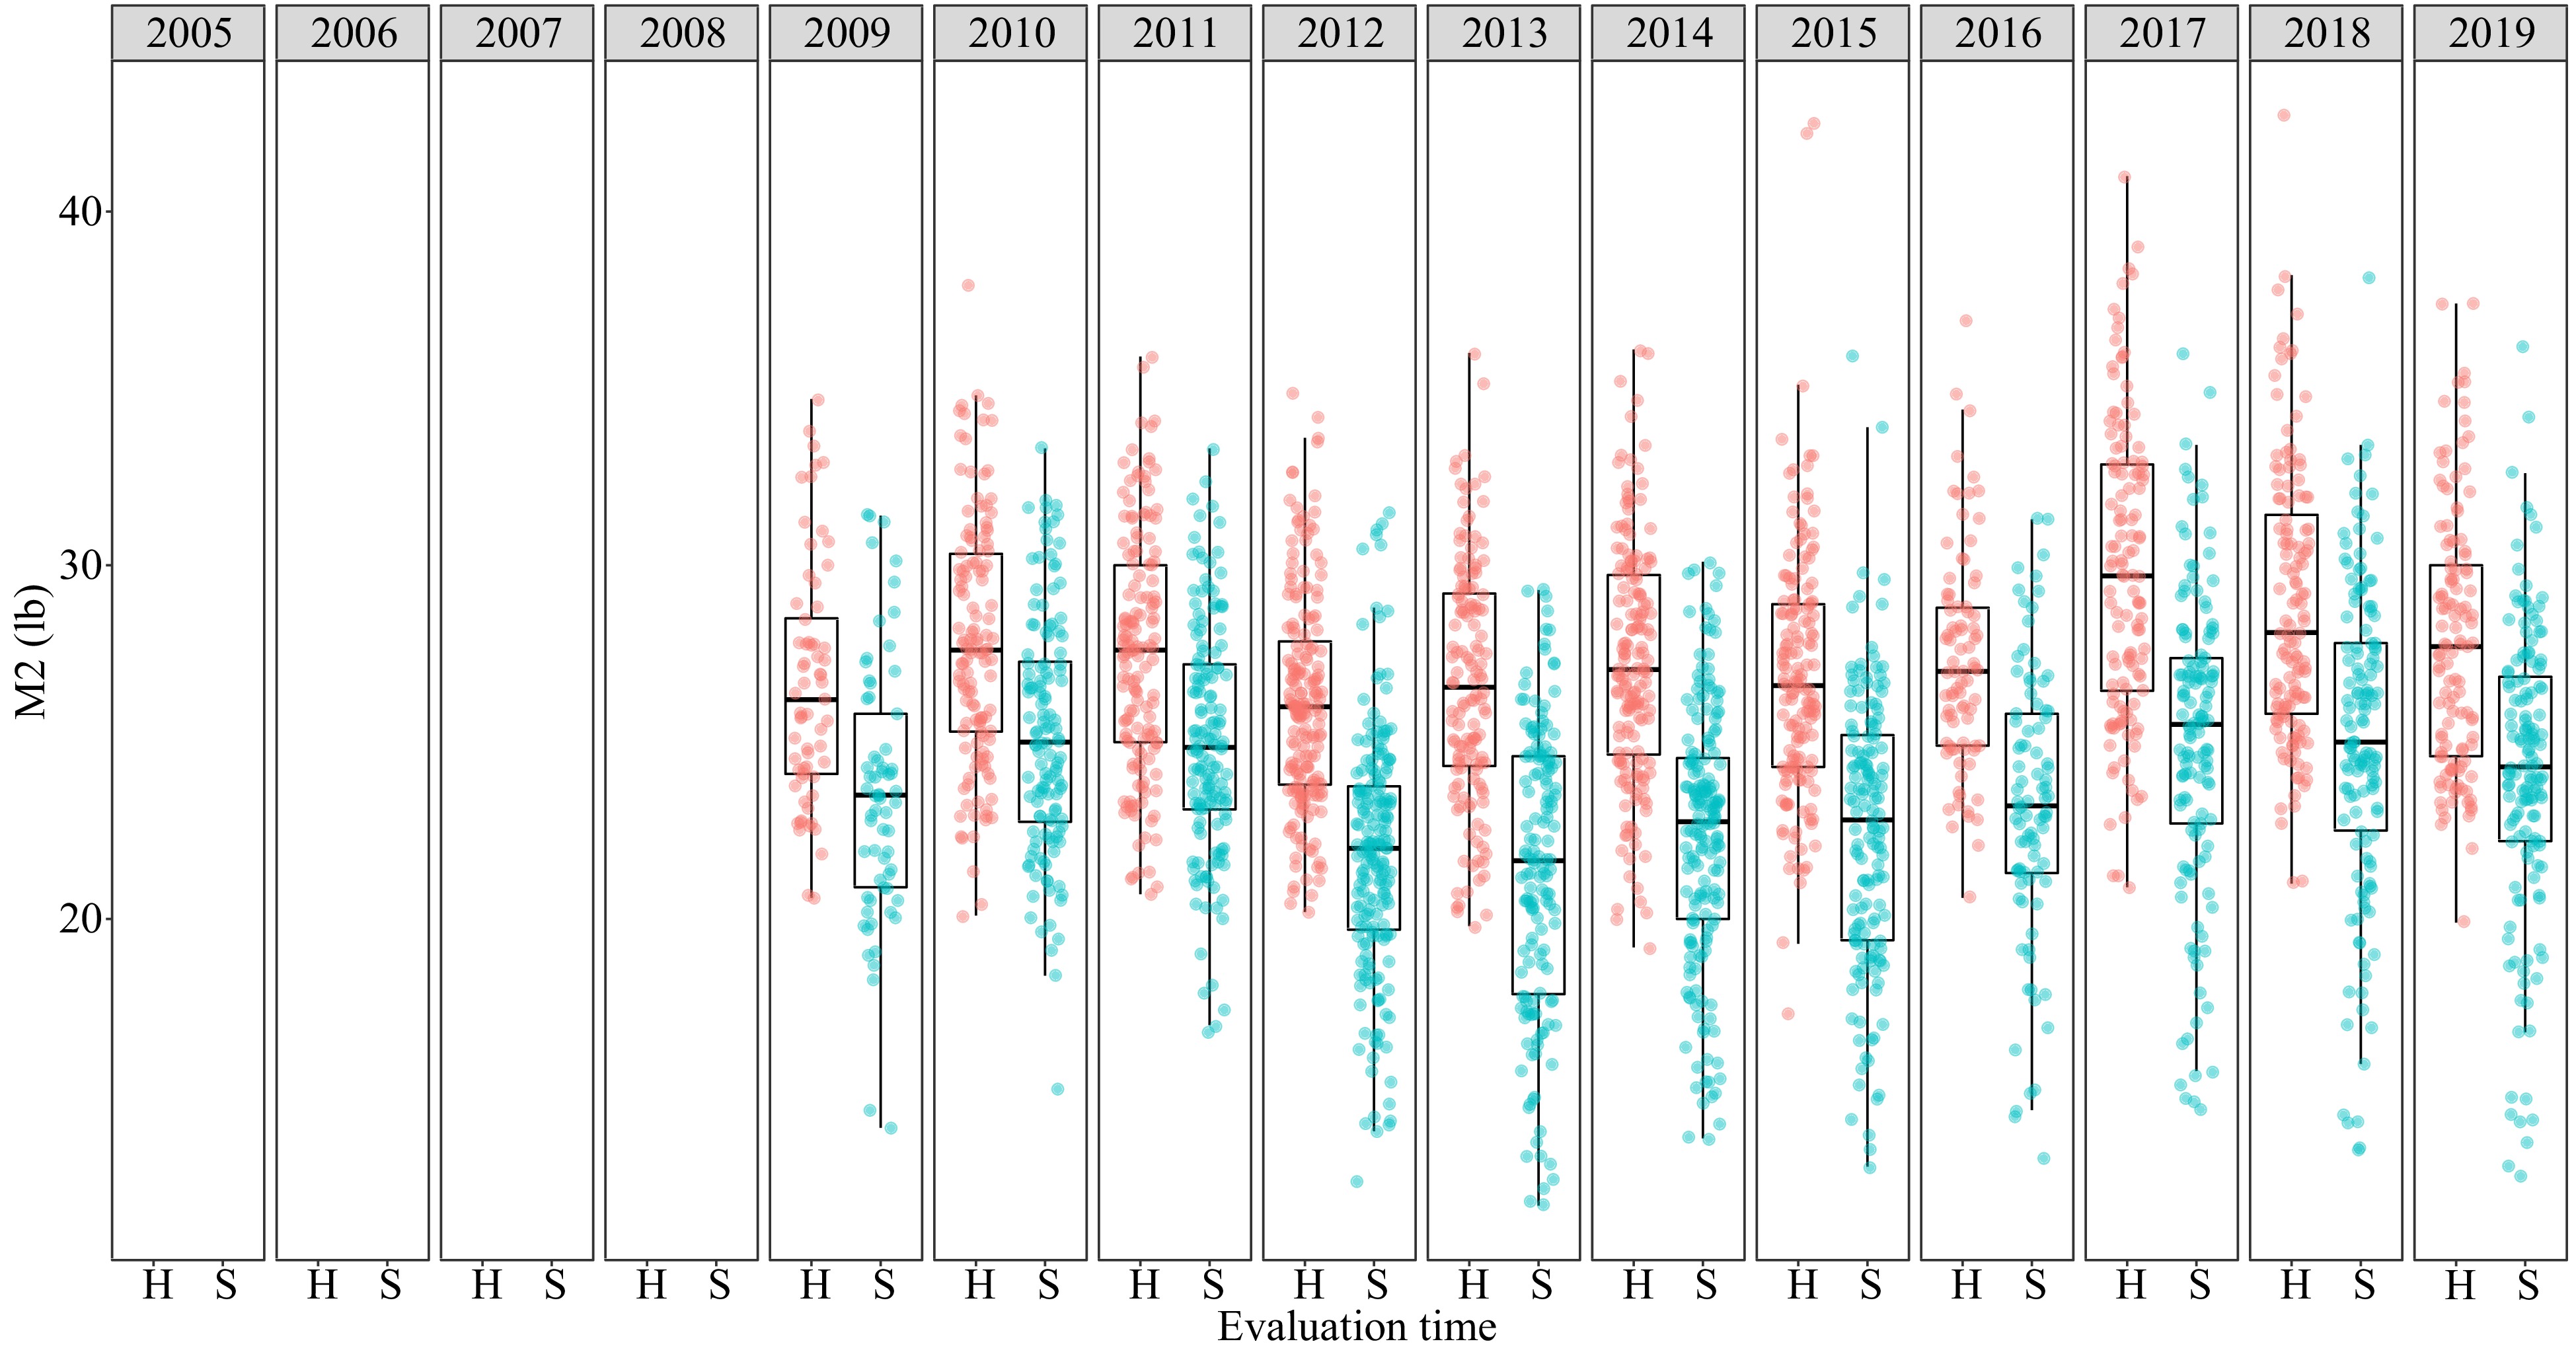
Figure 2.
Boxplots and data distribution of inner cortex fruit firmness (M2 – maximum hardness at region two) for 'H' – at harvest (i.e., before storage) and 'S' – after storage (i.e., after 2-month cold storage‡) apple samples of Phase Two accessions from 2009 to 2019. ‡ After storage ('S') also included 7 d at room temperature following 2 months of cold storage from 2012 onwards. M2 measurements started in 2009 with the acquisition of the MDT penetrometer.
After-storage retention of M1
-
In general, M1 values were highest for 'H' selections, followed by 'H' cultivars, then 'S' selections, and finally 'S' cultivars (Fig. 3). The relationship between all four trendlines was reasonably consistent over the years, with marginally higher year-to-year fluctuations among selections. Overall variance or standard errors of cultivars were higher than those of selections.
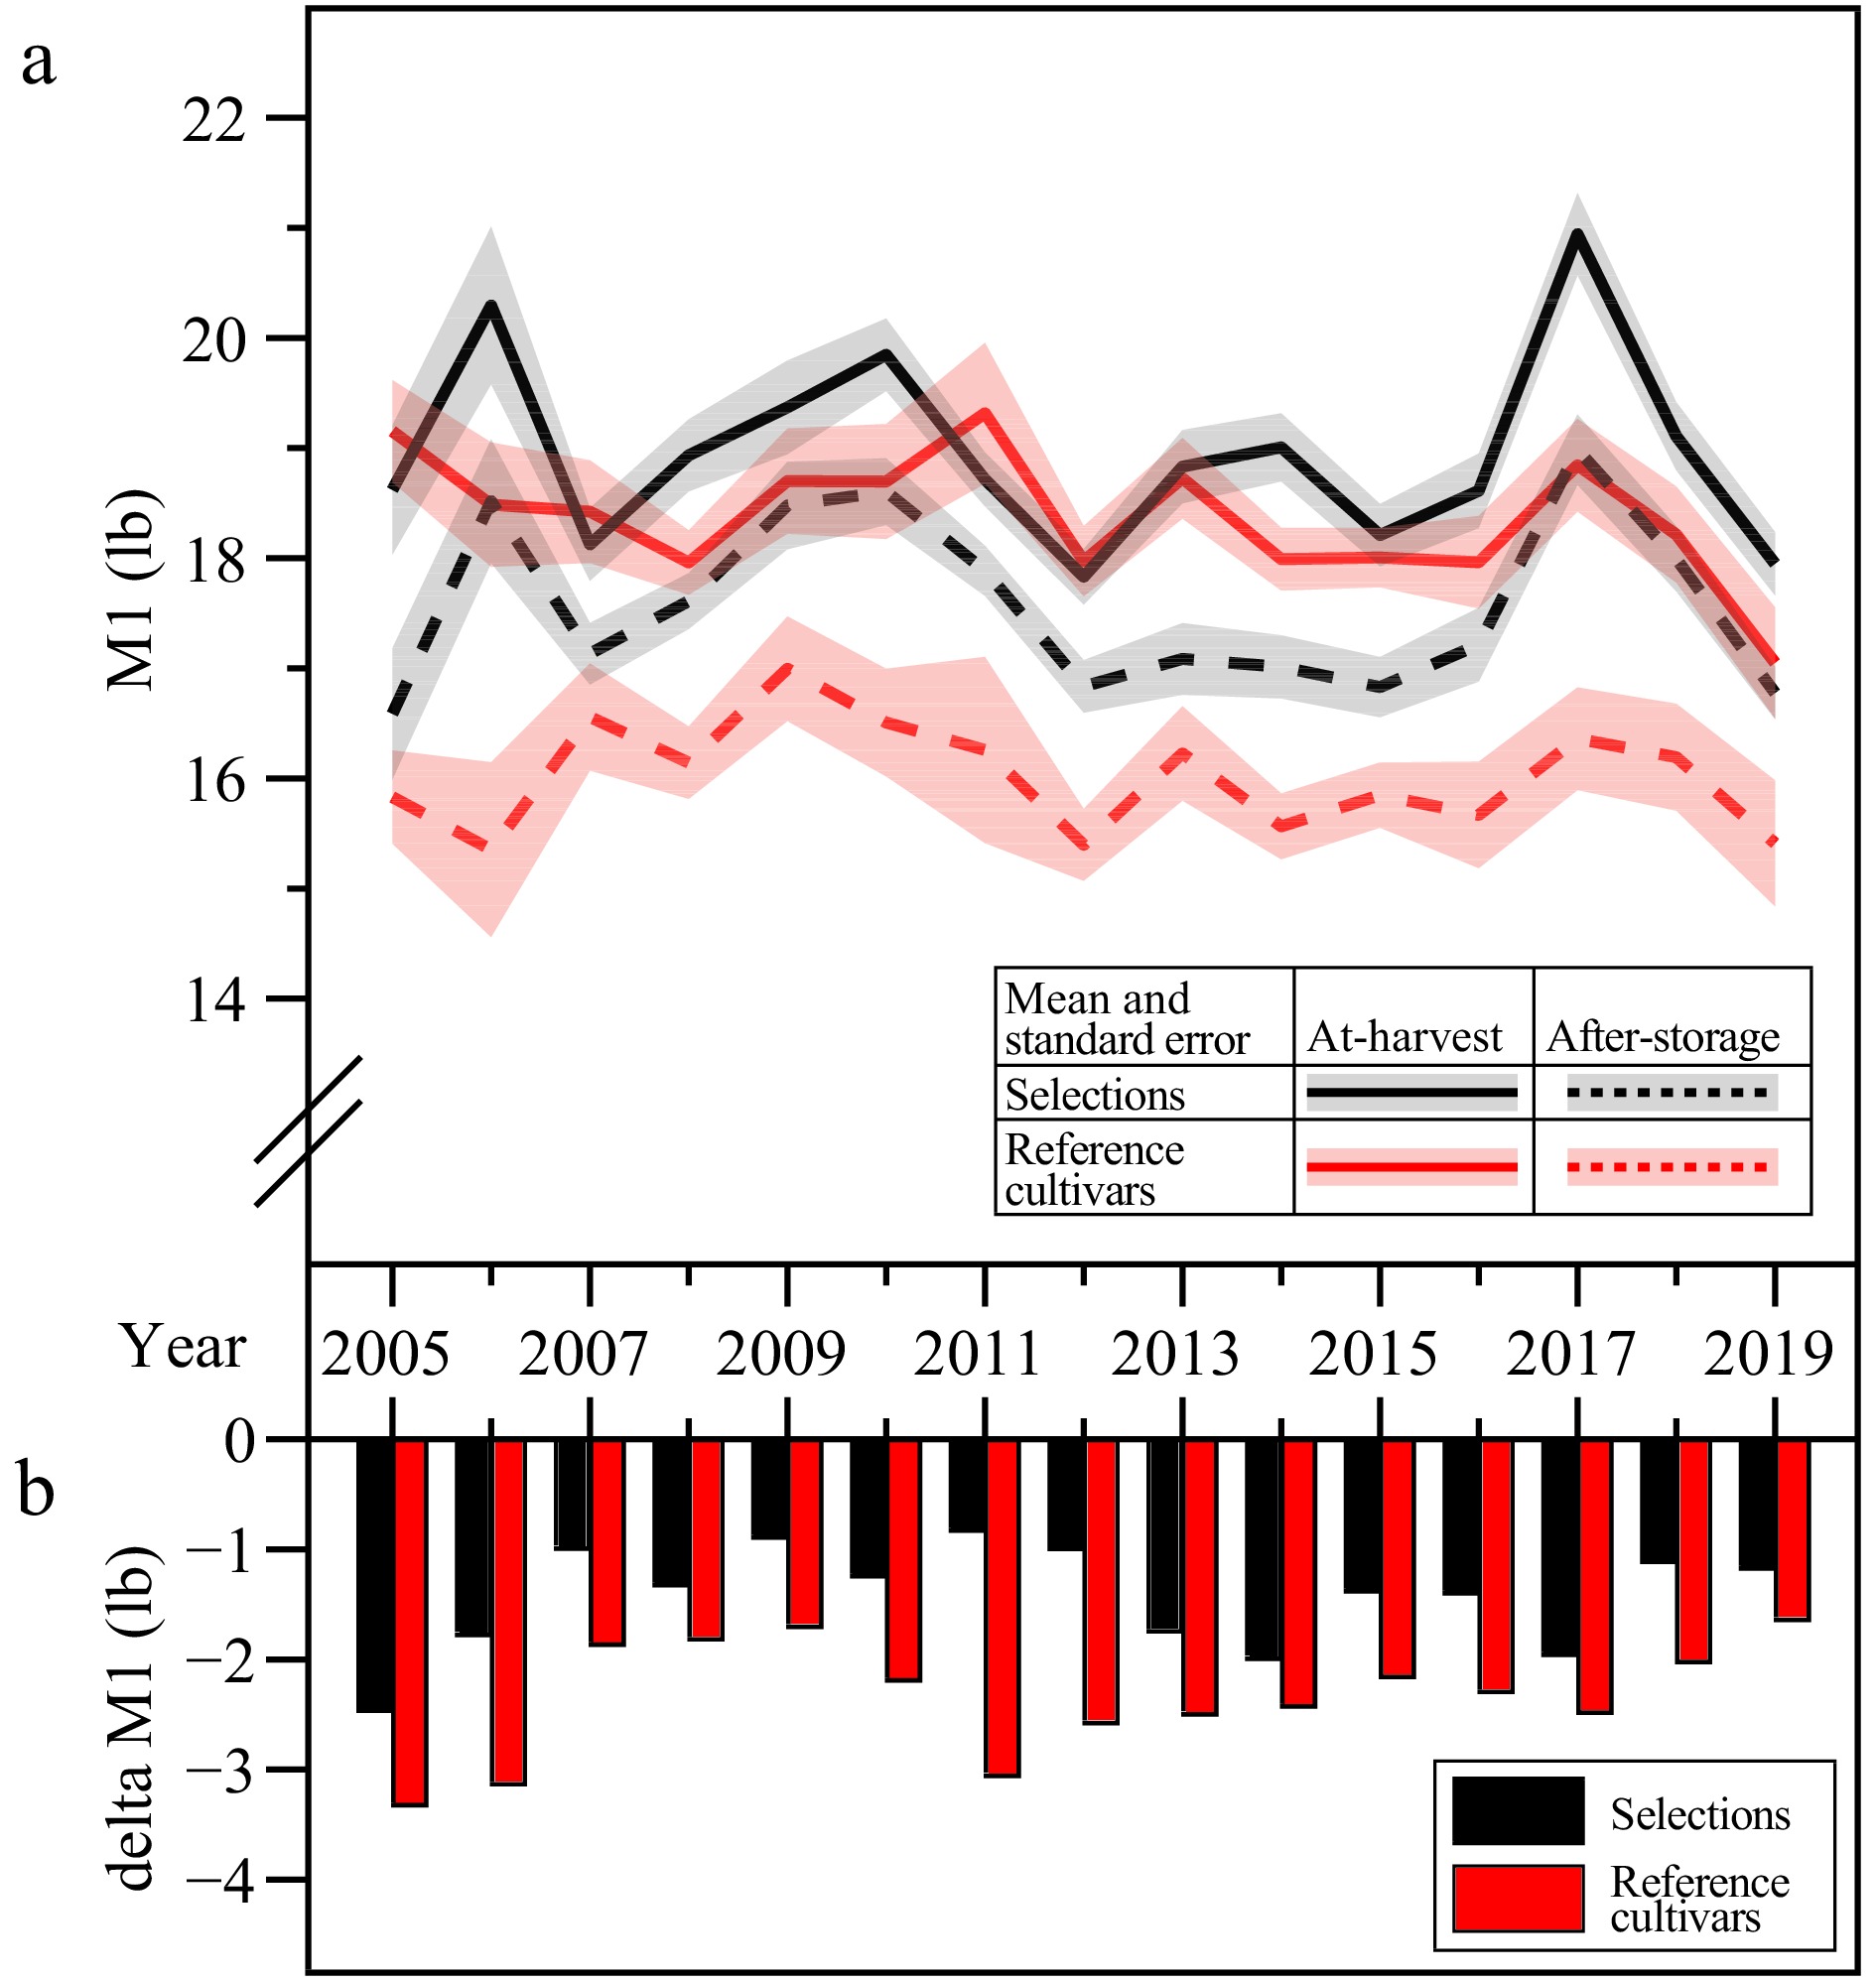
Figure 3.
Trends of outer cortex fruit firmness (M1 – maximum hardness at region one) at-harvest ('H') and after-storage ('S') from 2005 to 2019. (a) Means as lines and standard errors as shades, of selections in black and reference cultivars in red, where 'H' samples were shown as continuous lines and 'S' samples as dotted lines. (b) Deltas or differentials between harvest and after-storage M1 of selections (black)/cultivars (red) was calculated by subtracting 'H' M1 from 'S' M1.
'H' M1 values of selections and cultivars were quite similar at 18−20 lbs, but 'S' M1 values were significantly different between these groups, with selections ranging between 17−19 lbs, while cultivars ranged between 15−17 lbs. Year-to-year M1 after-storage retention showed that cultivars exhibited higher delta/loss compared to selections in each of the 15 years (Fig. 3b). Selections delta M1 was never more than −2.5 lbs, while cultivars delta M1 ranged between −3.3 and −1.7 lbs. The largest difference in delta M1 between selections and cultivars was in 2011, which was approximately 2 lbs.
After-storage retention of M2
-
Similar to M1 trends, M2 values were highest for 'H' selections, followed by 'H' cultivars, then 'S' selections, and finally 'S' cultivars (Fig. 4). Once again, the relationship between all four trendlines was reasonably consistent over the years, with marginally higher year-to-year fluctuations among selections. Once again, the overall variance or standard errors of cultivars were higher than those of selections.
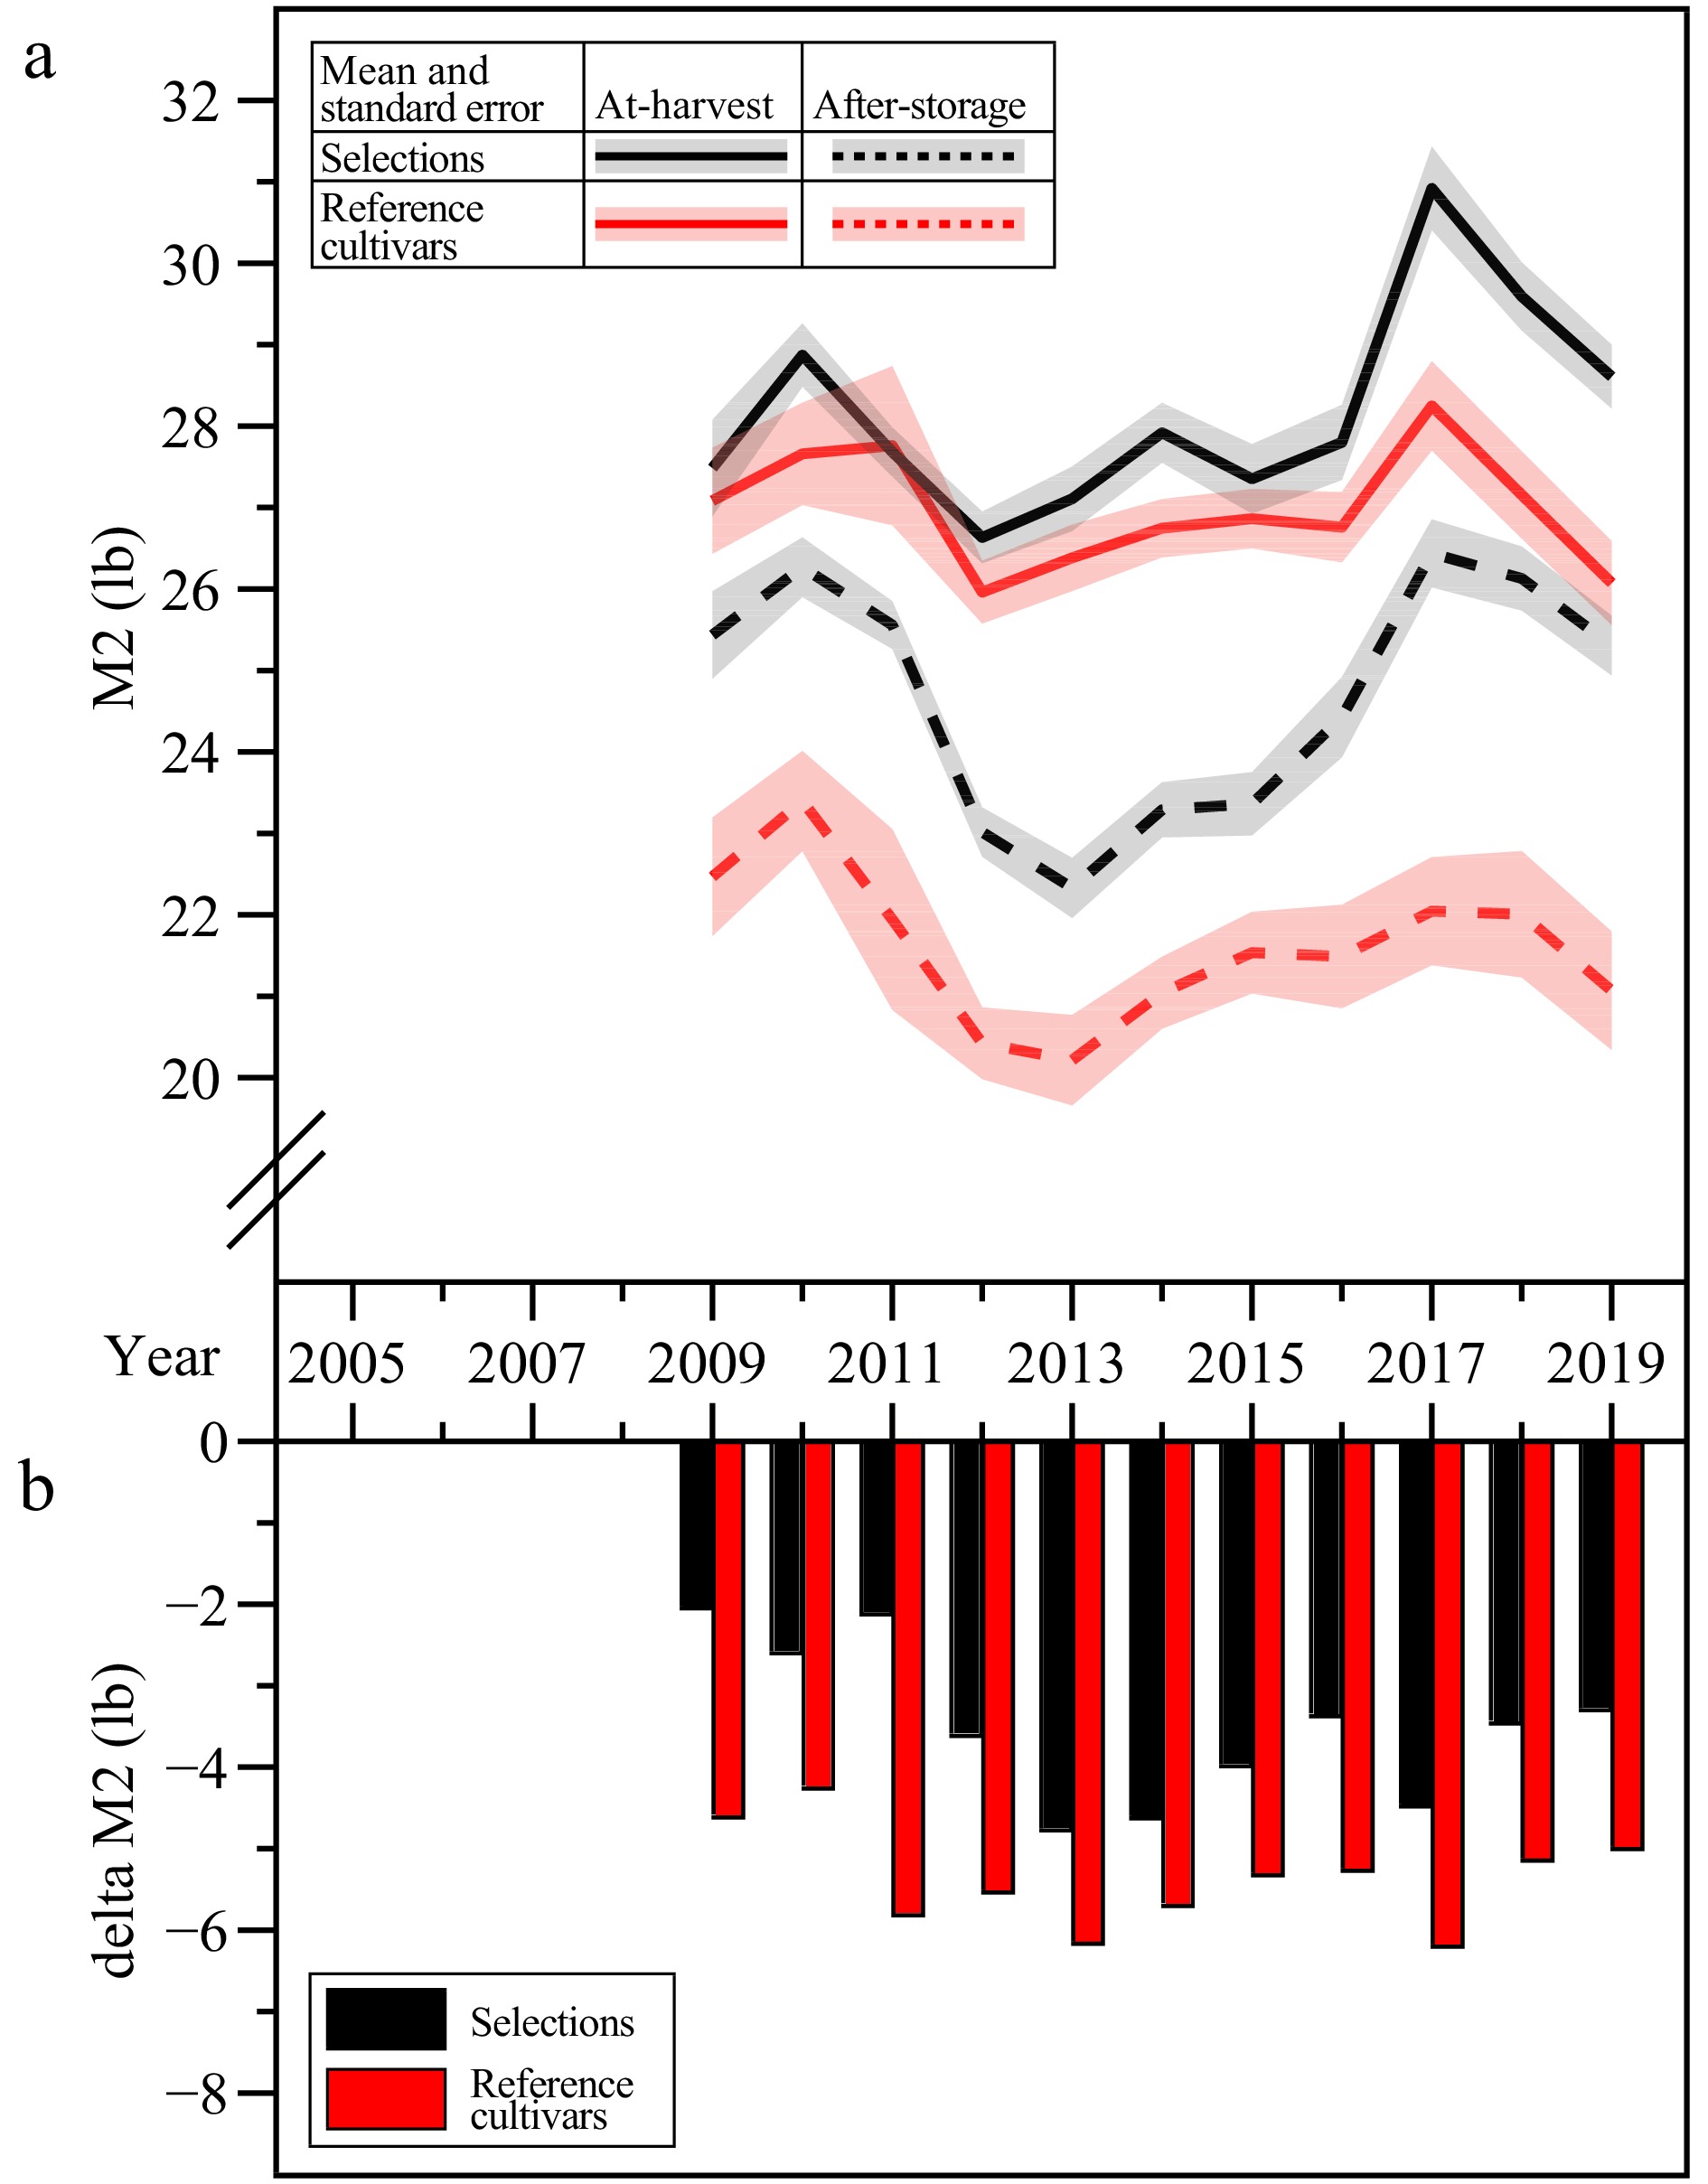
Figure 4.
Trends of inner cortex fruit firmness (M2 – maximum hardness at region two) at-harvest ('H') and after-storage ('S') from 2005 to 2019. (a) Means as lines and standard errors as shades, of selections in black and reference cultivars in red, where 'H' samples were shown as continuous lines and 'S' samples as dotted lines. (b) Deltas or differentials between at-harvest and after-storage M2 of selections (black)/cultivars (red) was calculated by subtracting 'H' M2 from 'S' M2.
'H' M2 values of selections (ranged 27−30 lbs) and cultivars (26−28 lbs) were relatively close, but 'S' M2 values were significantly different between these groups, with selections ranging between 23−26 lbs, while cultivars ranged between 20−23 lbs. Year-to-year M2 after-storage retention showed that cultivars exhibited higher delta/loss compared to selections in each of the 11 years (Fig. 4b). Selections delta M2 was never more than −4.5 lbs, while cultivars delta M2 was as high as −6 lbs (with the lowest at −4.3 lbs). The largest difference in delta M2 between selections and cultivars was in 2011, which was approximately 4 lbs.
Representation of reference cultivars
-
A total of eight cultivars were planted as reference accessions from 2005 to 2019 (Table 1). While there were generally five cultivars represented in most years, the compositions varied over time. 'Braeburn' was grown and evaluated from 2005 to 2013 but was subsequently excluded from evaluation from 2014 onwards. Since 2014, the five reference cultivars have been Cripps Pink, Fuji, Gala, Golden Delicious, and Honeycrisp. The number of samples evaluated per reference cultivar also increased over time (1−3 samples pre-2012 vs 3−5 samples post-2012).
Table 1. Number of five-fruit samples evaluated for each reference cultivar from 2005 to 2019.
2005 2006 2007 2008 2009 2010 2011 2012 2013 2014 2015 2016 2017 2018 2019 Braeburn 1 1 1 1 1 1 1 1 1 − − − − − − Co-op 15 1 1 − − − − − − − − − − − − − Cripps Pink 1 − 2 2 2 3 2 5 6 5 5 3 3 4 3 Fuji 1 1 2 2 2 3 1 5 6 5 5 3 4 4 3 Gala 1 2 3 3 3 4 5 6 7 5 5 2 2 2 2 Golden Delicious − 1 1 1 1 2 2 4 5 6 6 3 3 3 3 Honeycrisp − − − − − 1 1 3 4 5 5 3 3 3 4 Scifresh − − − 1 1 1 − − − − − − − − − Note the changing compositions of reference cultivars over time. Average allelic representations of five cultivars in Phase Two germplasm
-
The highest and most consistent AAR among the P2 selections was from 'Golden Delicious' ranging from 0.3 to 0.4 AAR (Fig. 5c). Meanwhile, 'Fuji' showed the least representation, with 0.0 AAR from 2008 onwards. 'Gala' was consistently represented at a moderate level of 0.2 AAR. Representation of 'Cripps Pink' initially declined from 2005 to 2006, but steadily increased over time to a high of 0.25 AAR in 2016. 'Honeycrisp' exhibited the sharpest increase in representation, from a low 0.1 AAR in 2005 to 0.375 AAR in 2018.
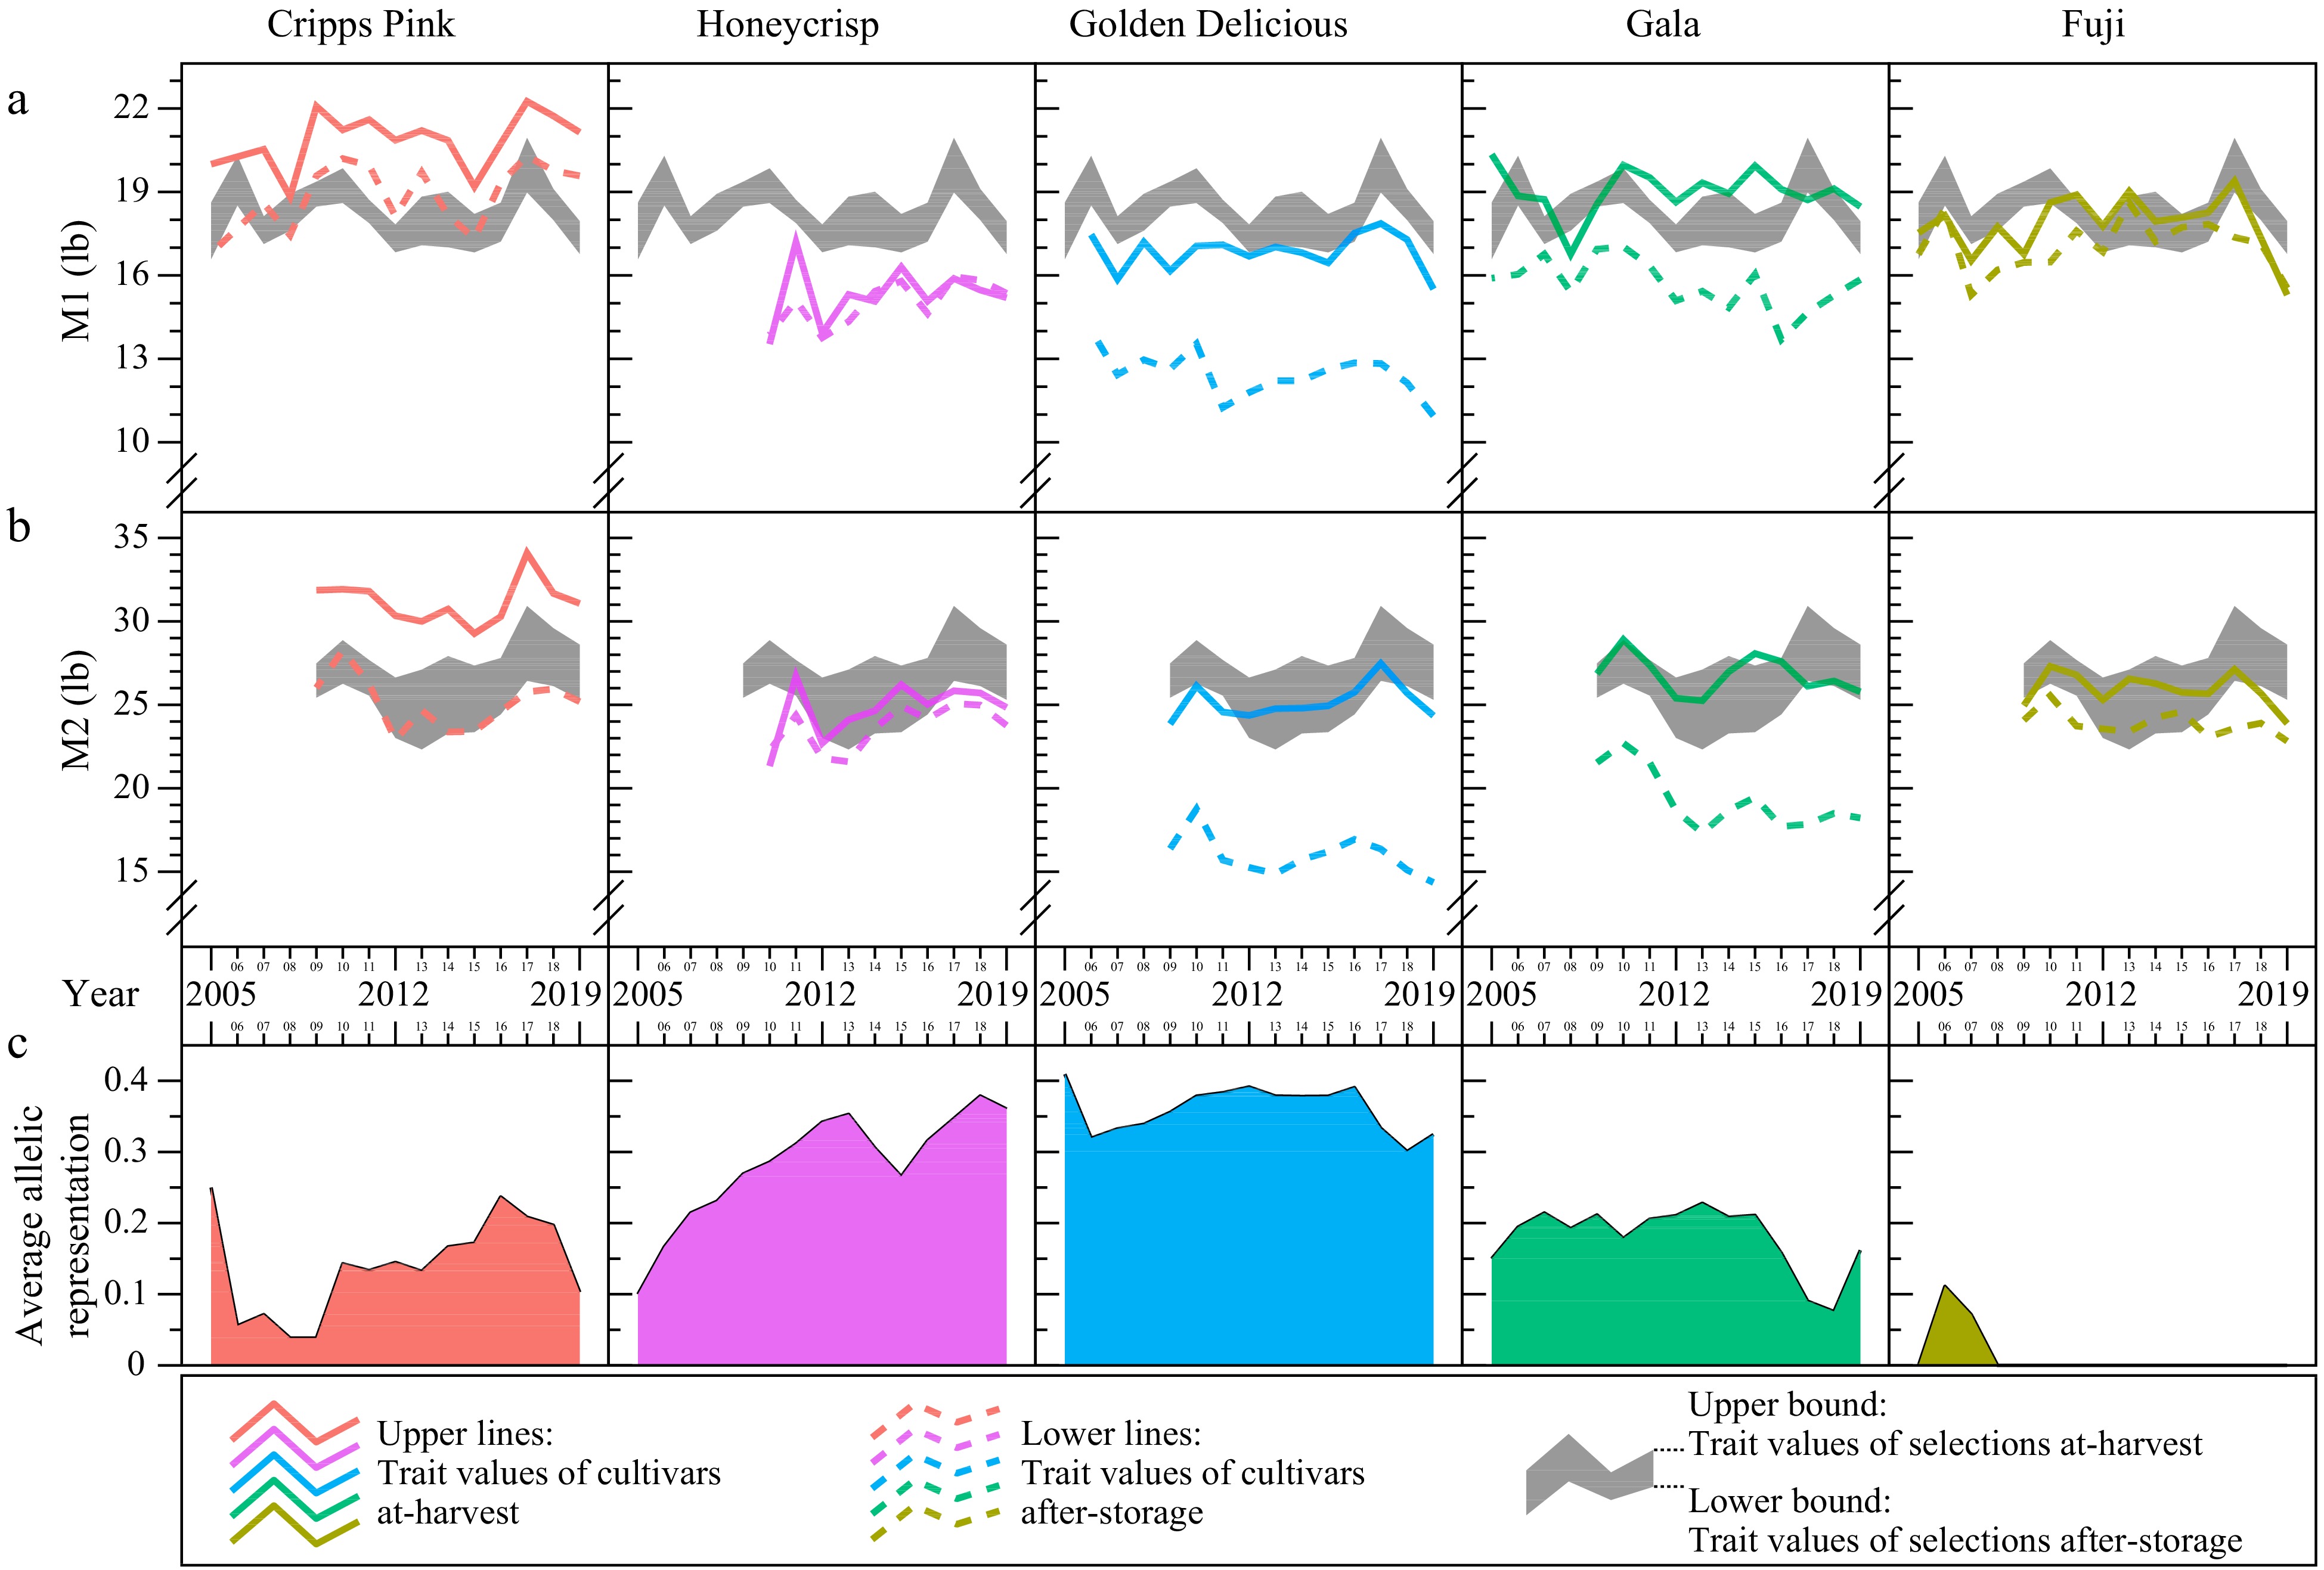
Figure 5.
Trends of outer cortex fruit firmness (M1 – maximum hardness at region one) and inner cortex fruit firmness (M2 – maximum hardness at region two) at-harvest ('H') and after-storage ('S') of Phase Two (P2) selections and individual reference cultivars from 2005 to 2019. (a) Shaded regions are M1 values for selections, (b) shaded regions are M2 values for selections, where the upper bound is selections averaged 'H' M1, while the lower bound is selections averaged 'S' M1. Colored lines correspond to individual reference cultivar's M1 (continuous – 'H'; dotted – 'S'). (c) Average allelic representations of five cultivars among P2 selections.
Firmness characteristics of five reference cultivars
-
Instrumental firmness values (i.e., M1 and M2) were collected for each of the five reference cultivars (Fig. 5a & b). Among them, 'Cripps Pink' had the highest M1 values both at-harvest and after storage (Fig. 5a). 'Fuji' and 'Gala' had comparable at-harvest M1 values, but the former retained M1 better over storage. 'Golden Delicious' and 'Honeycrisp' showed comparable at-harvest M1 values. While 'Honeycrisp' retained almost the same firmness values after storage, 'Golden Delicious' exhibited the largest decline in M1 values after storage.
Among the five cultivars, Cripps Pink had the highest at-harvest M2 values (30−33 lbs), while the other four had similar values of 24−27 lbs (Fig. 5b). 'Honeycrisp' was best at retaining M2 after storage, with values almost identical to at-harvest. On the other hand, 'Golden Delicious' showed the largest decline in M2 values of approximately 10 lbs, at-harvest versus after-storage.
Influence of cultivars' allelic representations on selections' firmness characteristics
-
M1 values of selections across the 15 years are most similar to those of 'Gala' and 'Fuji', less than 'Cripps Pink', and higher every year than those of 'Honeycrisp' and 'Golden Delicious' (Fig. 5a). There are clear year-to-year fluctuations, however an increase in selections' M1 values from 2015 to 2017 was also reflected by a similar increase in 'Cripps Pink' M1; this also aligns with an increased AAR of 'Cripps Pink'. Retention of M1 among P2 selections was generally better than retention of the individual cultivars except 'Fuji' and 'Honeycrisp', which showed almost no drop in M1 firmness after storage apart from in 2011.
The selections' M2 trend almost perfectly mirrored that of 'Cripps Pink', except for the M2 retention among selections which was better (Fig. 5b). As with M1, selections' M2 values also increased from 2015 to 2017 in line with the increased AAR of 'Cripps Pink'. When comparing after-storage M2 retention between selections and individual cultivars, selections performed better than 'Golden Delicious', 'Gala', and 'Cripps Pink', but worse than 'Honeycrisp' and 'Fuji'.
-
This work summarizes selection progress and trends in fruit firmness (outer and inner cortices) based on 2005−2019 breeding records from the WABP's routine operations at Phase Two. As a sequel to the previous work by Teh et al.[1], this investigation: (1) focuses on fruit firmness; (2) evaluates firmness retention by comparing at-harvest and after-storage measurements; and (3) sheds light on parental cultivar representation in the background of P2 selections.
Despite year-to-year weather and environmental differences, at-harvest M1 and M2 measurements were reasonably consistent throughout the 15 years, as most data points fell in the ranges of 16−22 lbs and 24−31 lbs, respectively (Figs 1, 2). The corresponding after-storage firmness values were also relatively consistent and were lower than at-harvest values. It is worth noting that declines in inner cortex firmness were more pronounced than outer cortex firmness, as fruit soften from the inside out.
Higher retention of outer cortex fruit firmness among selections
-
Outer cortex fruit firmness is important for the initial sensory experience of biting into an apple, and likely plays a role in storability. Our previous work showed that after-storage fruit M1 values of selections were higher than those of reference cultivars[1]. However, it was unclear whether: (1) fruit of selections started with higher levels of M1 at harvest; (2) fruit of selections were better at retaining outer cortex firmness through storage; or (3) a combination of both.
In this study, the fruit of selections consistently exhibited higher outer cortex firmness – not only at harvest but also after storage (they were better able to retain firmness through storage) – when compared to the fruit of cultivars (Fig. 3). In 2011, the substantial difference in delta M1 (between selections and cultivars) was likely due to the overrepresentation of poorly performing cultivars among the reference cultivar samples that resulted in poor M1 retention in comparison to the selections, rather than being truly reflective of superior M1 retention among selections. Seven out of 12 samples (58%) were 'Gala' and 'Golden Delicious', which are moderately poor and extremely poor in M1 retention, respectively (Fig. 5; Table 1).
Higher variances/standard errors among reference cultivars were expected, as cultivars had different profiles of at-harvest firmness and retention capacity. For instance, 'Cripps Pink' apples are firm and retain the outer firmness through storage quite well, while 'Golden Delicious' apples are low in outer firmness and lose even more firmness during storage (Fig. 5a). Among the five cultivars profiled, 'Honeycrisp' apples exhibited the lowest at-harvest M1 but retained almost all the initial firmness through storage.
Higher retention of inner cortex fruit firmness among selections
-
The most important indicator for fruit storability in the WABP is M2 or inner cortex fruit firmness[1], as softening during storage occurs from the core outwards[18]. A trend showing slight increases in after-storage M2 among selections was observed from 2009 to 2019[1]. However, the same question for M1 can be posed for M2: Did the fruit of selections begin with higher levels of M2 at harvest, or were they better at retaining M2 through storage, or a combination of both?
Similarly, the fruit of selections consistently showed higher inner cortex firmness – not only at-harvest, but also after storage (they were better able to retain firmness through storage) – when compared to the fruit of cultivars (Fig. 4). With the exceptions of 'Cripps Pink' and 'Gala', most reference cultivars had lower at-harvest M2 values than selections' after-storage M2 (Figs 4, 5b).
It is worth noting that loss in inner cortex firmness (or delta M2) among selections and reference cultivars was typically higher in 2012−2019 than in prior years. This coincided with the change in after-storage WABP protocols in 2012. Before 2012, fruit were evaluated after 2 months of cold storage at 1−2 °C. Since 2012, fruit were kept for a week at ~25 °C after cold storage before evaluating for fruit quality[12]. This after-storage protocol change was to better reflect fruit conditions for consumers.
Is high fruit firmness at harvest due to increased representation of 'Cripps Pink'?
-
AAR, a measure of pedigree relatedness, indicates the proportion of genetic contribution coming from a progenitor. A high AAR of a cultivar suggests that the cultivar is utilized more frequently as a parent in crossing, likely due to intentional introgression or enrichment of certain desirable alleles.
We could speculate based on 'Cripps Pink's high firmness profile, its increasing AAR over time has been important in providing firmness alleles to P2 selections' (Fig. 5). While this cultivar is firm in both outer and inner cortices, the inner cortex firmness was probably the main reason (texture-related) for its incorporation in the breeding program. This aligns well with one of the three WABP's objectives in breeding for improved fruit storability. It is worth noting that the inner cortex firmness was lost to a greater extent in 'Cripps Pink' than among an average P2 selection. However, the greater firmness loss (or lack of firmness retention) was compensated by 'Cripps Pink's very high level of at-harvest inner cortex firmness.
Among the five cultivars, another contributor of high-fruit firmness is 'Gala', which at-harvest exhibited comparable levels of outer and inner cortex firmness as P2 selections average firmness (Fig. 5). With a consistent AAR level of 0.20, 'Gala' has been an important breeding parent and a useful reference cultivar, especially given its lead market share by production volume[19].
Does the increased representation of 'Honeycrisp' improve after-storage firmness retention?
-
Widely regarded as an ultra-crisp apple, 'Honeycrisp' has been an important breeding parent due to its contribution of crispness alleles. 'Honeycrisp' is not a firm apple; its at-harvest M1 trend was even lower than the average M1 trend of P2 selections after-storage, while its at-harvest M2 trend was only comparable to P2 selections after-storage average M2 trend.
Perhaps, one of the most surprising trend discoveries was that 'Honeycrisp' was excellent in retaining fruit firmness – both outer and inner cortices. With 'Honeycrisp's increasing AAR (from 0.10 to 0.40) in the P2 germplasm, and its importance as a breeding parent, it was likely that 'Honeycrisp' contributed not only to increase crispness, but also to improve firmness retention capacity.
Would reduced representation of 'Golden Delicious' improve after-storage firmness retention?
-
Among the five main cultivars, 'Golden Delicious' was the most prevalent progenitor in the P2 germplasm, with AAR ranging from 0.30 and 0.40 across all 15 years (Fig. 5). While known for its desirable flavor characteristics, 'Golden Delicious' is not a firm apple, exhibiting the lowest M1 and M2 values at-harvest. Compared to the other four reference cultivars, 'Golden Delicious' fruit had the worst retention of outer and inner cortex firmness after storage – typically 5 and 10 lbs losses, respectively.
If 'Golden Delicious' was not as significantly represented in the genetic background of P2 germplasm, a better after-storage firmness retention might be exhibited among the P2 selections. Executing such adjustment may be impractical, given that 'Golden Delicious' is most ubiquitously represented, not only among commercial apple cultivars but also in the USA apple crop germplasm set[20]. Two of our other reference cultivars, 'Cripps Pink' and 'Gala' are direct offspring from 'Golden Delicious', meaning that any resultant seedlings from either of the two varieties will have 0.25 AAR of 'Golden Delicious'. Nonetheless, it is worth noting that 'Cripps Pink' and 'Gala' have better firmness profiles (at-harvest or after-storage) than their parent 'Golden Delicious'.
Limitations
-
As a sequel to our previous trend analysis, this investigation contains similar limitations as those reported in Teh et al.[1]. Instead of an experimental design, this work relied on collection, curation, and analysis of historical breeding records. Given the perenniality of apple, trees remains in research orchards for multiple years of evaluation, where environmental conditions, management practices, crop load, and fruit/tree quality could vary, not only from year to year but also across tree ages. These constraints existed despite the WABP's best efforts in standardizing crop load management, harvest regime, and other horticultural practices.
Fruit data from three locations were combined in the analysis, which could be a shortcoming due to the three geographically distinct sites. However, our previous analysis showed similar year-to-year trends across the three sites[1]. Combining site data enabled a higher statistical power in quantifying after-storage firmness retention.
Another limitation stemmed from a protocol adjustment in 2012 (i.e., adding a week of fruit storage at ~25 °C after cold storage), which was necessitated by the WABP's desire to mimic fruit conditions for the consumer when conducting quality evaluations. As mentioned above, this protocol change resulted in a noticeable decrease in firmness retention from 2012 onwards.
Another potential limitation was the uneven (and slightly changing) composition of reference cultivars (Table 1). In most years, only five of the eight cultivars were used as references. 'Braeburn', 'Co-op 15', and 'Scifresh' were retired and replaced with cultivars that were more representative of the current Washington state apples, such as 'Honeycrisp' (included since 2010).
Despite all the limitations described, this investigation is not an attempt to prove causation, but rather a trend analysis to highlight progress in fruit firmness retention among P2 selections from 2005 to 2019.
-
This work describes the WABP's progress and trends in fruit firmness (and retention) of Phase Two selections from 2005 to 2019. Capturing both at-harvest and after-storage firmness enabled firmness retention capacity through storage to be estimated. Splitting the data set between P2 selections and reference cultivars provided a baseline comparison of how the fruit of selections fared with respect to the fruit of cultivars. In addition, the use of average allelic representation to describe the representation of major cultivars in the P2 germplasm sheds light on breeding parents' contributions toward firmness improvement (e.g., firmness from 'Cripps Pink', and firmness retention from 'Honeycrisp'). In summary, this 15-year trend analysis showed that the WABP has been selected for increased fruit firmness (particularly of the inner cortex), and retention of inner cortex firmness among the P2 selections. This breeding progress also aligns with one of the three WABP's overarching objectives – improved fruit storability.
-
The authors confirm contribution to the paper as follows: study conception and design: Teh SL, Evans K; breeding program management: Evans K, Barritt B; data collection: Evans K, Barritt B, Brutcher L, Schonberg B; statistical analyses and writing the manuscript: Teh SL; providing insights on postharvest fruit quality: Torres CA. All authors reviewed the results and approved the final version of the manuscript.
-
The datasets generated during and/or analyzed during the current study are not publicly available due potential intellectual property conflicts in plant patenting but are available from the corresponding author on reasonable request.
The authors express gratitude to active and former/retired members of the pome fruit breeding program for their invaluable contributions in managing the breeding program, maintaining trees, harvesting fruit, and collecting data. This work was supported by the USDA National Institute of Food and Agriculture Hatch project 1014919.
-
The authors declare that they have no conflict of interest.
- Copyright: © 2024 by the author(s). Published by Maximum Academic Press, Fayetteville, GA. This article is an open access article distributed under Creative Commons Attribution License (CC BY 4.0), visit https://creativecommons.org/licenses/by/4.0/.
-
About this article
Cite this article
Teh SL, Brutcher L, Schonberg B, Torres CA, Barritt B, et al. 2024. Multi-year trends of retention of fruit firmness after storage and influence of cultivar representation among apple breeding selections. Fruit Research 4: e025 doi: 10.48130/frures-0024-0020 

Multi-year trends of retention of fruit firmness after storage and influence of cultivar representation among apple breeding selections
- Received: 21 February 2024
- Revised: 16 April 2024
- Accepted: 06 May 2024
- Published online: 02 July 2024
Abstract: Retention of fruit firmness, as an important component of fruit quality during cold storage, is one of three primary targets of Washington State University's apple breeding program. Fruit firmness is phenotyped with a penetrometer to obtain firmness measurements of outer and inner fruit cortices. Since the breeding program's inception in 1994, substantial records of fruit firmness from Phase Two selections have been amassed, as part of its routine breeding evaluation. From 2005 to 2019, firmness data from at-harvest and after-storage samples were analyzed to describe 15-year trends in fruit firmness (and its postharvest retention) of the selections. Genetic backgrounds of selections were estimated using average allelic representation to describe pedigree relatedness of selections to cultivars and to quantify the potential influence of cultivar representation on the selections' firmness traits. Results showed that the breeding program has been selecting for increased fruit firmness and retention capacity postharvest (especially inner cortex) of the selections. The selections' increased inner cortex firmness coincided with increasing average allelic representation of 'Cripps Pink', suggesting the cultivar's influence in firmness at harvest and firmness retention during storage. 'Honeycrisp', another important breeding parent (as noted from the increasing average allelic representation from 0.10 to 0.40) has likely positively impacted firmness retention in the selections. In summary, the 15-year trend analysis highlighted the influence of important cultivars, such as Cripps Pink, Gala, and Honeycrisp, in fruit firmness and/or firmness retention of breeding program Phase Two selections.
-
Key words:
- Cortex /
- Cripps Pink /
- Honeycrisp /
- Malus domestica /
- Storability