


-
Most of the grapevine cultivars used for the production of wine, table grape, and dried fruit production originate from Vitis vinifera, an Eurasian grape species known for its exceptional aroma and flavour characteristics[1,2]. However, V. vinifera is susceptible to various diseases. Grape production regions around the world, particularly those with warm and humid climates during the growing season, face severe challenges posed by downy mildew, a destructive fungal infection. Grapevine downy mildew, caused by the obligate biotrophic pathogen Plasmopara viticola (Berk. & MA Curtis.) Berl. & De Toni., is classified as an oomycete[3]. Plasmopara viticola predominantly infects vulnerable plant parts such as leaves, tender shoots, tendrils, young fruits, and inflorescence. Severe infections can lead to wilting of the vines and, in extreme cases, to death of the vines, resulting in a substantial reduction in crop yield[4].
Fungicides are commonly used to control P. viticola[5]. However, their extensive usage can lead to the development of pathogen resistance. Overreliance on fungicides not only escalates costs but also contributes to environmental contamination and human health risks[6,7]. Developing P. viticola-resistant grape varieties through traditional cross-breeding methods prove to be time-consuming, expensive, and prone to subjective selection based on experiential knowledge, resulting in reduced accuracy. Marker-assisted selection (MAS), known for its efficiency and precision, offers a more environmentally friendly and healthier alternative to screening hybrid progenies during the seedling stage. Furthermore, MAS facilitates the pyramiding breeding of multiple resistant germplasms to generate new cultivars exhibiting durable resistance[8].
Most of the quantitative trait loci (QTLs) for P. viticola previously reported came from different varieties, such as Muscadinia rotundifolia[9], V. amurensis[10,11], and V. riparia[12,13]. Although most of these grape varieties have good resistance to P. viticola, their quality for table food and wine making is much inferior to that of cultivar species. It is difficult to obtain ideal grape cultivars by breeding from these varieties. It is most effective to select resistant cultivars common cultivars of good quality for breeding.
In this study, two widely grown table grapes of excellent quality were used. The P. viticola-resistant grapevine cultivar, 'Moldova' (Vitis interspecific crossing, with V. rupestris background), was selected as the female parent and crossed with the susceptible cultivar 'Shine Muscat' (Vitis interspecific crossing). A total of 246 progenies exhibiting different phenotypes along with the parental lines were subjected to GBTS sequencing. Subsequently, a high-density genetic map was constructed and QTL mapping was performed using this population. To validate the QTL mapping results, a genome-wide association study (GWAS) was conducted. As a result, a P. viticola resistance QTL, designated as Rpv34, was identified on chromosome 18, and the candidate genes associated with this QTL were preliminarily screened. This research contributes to a deeper understanding of the mechanisms underlying P. viticola resistance in grapevines and facilitates the utilization of resistant germplasm in breeding.
-
A total of 248 individual vines were used in this research, including the 'Moldova' (Vitis interspecific crossing, with V. rupestris background), 'Shine Muscat' (Vitis interspecific crossing), and 246 progenies obtained from the cross of them. The parents were 7-year-old vines and the progenies were 3-year-old vines. All the vines are planted in the vineyard of the Changli Fruit Research Institute of the Hebei Academy of Agriculture and Forestry Sciences (119.17° E, 39.72° N).
DNA extraction
-
Genomic DNA was extracted from young grapevine leaves using the CTAB extraction method, following the protocol described by Qu et al.[14]. The quality of the extracted DNA was evaluated by electrophoresis on a 1% agarose gel, alongside a λ-DNA ladder, while the DNA concentration was determined using a NanoDrop 2000 spectrophotometer (Thermo Fisher Scientific, Waltham, MA, USA).
Target location selection for GBTS and hybridization probe design
-
The target sites were selected based on the Illumina 20K Chip and previous GBS sequencing data[10,15,16]. A total of 20,597 sites were chosen according to the following criteria: minor allele frequency (MAF) > 0.1, missing data < 5%, and even distribution throughout the genome. For each target site, a 110-bp probe encompassing the specific location was designed using GenoBaits Designer software (MolBreeding Biotechnology Co., Ltd., Shijiazhuang city, Hebei province, China).
Library construction, probe hybridization and sequencing
-
The GBTS library construction and probe hybridization procedures were performed following the protocol described by Guo et al.[17]. In summary, library construction involved four steps: 1) ultrasonic fragmentation of DNA; 2) end-repair and A-tailing of the fragmented DNA; 3) ligation of adapters containing barcode sequences to the A-tailed fragments; and 4) PCR amplification of the library. Subsequently, probe hybridization was performed, which included steps such as library mixture preparation, library hybridization, target capture, library amplification, purification, and library quality control. These processes were automated using various instruments to save both labor and time.
The quality of the enriched libraries was assessed using a Qubit 2.0 Fluorometer (Thermo Fisher Scientific, CA, USA). Samples that passed quality control were loaded into the flow cell and sequenced using PE150 sequencing mode on the MGISEQ-2000 platform (MGI, Shenzhen, China). The term 'mSNPs' was used to refer to multiple SNPs developed from a single amplicon, which included the target SNP and its adjacent regions. To maximize the utilization of sequencing data, the presence of mSNPs was detected in each amplicon according to the method described in the study by Guo et al.[17].
Evaluation of P. viticola resistance
-
To assess the P. viticola resistance of the 246 progenies and the parents, 16 leaf discs with a diameter of 1 cm were collected from the fourth and fifth fully expanded leaves of each individual. The leaf discs were then subjected to P. viticola inoculation, following the method described by Fu et al.[10]. Subsequently, the inoculated leaf discs were incubated at 21 °C with a 12-h photoperiod and maintained at humidity levels of up to 80%. The resistance of P. viticola was evaluated based on parameters such as sporulation density (SPD), the International Organisation of Vine and Wine P. viticola resistance descriptor OIV452-1 (OIV), and the percentage of leaf disc area producing sporangiophores (LDAYS). All levels were scored 1−9, with 1 being the least resistant and 9 the most resistant. The isolate of P. viticola for evaluation was isolated from the vineyard of Changli Fruit Research Institute. All evaluations were conducted in 2022.
Map construction and QTL mapping
-
The construction of the genetic map involved the utilization of heterozygous mSNPs. Only mSNPs with an integrity score exceeding 0.9 were selected for further analysis. To simplify computational complexity, markers originating from the same chromosome were consolidated into groups. Linked markers were identified by applying a LOD score threshold of 6, while markers that significantly disrupted the order of linkage groups were excluded. Individuals exhibiting a high frequency of missing genotypes were excluded using the 'Individual genot. freq.' function, and markers displaying segregation distortion beyond the threshold (p < 0.05) or abnormal segregation ratios were discarded utilizing the 'Locus genot. freq.' function. Additionally, markers exhibiting a similarity score of 1 were eliminated through the 'Similarity of loci' function. The marker order was determined using the 'Regression mapping' function, and the distance between markers was calculated using the Kosambi function. Lastly, the genetic map was visualized using MapChart software.
The QTL mapping was performed using the software MapQTL 6.0 software. Phenotypic (.qua), map (.map), and loci (.loc) files were imported into the software. Interval mapping (IM) was performed with a step size of 0.5 cM to identify potential loci. The cofactor was selected based on the marker closest to the position with the highest LOD value. Multiple QTL mapping (MQM) was used to accurately calculate the loci detected by IM in combination with the cofactor, using a step size of 0.5 cM. The LOD threshold (α = 0.05) was determined through 1,000 permutation tests.
GWAS analysis
-
The GWAS was conducted using GAPIT (version 3)[18]. The BLINK (Bayesian-information and Linkage-disequilibrium Iteratively Nested Keyway), MLM (Mixed Linear Model), GLM (Generalized Linear Model), and FarmCPU (Fixed and random model Circulating Probability Unification) algorithm were used for testing. The effectiveness of the GWAS algorithm was assessed by analyzing quantile-quantile (QQ) plots.
-
The average score for the female parent 'Moldova' was 6.34 in a variety of phenotypic assessment methods, which appeared to have resistance to P. viticola. The average score of the male parent 'Shine Muscat' was 3.05, which was more sensitive to P. viticola (Supplemental Fig. S1).
The resistance of the progenies exhibited continuous variation and followed a quantitative trait distribution (Fig. 1). In the six independent phenotype assessments across three evaluation methods, scores ranged consistently from 3 to 7. In the SPD method, most of the phenotypes were distributed between 4 and 6. In the two evaluations using the OIV method, most phenotypes were distributed between 5 and 7, slightly higher than in SPD. Regarding the LDAYS methods, individual scores were more scattered, with the highest frequency occurring between 4 and 5 in both repetitions.
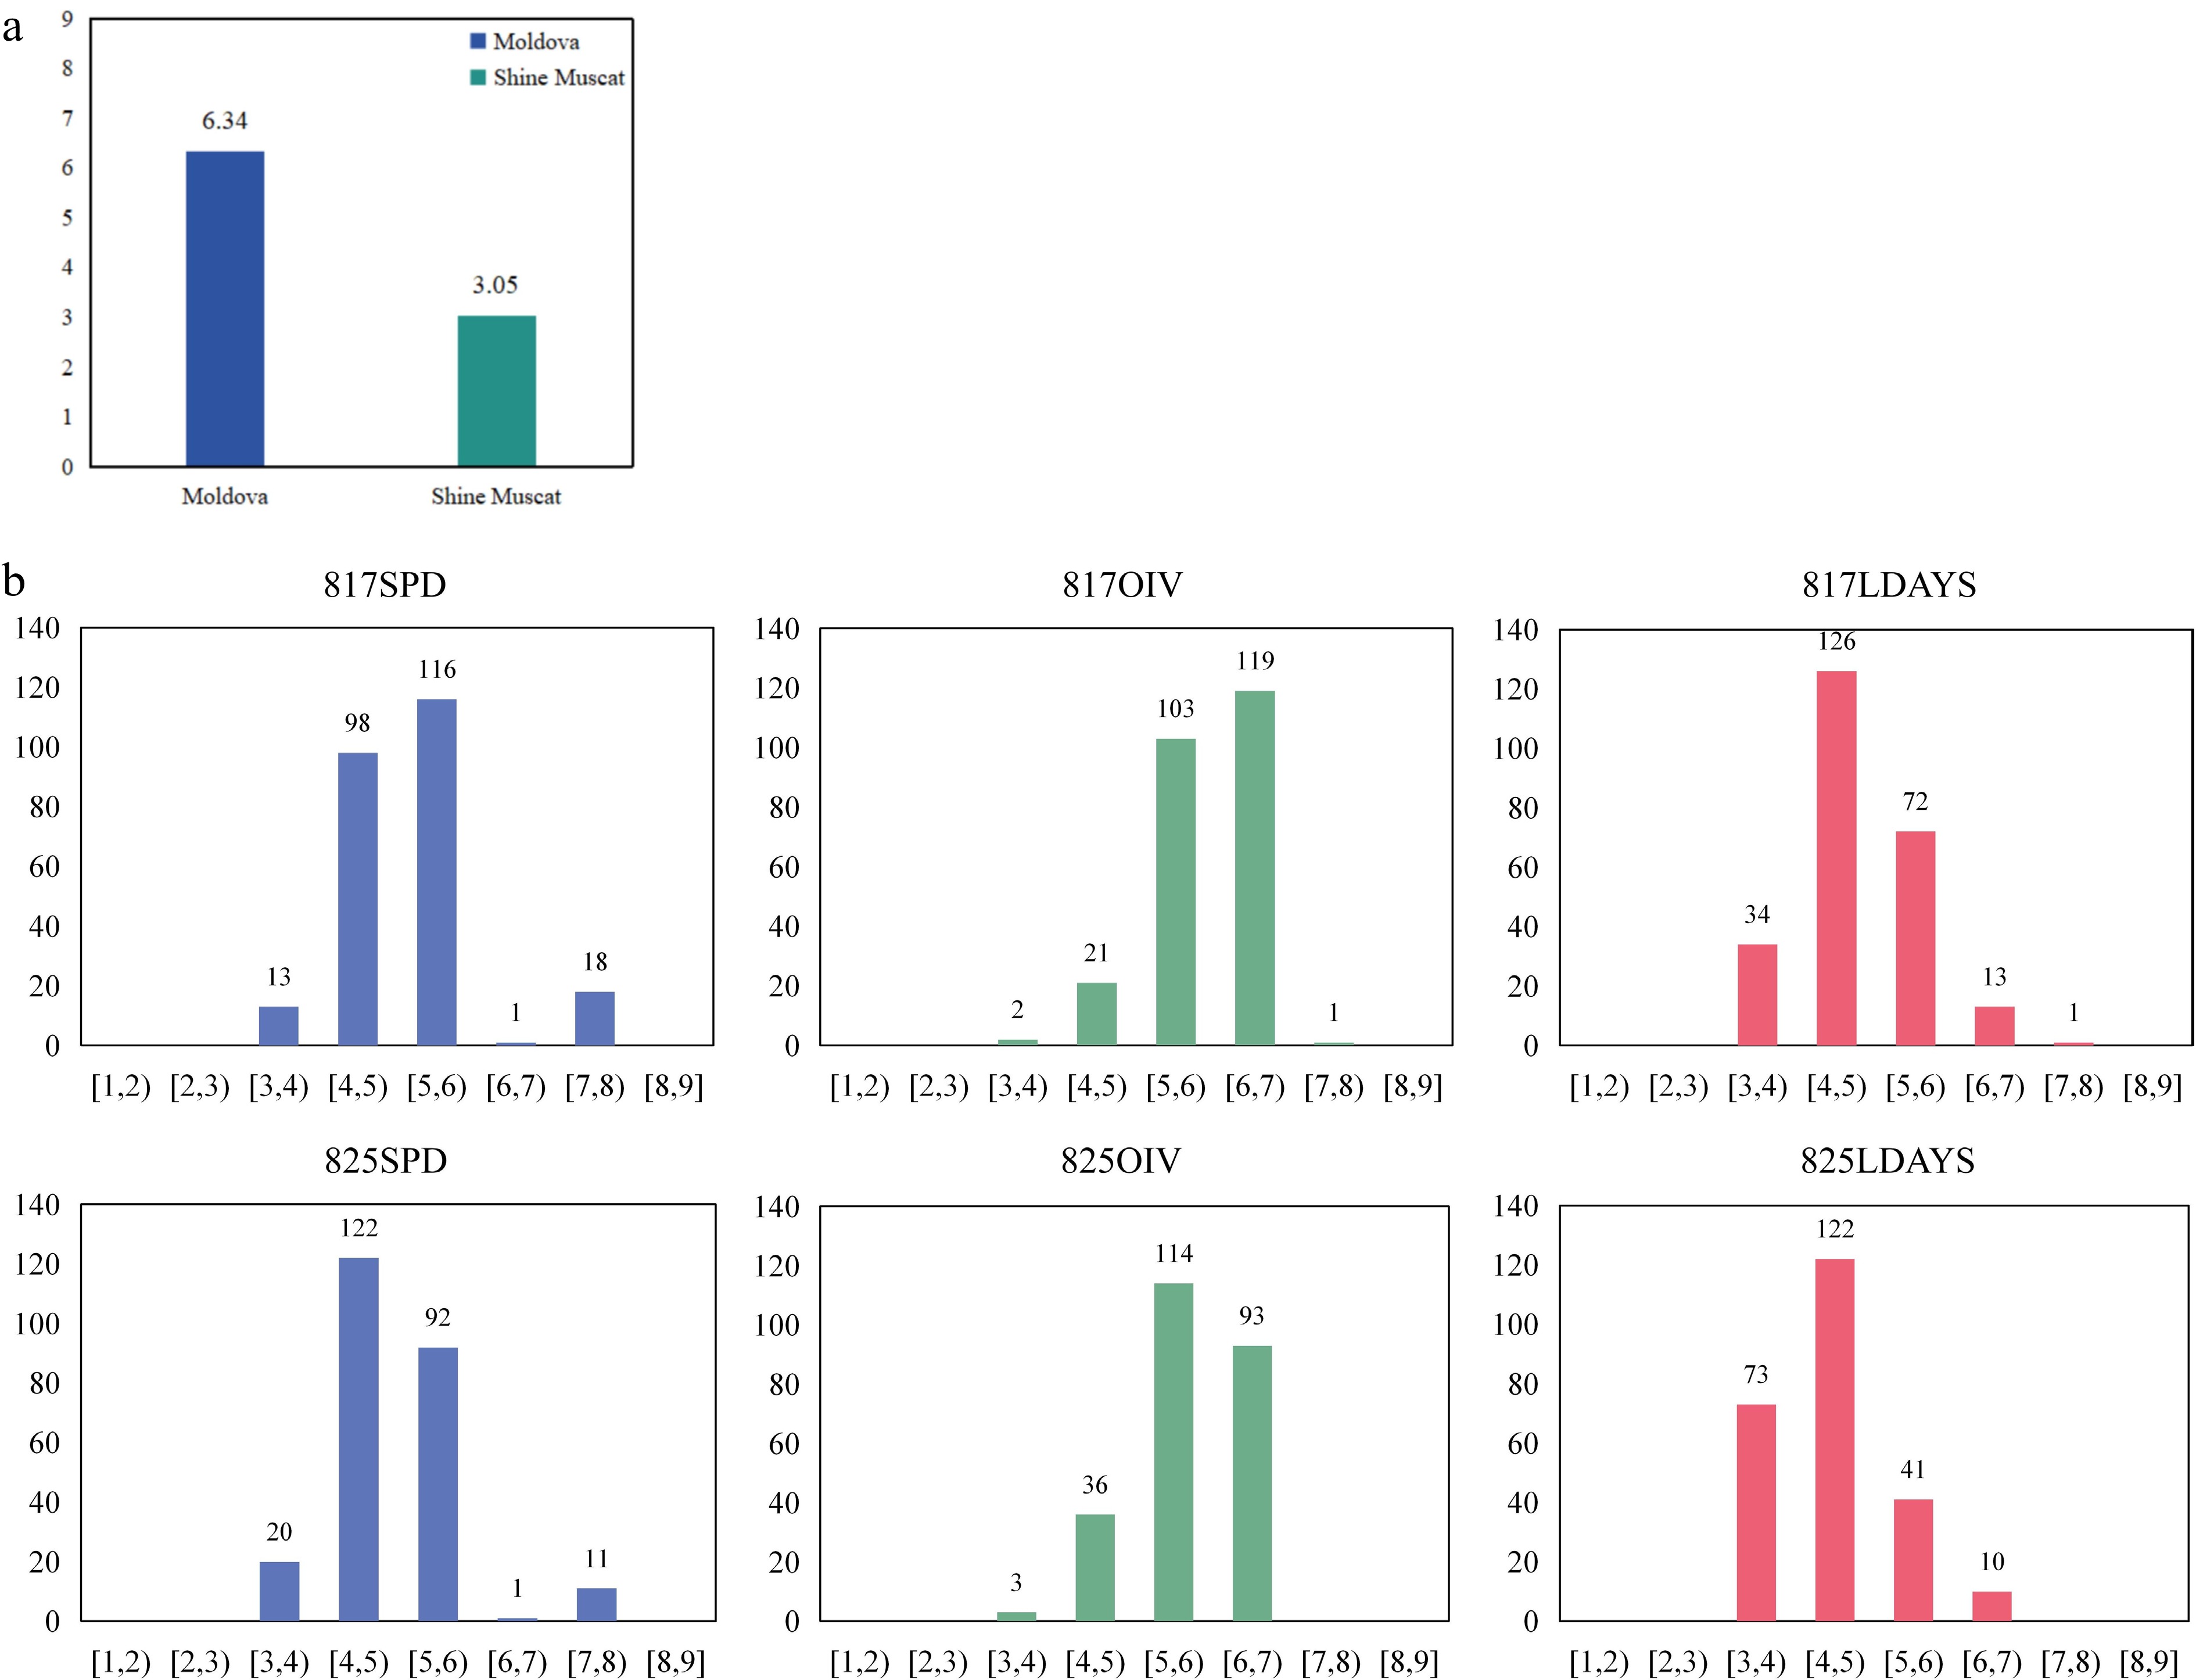
Figure 1.
The phenotype of parents and F1 population. (a) The P. viticola resistance level of the parents. The Y axis indicates the resistance level. (b) Phenotypic distribution of P. viticola resistance for F1 population from 'Moldova' × 'Shine Muscat'. The Y axis indicates the number of vines, and the X axis indicates the range of disease resistance level.
Construction of genetic map
-
A total of 826 heterozygous mSNPs were used to construct the genetic map, which spanned a genetic distance of 1,515.99 cM with an average marker interval of 1.84 cM (Fig. 2, Table 1). These markers are uniformly distributed in 19 linkage groups, with an average of 43.47 mSNPs and each group contains between 39 (LG17) and 51 (LG3) markers. The genetic distance of each linkage group ranges from 64.64 cM (LG3) to 99.78 cM (LG18), with an average length of 79.79 cM/LG. All linkage groups had good collinearity when the genetic distance of the genetic map and the physical distance of the markers in the reference genome were compared (Supplemental Fig. S2). As a result, a high-density genetic map of appropriate quality has been created for QTL mapping in the following phase.
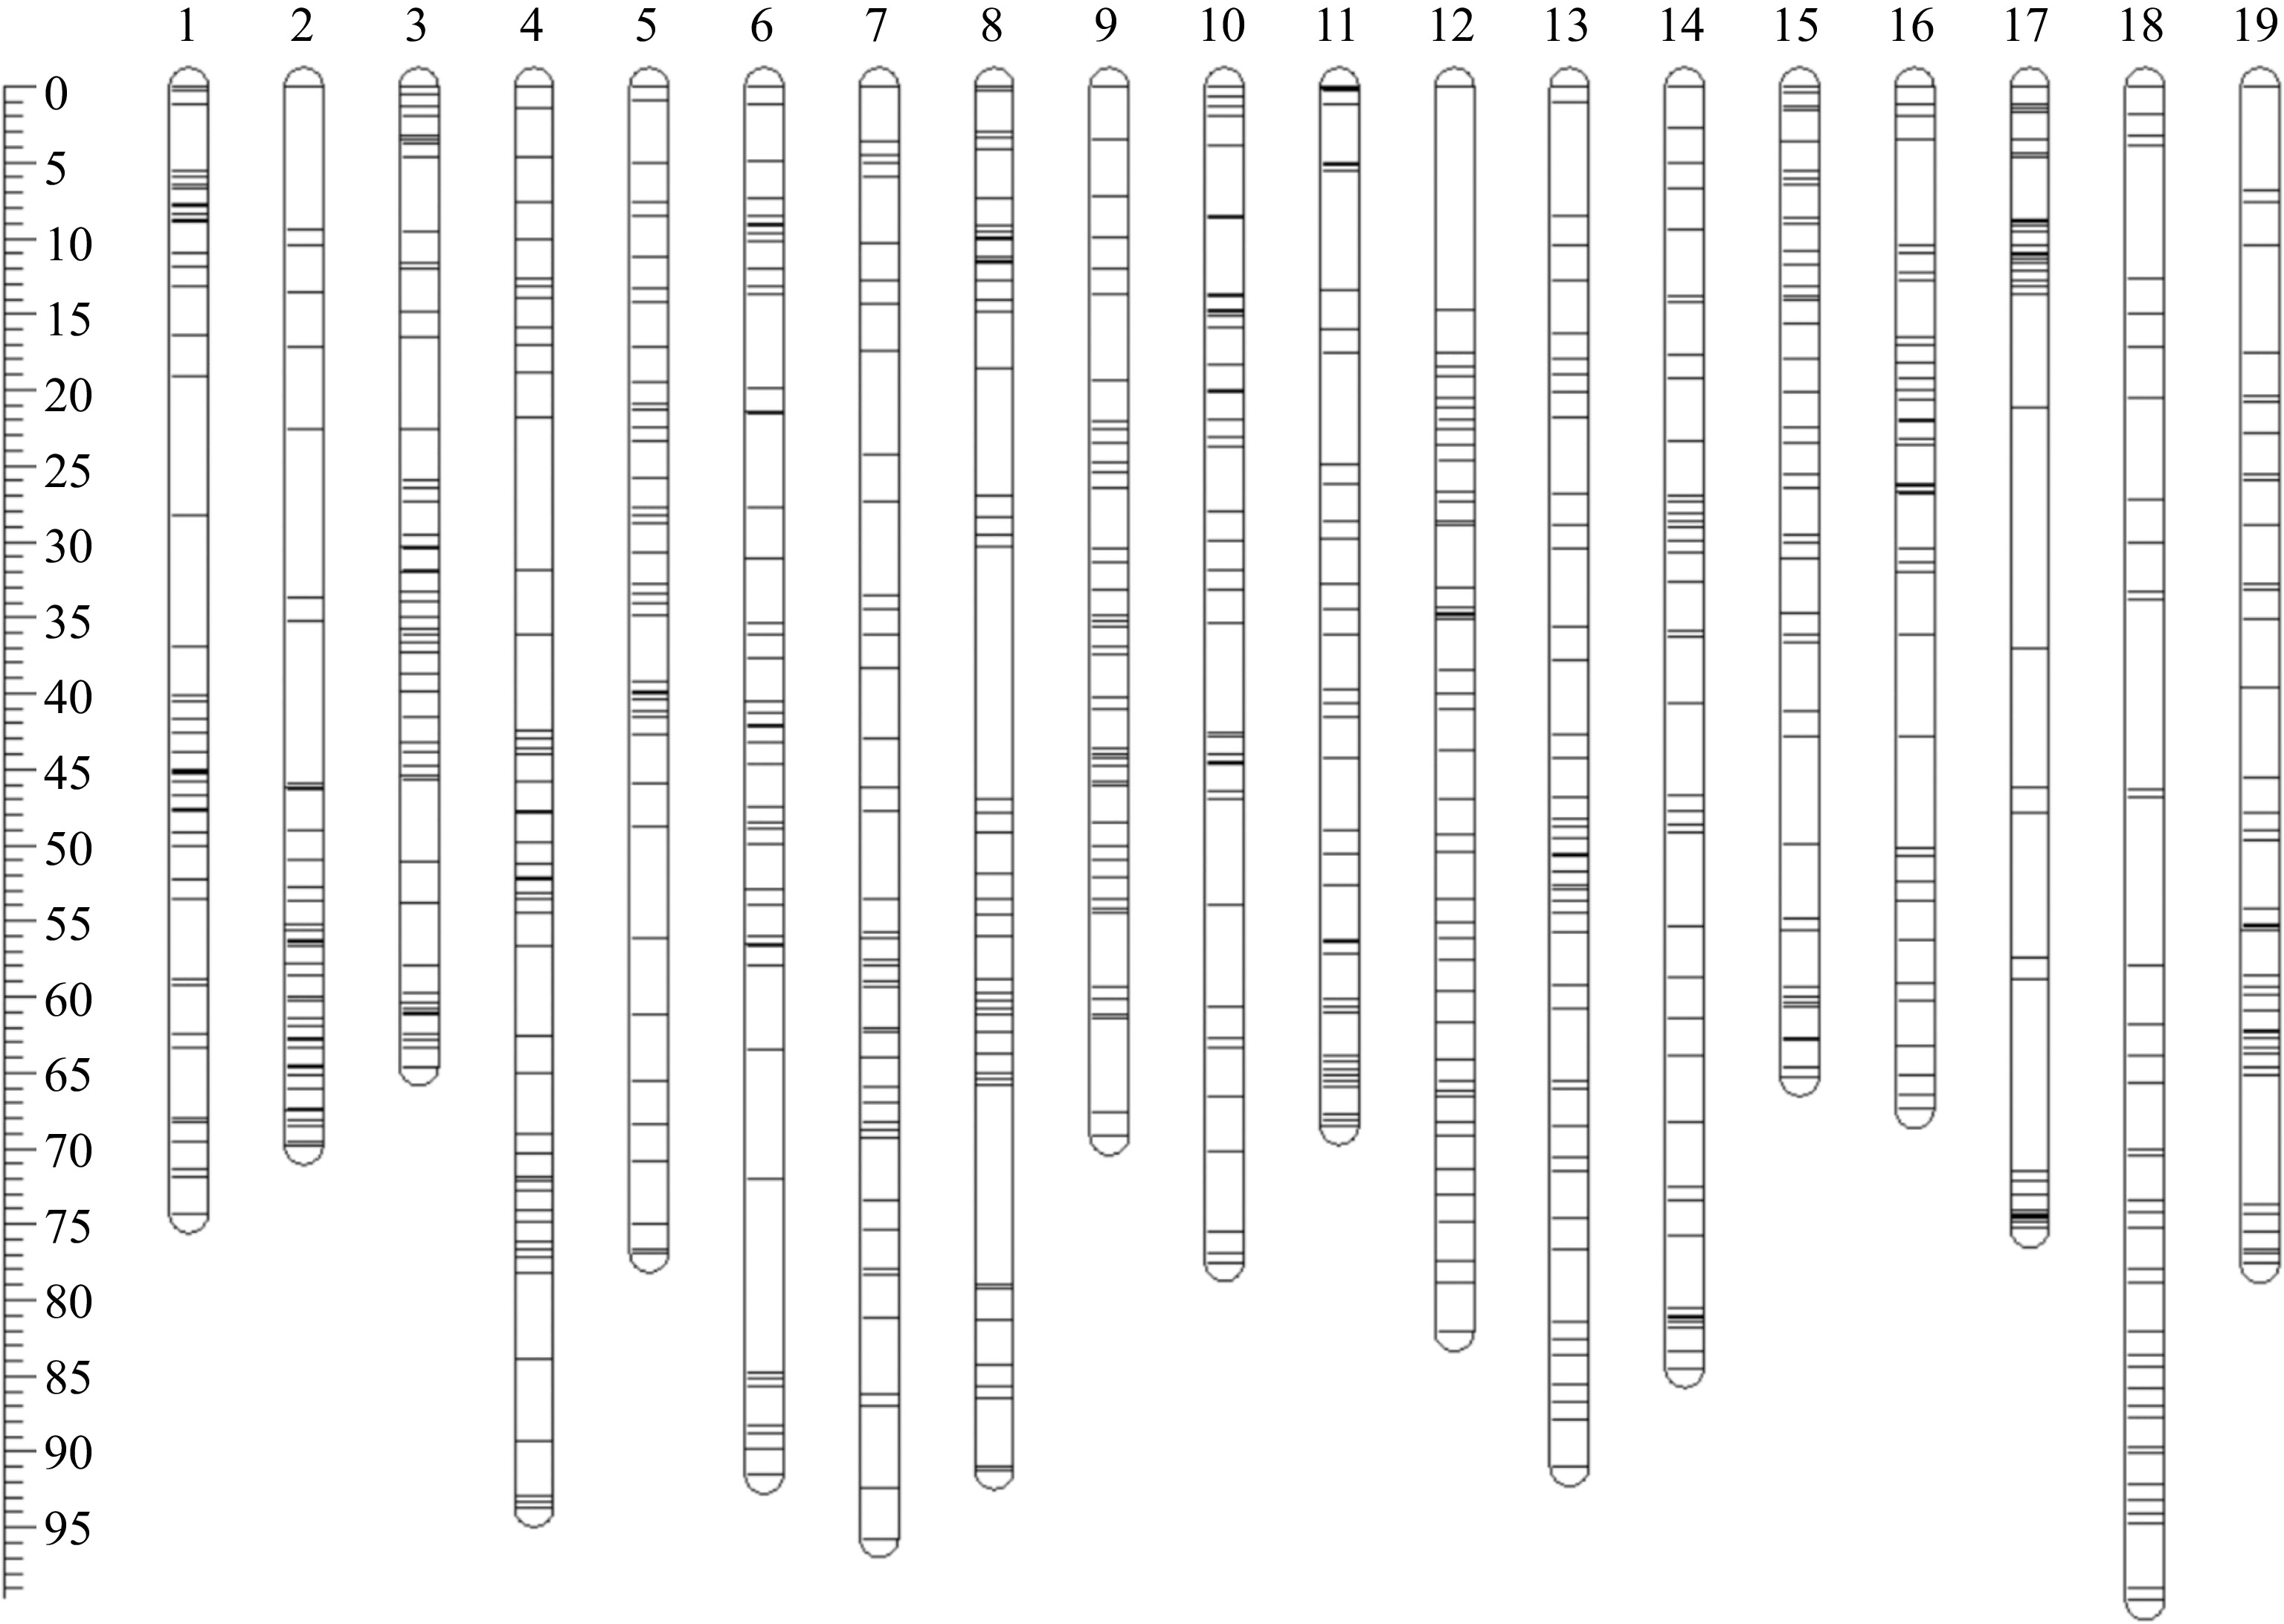
Figure 2.
Genetic map of hybrid population crosses from 'Moldova' × 'Shine Muscat'. LG1 to LG19 represents 19 linkage groups respectively, and each bar represents a SNP marker. The ruler on the left is the genetic distance (cM).
Table 1. Characteristics of genetic map of hybrid population crosses from 'Moldova' × 'Shine Muscat'.
LGs Covered length (cM) No. of SNPs Average distance (cM) Max interval (cM) 1 74.31 47 1.58 5.38 2 69.84 44 1.59 11.05 3 64.64 51 1.27 6.04 4 93.67 49 1.91 10.10 5 76.93 40 1.92 7.29 6 91.52 46 1.99 12.71 7 95.74 43 2.23 6.27 8 91.2 47 1.94 13.23 9 69.24 43 1.61 6.11 10 77.53 41 1.89 7.23 11 68.46 40 1.71 7.83 12 82.07 48 1.71 14.67 13 90.96 45 2.02 7.52 14 84.52 41 2.06 6.31 15 65.32 42 1.56 7.06 16 67.41 40 1.69 7.27 17 75.29 39 1.93 15.74 18 99.78 40 2.49 12.48 19 77.56 40 1.94 8.66 Total 1,515.99 826 1.84 15.74 Rpv QTL mapping
-
Based on the constructed high-density genetic map, the QTLs associated with P. viticola resistance were located using Interval Mapping (IM) and Multiple-QTL Mapping (MQM) methods. Consistent with independent IM analyses performed six times, a QTL was identified on chr18. The peaks of the six repeat mappings were all located at 84.423 cM, with PVE of 17.3%, 19.3%, 10.0%, 8.2%, 8.5%, and 6.9% (817SPD, OIV, LDAYS and 825 SPD, OIV, LDAYS), respectively (Fig. 3, Supplemental Table S1).
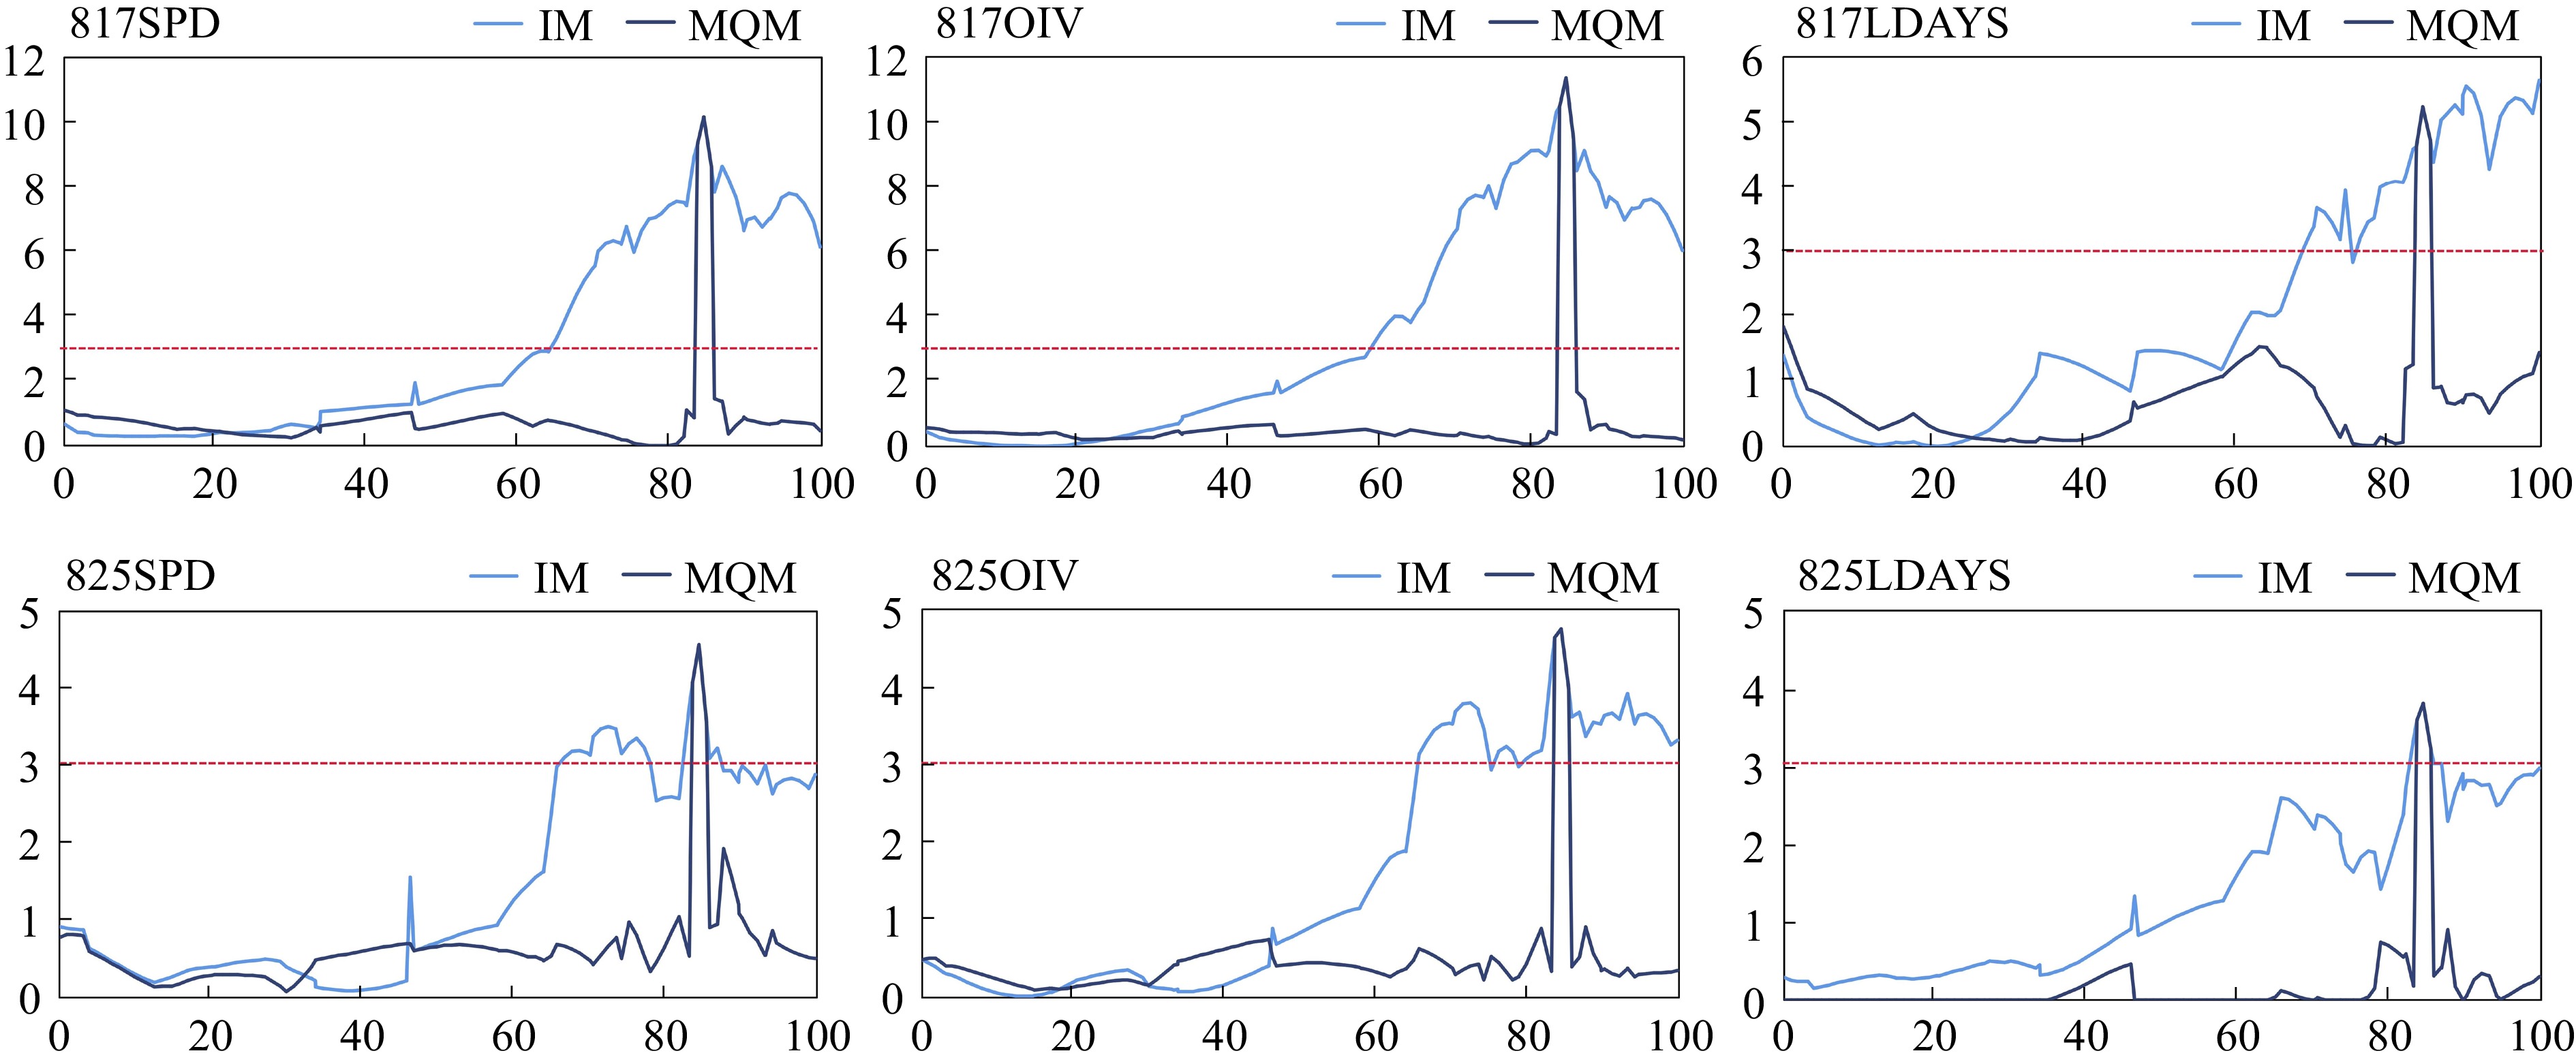
Figure 3.
Mapping of P. viticola resistance QTL on chr18. The light blue lines are mapping based on interval mapping, the dark blue lines are mapping based on multiple-QTL mapping. The red lines are threshold (LOD = 3.0) of locus.
To refine the mapping of the candidate locus, chr18_29062596 (chr18) which is nearest to the LOD peak were selected as a cofactor for MQM mapping. As expected, the range with the significant LOD score was narrowed down. The Rpv resistance QTL was located at 83.581−85.829 cM, and according to the nearest markers, that was 28.181−30.224 Mbp on chr18. This QTL was named Rpv34.
GWAS analysis
-
GWAS analysis was performed using GAPIT (version 3) with the Blink model, and Manhattan plots and QQ plots were generated (Fig. 4). In Blink, SNPs above the threshold were detected in chr18 in five out of six independent analyses. The SNPs with the highest values were located at 29.06 Mbp (for 817SPD), 29.39 Mbp (for 817LDAYS) and 28.34 Mbp (for 825SPD, OIV, and LDAYS), respectively. Furthermore, the MLM, GLM and FarmCPU models were also attempted for analysis, and the results were similar (Supplemental Fig. S3, Supplemental Table S2). The SNPs with the highest −log10(p) values were located between 28.34−29.39 Mbp. In some analyses, there were still peaks at a similar location although no markers were above the threshold. The QQ plot for each Manhattan plot revealed the presence of significant markers that deviated from random effects and were strongly associated with the phenotype in each group.
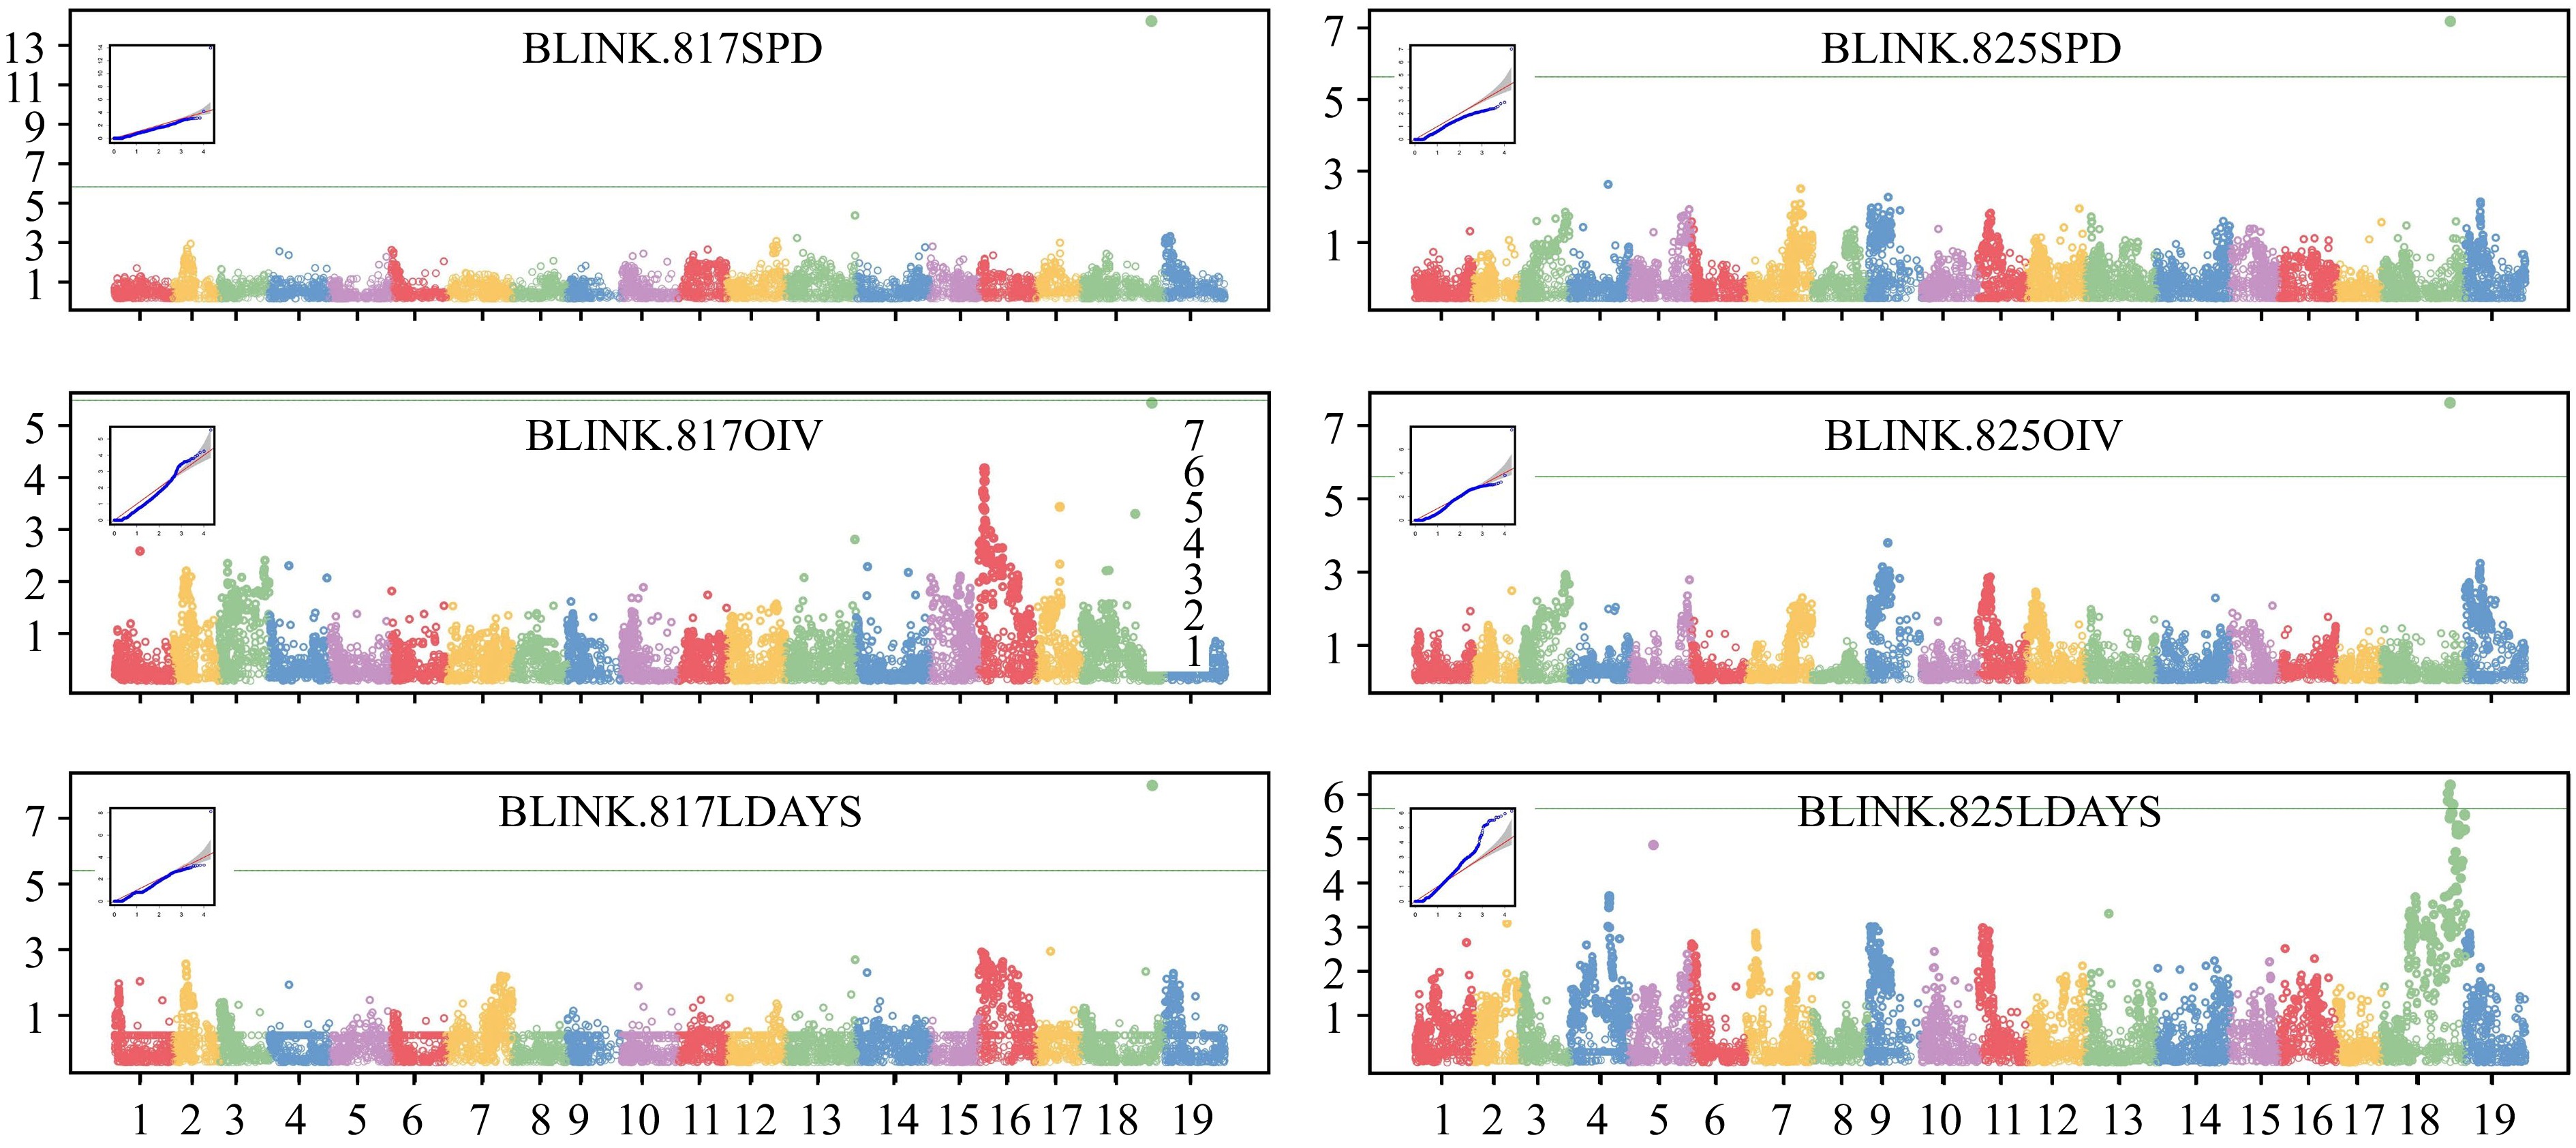
Figure 4.
GWAS analysis of P. viticola resistance locus. Manhattan plots and QQ plots were drawn based on Blink model. The vertical axis of the Manhattan map is the −log10(p) of each marker. The green lines are threshold (LOD = 5.7) of high related markers.
Joint analysis and RGA distribution
-
To determine the RGAs (Resistance Gene Analogs) near the QTL as comprehensively as possible, the boundaries of IM (28.181−30.729 Mbp), MQM (28.181−30.224 Mbp) and GWAS-Blink (27.534−29.388 Mbp) were combined for screening (Fig. 5). According to the annotation of the grape reference genome (VCost. v3), there were a total of 21 RGAs in the target region (Supplemental Table S3). These RGAs were roughly distributed in three clusters in total, with the first two clusters having 9 and 11 RGAs, respectively, and the third cluster having only 1. Further structural prediction by NCBI showed that 15 of these RGAs had the TIR-NBS-LRR structure, one had the CC structure at the N-terminus, and five RGAs only had the LRR structure. These RGA will be focused on for further study.
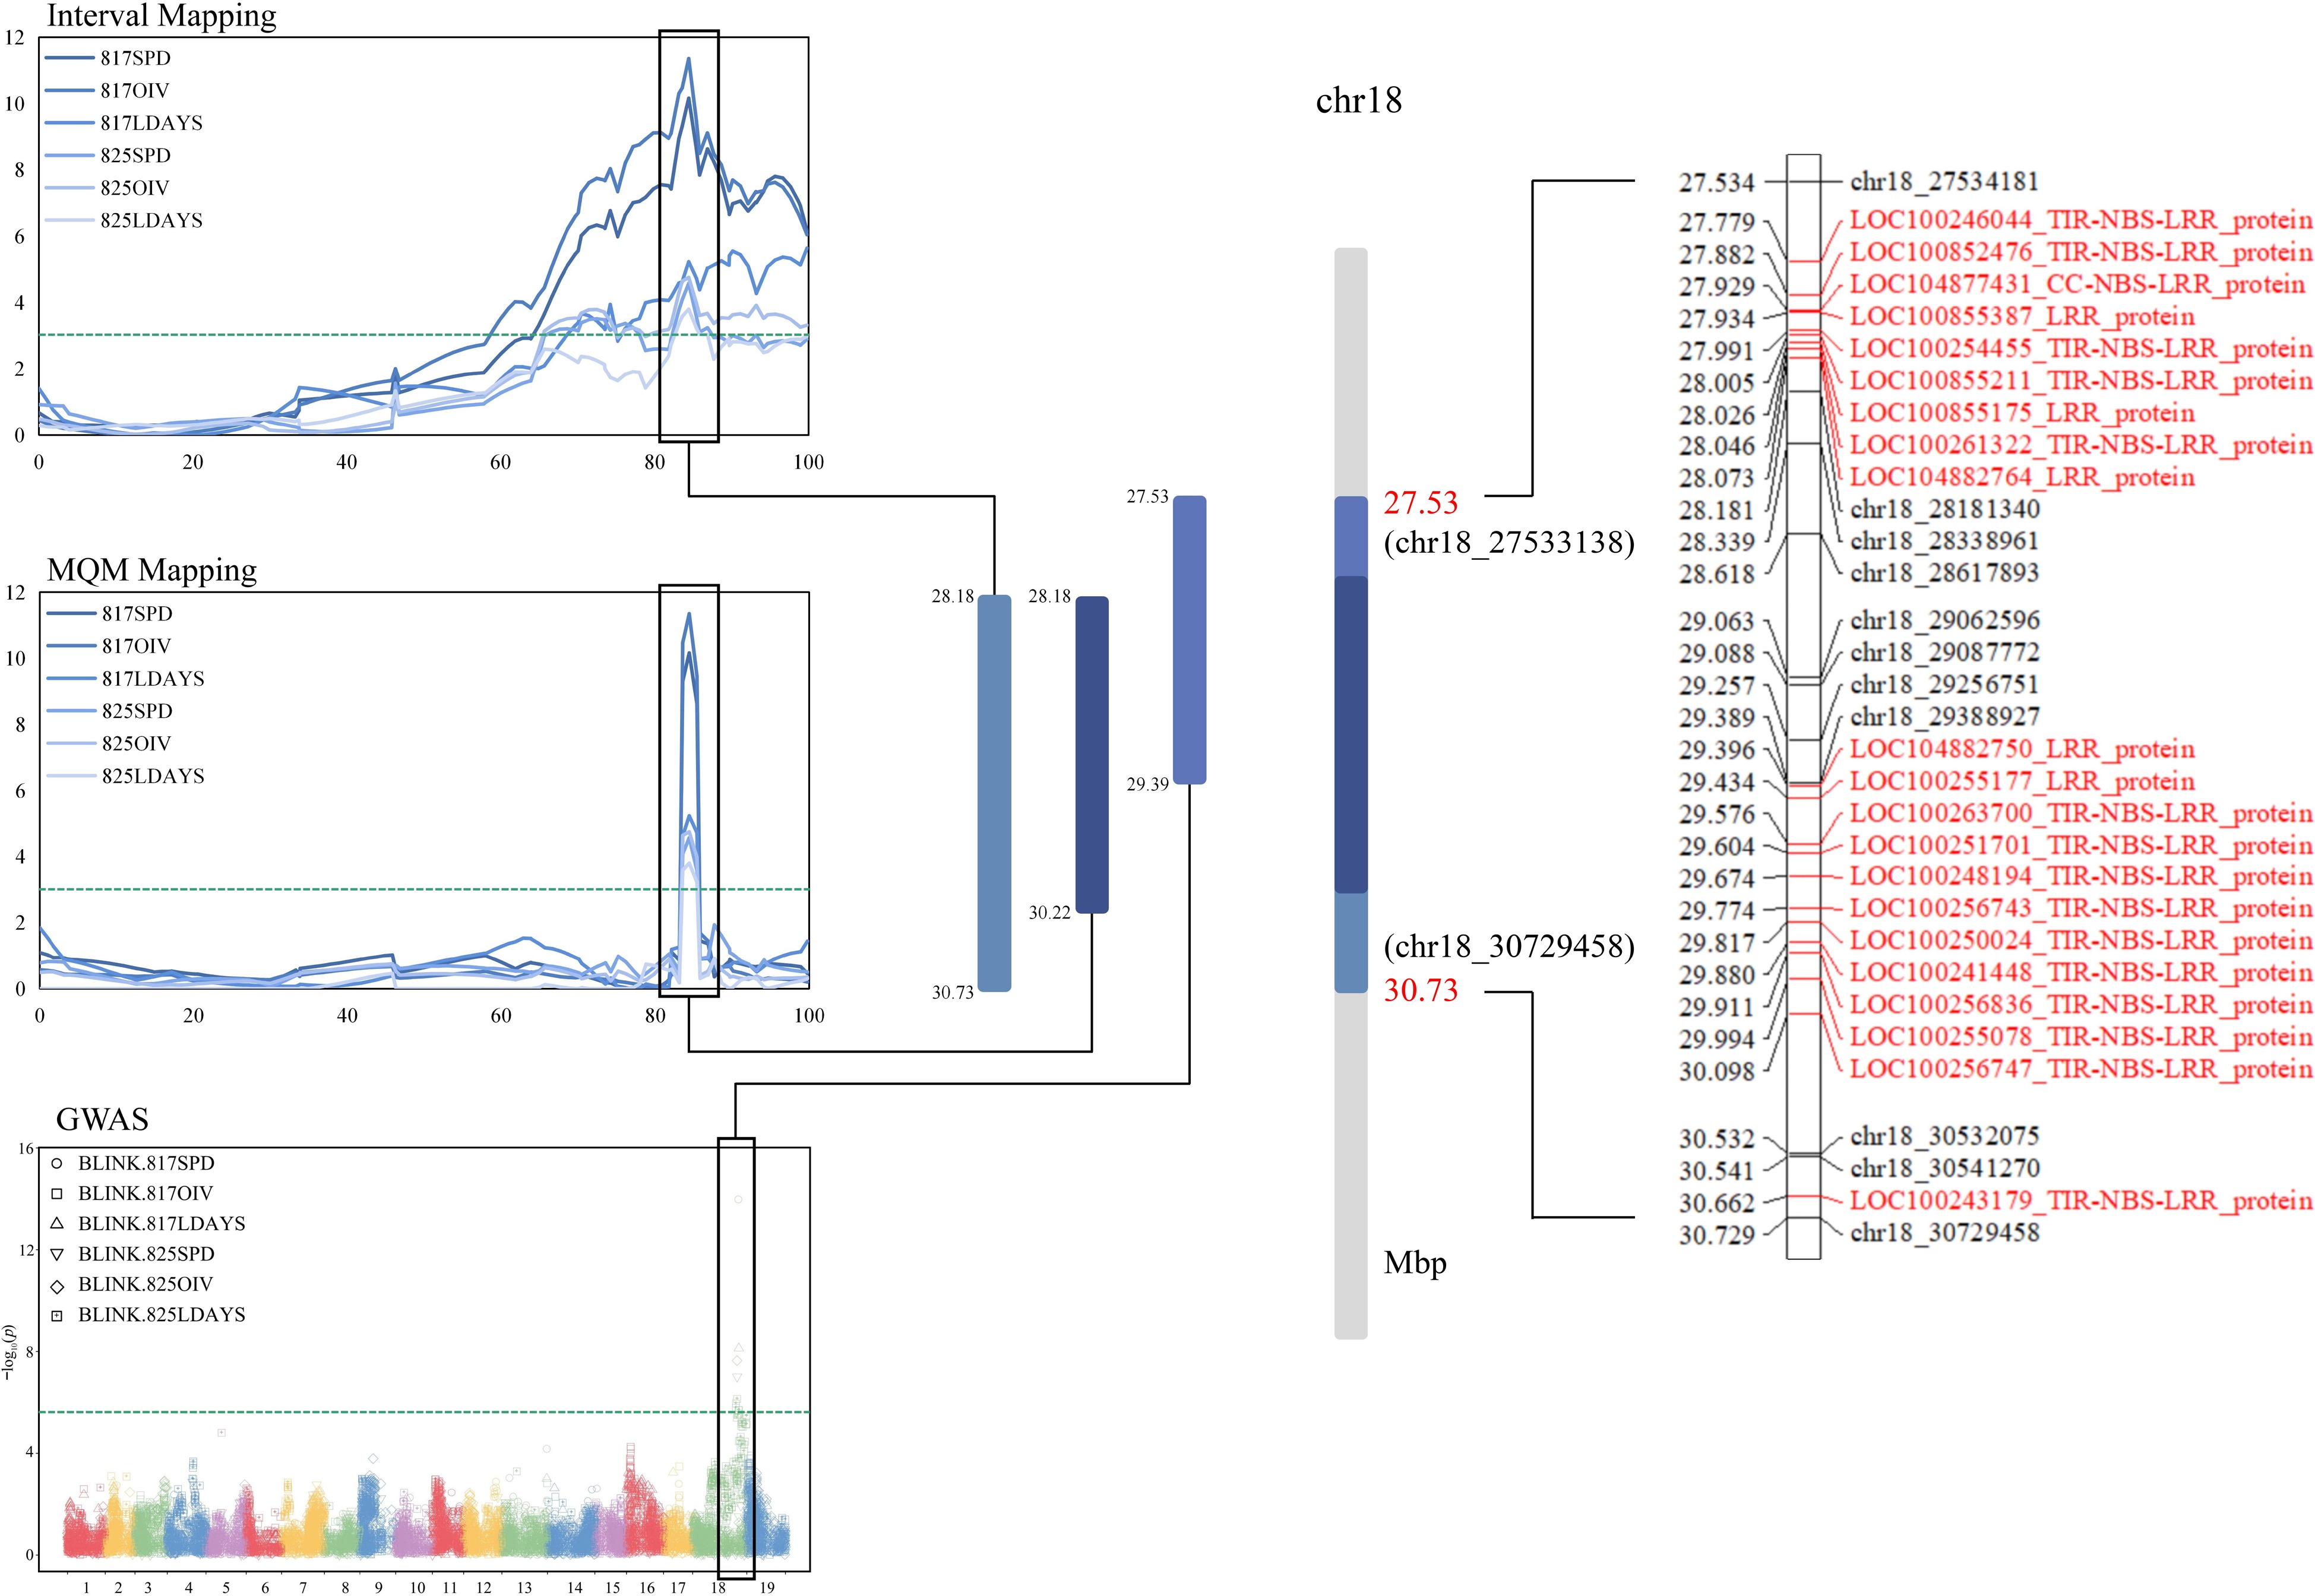
Figure 5.
Joint analysis of QTL and GWAS results. The overlap region is based on the union of IM, MQM and GWAS. Candidate RGAs were selected by reference genome of grape (PN40024). The green lines were threshold (3.0 in MapQTL and 5.7 in GWAS). The RGA in the locus has been marked with red font.
Correlation between P. viticola resistance and the linkage marker chr18_29062596
-
In the QTL and GWAS analysis, chr18_29062596 was the marker closest to the LOD peak/had the largest −log10(p) value for the largest number of replicates (Fig. 6). Therefore, chr18_29062596 was considered to have the highest correlation with resistance to P. viticola in this study. For the nucleotides of the marker, it was found that the marker was 'CT' in the resistant parent 'Moldova' and 'CC' in the sensitive parent 'Shine Muscat'. According to the distribution of this marker in the progenies, the higher the resistance level, the more progenies carry 'CT'; otherwise, the more 'CC'. This difference was significantly reproducible in multiple phenotypic analyses.
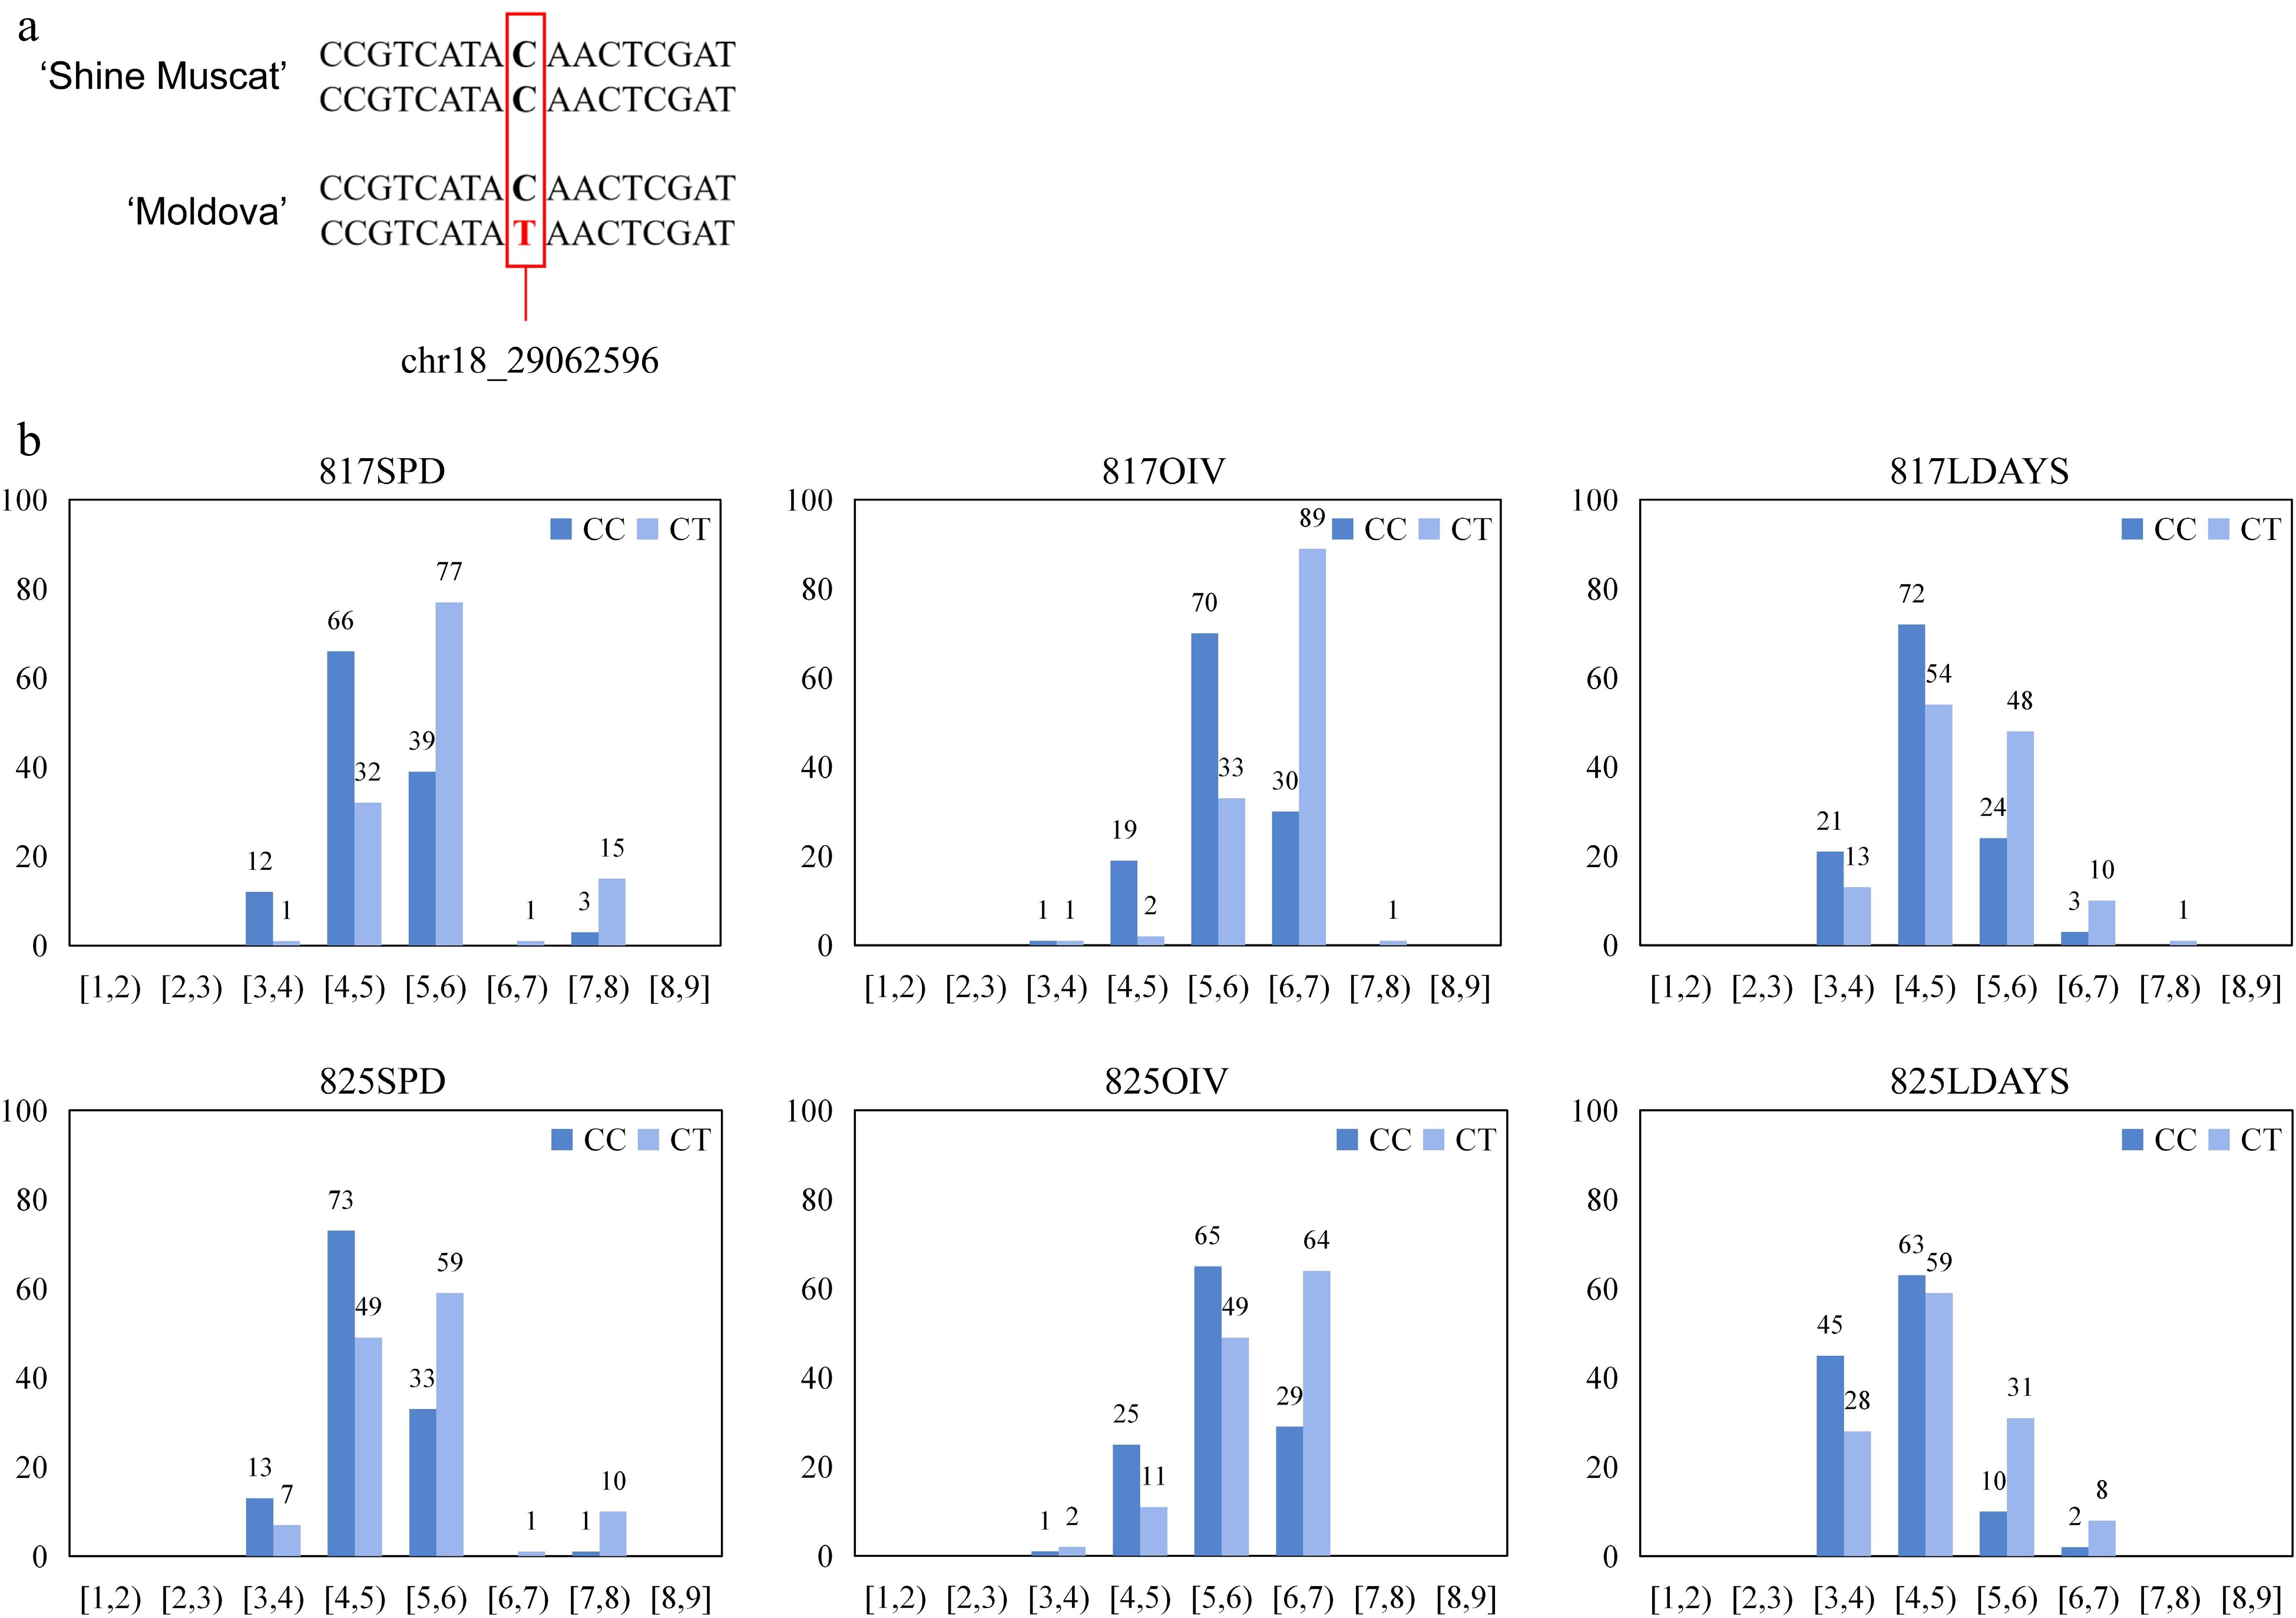
Figure 6.
Analysis of the highest correlation SNP for P. viticola resistance. (a) Base information of 'chr18_29062596' allele and its flanking sequence. (b) Distributions of P. viticola levels among the hybrids were separated by the genotypes of 'chr18_29062596'.
-
Accurate evaluation of the resistance level is a prerequisite for mapping QTL for disease resistance. The most commonly used methods to evaluate resistance level of P. viticola in grapevine are artificial leaf disk inoculation and natural field infection. Natural field infection has also been used in some studies[19], but due to the great influence of weather, planting conditions, and microclimate, it is not as accurate and reliable as in vitro leaf disk inoculation. The three methods based on leaf disk inoculation involved in this study have been applied in previous studies and have detected credible P. viticola loci[11,20−22].
In this study, although there were some differences in the results of the three methods, the distribution of the scores was consistent with the normal distribution of QTL. The reasons for the differences between methods can be varied. In hybrid F1 progenies, many phenotypes are also separated by the exchange of sister chromatids, such as venation, waxy layer on the leaf surface, and leaf hair. The protrusion of the vein can limit the expansion of mycelium germination area, and the wax layer and leaf hair can directly affect the direct contact between the P. viticola fluid and the stomata on the back of the leaf during the inoculation[23]. These phenotypes will eventually affect the scoring of resistance, so it is necessary to consider multiple methods to accurately assess resistance.
Although phenotypic scores were different under different methods, QTL localization, and GWAS analysis results based on these scores also showed significant repeatability, further confirming the reliability of the locus.
R gene might be the key to grape disease resistance
-
In this study, we located Rpv34 in Moldova and found a large number of NB-ARC super family genes were contained in the locus. NB-ARC genes (also known as resistance genes, R genes) generally contain two conserved functional domains, nucleotide binding sites (NBS) and leucine-rich repeats (LRR)[24]. The cluster distribution of the R gene was also consistent with previous studies on multiple disease resistance QTL[25−27].
The protein encoded by the R gene contained in the plant genome can specifically recognize the effector protein secreted by pathogen, and then trigger hypersensitive response (HR) to cause programmed cell death (PCD), and then inhibit the growth of the pathogen, which is the 'gene for gene concept'[28]. Not only grapes but also other crops have been found where the R gene is the key in disease resistance, such as wheat[29], rice[30], maize[31] among others. Based on their conserved domains, 386 candidate R genes have been predicted in grapes[32], some of which have been shown to play an important role in resistance to powdery mildew[33], downy mildew[34,35], and black rot[36]. Therefore, we believe that the R gene plays a key role in the process of grape disease resistance.
SNPs developed by GBTS will be widely used in plant breeding
-
The development of molecular markers has become critical in the field of genetic breeding in recent years. Single nucleotide polymorphism (SNP) markers have emerged as the preferred marker type for marker-assisted selection in plant breeding. Whole genome sequencing (WGS)[37], genotyping by sequencing (GBS), SNP genotyping arrays, and genotyping by targeted sequencing (GBTS) are common approaches used in the generation of SNP markers.
Although WGS can identify every conceivable SNP by sequencing the complete genome, its expensive cost prevents it from being used on a wide range of plant materials. Furthermore, not all nucleotide information is required for breeding. GBS, on the other hand, reduces the cost and complexity of data processing by selecting DNA segment sequencing to create SNP markers, allowing for the generation of a large number of SNP markers across the genome[38−40]. GBS has been used successfully on a variety of crops[41].
However, the stability of SNP markers is hampered due to species, material, and platform restrictions, making comparability and application of GBS data in various investigations difficult. SNP genotyping arrays are useful for detecting preset target SNPs and have been widely utilized in horticultural crop research, but they are not cost-effective for breeding. GBTS sequences specific loci and reduces costs by combining the benefits of GBS and genotyping arrays[42,43]. The markers acquired using GBTS are stable across platforms, allowing markers for a wide range of applications. GBTS identifies a greater number of SNPs than typical genotyping arrays, and these SNPs are dispersed in clusters, making them useful for a variety of research investigations.
Given its benefits, GBTS has shown great promise for breeding applications in crops such as maize[44], wheat[45], rice[46], pepper[47], and broccoli[48]. In this study, GBTS sequencing was used, and the combination of MapQTL and GWAS methods was used for locus positioning to ensure the accuracy of the marker information.
-
To identify the P. viticola-resistant loci in the well-known table grape cultivar 'Moldova', the F1 progenies resistance levels of the 'Moldova' (resistant) and 'Shine Muscat' (susceptible parent) were been scored. According to the sequencing data of the population from GBTS, a high-density genetic map containing 826 SNPs, which spanned 1,515.99 cM, was constructed. Through the analysis of MapQTL and GWAS, a P. viticola resistant locus located at 27.534−30.729 Mbp on chr18 was mapped, and a total of 21 RGA in the locus were identified. A SNP marker 'chr18_29062596' was proved to be highly associated with P. viticola resistance.
-
The authors confirm contribution to the paper as follows: conceptualization: Sun Y, Han B; methodology: Yang B; investigation: Li M, Liu C, Wang Y, Wu G; resources: Yin Y, Gu Q, Lou J, Han B; data analysis: Jia N, Wang X, Zeng Q, Guo Y; writing-original draft preparation: Sun Y, Yang B; writing-review and editing: Fu P, Han B. All authors reviewed the results and approved the final version of the manuscript.
-
Data sharing not applicable to this article as no datasets were generated or analyzed during the current study.
This work was supported by China Agriculture Research System of MOF and MARA (Grant No. CARS-29-yc-8), HAAFS Science and Technology Innovation Special Project (Grant No. 2022KJCXZX-CGS-1), Key R&D Program Project of Hebei Provincial Department of Science and Technology (Grant No. 20326813D), Key R&D program of Xinjiang Uygur autonomous region (Grant No. 2022B02045-1-2), Innovation team of Hebei modern agricultural industrial technology system (Grant No. HBCT2023150202), Basic Research Funds of Hebei Academy of Agriculture and Forestry Sciences (Grant No. 2023020103).
-
The authors declare that they have no conflict of interest.
- Supplemental Table S1 Details of QTL mapping for P. viticola resistance.
- Supplemental Table S2 Details of GWAS analysis for P. viticola resistance.
- Supplemental Table S3 RGAs located in the P. viticola resistance locus on chr18.
- Supplemental Fig. S1 Phenotype of P. viticola resistance for 'Moldova' and 'Shine Muscat'. Scale bar represents 0.1 cm.
- Supplemental Fig. S2 Collinearity analysis of the genetic map. The X axis indicates the genetic position of each SNP (cM), the Y axis indicates the physical position of each SNP (Mbp).
- Supplemental Fig. S3 GWAS analysis of P. viticola resistance locus on three models. Manhattan plots and QQ plots were drawn based on MLM, GLM and FarmCPU models. The vertical axis of the Manhattan map is the −log10(p) of each marker. The green lines are threshold (LOD = 5.7) of high related markers.
- Copyright: © 2024 by the author(s). Published by Maximum Academic Press, Fayetteville, GA. This article is an open access article distributed under Creative Commons Attribution License (CC BY 4.0), visit https://creativecommons.org/licenses/by/4.0/.
-
About this article
Cite this article
Sun Y, Yang B, Li M, Liu C, Yin Y, et al. 2024. Rpv34: the noval Plasmopara viticola resistance locus in 'Moldova'. Fruit Research 4: e024 doi: 10.48130/frures-0024-0017 

Rpv34: the noval Plasmopara viticola resistance locus in 'Moldova'
- Received: 03 February 2024
- Revised: 30 March 2024
- Accepted: 07 April 2024
- Published online: 02 July 2024
Abstract: Downy mildew (DM), caused by Plasmopara viticola, is one of the most serious diseases that affects grape production worldwide. Utilizing host resistance, commonly known as 'R' genes, is considered the most effective way to cure the disease. The identification of the R gene in well-known table grape cultivars is conducive to breeding varieties with better quality. In this study, a population of F1 with 246 progenies was obtained from the cross of two widely grown table grapes 'Moldova' and 'Shine Muscat', in which 'Moldova' appeared resistant to P. viticola resistance. According to the sequencing data from GBTS, a high-density genetic map containing 826 SNPs, which spanned 1,515.99 cM, was constructed. Through the analysis of MapQTL and GWAS, a resistant locus for P. viticola was mapped, located at 27.534−30.729 Mbp in chr18, and was named Rpv34. A total of 21 Resistance Gene Analogues (RGA) distributed in three clusters were identified in this locus. A SNP marker chr18_29062596 was proved to be highly associated with resistance to P. viticola. This work will improve the mechanism of resistance understanding of P. viticola in grapevine and facilitate the use of resistant germplasm in breeding.
-
Key words:
- Grapevine /
- Plasmopara viticola resistance /
- QTL mapping /
- GWAS