-
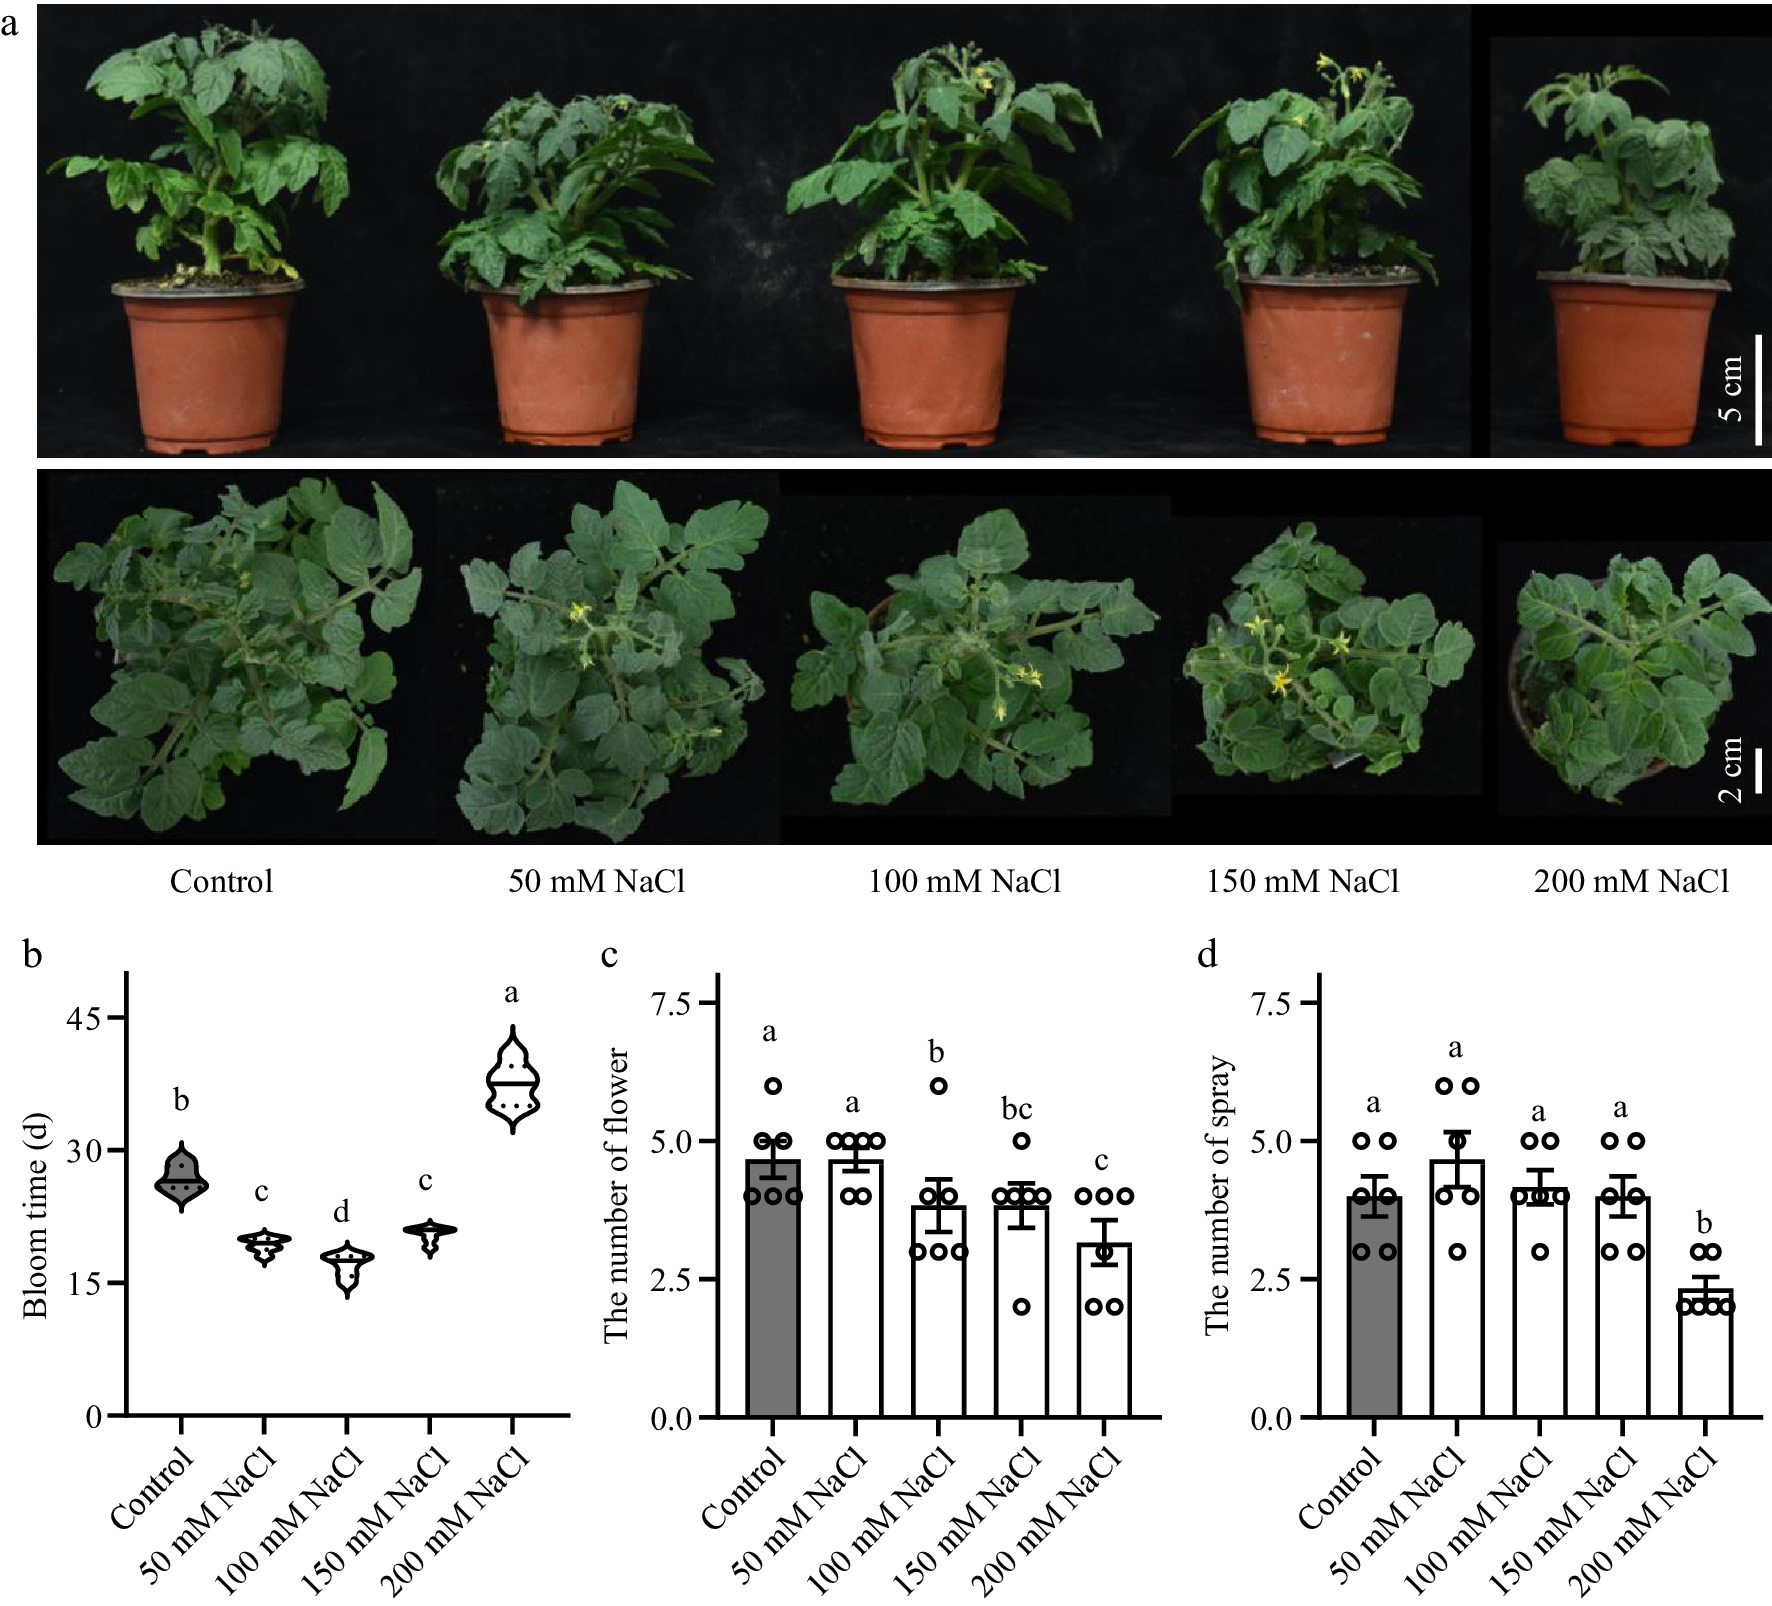
Figure 1.
Effects of salt stress on tomato flower development. (a) Phenotypes of tomato seedlings treated with NaCl solutions at 50, 100, 150 and 200 mM NaCl. (b) Flowering time of the tomato seedlings. (c) Number of flowers in tomato seedlings. (d) Number of spray in tomato seedlings. Tomato seedlings were treated with NaCl solutions for 3 weeks. Data were represented as average values of six biological replicates, with error bars indicating the standard error. Statistical analysis was performed using DPS software, and differences between treatments were considered statistically significant when denoted by distinct letters above the bars, as determined by the LSD Test (p < 0.05).
-
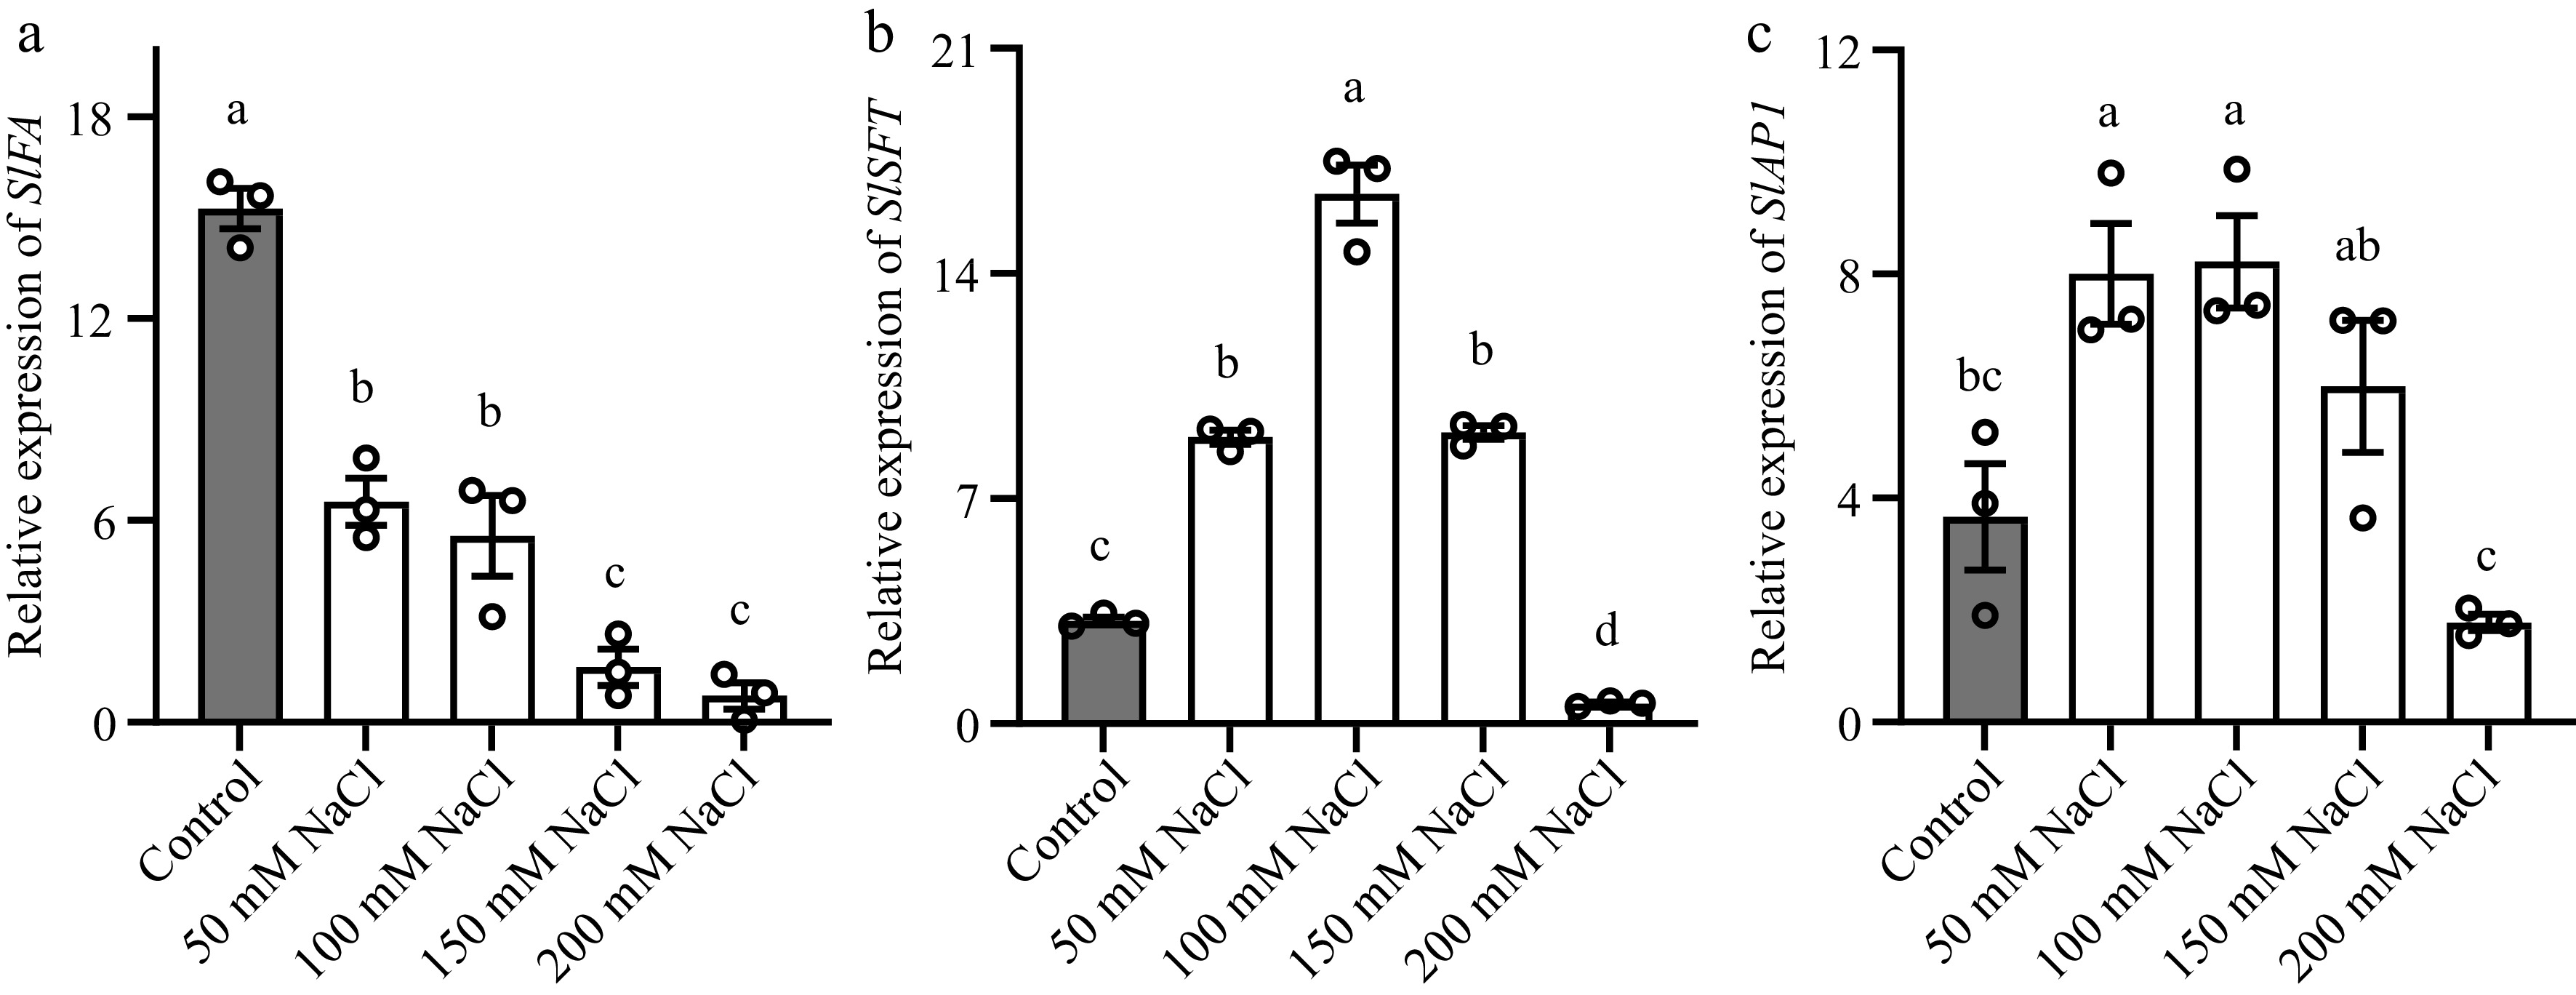
Figure 2.
Salt stress altered the transcription of SlSFT, SlFA and SlAP1 in tomato stem apex or leaves. (a), (b) Abundance of SlSFT and SlFA in the third leaf. (c) Abundance of SlAP1 in stem apex. The reference gene used for normalization was SlACTIN. Tomato seedlings were treated with NaCl solutions for 12 h. Data represents the average values from three biological replicates, with error bars indicating the standard error. Statistical analysis was performed using DPS software, and differences between treatments were considered statistically significant when denoted by distinct letters above the bars, as determined by the LSD Test (p < 0.05).
-
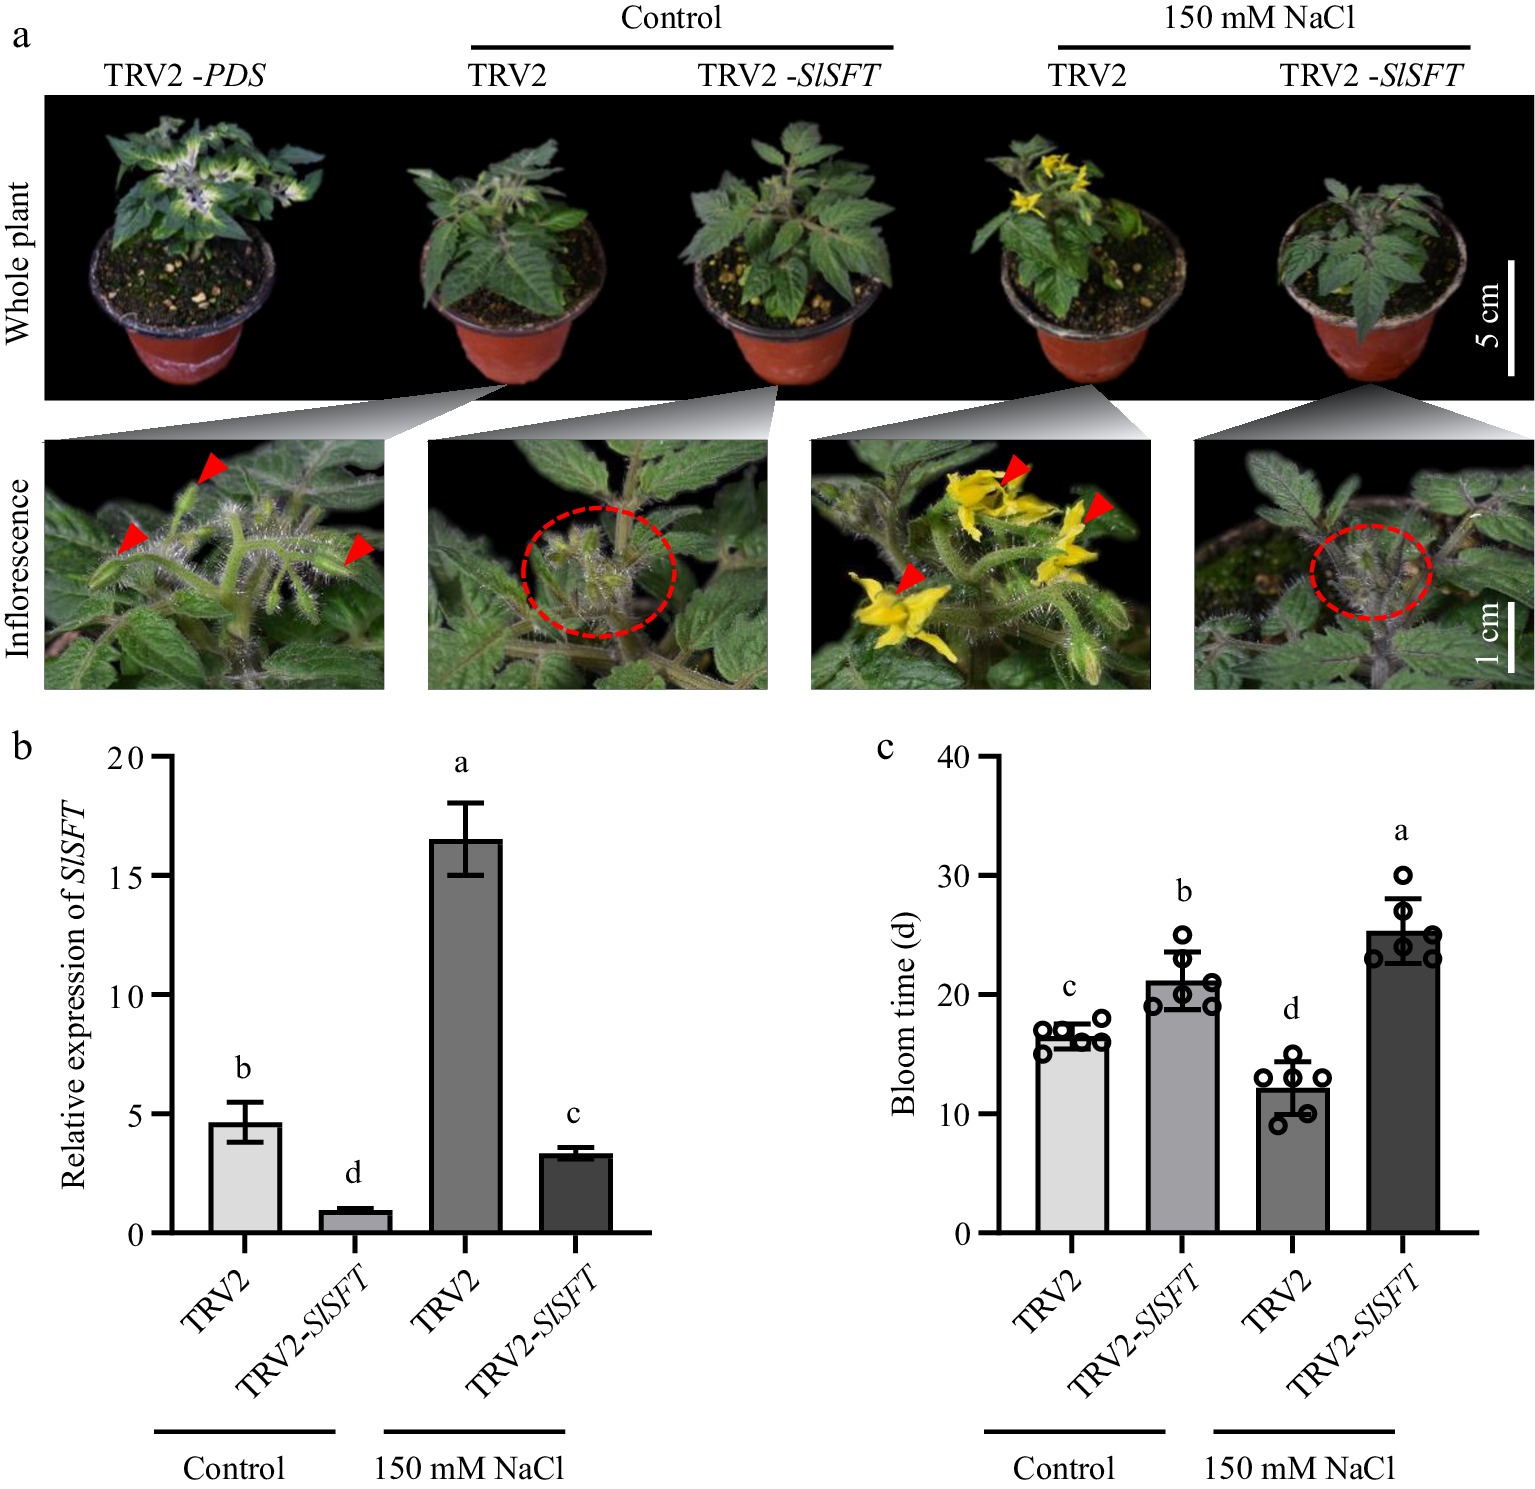
Figure 3.
SlSFT silencing plants did not exhibit early flowering under salt stress. (a) Flowering status of TRV2 and TRV2-SlSFT under salt treatment and control conditions. TRV2-PDS served as a positive control for the VIGS experiment. Red triangles and ovals indicate the inflorescences. (b) Expression levels of SlSFT in TRV2 and TRV2-SlSFT under salt stress and control conditions. (c) Bloom time of TRV2 and TRV2-SlSFT. The present data represents the average values from at least six biological replicates, with error bars indicating the standard error. Statistical analysis was performed using DPS software, and differences between treatments were considered statistically significant when denoted by distinct letters above the bars, as determined by the LSD Test (p < 0.05).
-
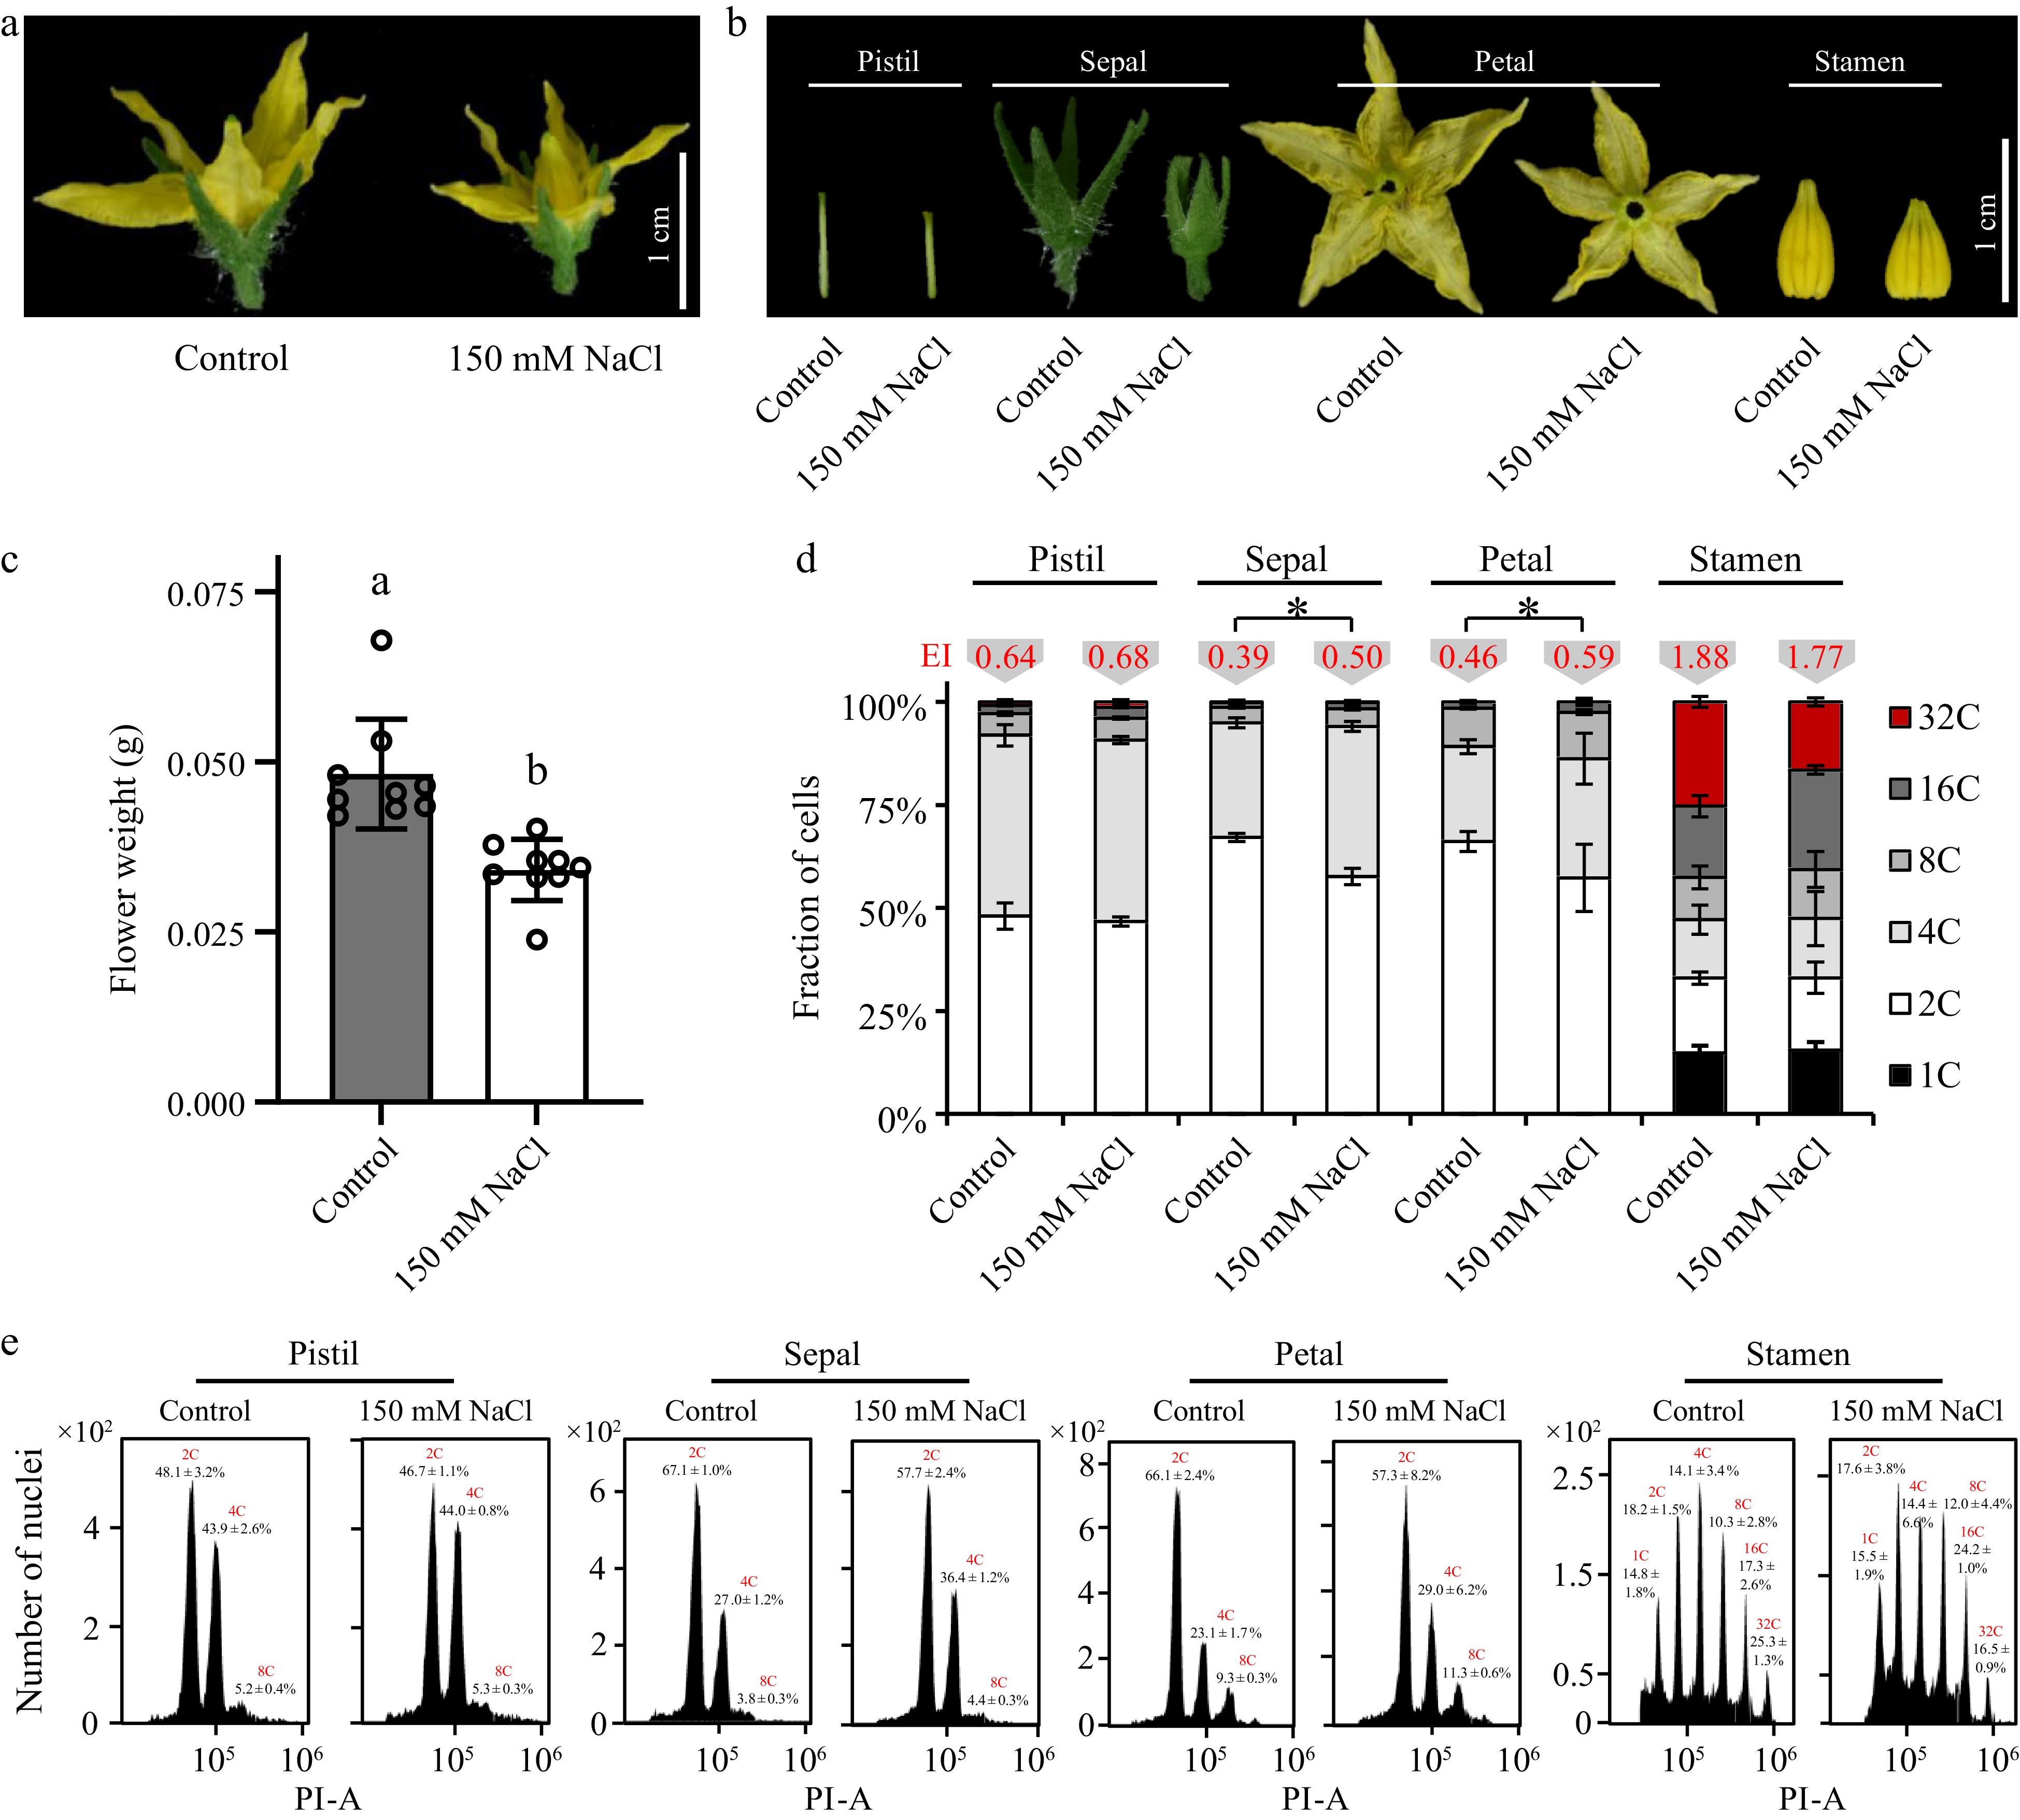
Figure 4.
Effects of salt stress on the cell cycle progress in various tomato floral tissues. Phenotypes of (a) the whole tomato floral organ and (b) various floral tissues treated with 150 mM NaCl. (c) Fresh weight of tomato floral organs treated with 150 mM NaCl. (d) Nuclear DNA ploidy distribution in sepals, petals, pistil and stamen of tomato flower. 4C, 8C, 16C, and stand for the endoreduplicated nuclei. Endocycle index (EI) values in red are located on the top of the columns. The present data represents the average values from at least three biological replicates, with error bars indicating the standard error. Statistical analysis was performed using DPS software, and differences between treatments were considered statistically significant when denoted by distinct letters above the bars, as determined by the LSD Test (p < 0.05). (e) Flow-cytometric analysis of endopolyploidy in various floral tissues.
-
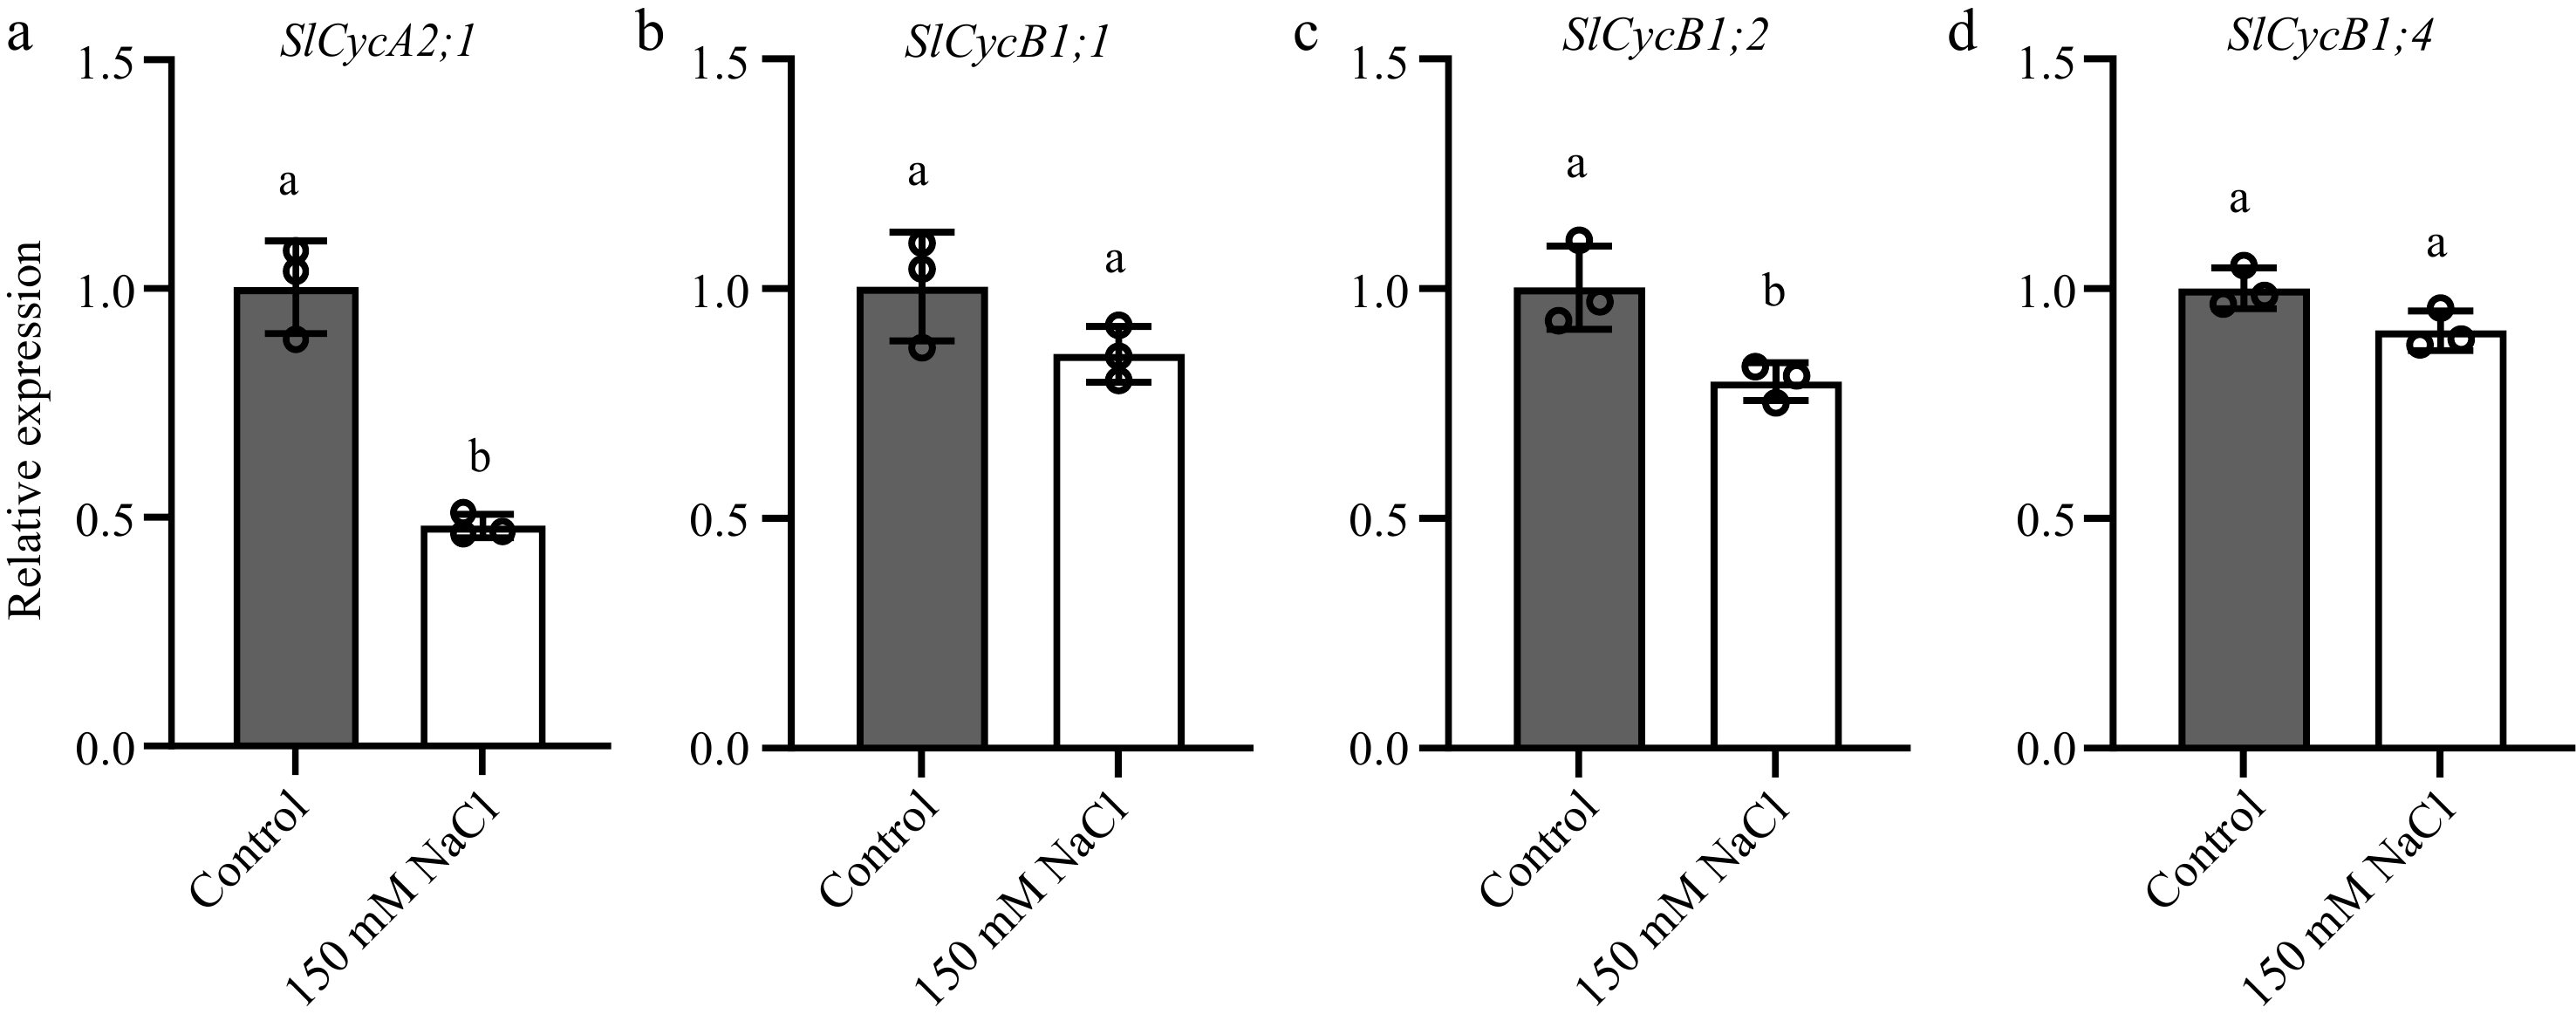
Figure 5.
Salt stress reduces the transcription of SlCycA2;1, SlCycB1;1, SlCycB1;2 and SlCycB1;4 in tomato floral organs. Transcript abundance of (a) SlCycA2;1, (b) SlCycB1;1, (c) SlCycB1;2 and (d) SlCycB1;4 in tomato floral organs. The present data represents the average values from three biological replicates, with error bars indicating the standard error. Statistical analysis was performed using DPS software, and differences between treatments were considered statistically significant when denoted by distinct letters above the bars, as determined by the LSD Test (p < 0.05).
-
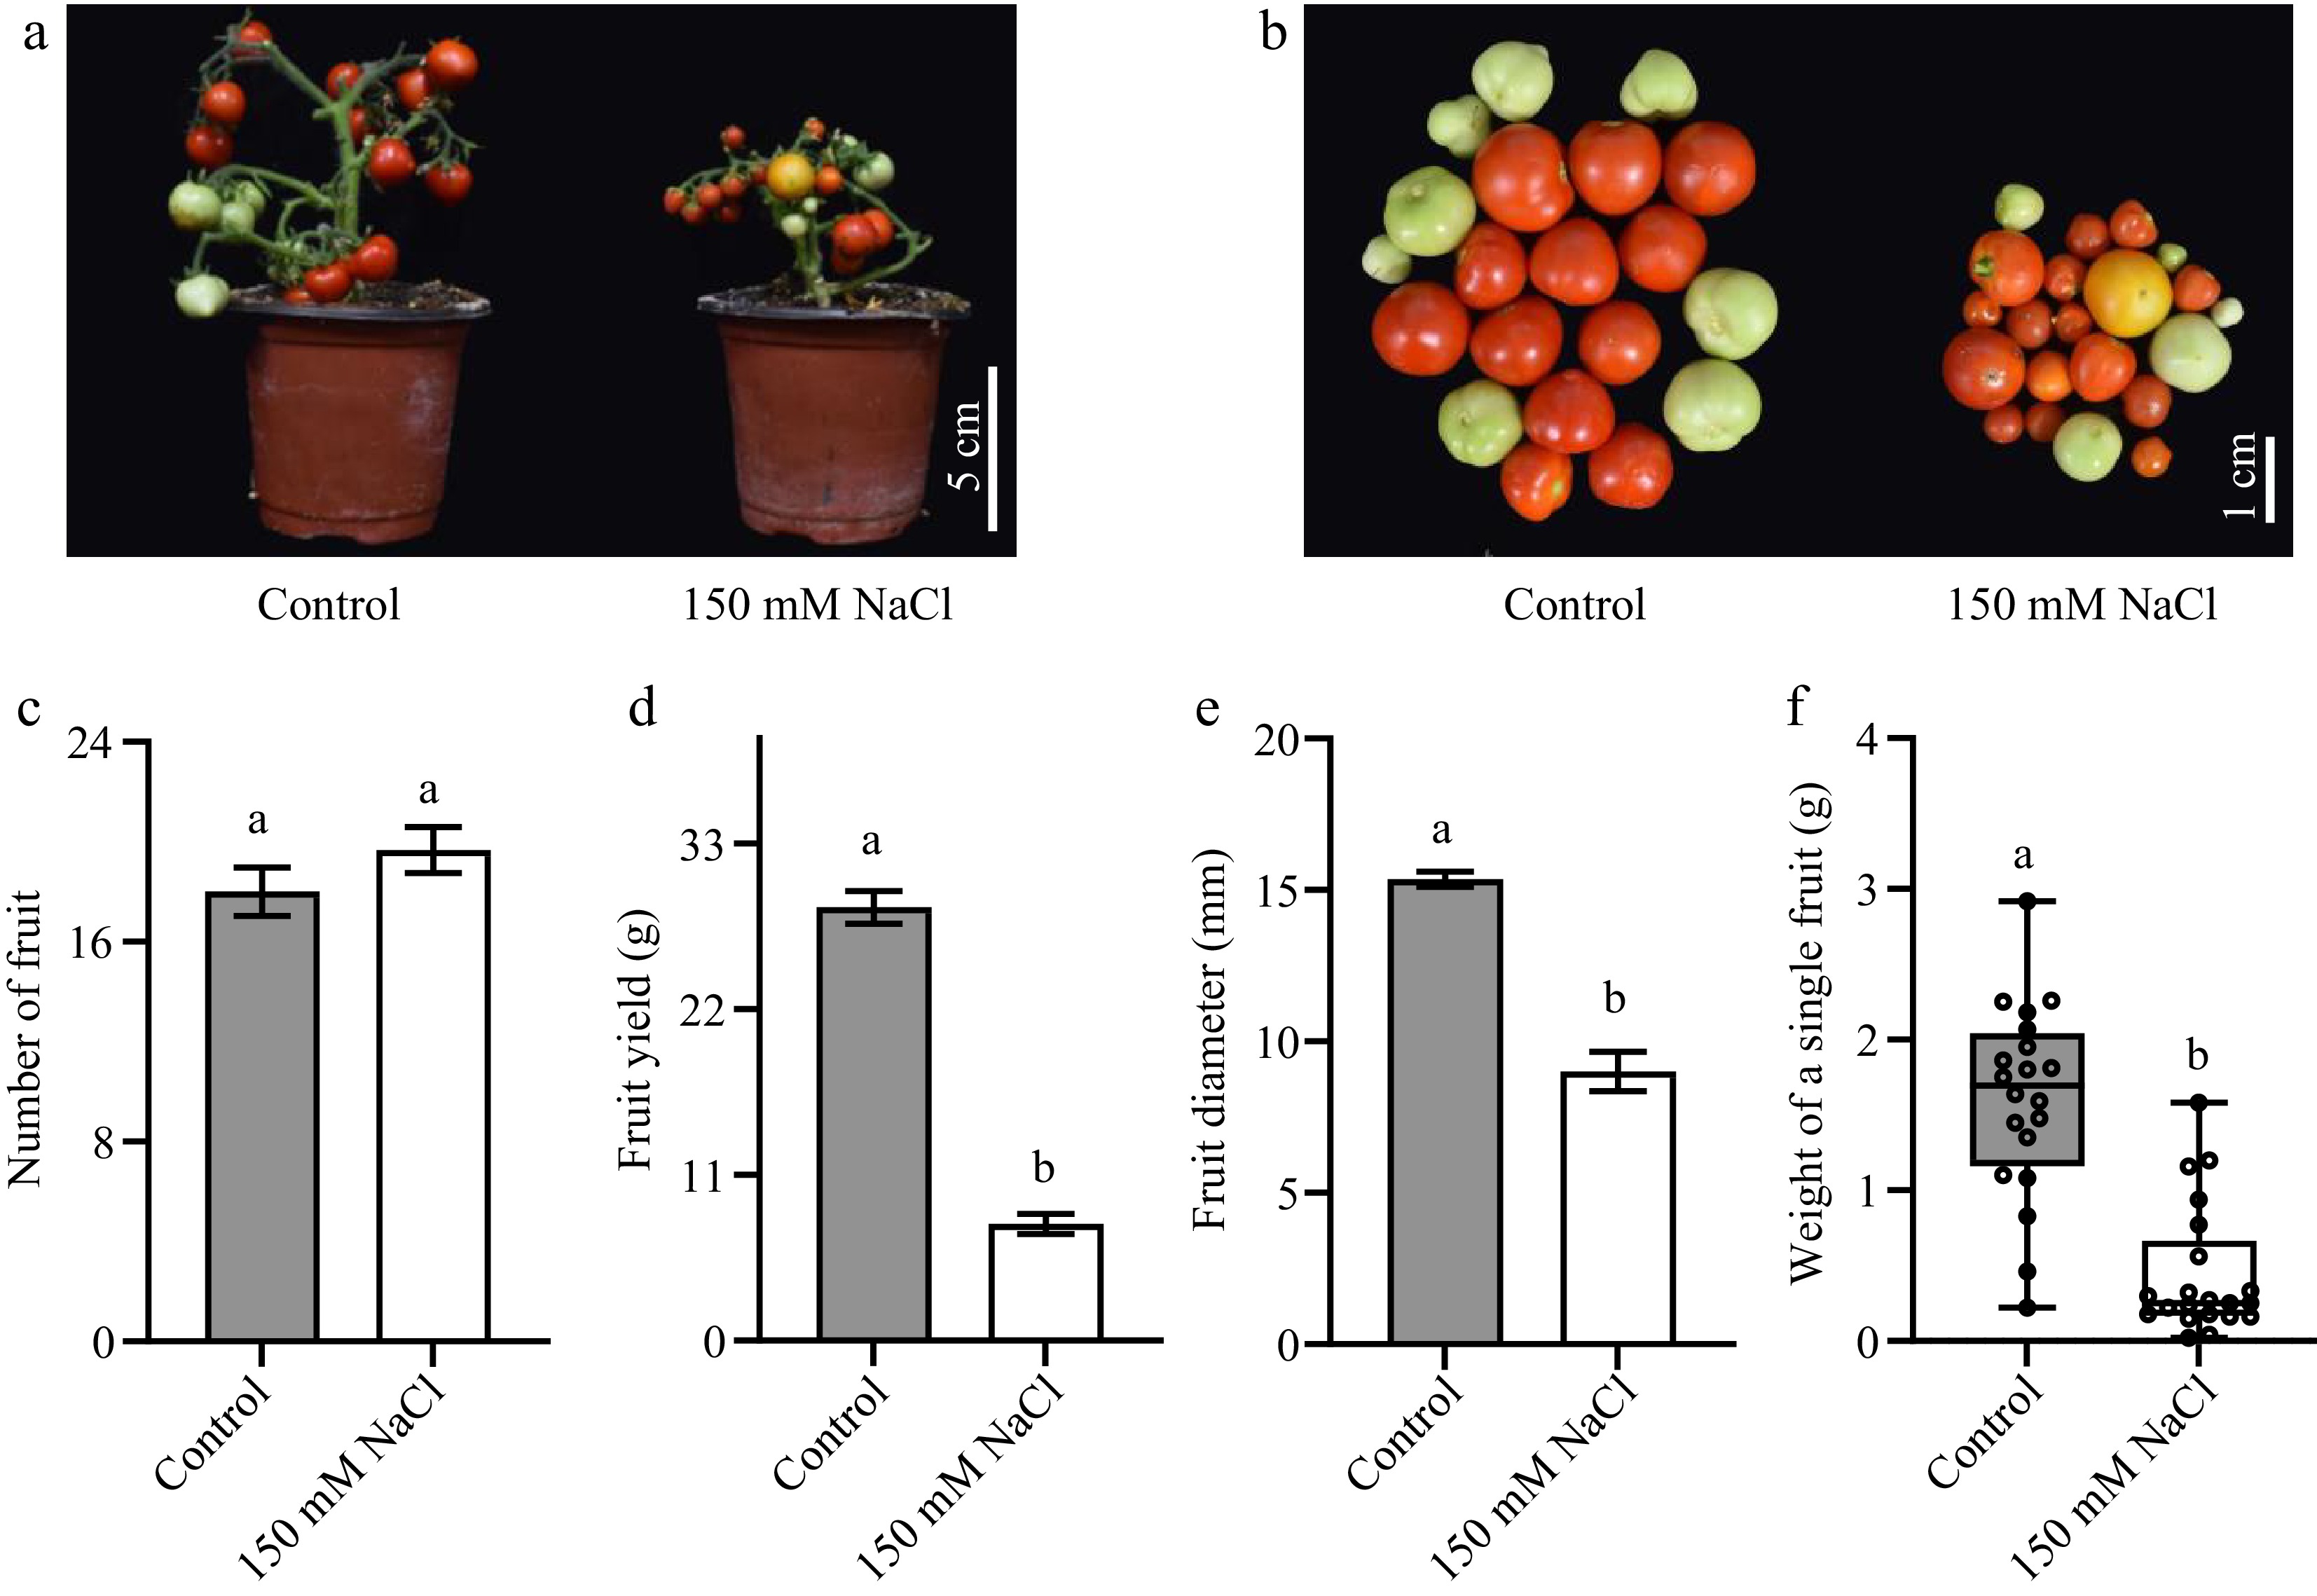
Figure 6.
The impacts of salt stress on tomato fruit yield. (a), (b) Photos of tomato fruits under normal growth conditions and salt stress. (c) The total fruit number of a single tomato seedling. (d) The total yield of a single tomato seedling. (e) The cross-sectional diameter of tomato fruits. (f) The weight of a single fruit. The present data represents the average values from at least six biological replicates, with error bars indicating the standard error. Statistical analysis was performed using DPS software, and differences between treatments were considered statistically significant when denoted by distinct letters above the bars, as determined by the LSD Test (p < 0.05).
-
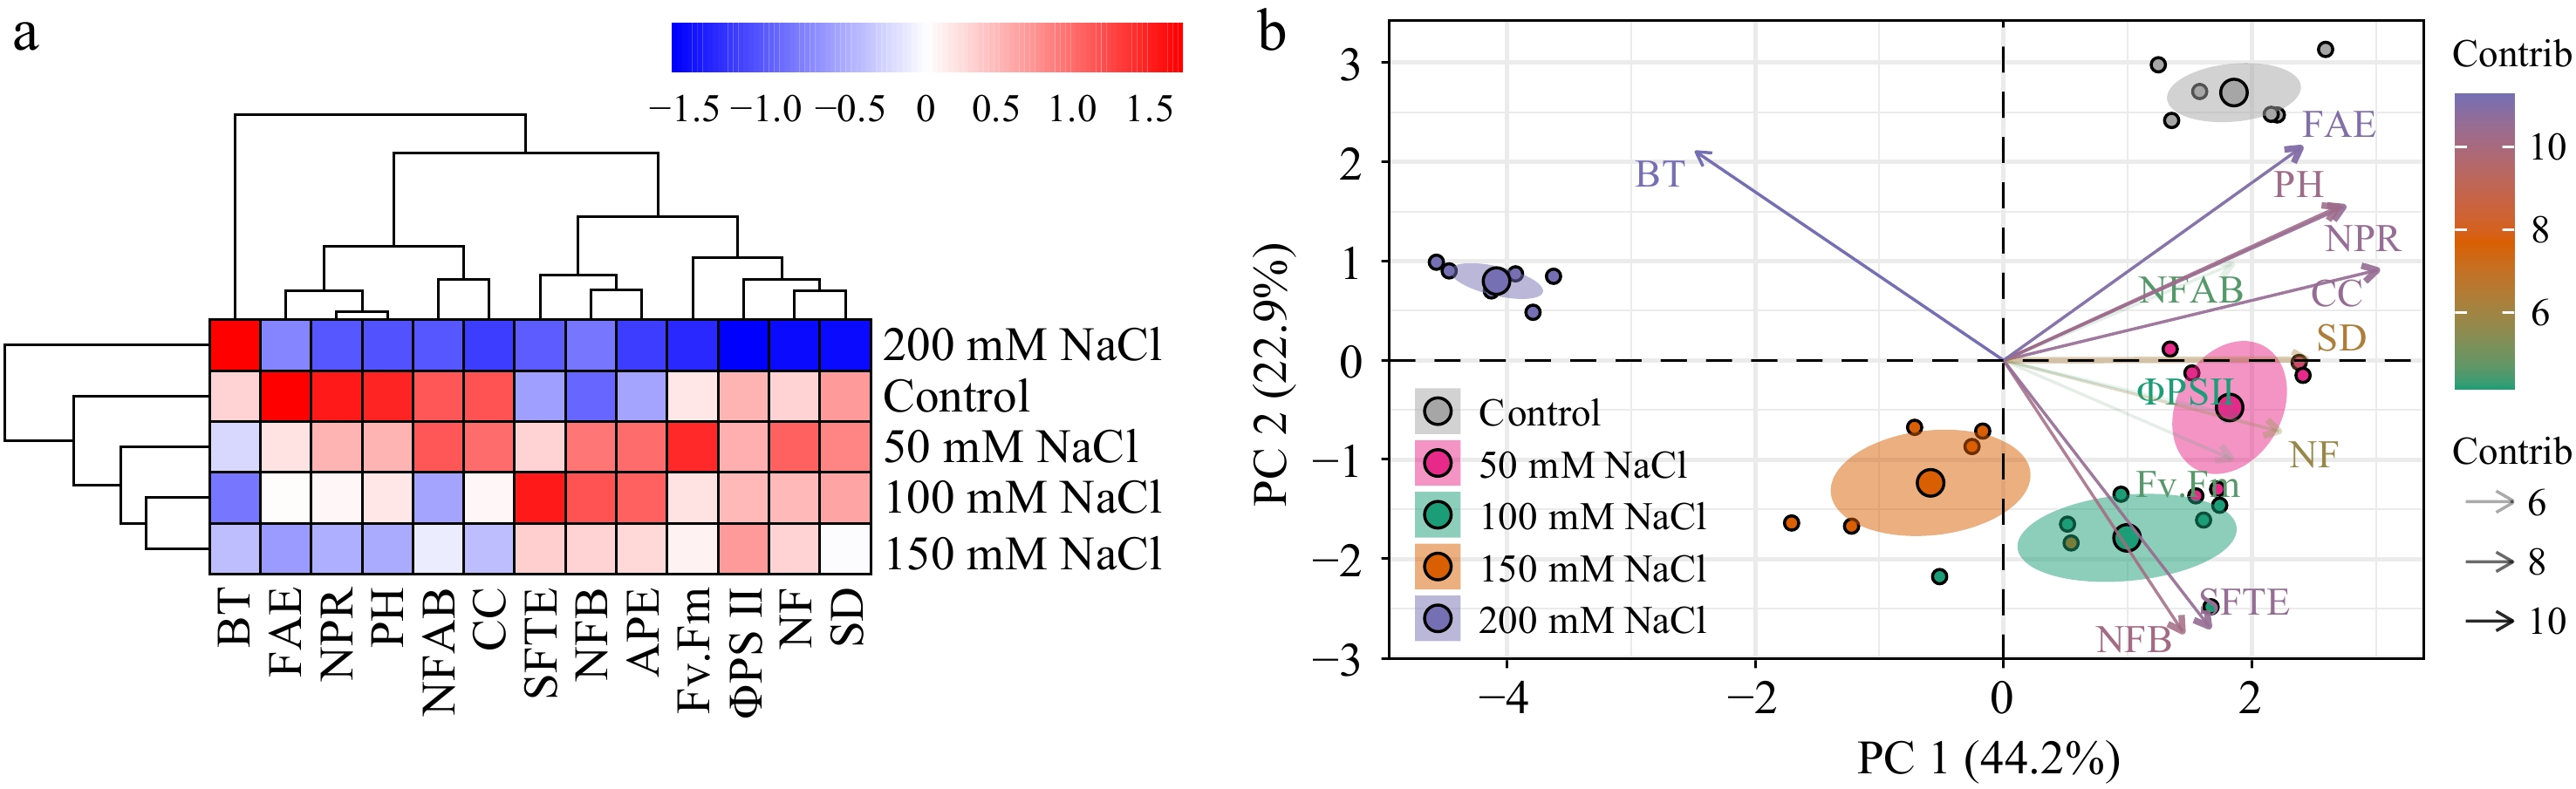
Figure 7.
Clustering analysis and PCA of physiological parameters in tomato seedlings under salt stress. (a) Clustering analysis and (b) PCA were employed to analyze the phenotypic data collected from tomato seedlings treated with NaCl solutions for 3 weeks. NF, Number of flowers; NFAB, The number of flowers on a branch; NFB, Number of flowering branches; CC, chlorophyll content; NPR, net photosynthetic rate; AWC, aboveground water content; PH, plant height; SD, stem diameter; BT, bloom time; ΦPSII, the effective photochemical quantum yield of PSII; Fv.Fm, the maximum photochemical quantum yield of PSII; FAE, relative expression of SlFA; SFTE, relative expression of SlSFT; APE, relative expression of SlAP1. Data analysis was carried out via R programming.
Figures
(7)
Tables
(0)