-
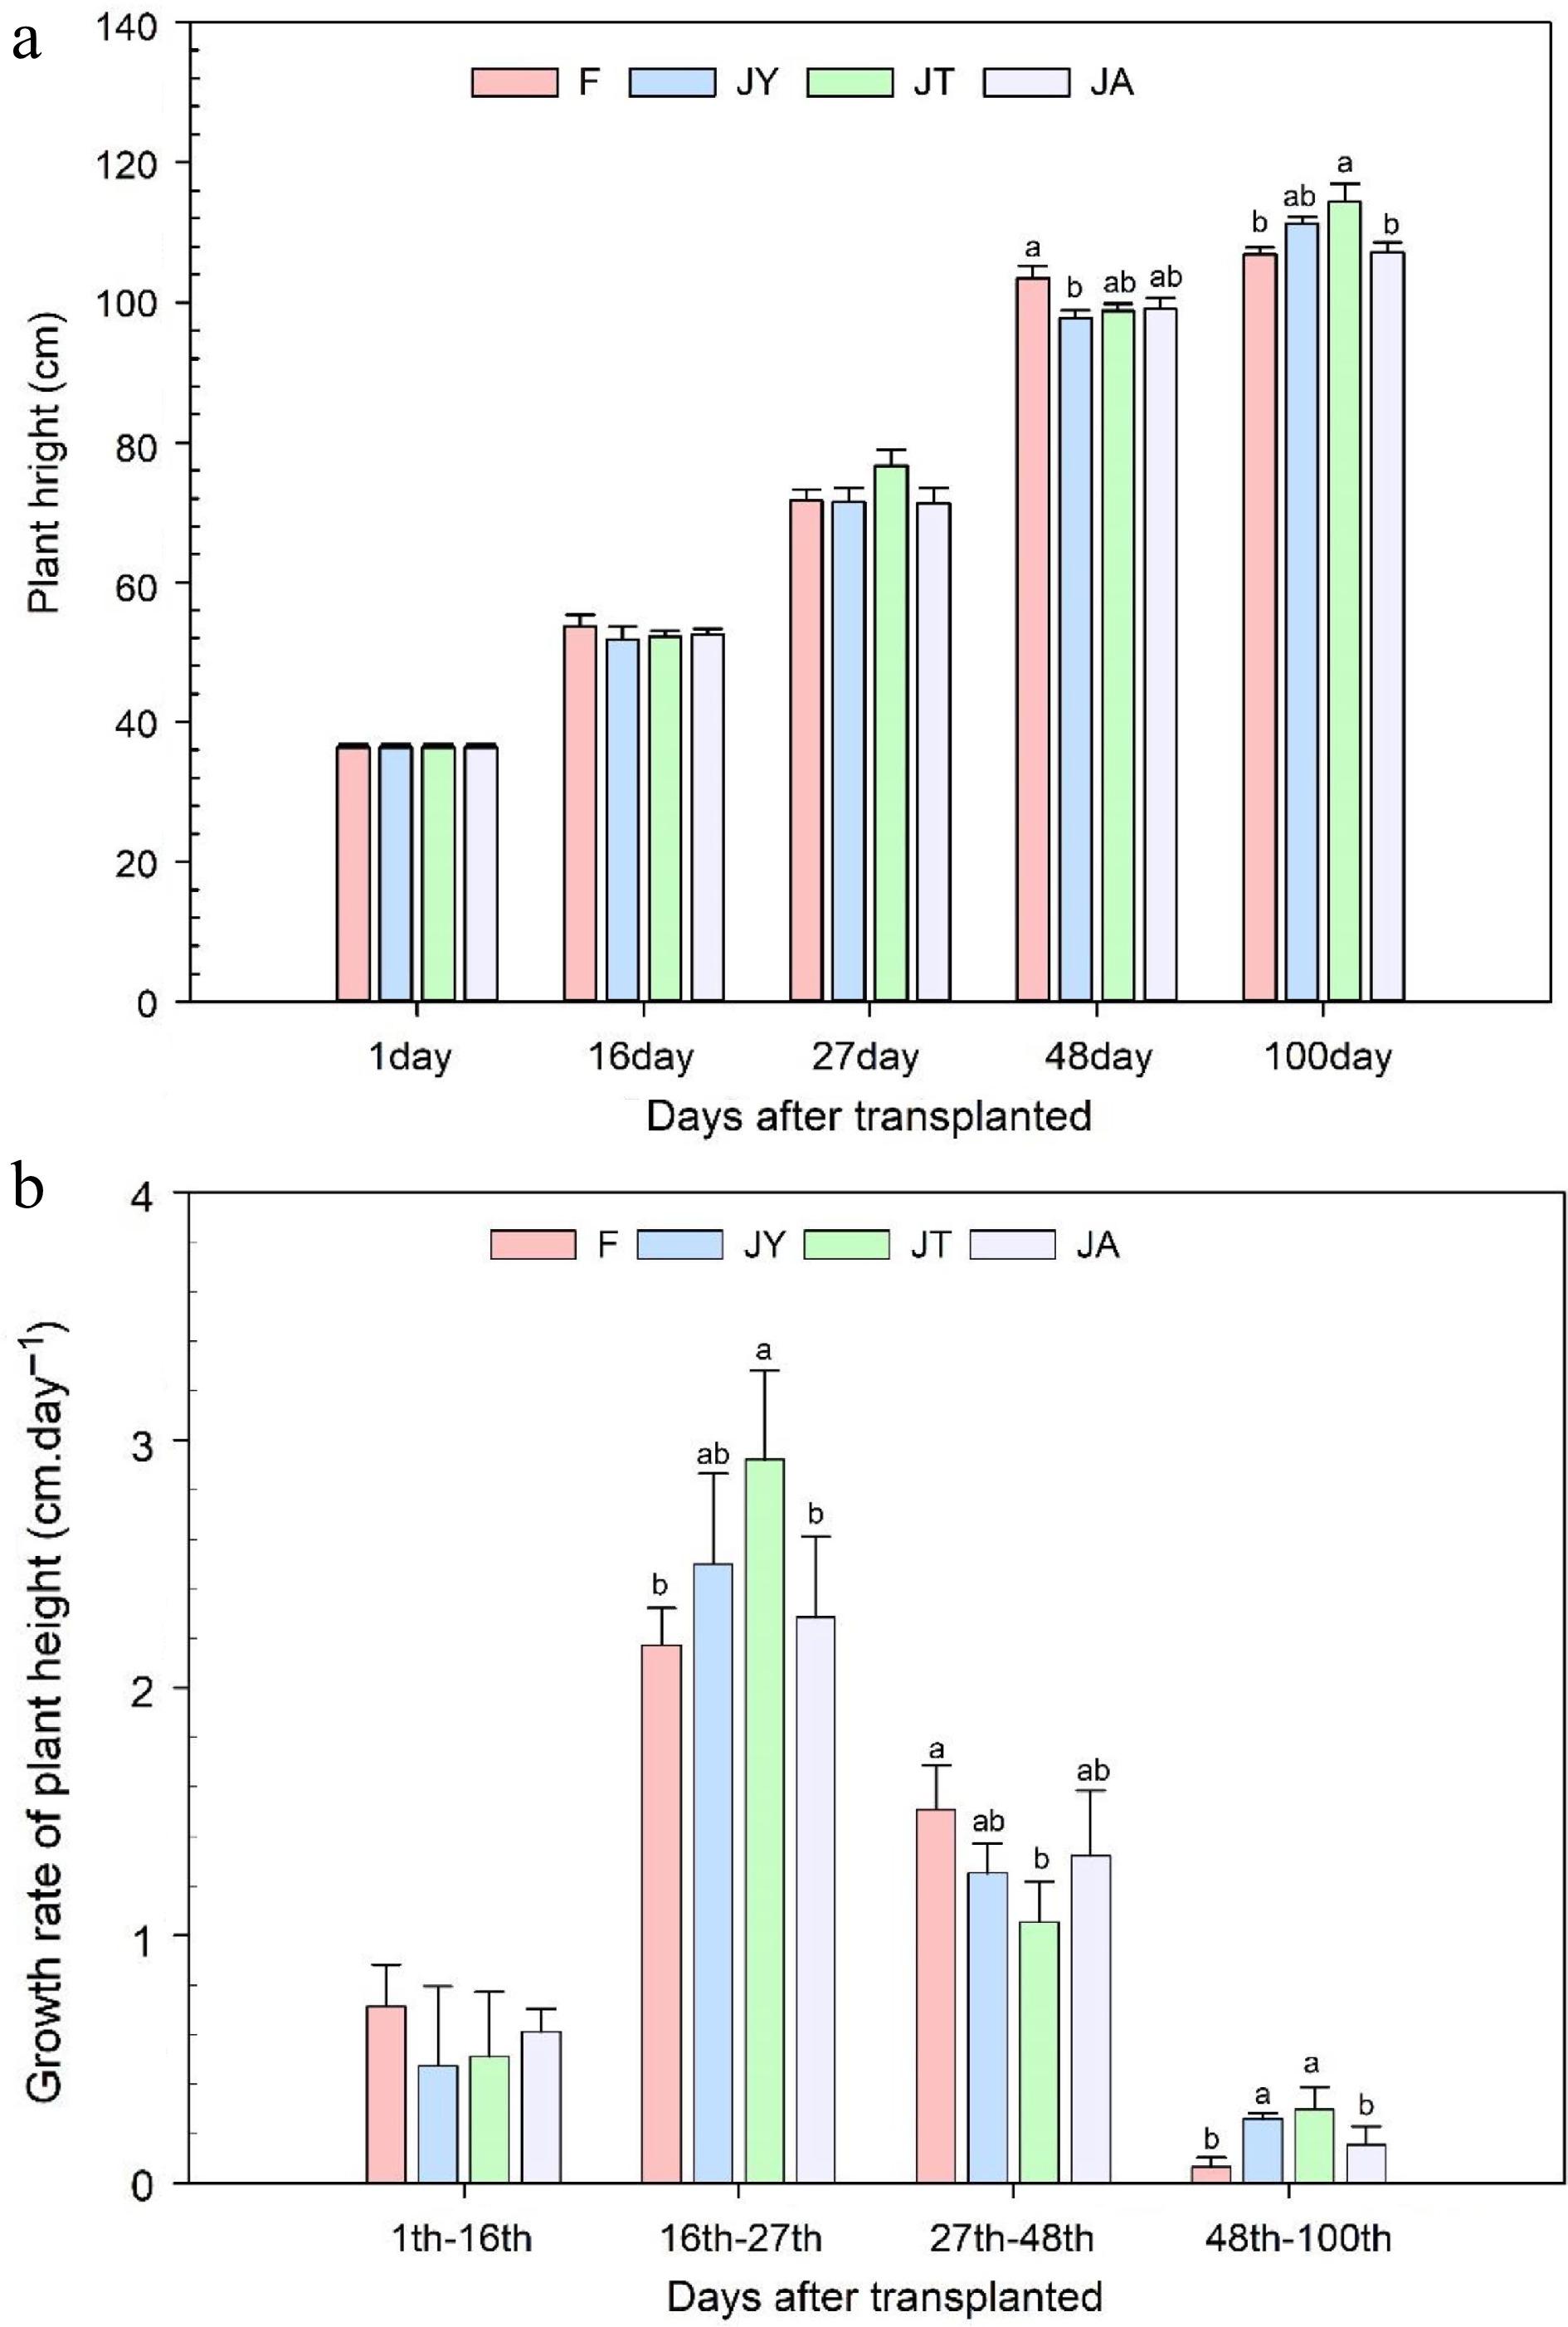
Figure 1.
(a) Rice plant height at the time of transplanting and after 16, 27, 48, and 100 d of transplanting and (b) growth rate during these growing periods. Note: F is chemical fertilizer treatment; JA is the liquid Jiaosu for soil treatment, liquid Jiaosu for leaf treatment, and solid Jiaosu for soil treatment; JT is the treatment of the liquid and solid Jiaosu for soil treatment; JY is liquid Jiaosu for leaf treatment and solid Jiaosu for soil treatment.
-
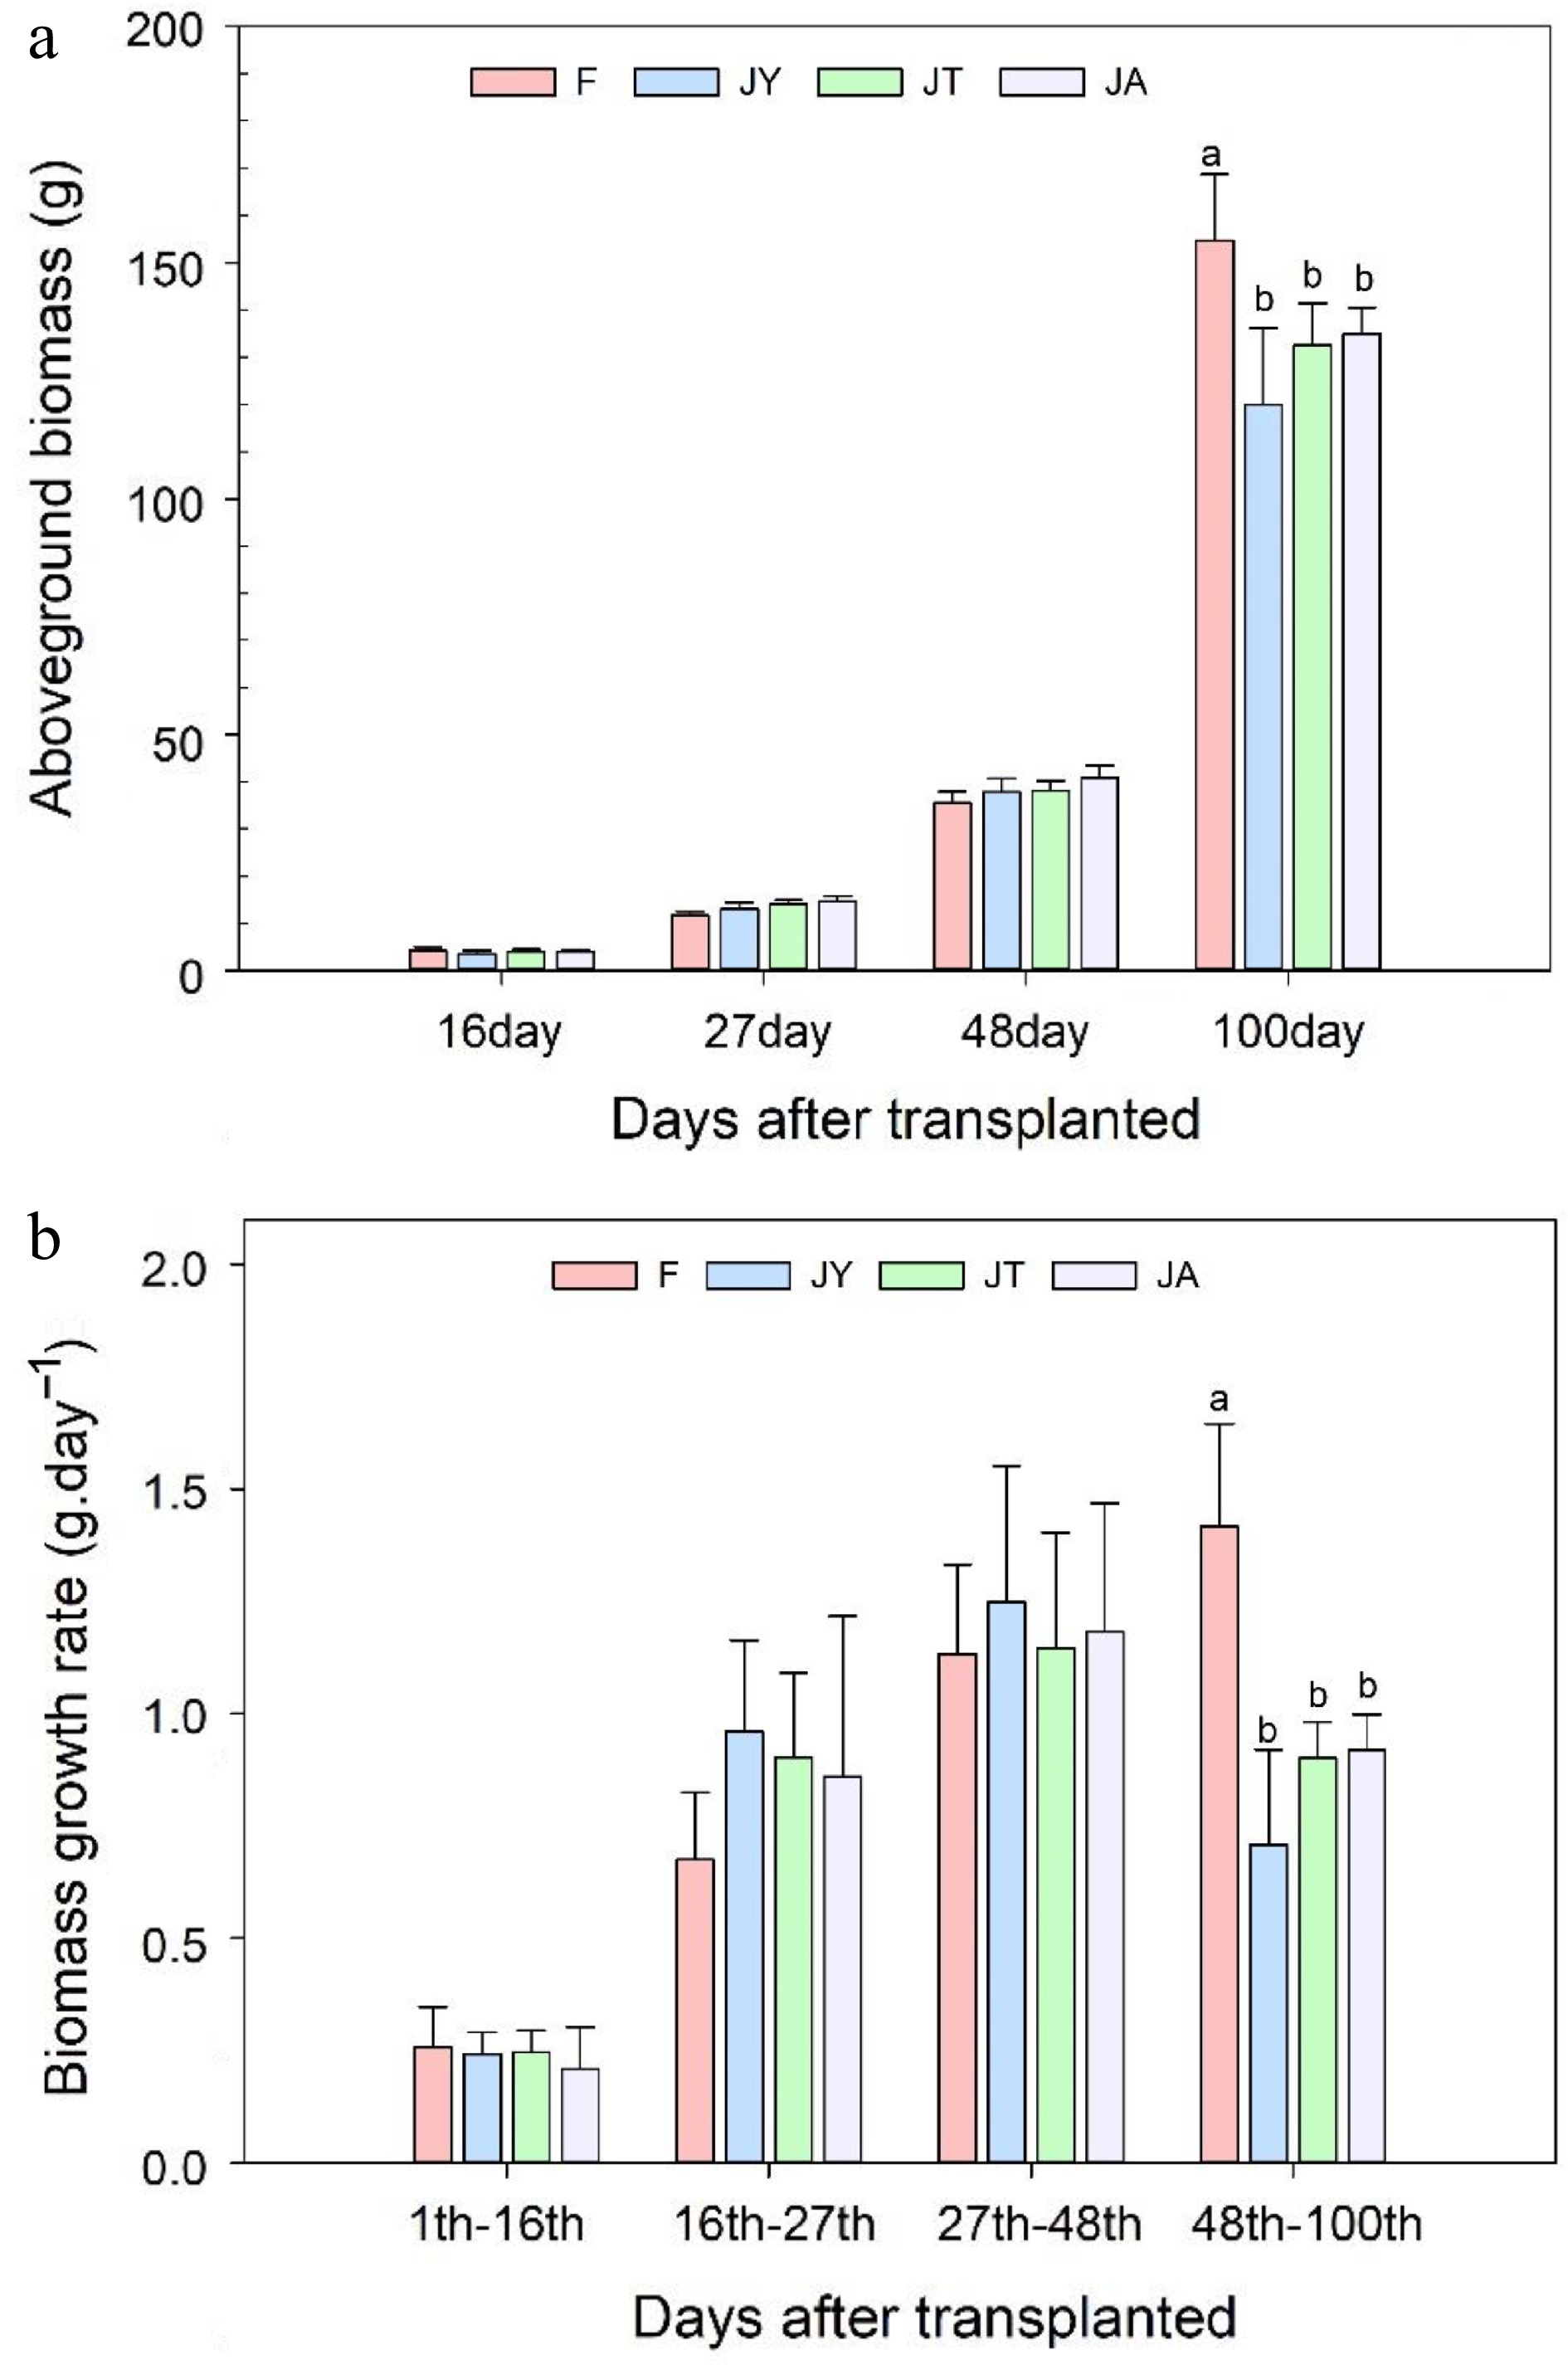
Figure 2.
(a) Aboveground biomass of rice after 16, 27, 48, and 100 d of transplanting and (b) biomass growth rates during these growth periods. Note: F is chemical fertilizer treatment; JA is the liquid Jiaosu for soil treatment, liquid Jiaosu for leaf treatment, and solid Jiaosu for soil treatment; JT is the treatment of the liquid and solid Jiaosu for soil treatment; JY is liquid Jiaosu for leaf treatment and solid Jiaosu for soil treatment.
-
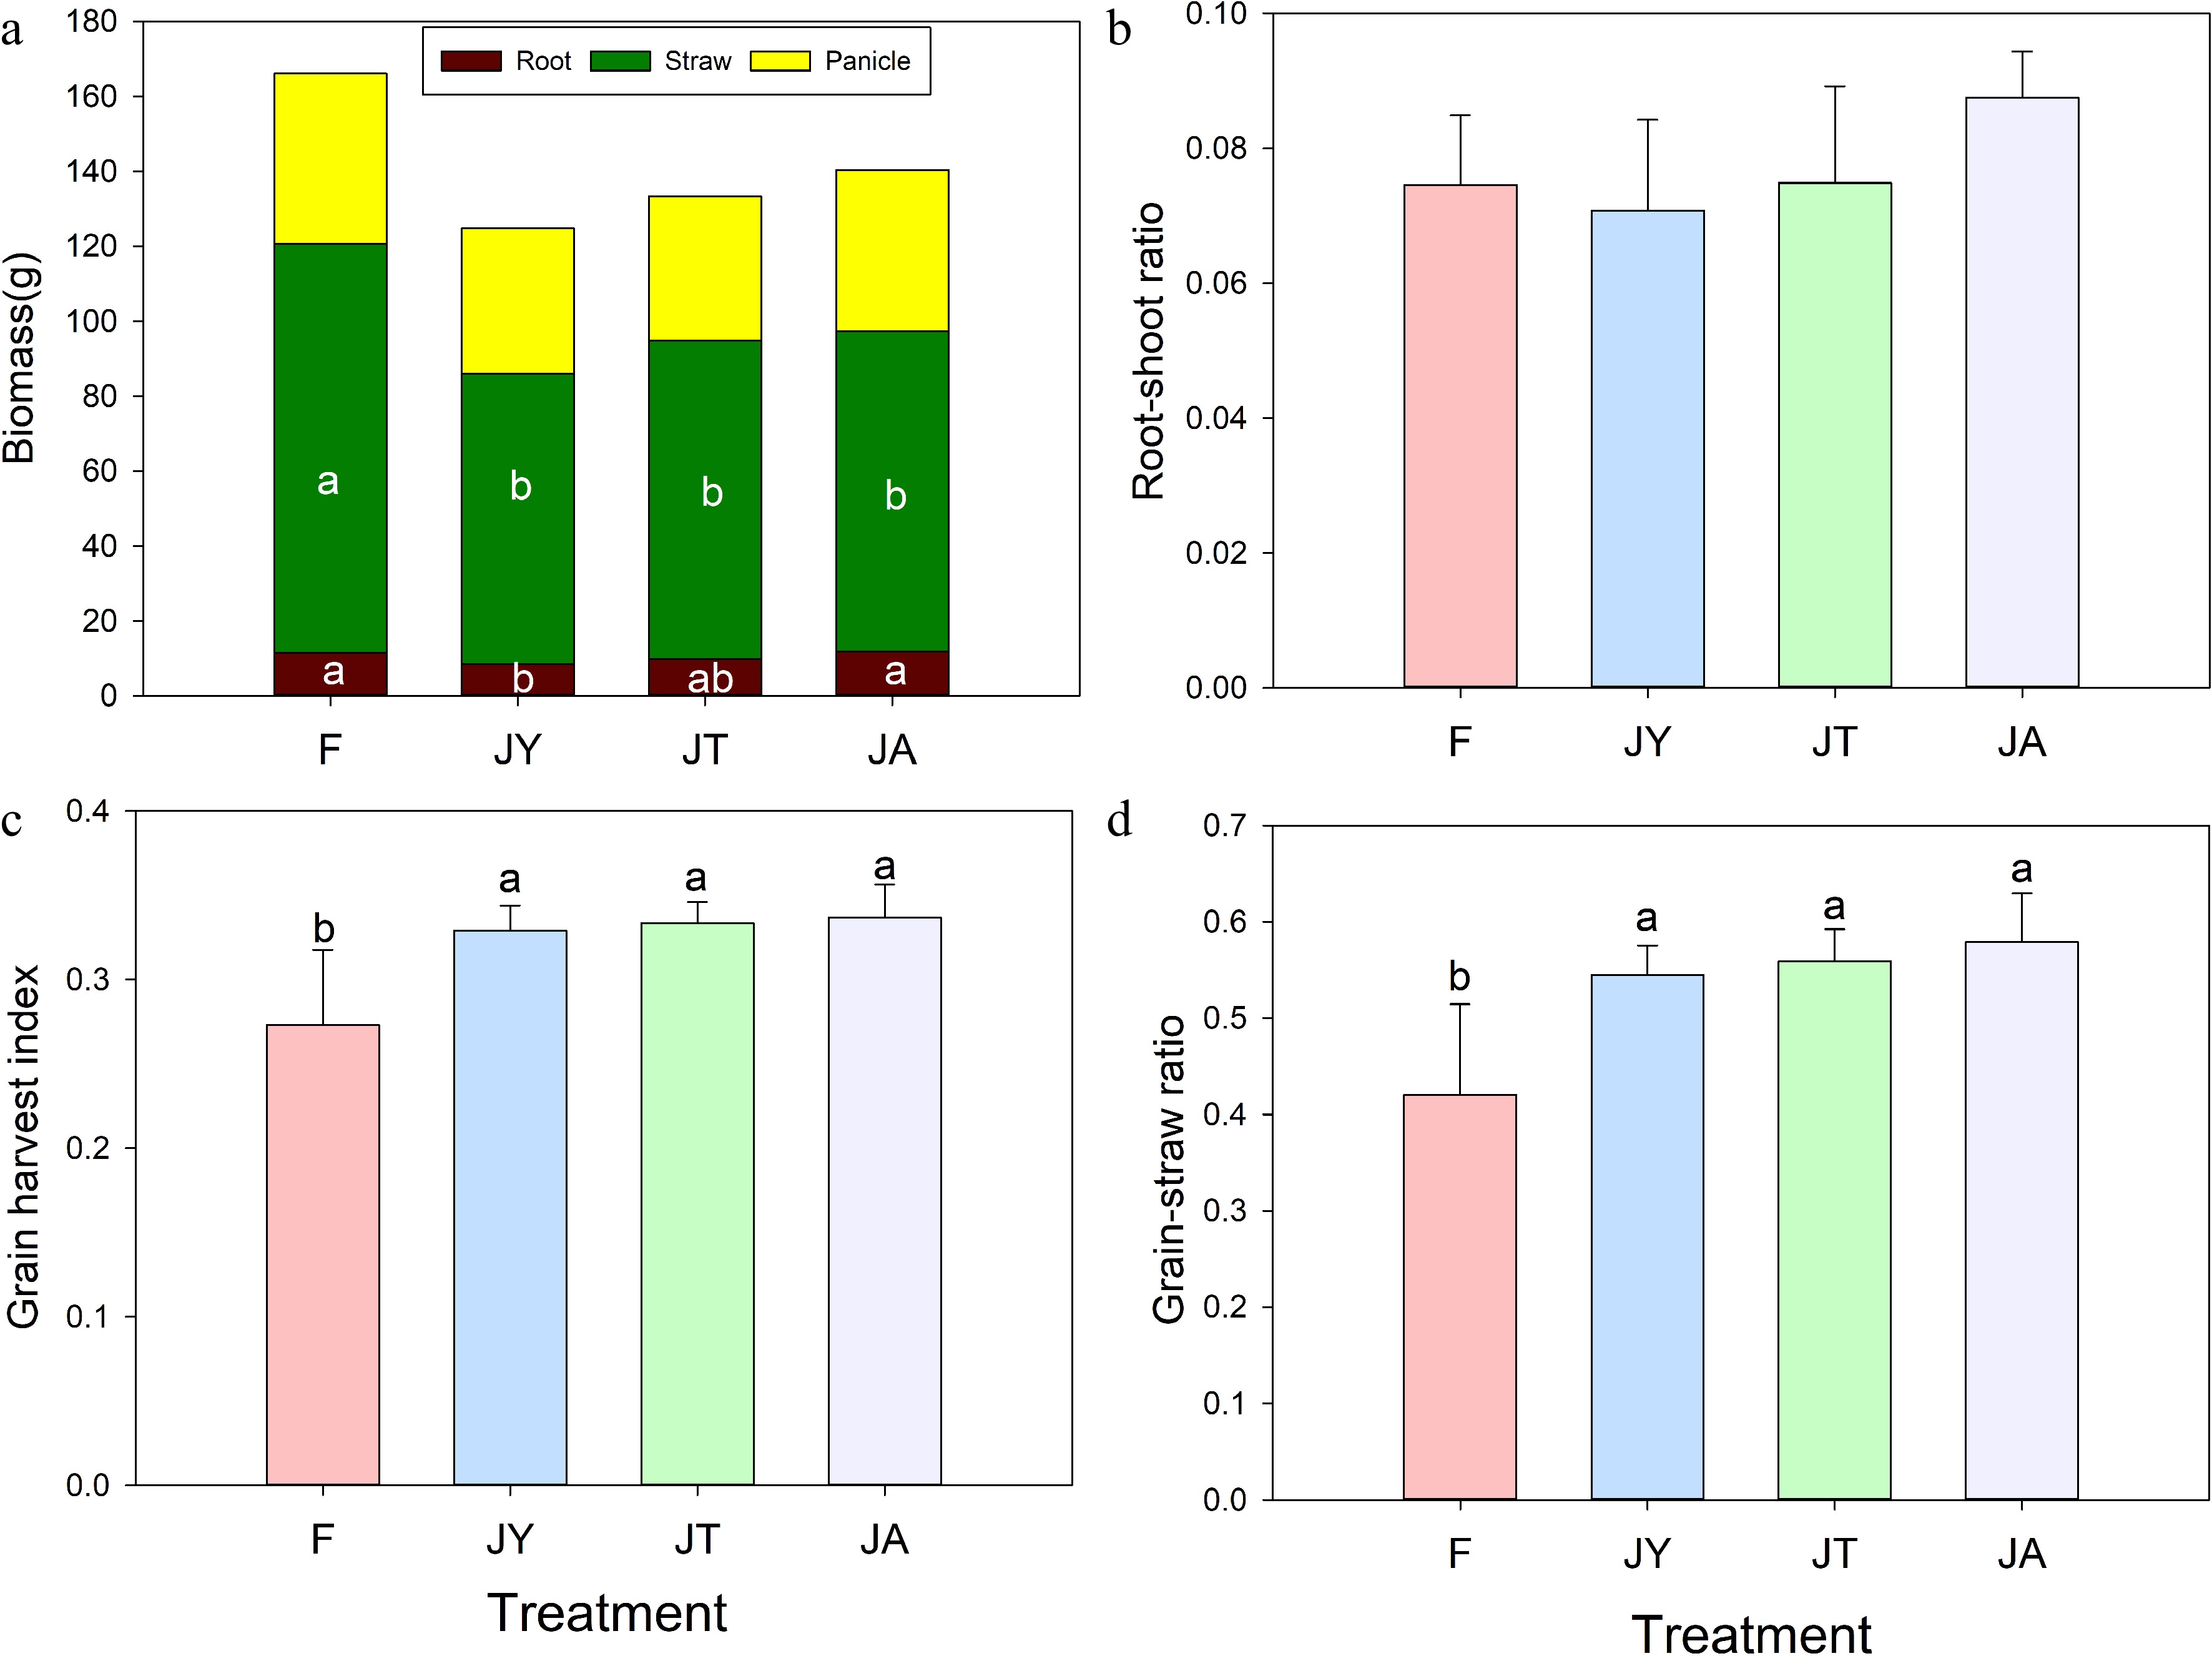
Figure 3.
(a) Total plant biomass, (b) root-shoot ratio, (c) grain harvest index, (d) grain-straw ratio at harvest stage of rice under different treatments. Note: F is chemical fertilizer treatment; JA is the liquid Jiaosu for soil treatment, liquid Jiaosu for leaf treatment, and solid Jiaosu for soil treatment; JT is the treatment of the liquid and solid Jiaosu for soil treatment; JY is liquid Jiaosu for leaf treatment and solid Jiaosu for soil treatment.
-
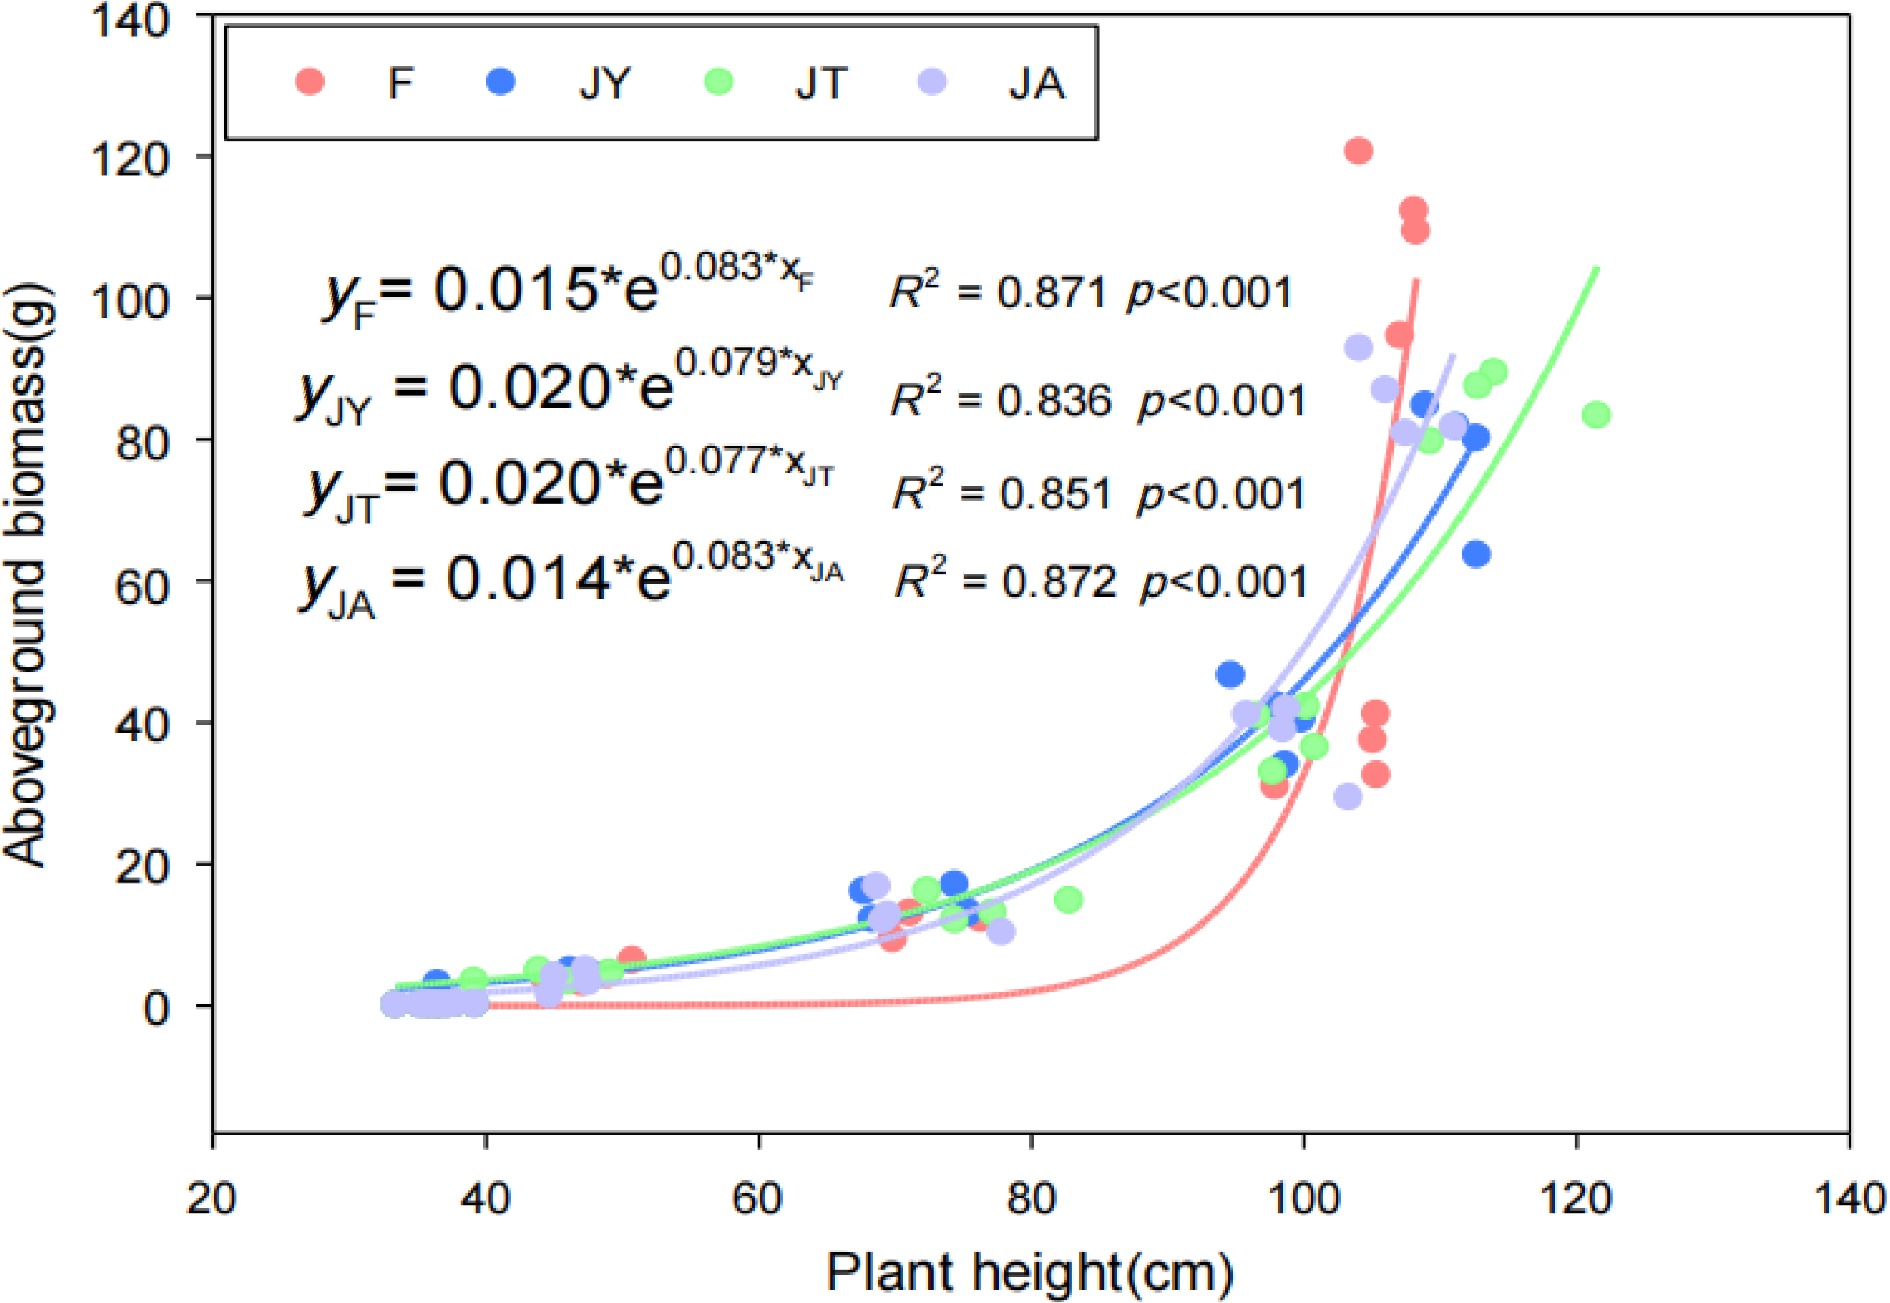
Figure 4.
Correlation between aboveground biomass and plant height. Note: F is chemical fertilizer treatment; JA is the liquid Jiaosu for soil treatment, liquid Jiaosu for leaf treatment, and solid Jiaosu for soil treatment; JT is the treatment of the liquid and solid Jiaosu for soil treatment; JY is liquid Jiaosu for leaf treatment and solid Jiaosu for soil treatment.
-
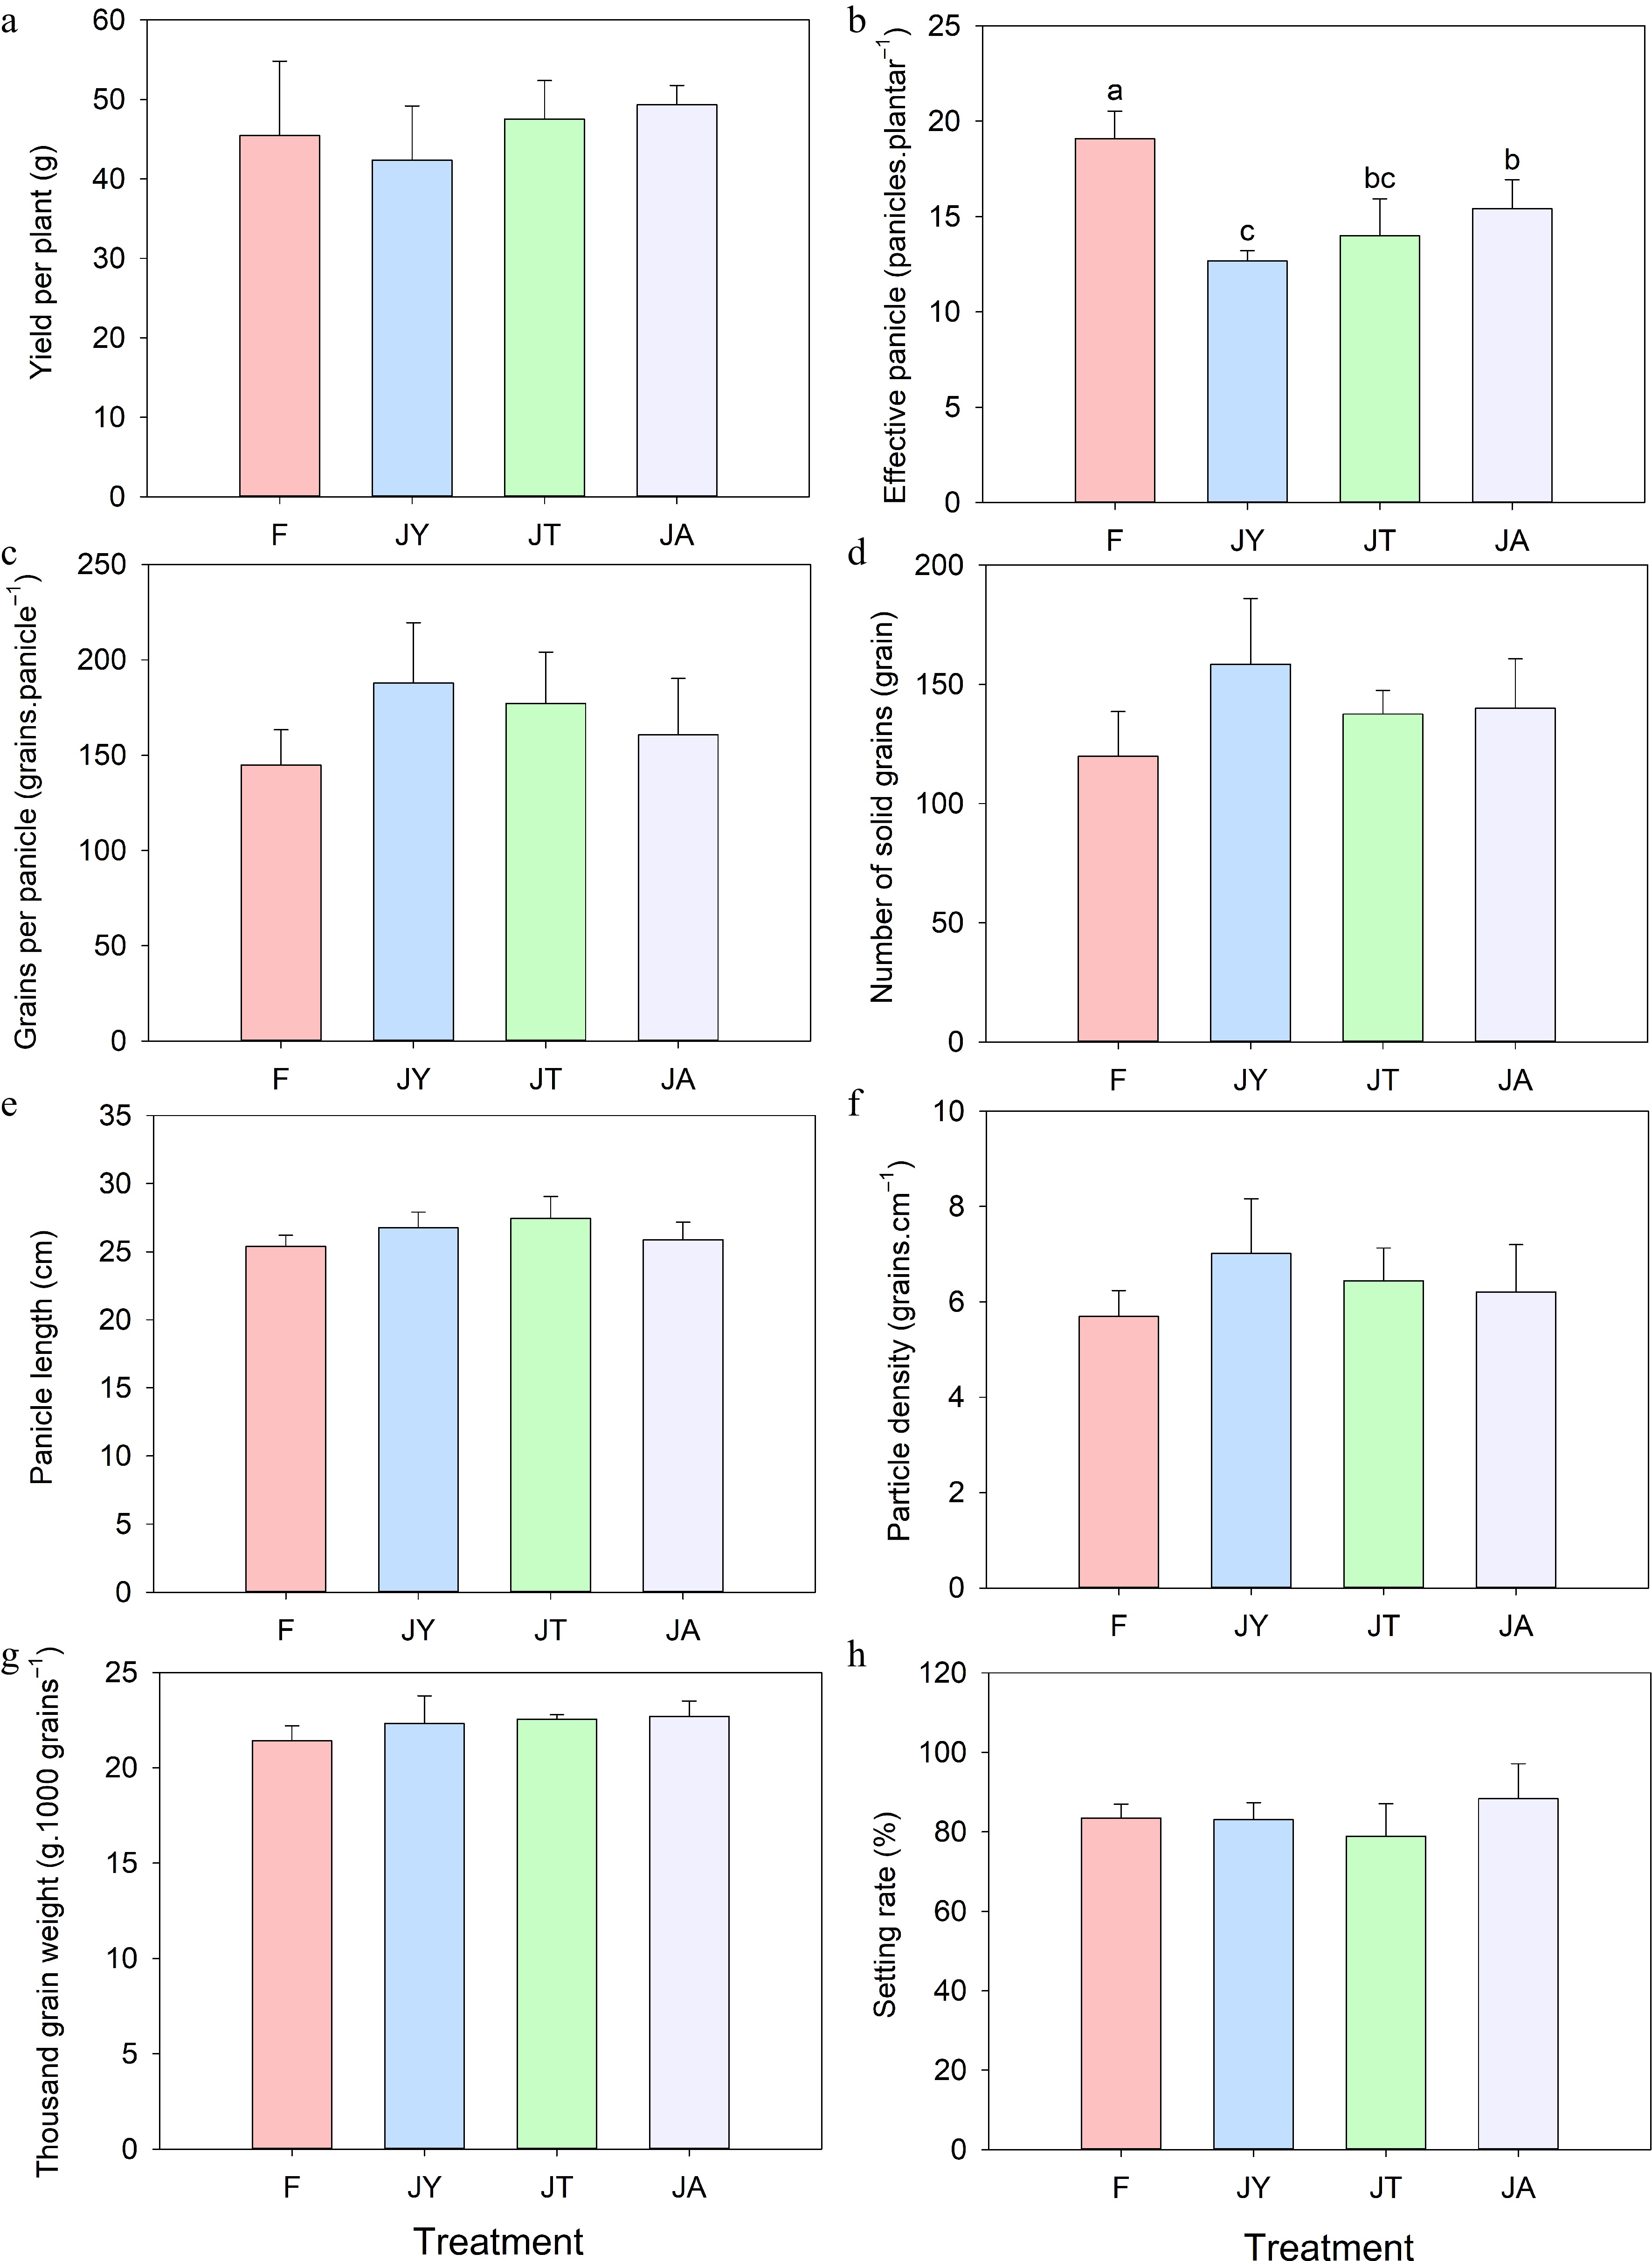
Figure 5.
Components of rice yield under different treatments: (a) Yield per plant, (b) effective panicle, (c) grains per panicle, (d) number of solid grains, (e) panicle length, (f) particle density, (g) thousand-grain weight, (h) setting rate. Note: F is chemical fertilizer treatment; JA is the liquid Jiaosu for soil treatment, liquid Jiaosu for leaf treatment, and solid Jiaosu for soil treatment; JT is the treatment of the liquid and solid Jiaosu for soil treatment; JY is liquid Jiaosu for leaf treatment and solid Jiaosu for soil treatment.
-
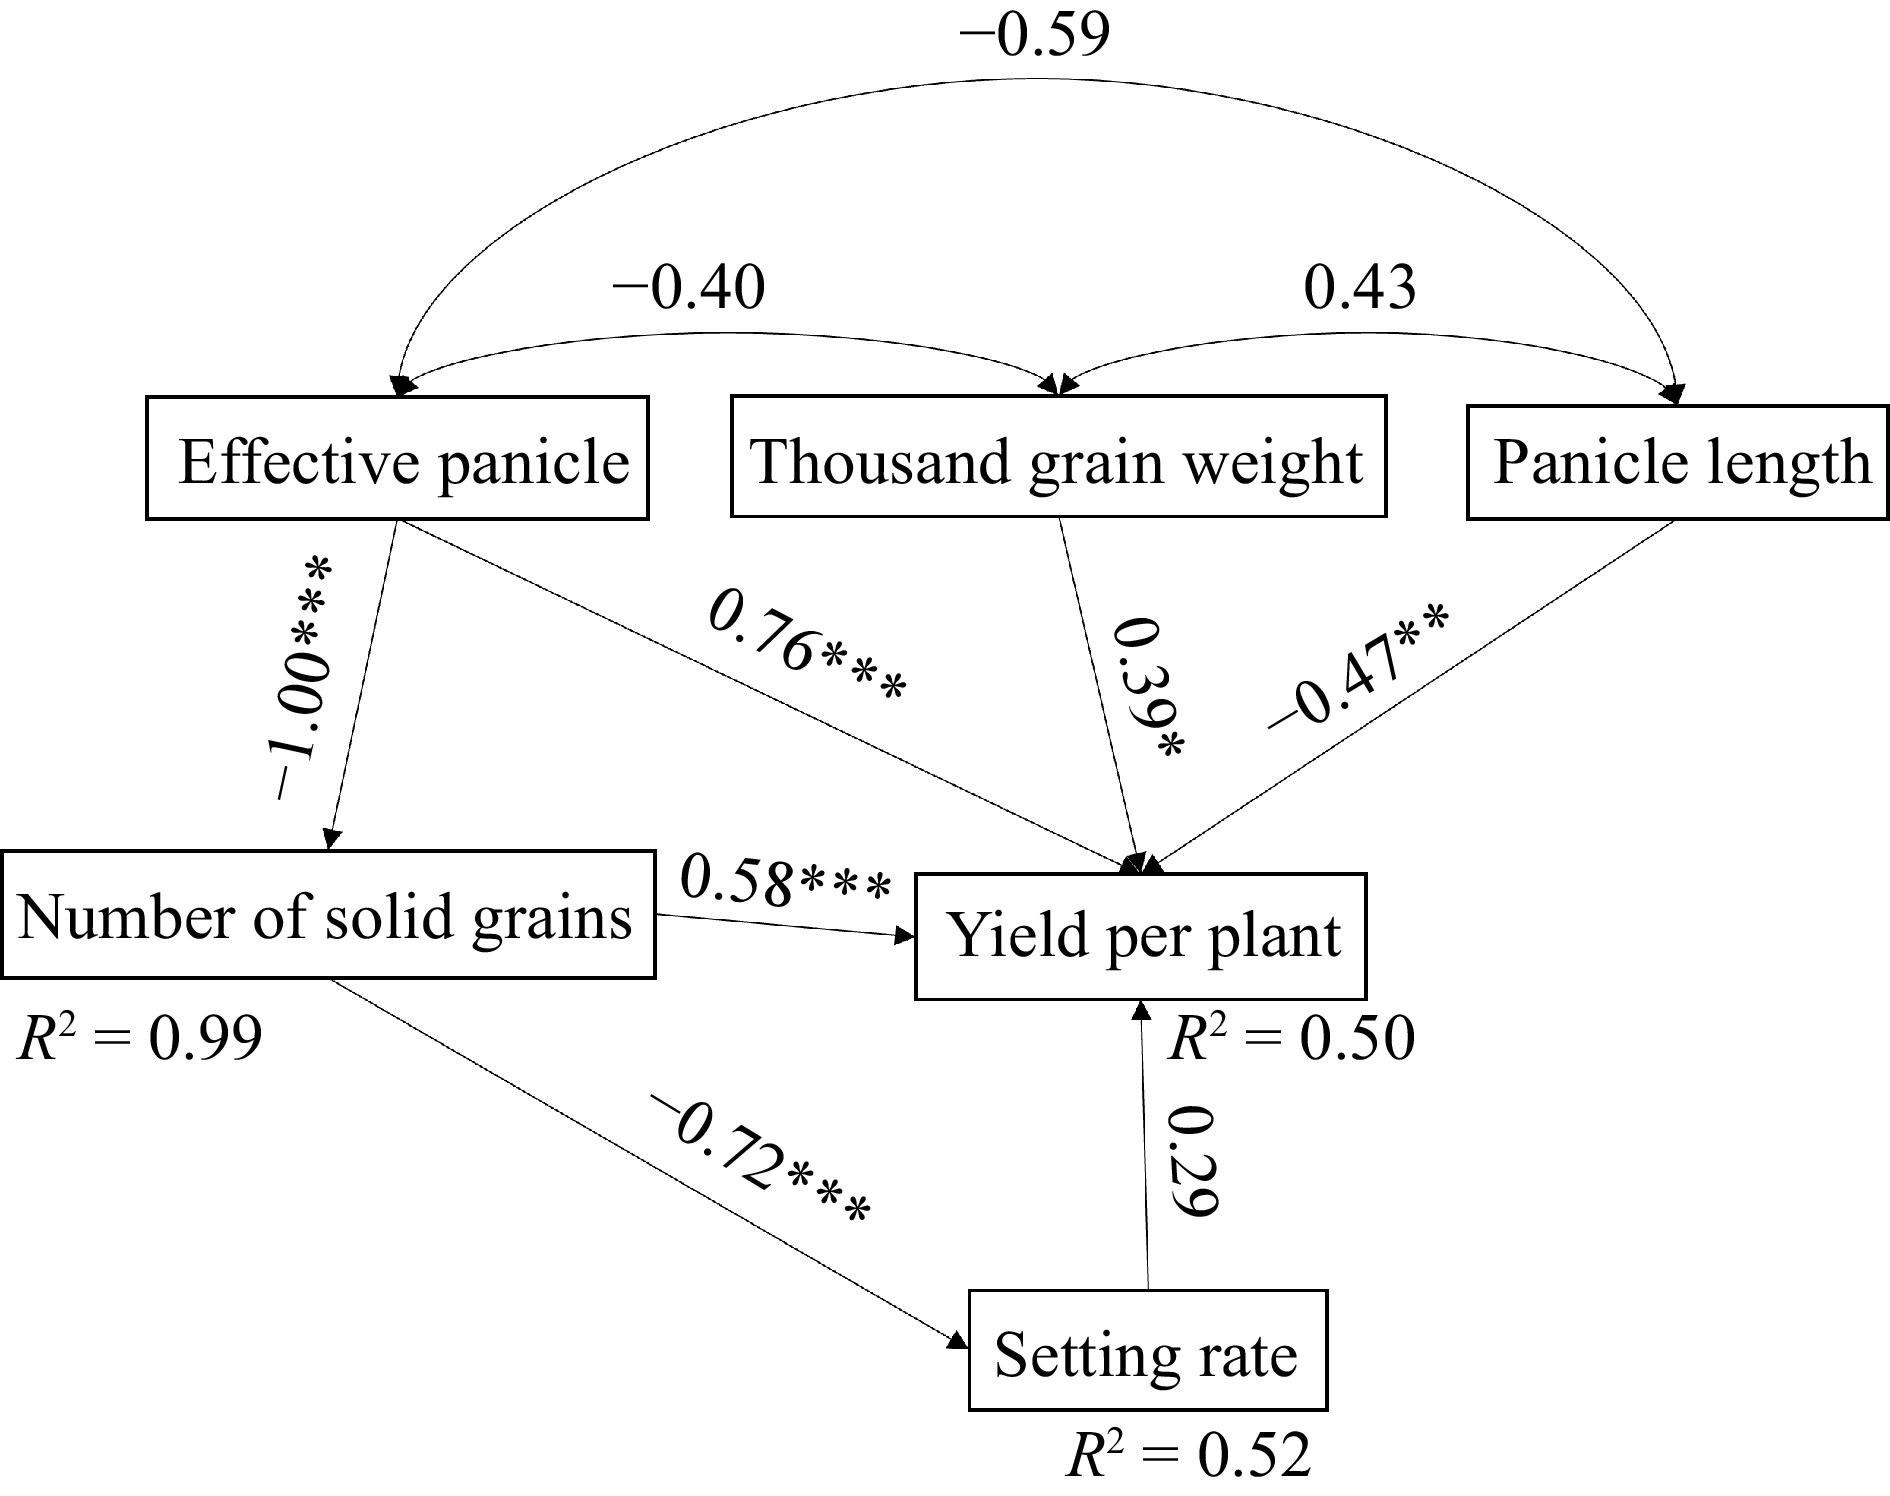
Figure 6.
Effect of yield components on yield per plant. Note: R² represent the proportion of variance explained by the variables in the model, and the arrow numbers represent the standard path coefficients. *, **, and *** indicate the statistically significant, highly significant, and extremely significant at p < 0.01, p < 0.05 and p < 0.001 level respectively.
-
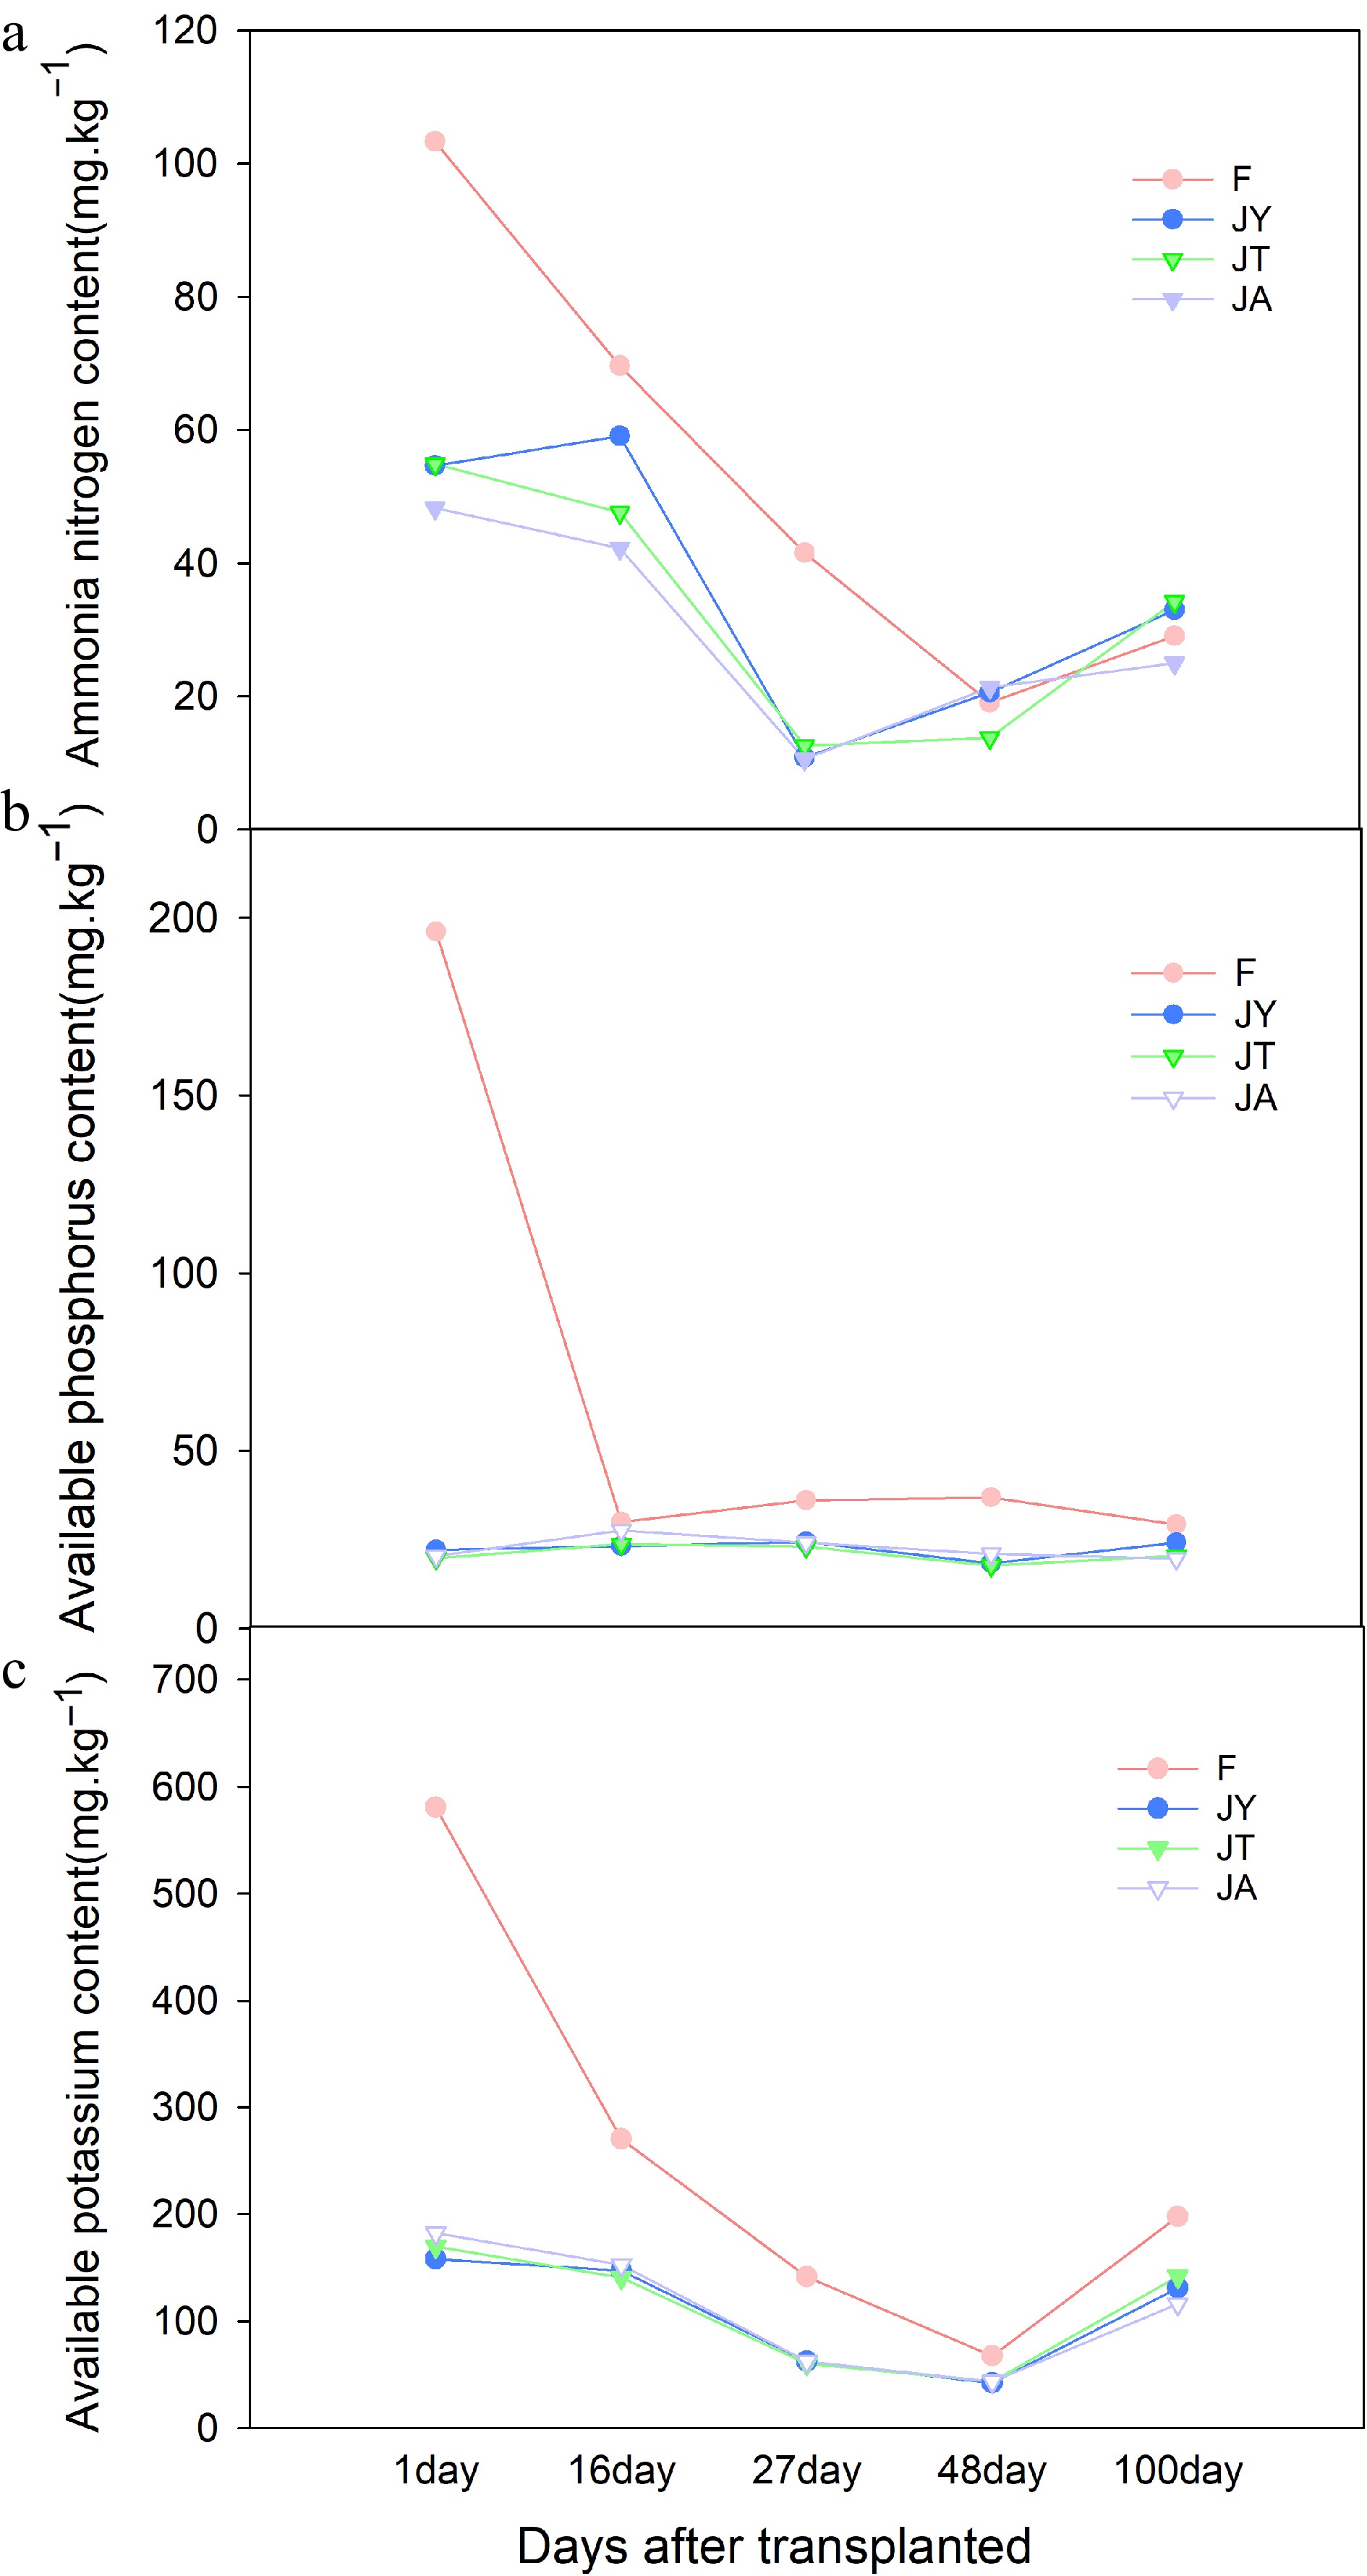
Figure 7.
Differences of soil available (a) nitrogen, (b) phosphorus, and (c) potassium content in different growth stages. Note: F is chemical fertilizer treatment; JA is the liquid Jiaosu for soil treatment, liquid Jiaosu for leaf treatment, and solid Jiaosu for soil treatment; JT is the treatment of the liquid and solid Jiaosu for soil treatment; JY is liquid Jiaosu for leaf treatment and solid Jiaosu for soil treatment.
-
Variety pH Soil organic N P2O5 K2O Producer Chemical fertilizer − − 15% 15% 15% Jiangxi Woerde New Fertilizer Technology Co., LTD Solid agricultural Jiaosu for soil 5.50 93.09% 3.31% 1.57% 1.74% Weinan Shuntian Agricultural JiaoSu Technology Co., LTD Liquid agricultural Jiaosu for soil 4.46
(1:250 dilution)31.60 g·L−1 1.62 g·L−1 3.44 g·L−1 8.31 g·L−1 Liquid agricultural Jiaosu for leaf surface 3.96
(1:250 dilution)39.04 g·L−1 − − − F − − 18.00 g·pot−1 18.00 g·pot−1 18.00 g·pot−1 − JA − 140.01 g·pot−1 4.98 g·pot−1 2.40 g·pot−1 2.73 g·pot−1 − JT − 139.97 g·pot−1 4.98 g·pot−1 2.40 g·pot−1 2.73 g·pot−1 − JY − 139.51 g·pot−1 4.96 g·pot−1 2.35 g·pot−1 2.61 g·pot−1 − F is treatment of conventional fertilizer, JA treatment is solid agricultural Jiaosu for soil + liquid agricultural Jiaosu for soil + liquid agricultural Jiaosu for leaf surface; JT is solid agricultural Jiaosu for soil + liquid agricultural Jiaosu for soil; JY is solid agricultural Jiaosu for soil + liquid agricultural Jiaosu for leaf surface. Table 1.
Basic information on different treatments and fertilizers.
-
N P K r P r P r P 16 d after transplanted Plant height −0.132 0.626 0.291 0.274 0.308 0.246 Aboveground biomass 0.207 0.442 0.344 0.192 0.123 0.650 27 d after transplanted Plant height −0.152 0.574 −0.192 0.477 −0.311 0.241 Aboveground biomass −0.382 0.145 −0.491* 0.053 −0.470* 0.066 48 d after transplanted Plant height −0.098 0.775 0.690** 0.019 0.296 0.377 Aboveground biomass −0.309 0.355 −0.348 0.294 −0.760*** 0.007 100 d after transplanted Plant height 0.405 0.120 −0.221 0.411 −0.107 0.693 Aboveground biomass −0.191 0.478 0.300 0.259 0.505** 0.046 Whole growth period Plant height −0.460*** 0.000 0.015 0.911 −0.292** 0.025 Aboveground biomass −0.208 0.115 0.057 0.667 0.065 0.622 '*', '**', and '***' indicate the statistically significant, highly significant, and extremely significant at p < 0.01, p < 0.05, and p < 0.001 level respectively. r in the table is Pearson correlation coefficient, P in the table is p-value in the Pearson correlation analysis. N, P, and K represent soil ammonium nitrogen, available phosphorus, and available potassium, respectively. Table 2.
Relationship between soil available nitrogen, phosphorus and potassium content and plant growth index.
-
6 d after transplanted 16 d after transplanted 27 d after transplanted 48 d after transplanted 100 d after transplanted A.N A.P A.K A.N A.P A.K A.N A.P A.K A.N A.P A.K A.N A.P A.K Yield per plant −0.536* −0.44* Effective panicle 0.711*** 0.705*** 0.517** 0.733*** 0.660*** 0.751*** 0.749*** 0.646** 0.745*** Total grain −0.448* −0.501* −0.442* −0.684** −0.720** Solid grain −0.511** −0.576** −.529** −0.493* −0.536* −0.758*** Panicle length −0.464* −0.469* −0.481* −0.541* Grain density −0.456* −0.666** −0.711** 1000-grain weight −0.434* −0.564** −0.507** −0.435* −0.748*** −0.787*** −0.577** Plant height −0.467* −0.466* Straw weight per plant 0.815*** 0.630** 0.612** 0.446* 0.833*** 0.776*** 0.793*** 0.758** 0.684** 0.681** 0.505** Aboveground biomass 0.680*** 0.489* 0.709*** 0.759*** 0.643*** 0.711** 0.547* Underground biomass 0.706*** Total biomass 0.668*** 0.493* 0.709*** 0.737*** 0.638*** 0.695** 0.556* Total biomass per spike −0.701*** −0.663*** −0.786*** −0.475* −0.474* −0.707*** −0.442* −0.698*** −0.490* −0.794*** −0.624** −0.640*** Head ratio straw −0.723*** −0.666*** −0.769*** −0.475* −0.712*** −0.472* −0.704*** −0.522* −0.777*** −0.624** −0.666*** '*', '**', and '***' indicate the statistically significant, highly significant, and extremely significant at p < 0.01, p < 0.05, and p < 0.001 level respectively. A.N, A.P, and A.K represent soil ammonium nitrogen, available phosphorus, and available potassium, respectively.. Table 3.
Correlation between soil available nitrogen, phosphorus and potassium at each growth stage and yield and biomass at harvest stage.
Figures
(7)
Tables
(3)