-

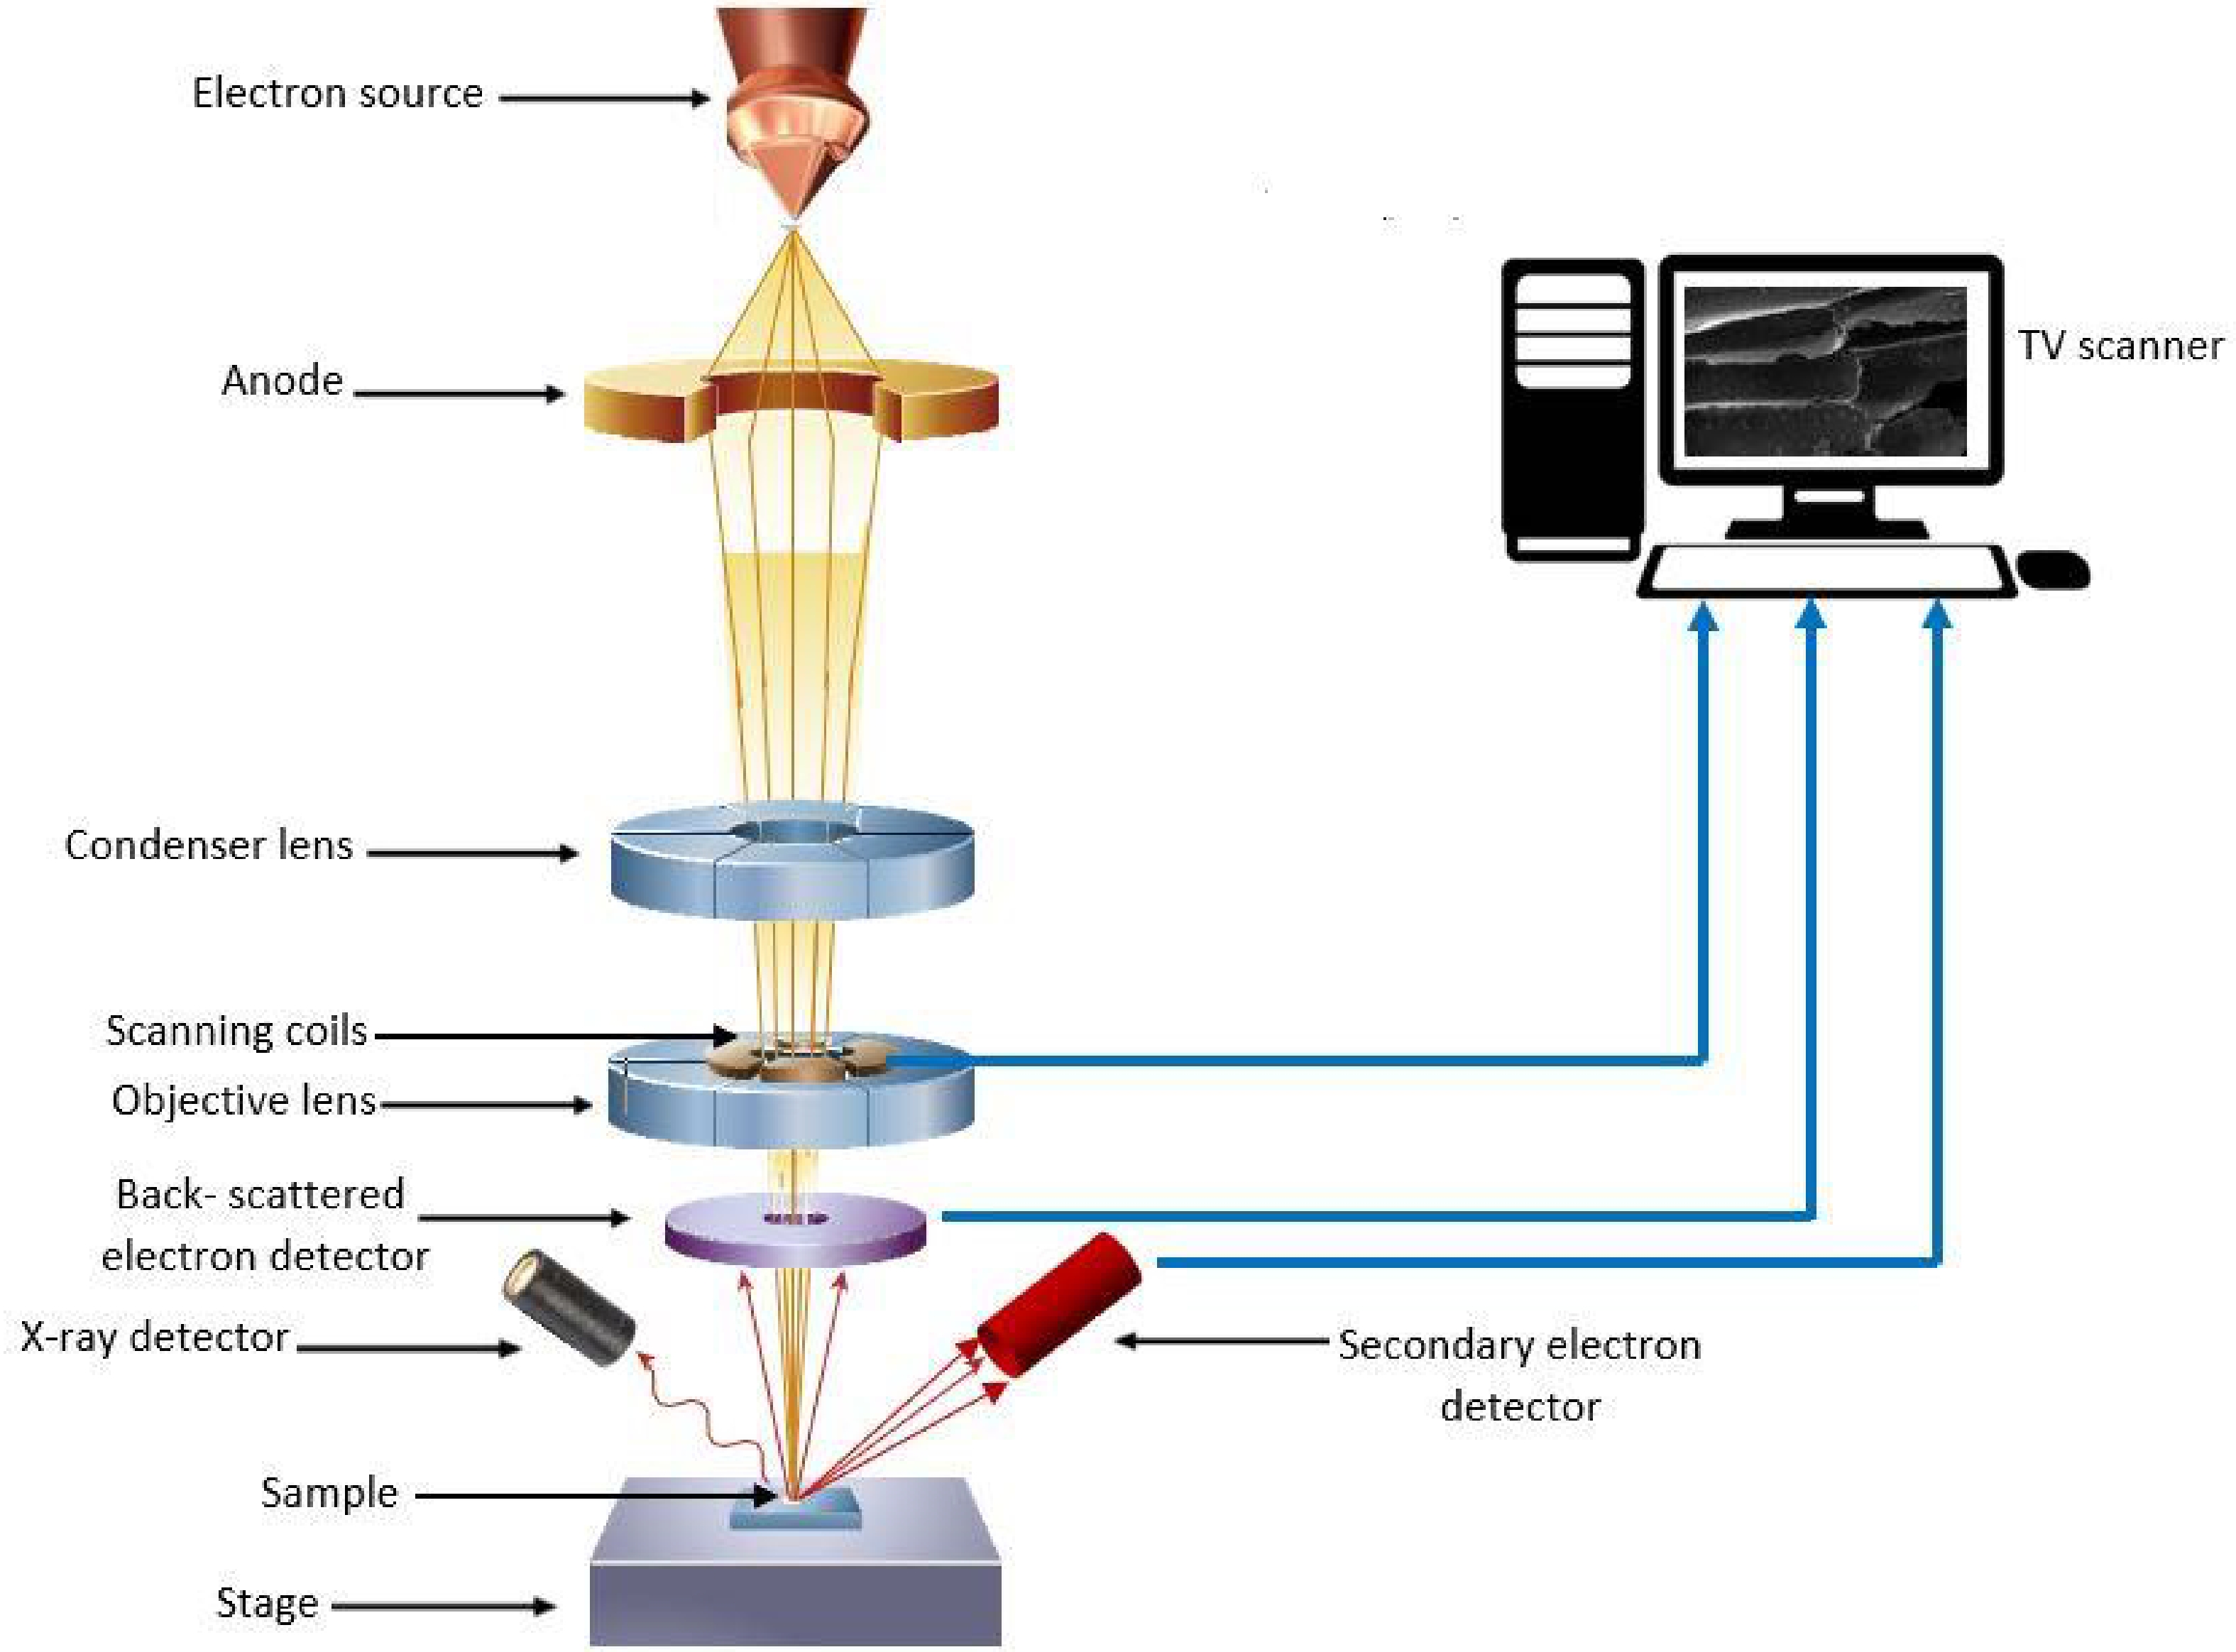
Figure 1.
Working principle of scanning electron microscope with energy dispersive X-ray spectroscopy analysis. (Adopted from Inkson[26]).
-

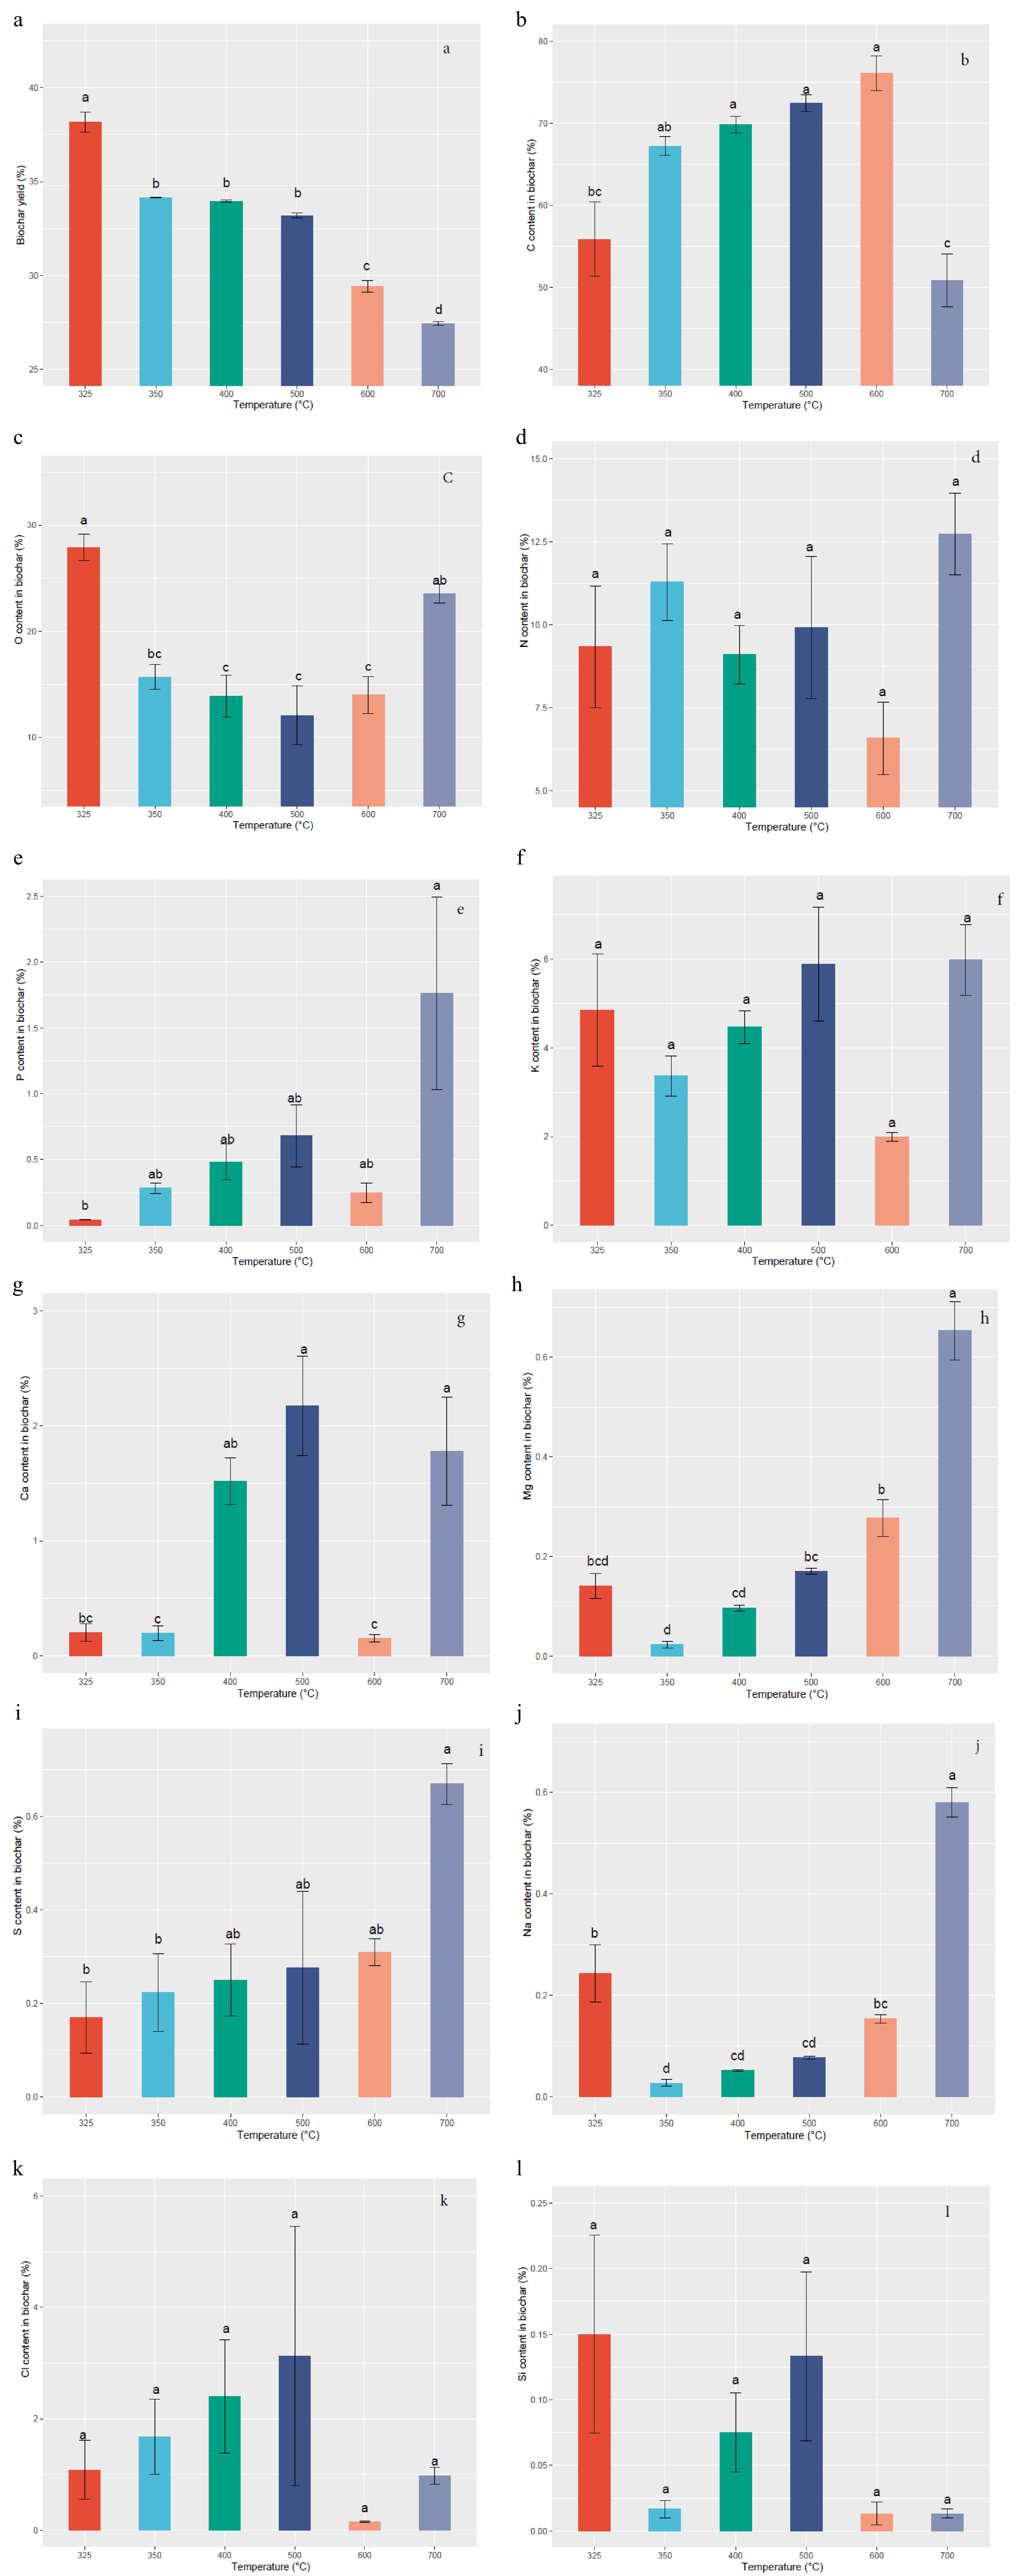
Figure 2.
Variation of Gliricidia sepium biochar nutrient content with different pyrolysis temperatures. (a) Biochar yield, (b) C content, (c) O content, (d) N content, (e) P content, (f) K content, (g) Ca content, (h) Mg content, (i) S content, (j) Na content, (k) Cl content, (l) Si content. Means with different letters represent significant differences at p < 0.05 level.
-

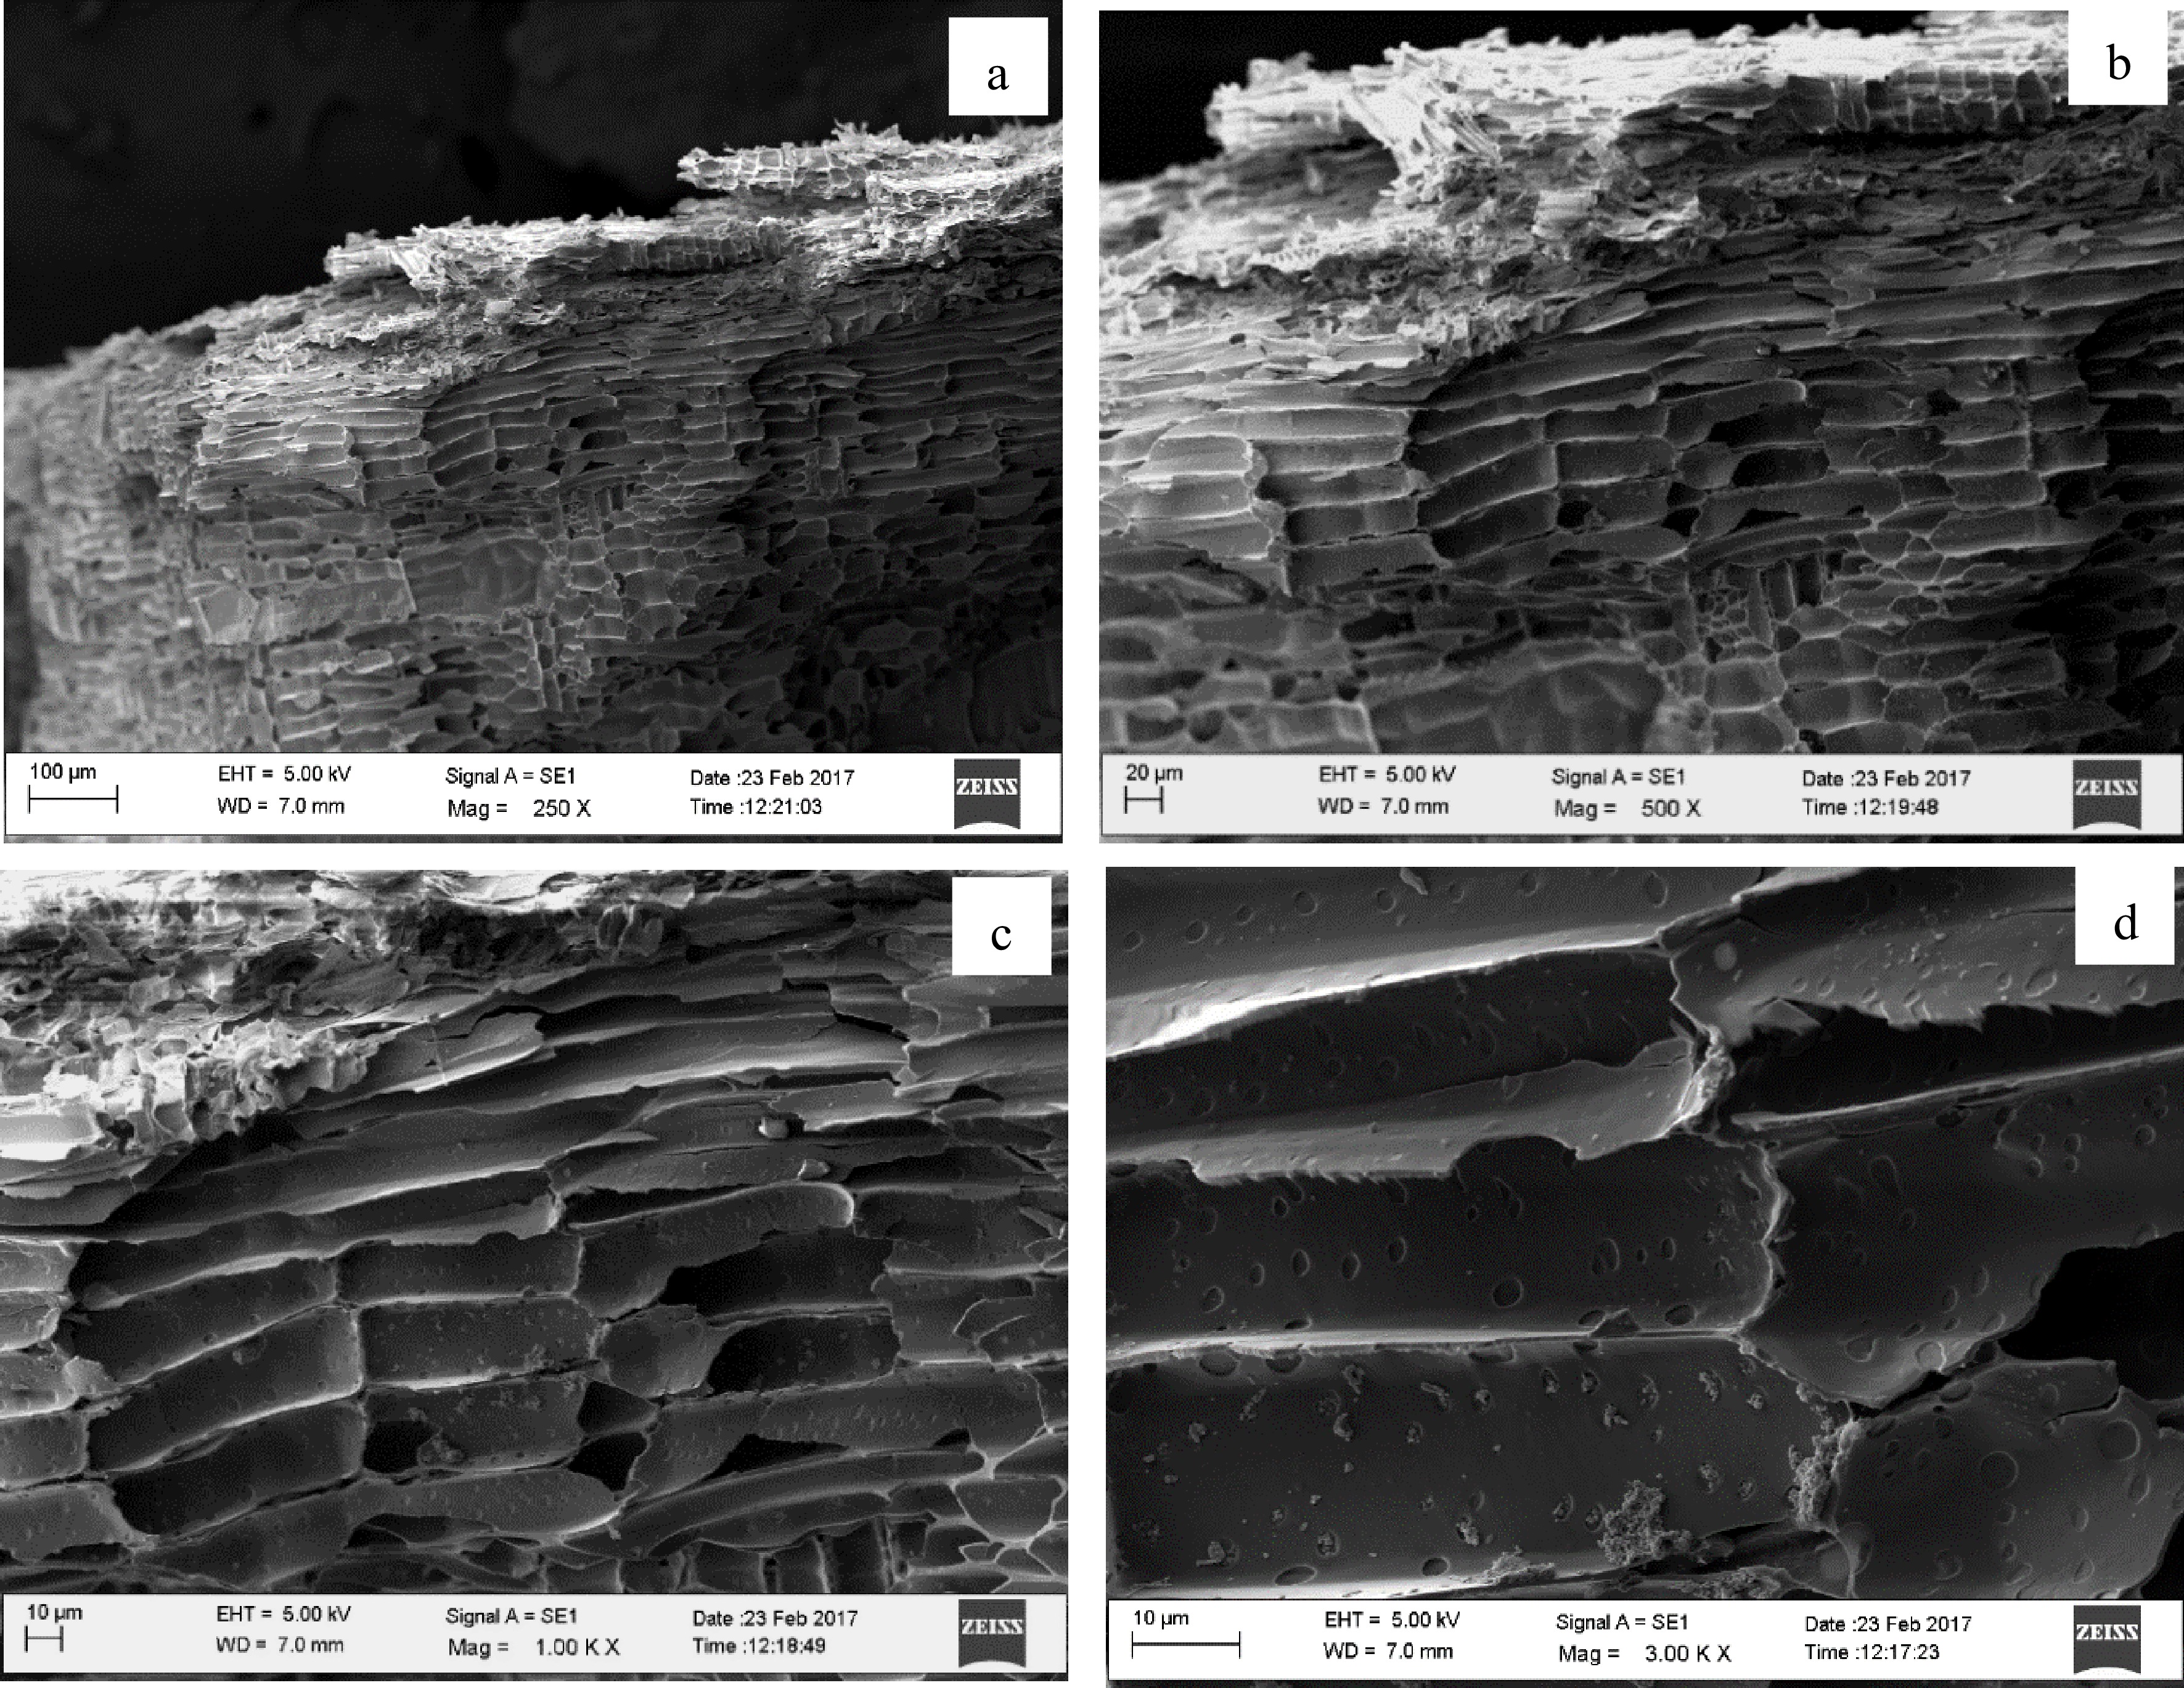
Figure 3.
Scanning electron microscopy (SEM) micrographs of Gliricidia sepium biochar produced at 400 °C. (a) Under ×250 magnification, (b) Under ×500 magnification, (c) Under ×1,000 magnification, (d) Under ×3,000 magnification.
-

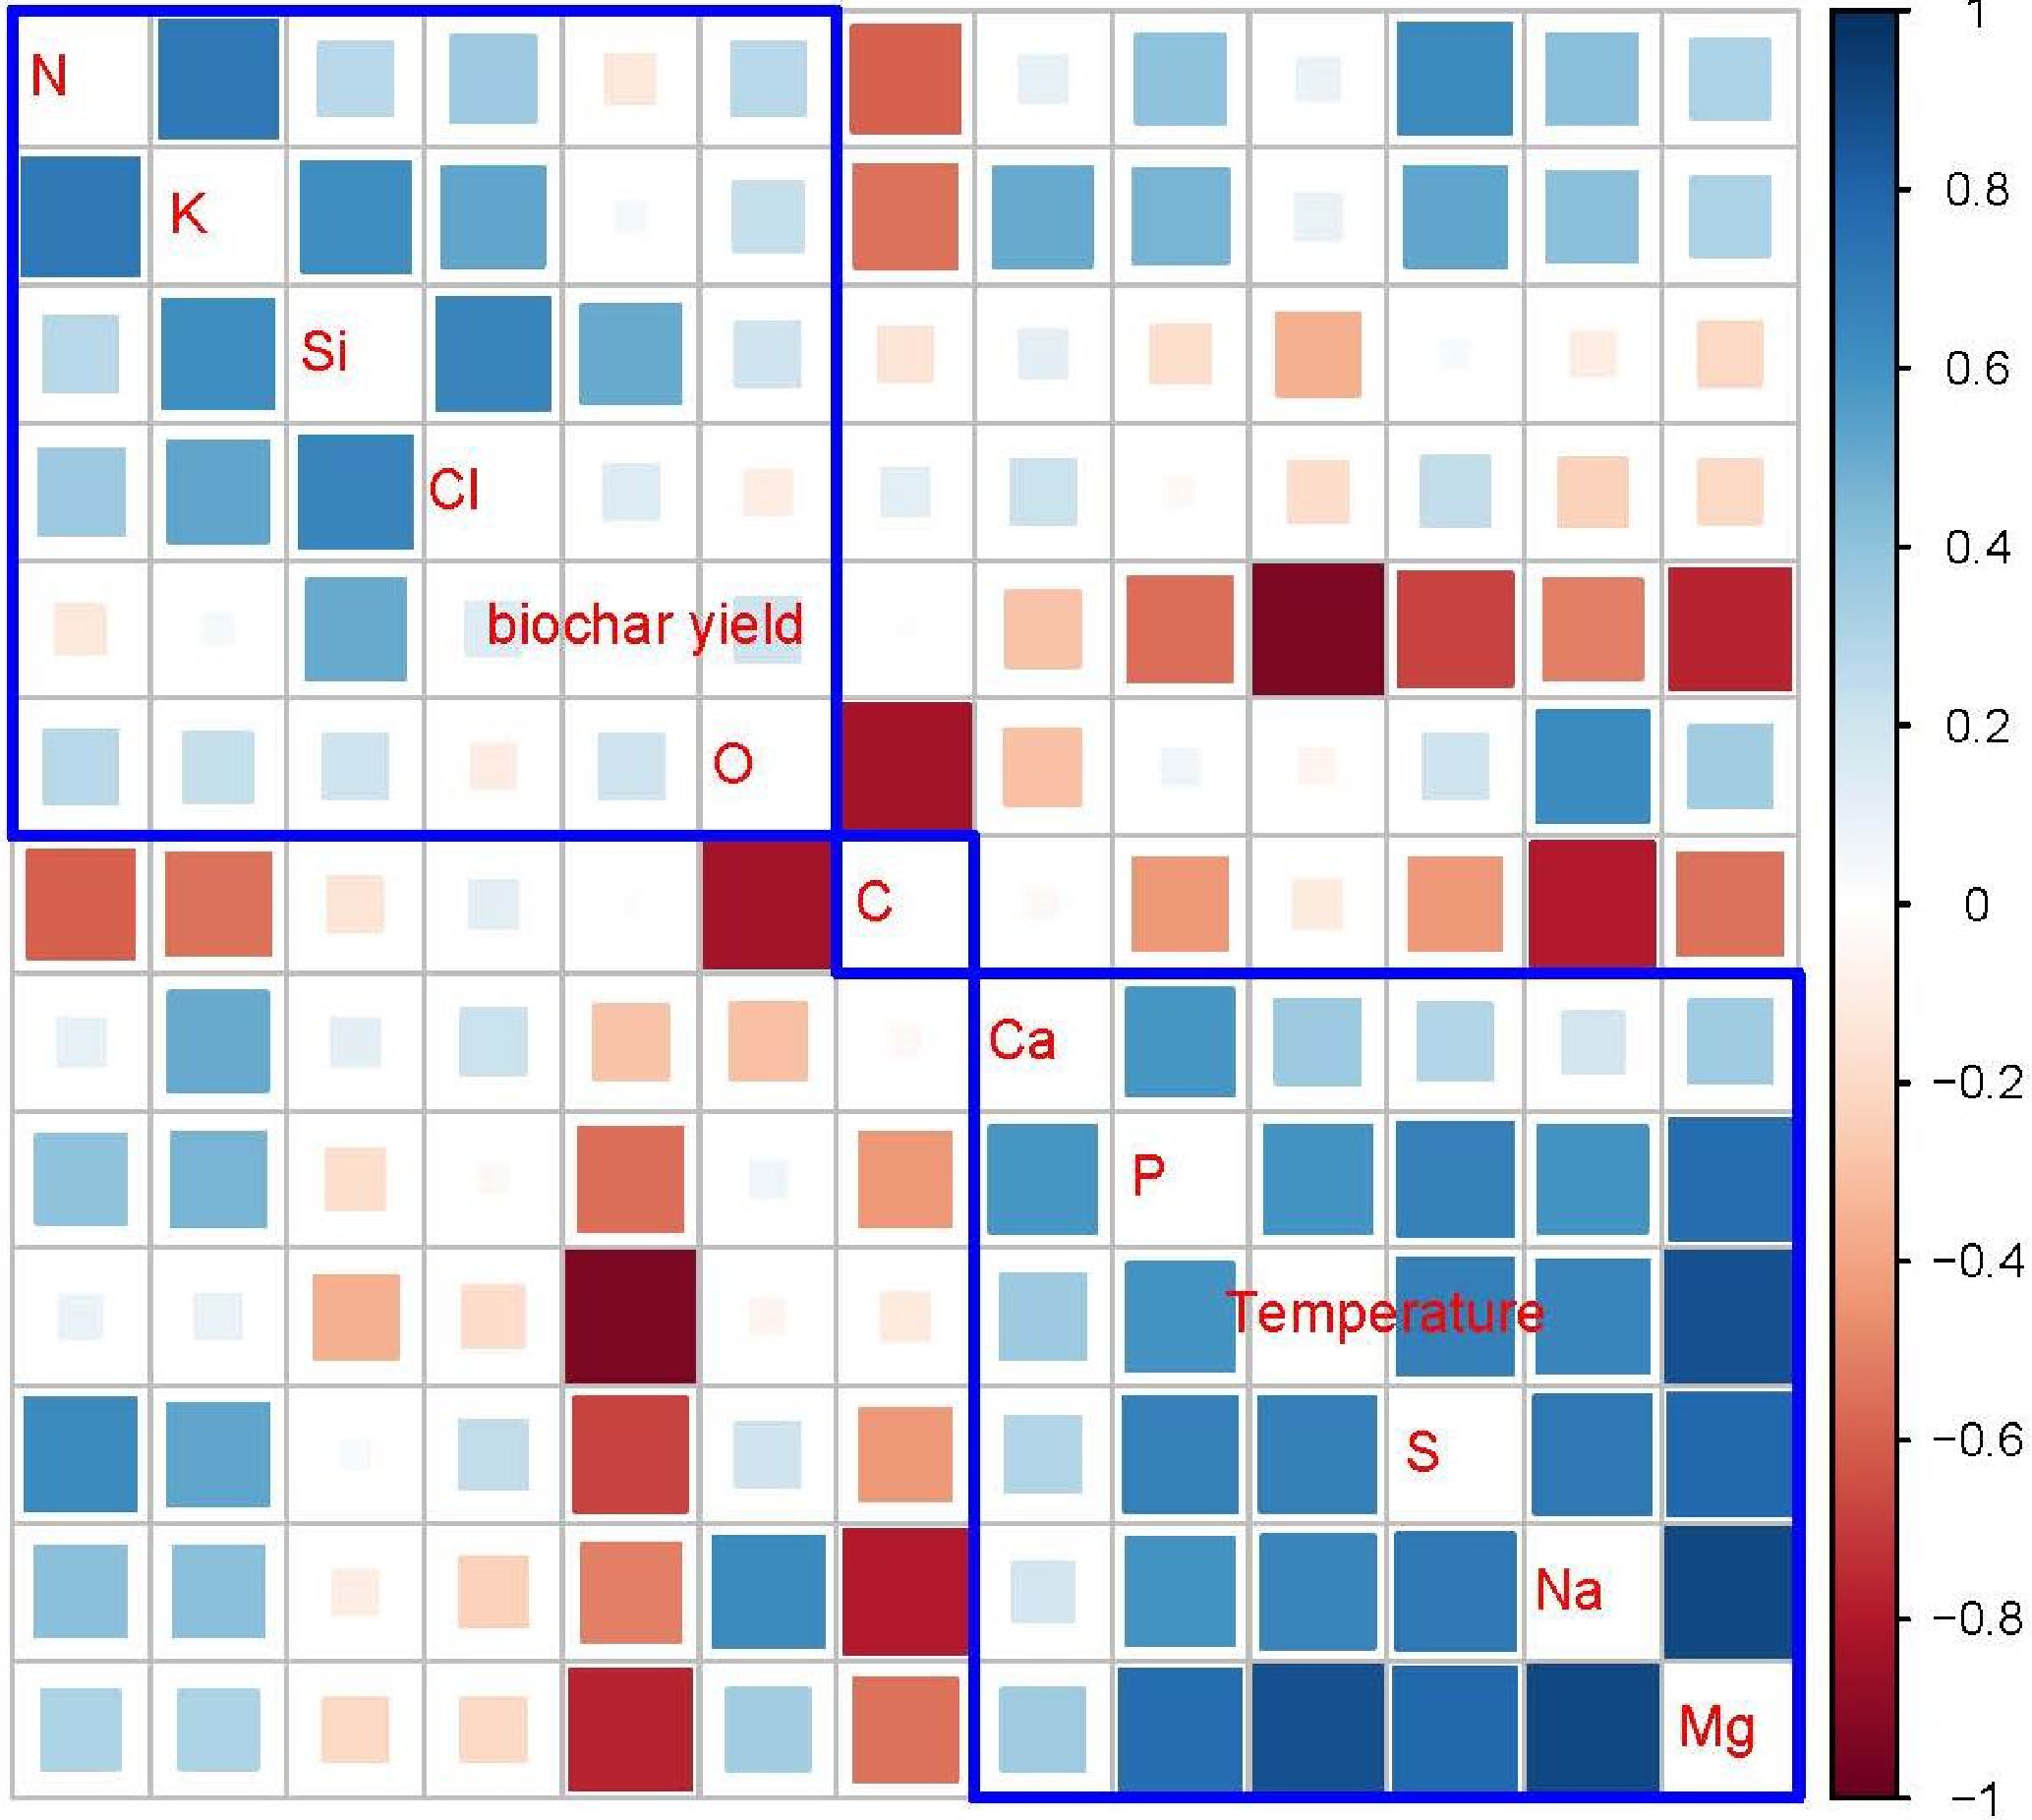
Figure 4.
Graphical display of the correlation matrix, using the 'corrplot' package of R-software. Red color indicates the negative correlations between shown variables; blue color indicates the positive correlations; white color indicates no correlation. The areas of the squares show the absolute value of corresponding correlation coefficients. Parameters covered by blue lines show similar correlation variation patterns.
Figures
(4)
Tables
(0)