-
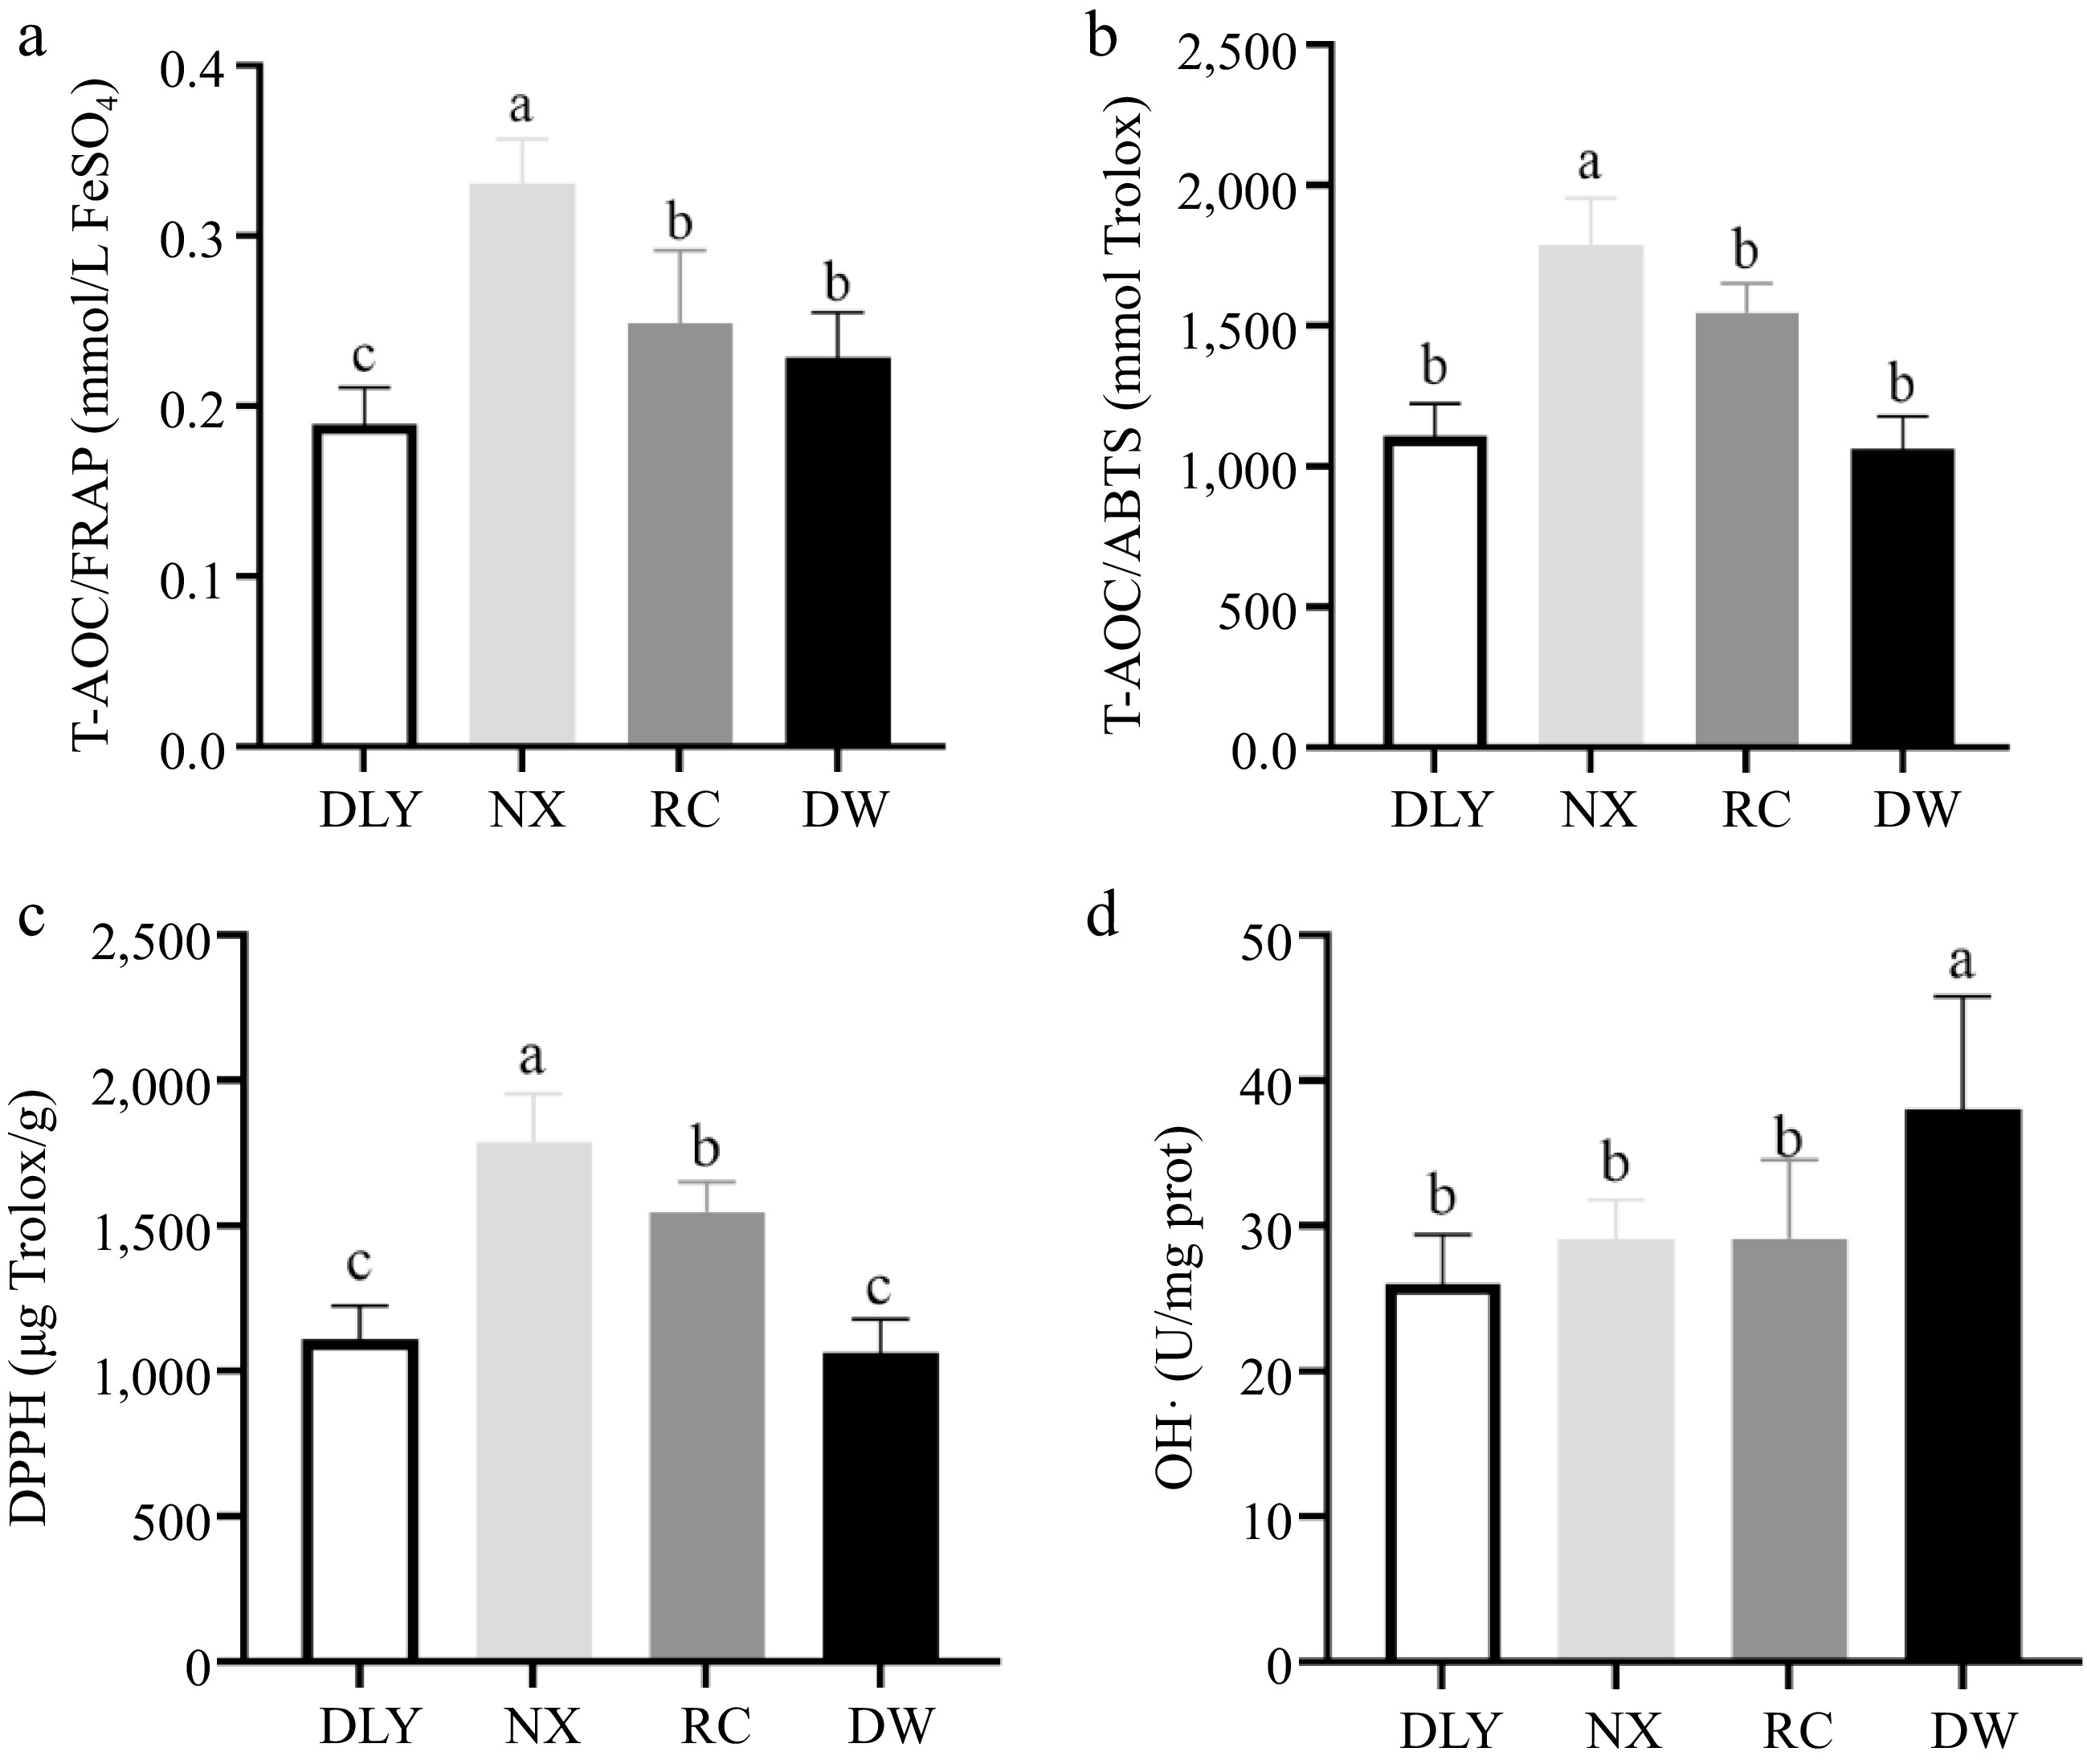
Figure 1.
Comparison of antioxidant capacity characterization value of four varieties of pork. (a) Iron ion reduction ability (FARP); (b) ABTS radical scavenging ability (ABTS); (c) Comparison of DPPH among four varieties of pork; (d) Comparison of OH•- among four varieties of pork. Different letters indicate significant differences between pork samples of different breeds (p < 0.05). n = 6.
-
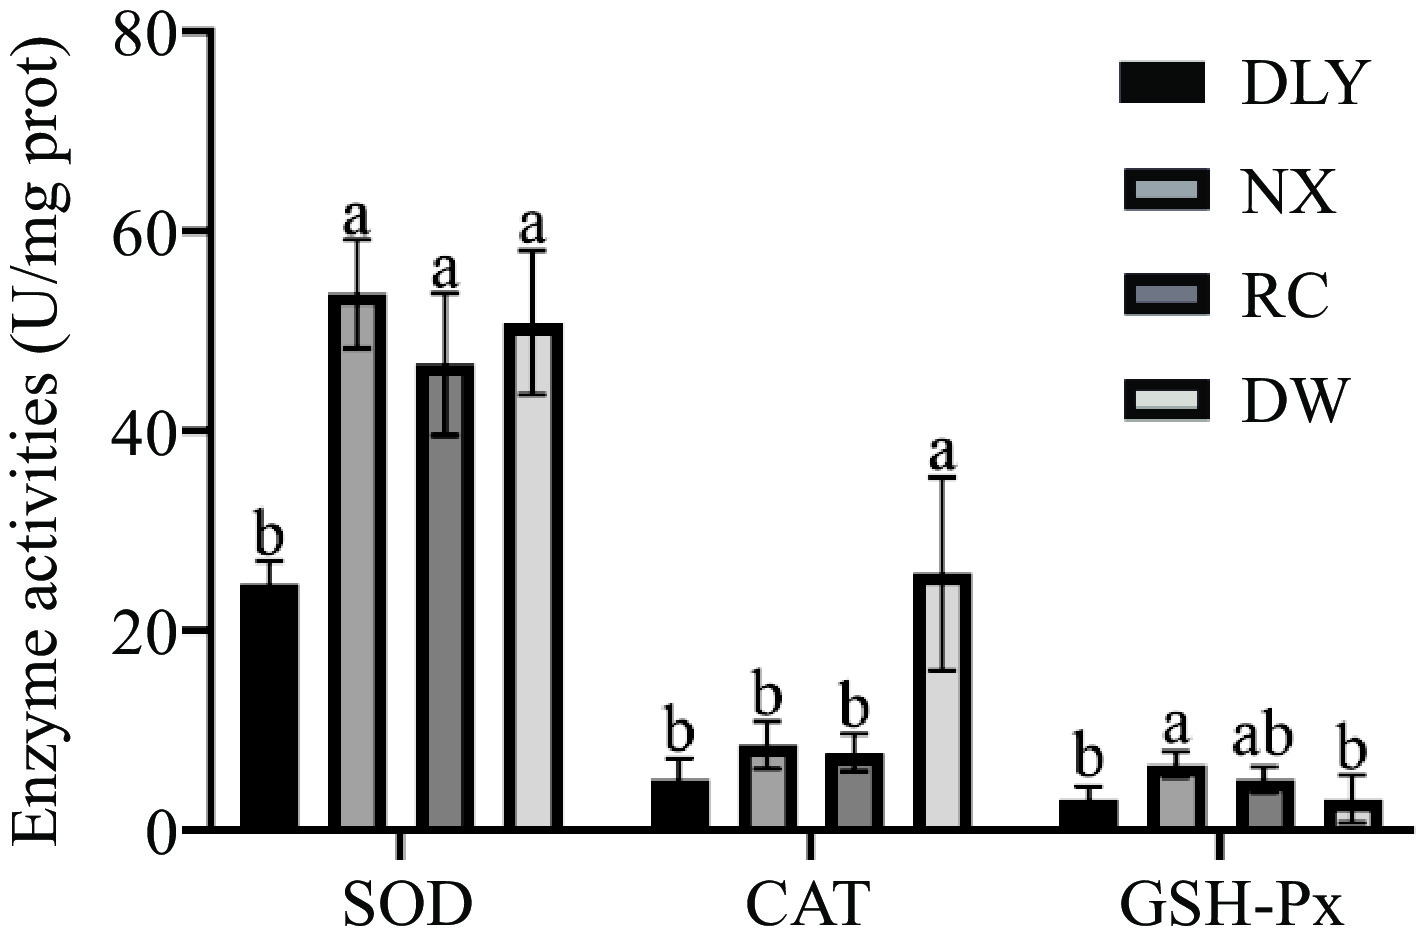
Figure 2.
Comparison of antioxidant enzyme activities among four pork varieties.
-
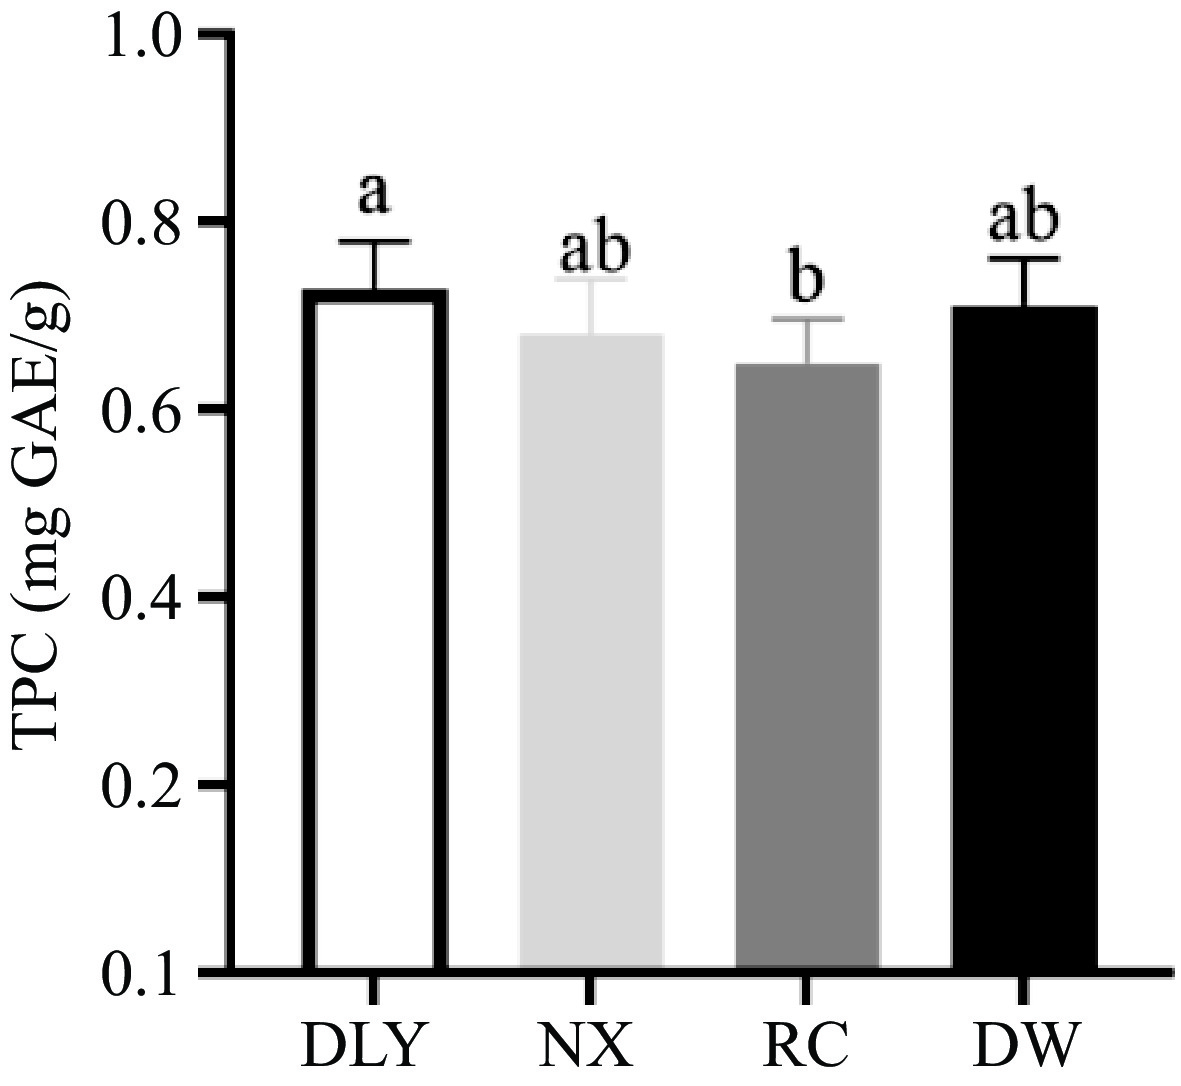
Figure 3.
Comparison of total phenol content in four varieties of pork.
-
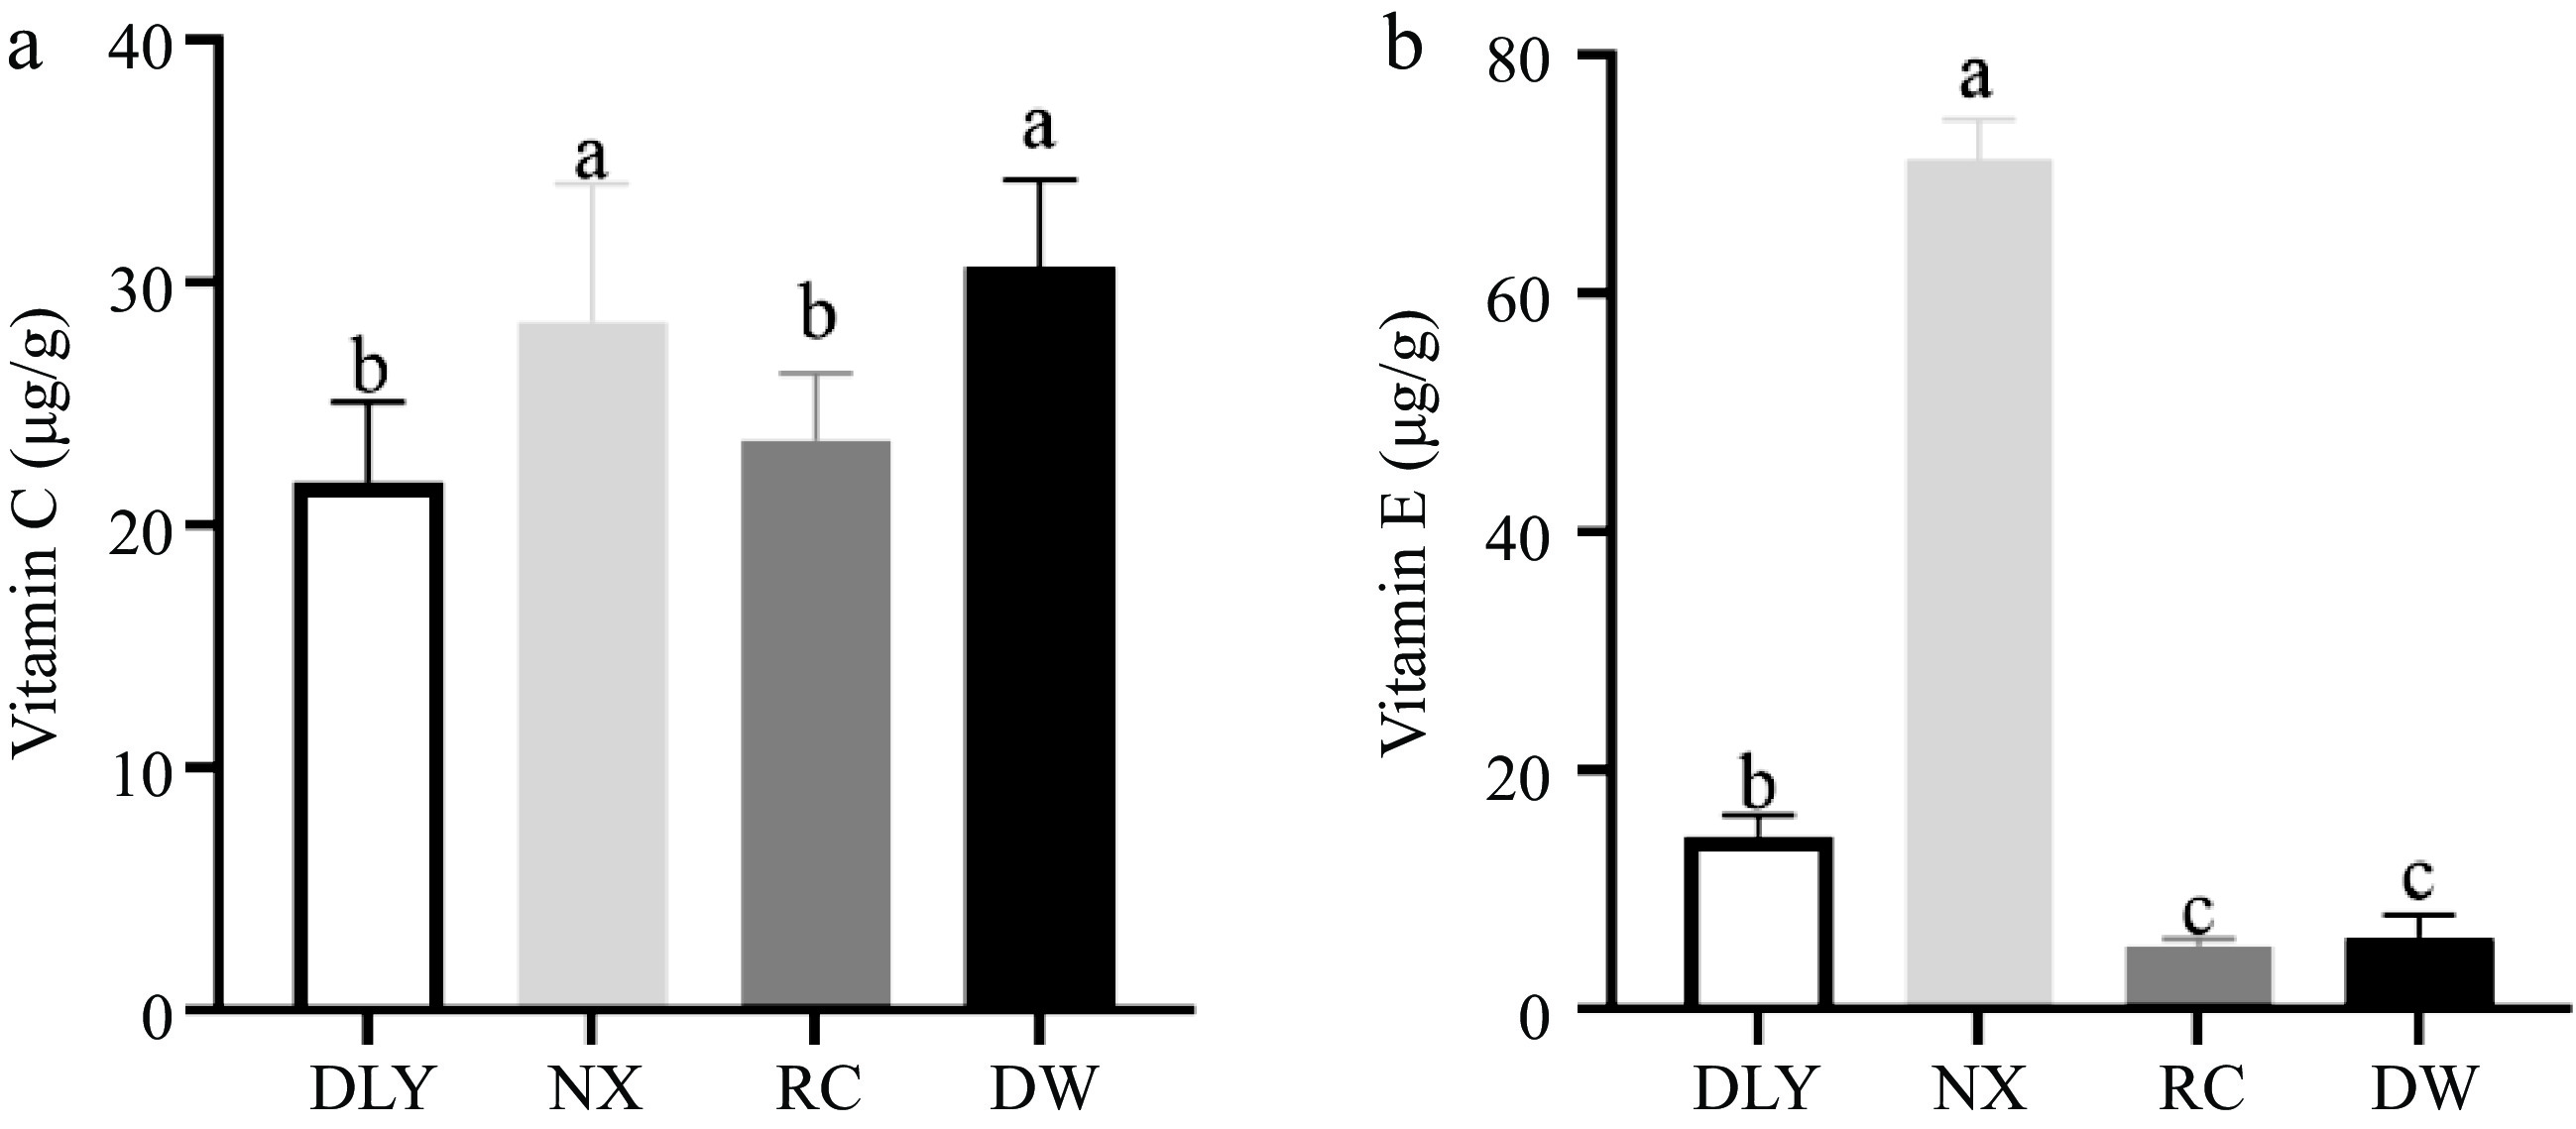
Figure 4.
Comparison of vitamin content in four varieties of pork. (a) Vitamin C, (b) Vitamin E.
-
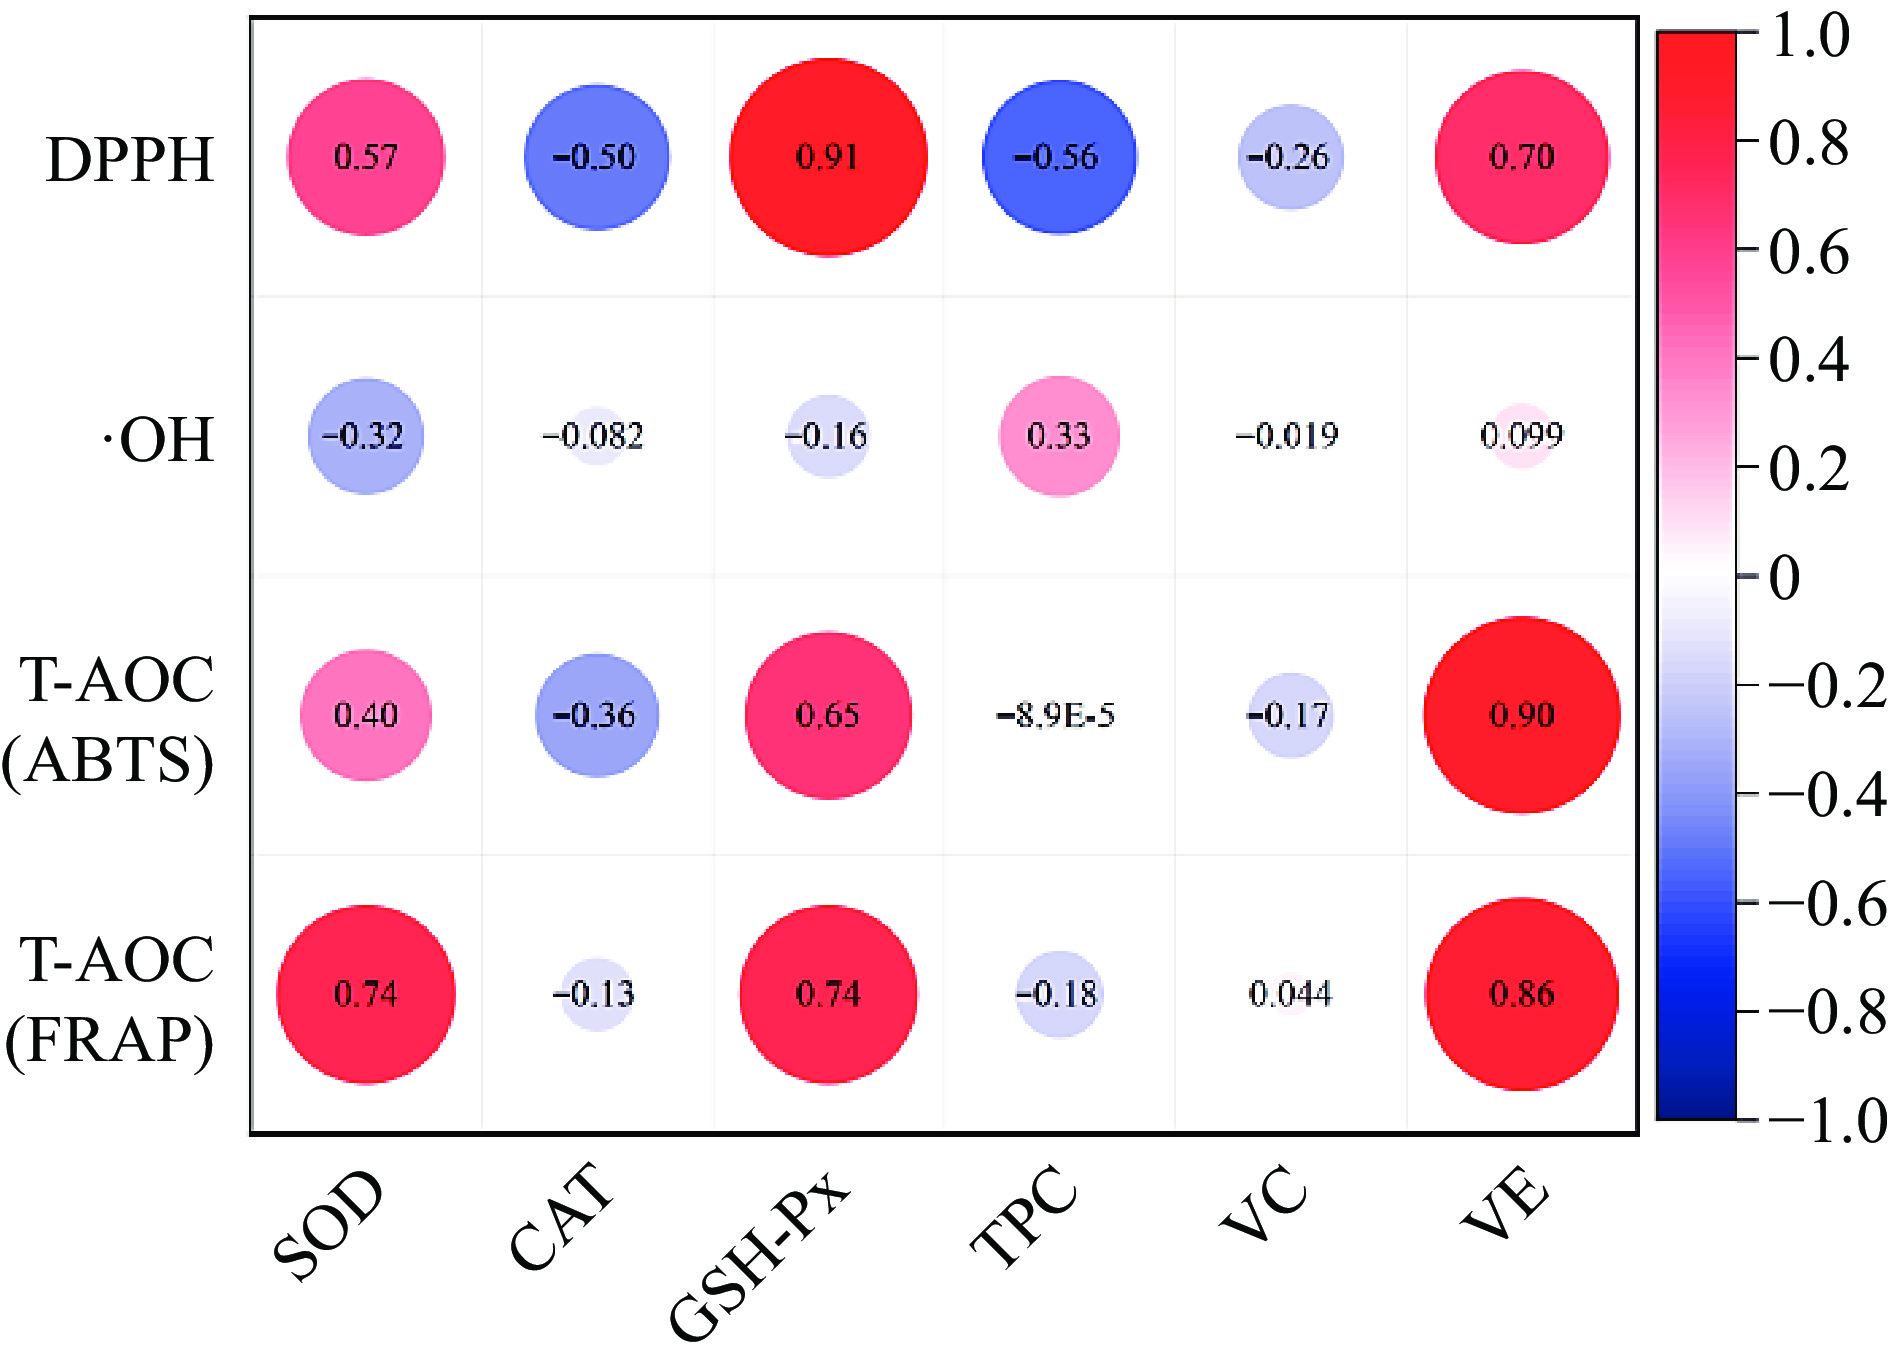
Figure 5.
Correlation analysis between antioxidant capacity and antioxidant factors.
-
Item DLY NX RC DW FAT (g/100 g) 1.42 ± 0.32c 3.17 ± 0.56b 3.72 ± 0.30a 3.15 ± 0.27b SFA (g/100 g) 3.30 ± 0.34C 4.99 ± 0.46b 6.95 ± 0.50a 5.53 ± 0.35b MUFA (g/100 g) 3.69 ± 0.39a 5.47 ± 0.51b 6.30 ± 0.59b 6.92 ± 0.53b PUFA (g/100 g) 1.45 ± 0.09b 1.76 ± 0.09a 1.91 ± 0.08a 1.48 ± 0.05b FAs (g/100 g) 8.44 ± 0.80b 12.23 ± 1.03a 15.15 ± 1.11a 13.94 ± 0.91b DLY (Duroc × Landrace × Yorkshire pig); NX (Yorkshire × Ningxiang pig); RC (Rongchang pig); DW (Duroc × Wujin pig). The values are presented by means ± standard deviations. a, b mean values with various superscripts in a row were significantly different (p < 0.05). n = 6. Table 1.
Differences of fat and fatty acid content in different varieties of pork.
-
Item DLY NX RC DW TBRAS (mg MDA/kg) 0.63 ± 0.03a 0.56 ± 0.01b 0.59 ± 0.05b 0.57 ± 0.02b POV (meq/kg) 0.16 ± 0.02a 0.14 ± 0.01a 0.14 ± 0.04a 0.17 ± 0.02a CD (mol/g) 1.52 ± 0.01a 1.43 ± 0.08a 1.50 ± 0.01a 1.51 ± 0.01a LPO (μmol/g prot) 0.14 ± 0.01a 0.14 ± 0.01a 0.17 ± 0.02a 0.16 ± 0.02a The values are presented by means ± standard deviations. The lowercase letterings a and b mean values with various superscripts in a row were significant differences (p < 0.05). n = 6. Table 2.
Differences of lipid oxidation indices in different varieties of pork
Figures
(5)
Tables
(2)