-

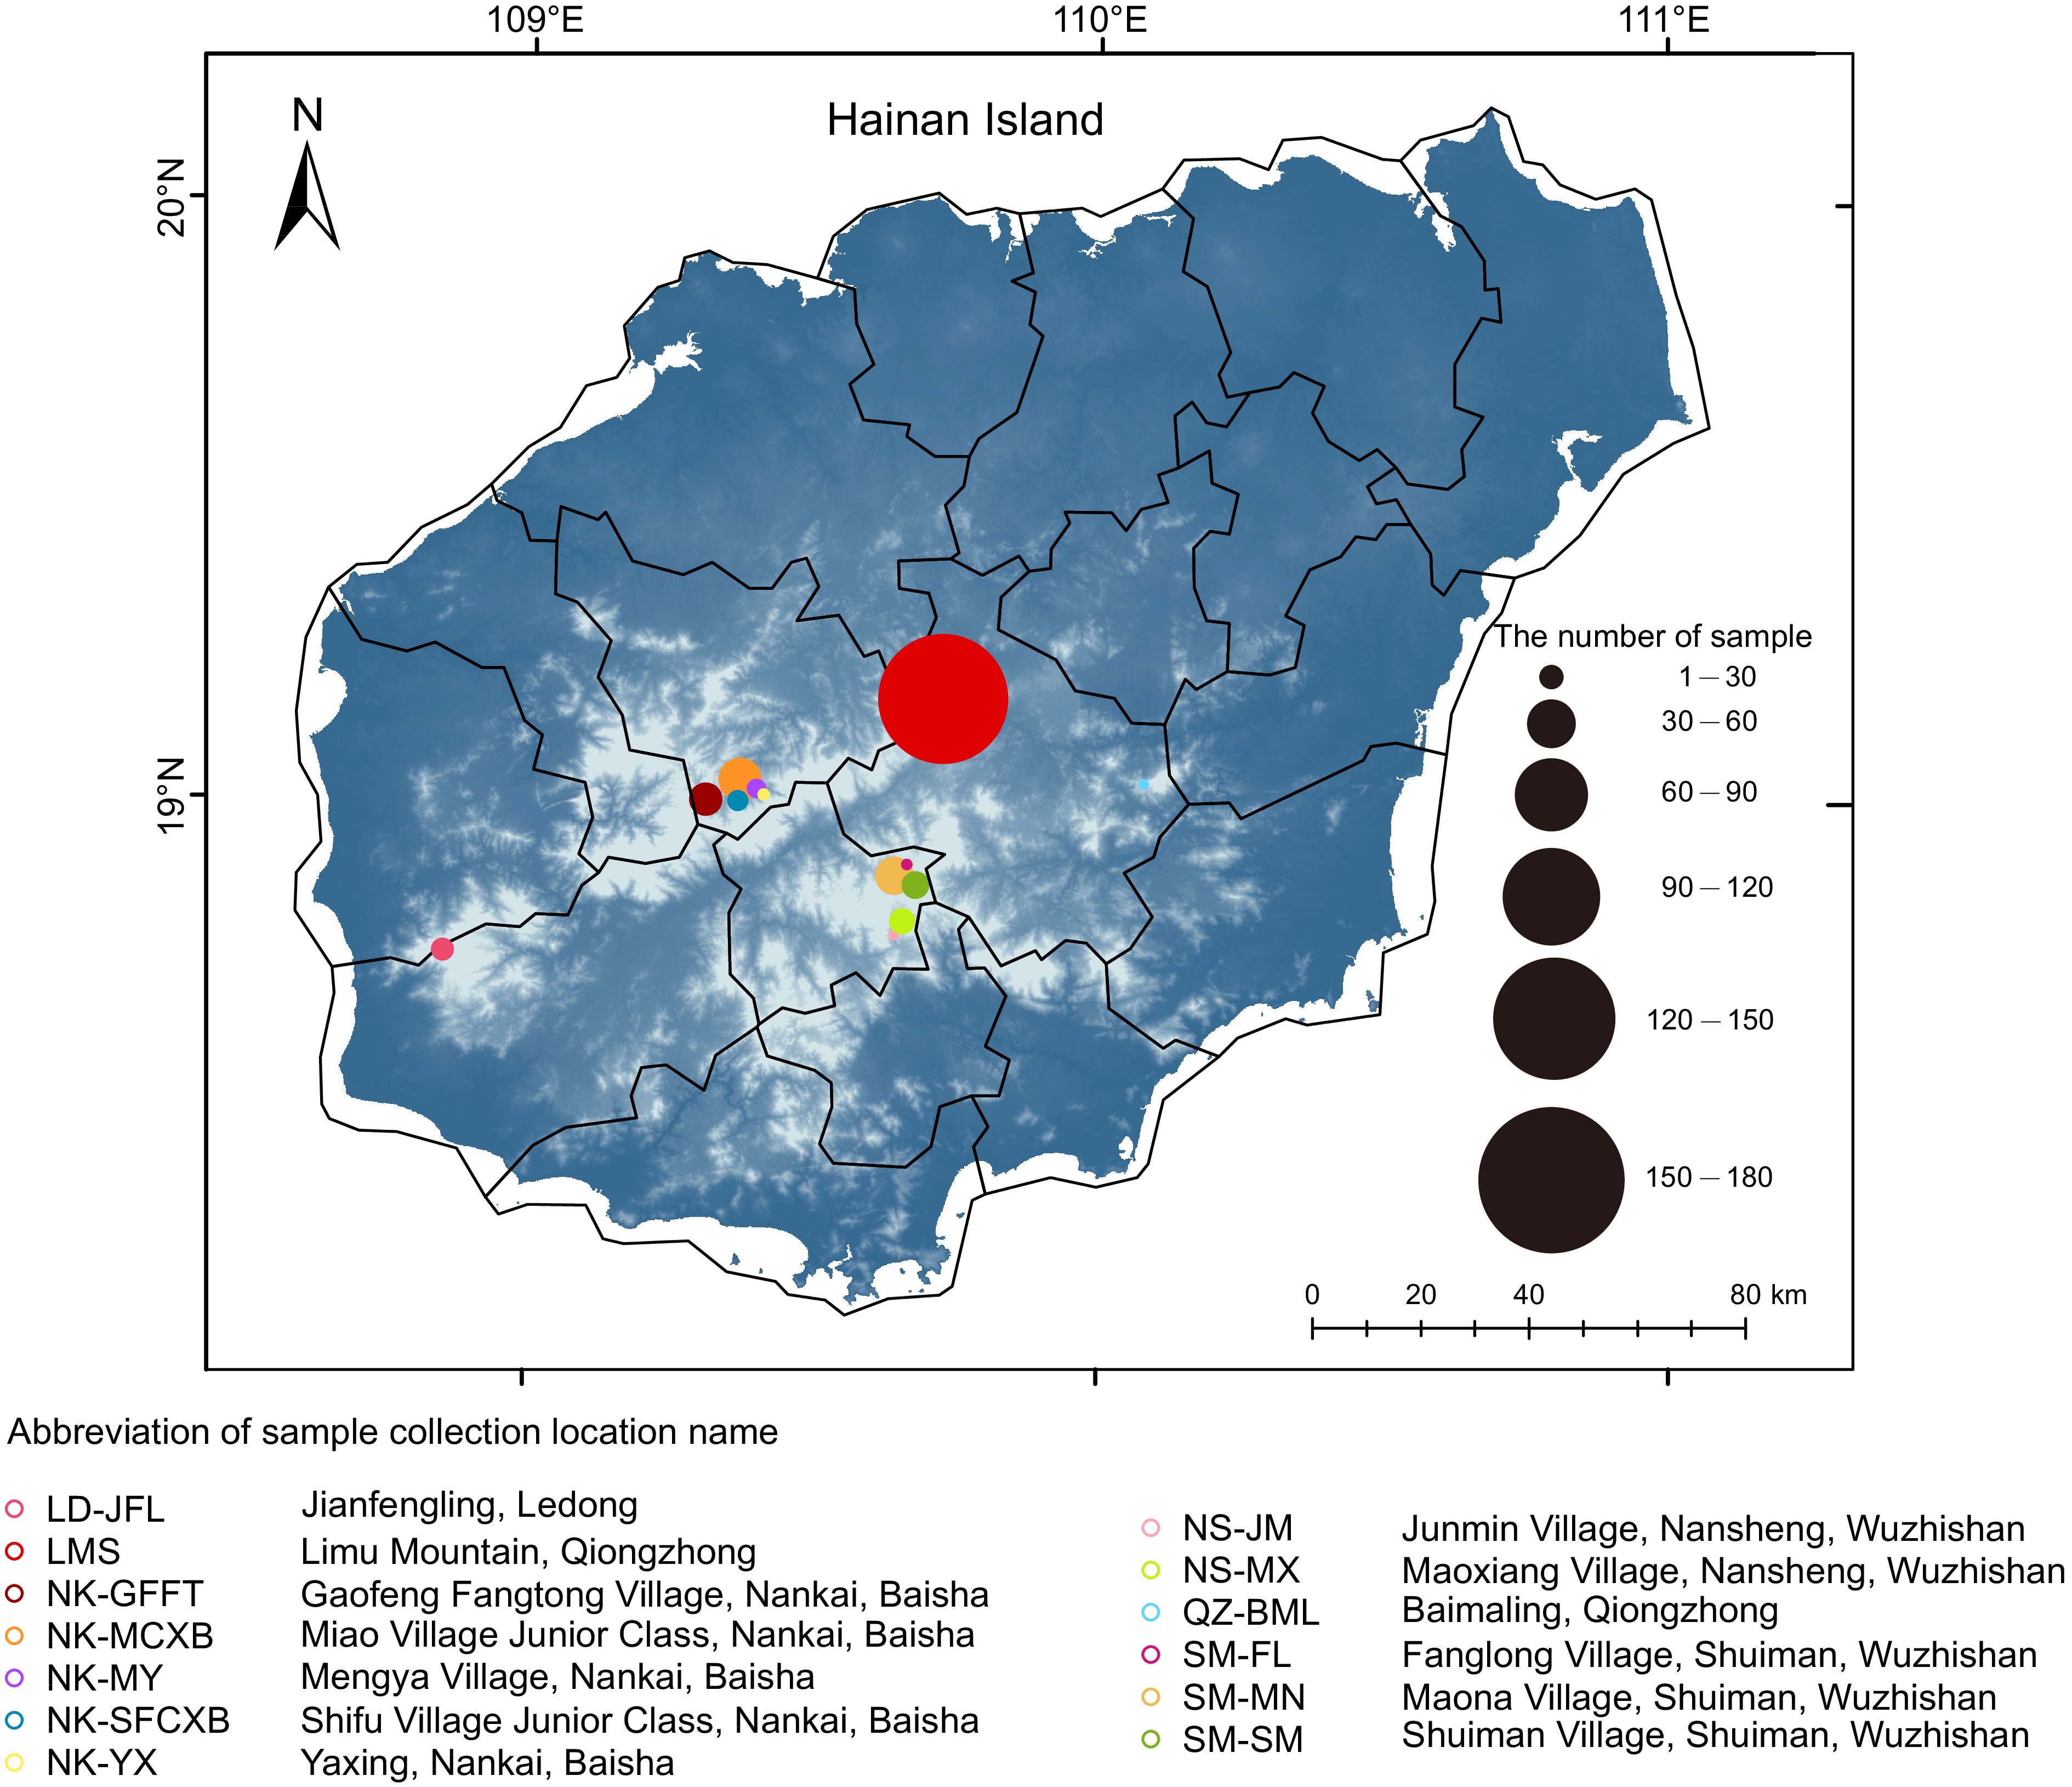
Figure 1.
Geographical distribution of tea samples collected and analyzed in this study.
-

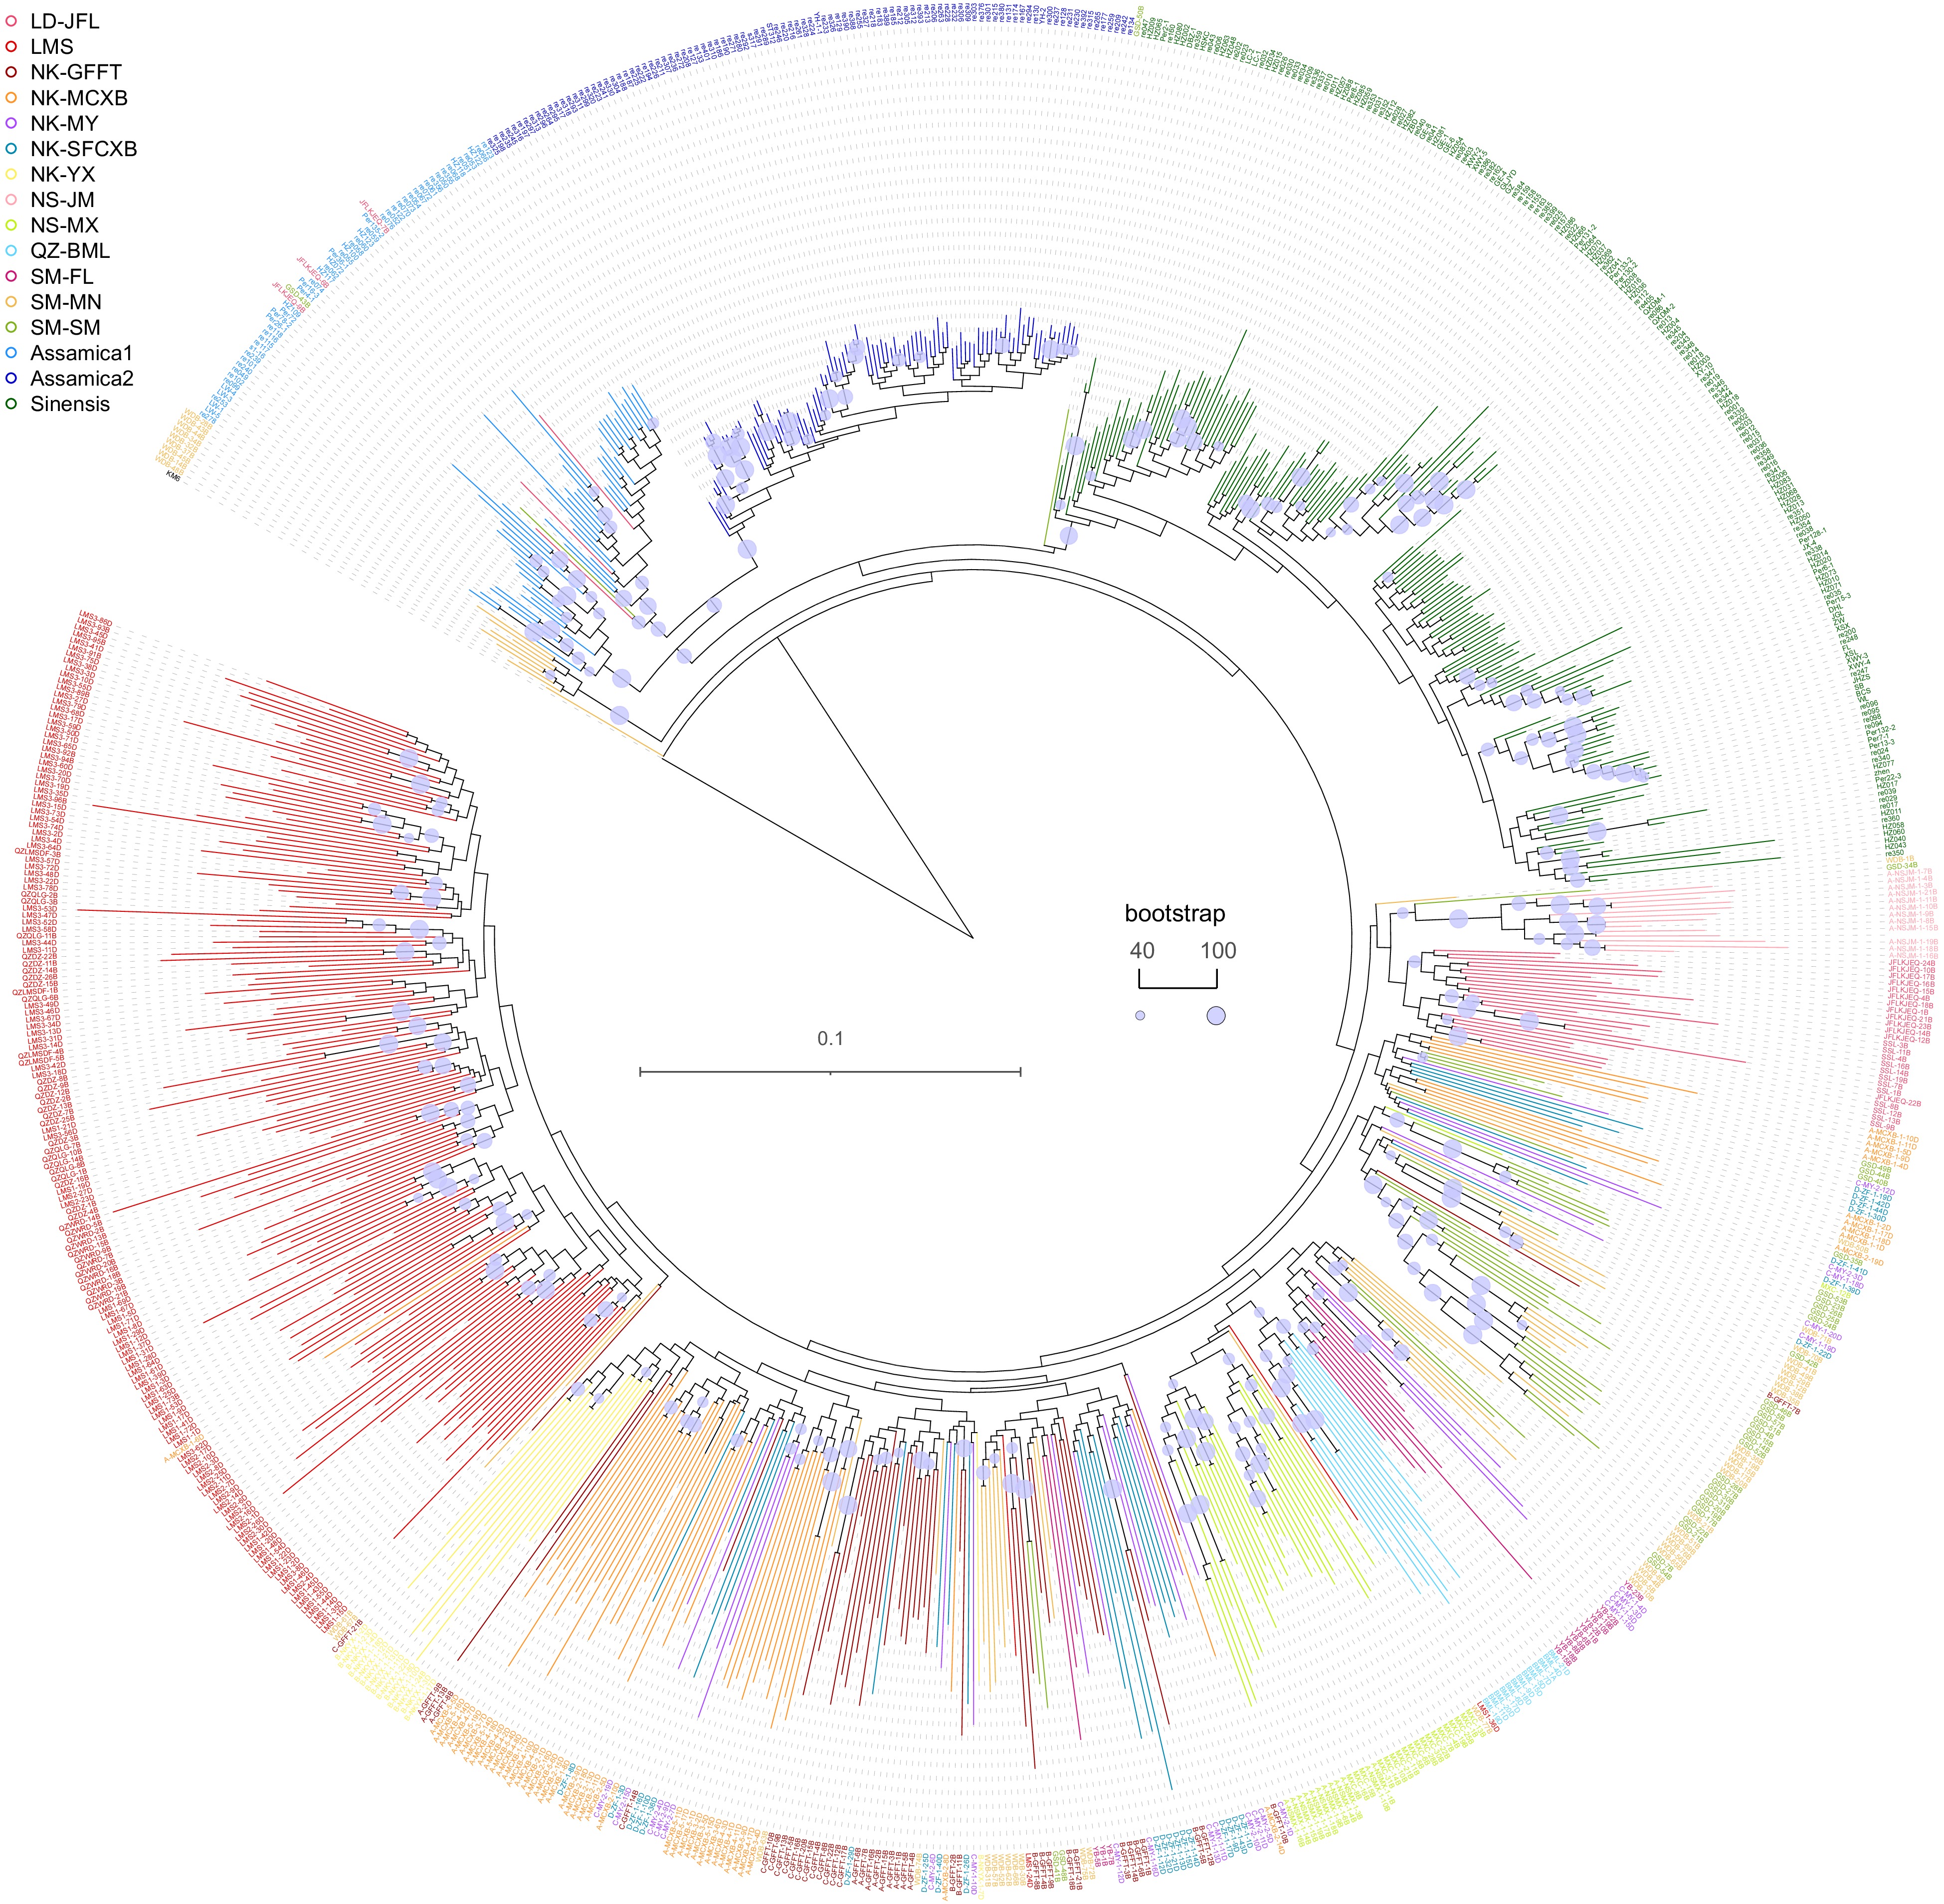
Figure 2.
Phylogenetic relationship between Hainan tea and cultivated tea.
-

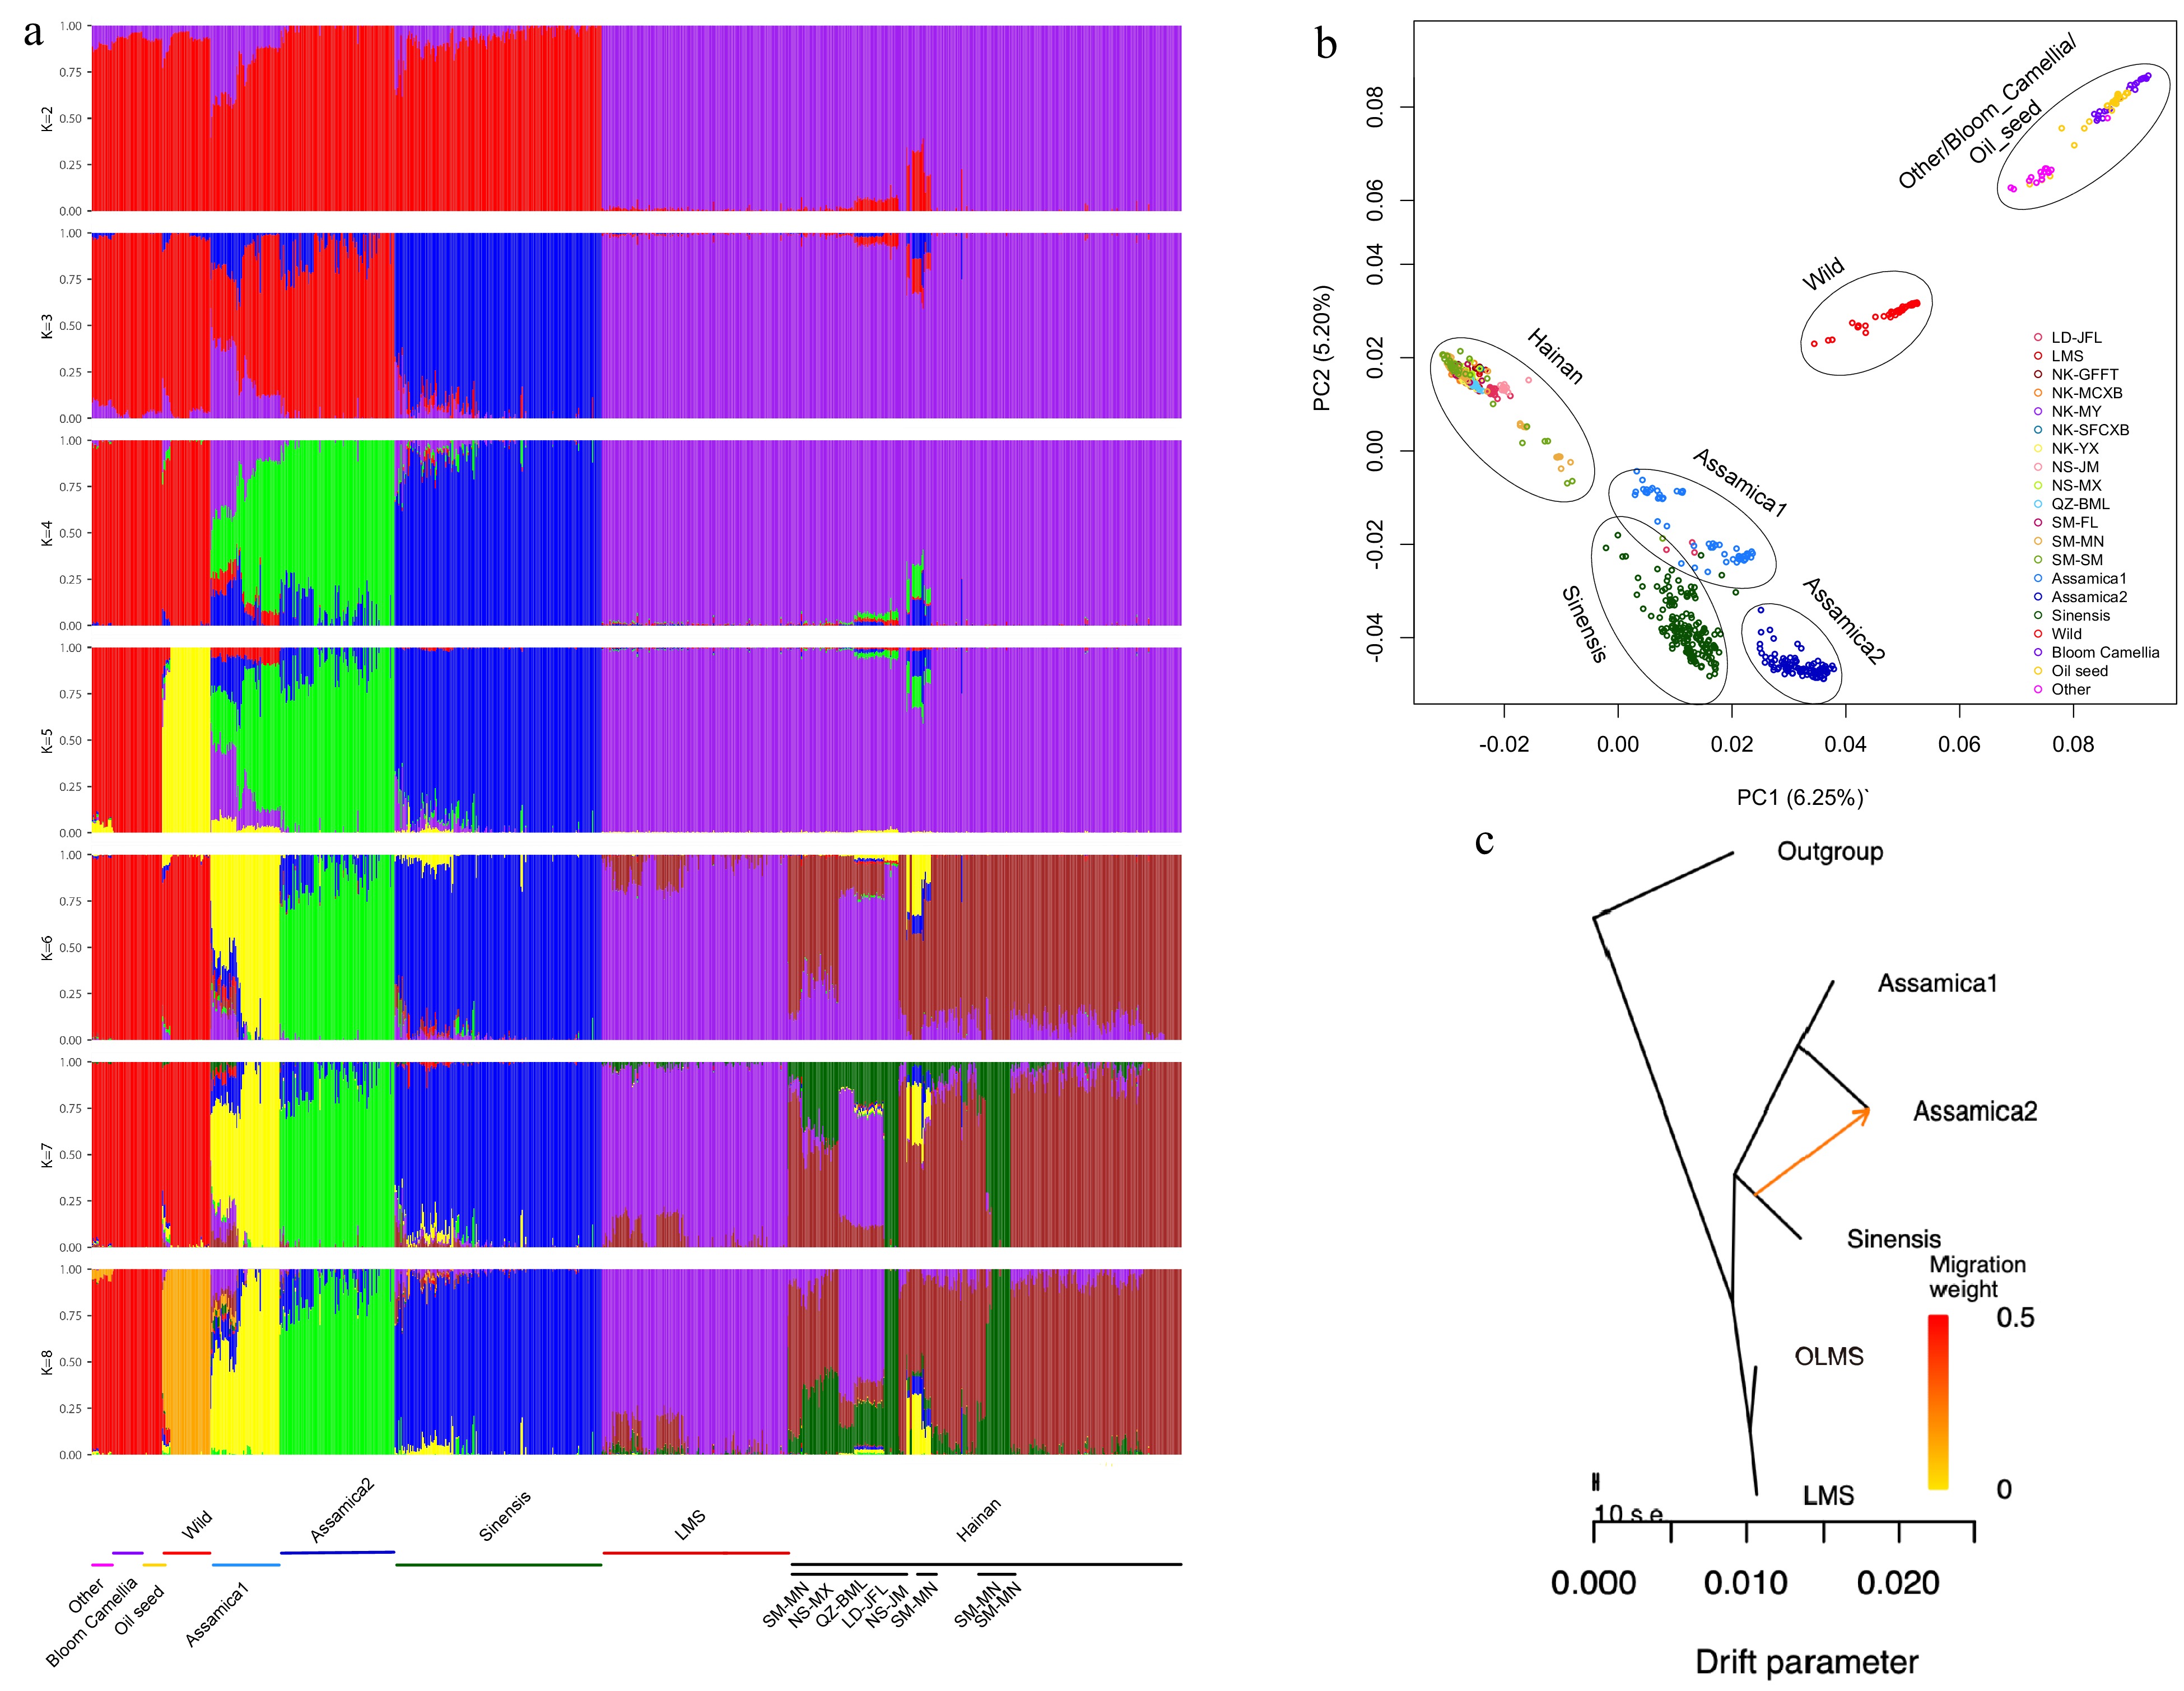
Figure 3.
The population structure and principal component analysis results for various species of Hainan tea and the Camellia genus are presented, alongside gene flow maps illustrating interactions between cultivated tea and Hainan tea.
-

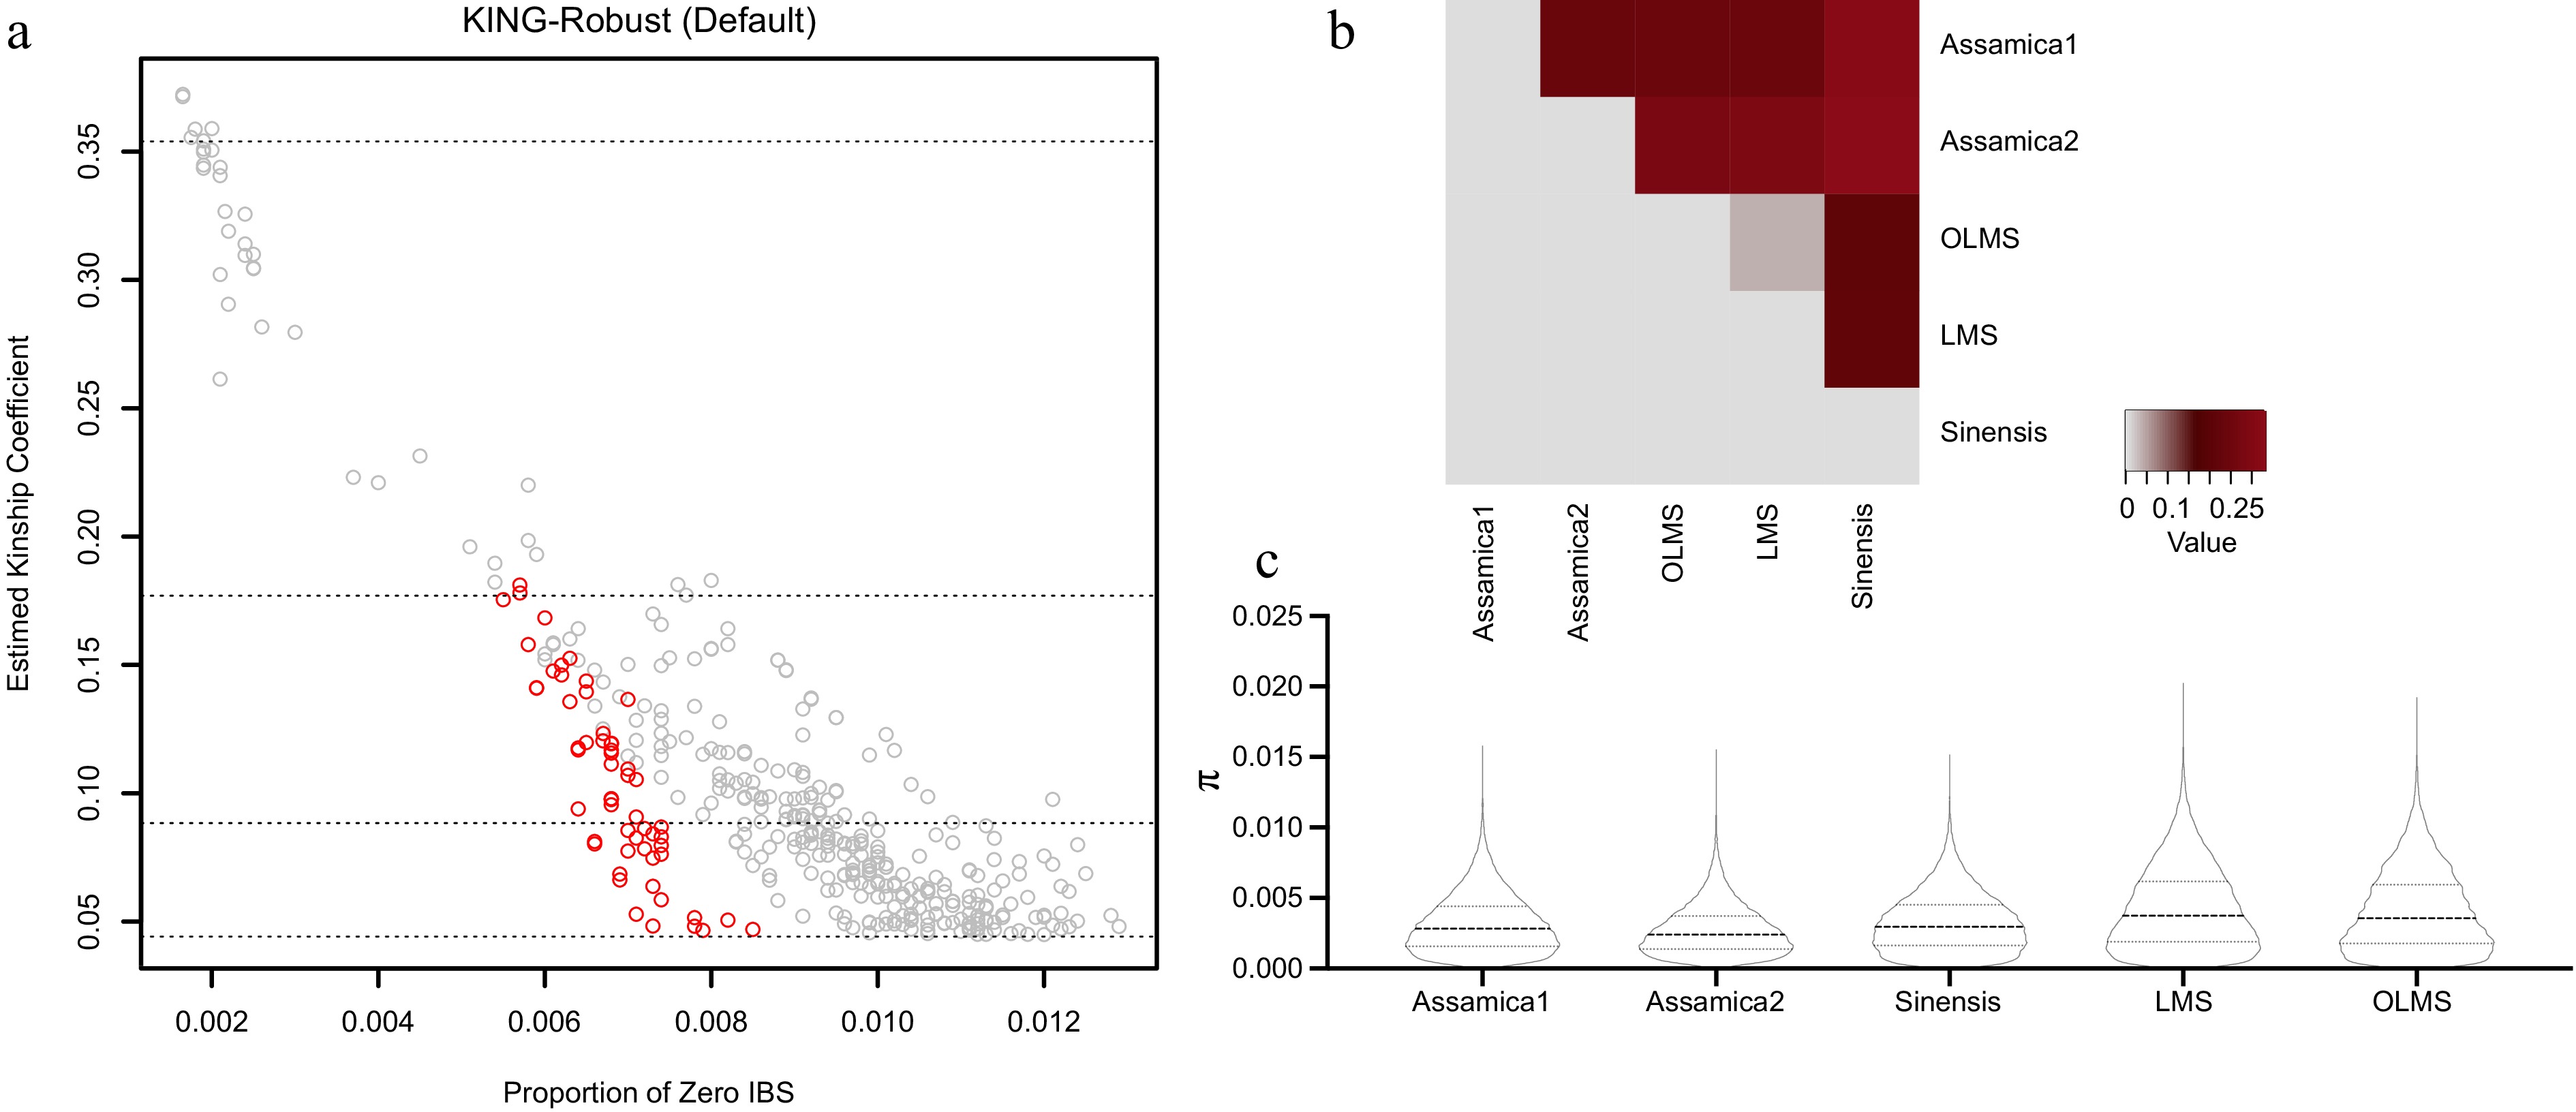
Figure 4.
The genetic relationships between samples and the genetic differentiation coefficient (FST) between different populations, as well as the corresponding nucleotide diversity (π).
-
Variants Type Core set SNP Total 32,334,340 Intergenic 29,520,274 Intronic 1,566,641 Exonic 433,604 5' UTR 40,383 3' UTR 92,101 UTR5;UTR3 229 Upstream 326,710 Downstream 341,541 Upstream;downstream 7,803 Splicing 4,838 Exonic;splicing 216 Table 1.
The number of SNPs in different genome structures.
-
Variants Type Core set SNP Total (exonic + exonic;splicing) 433,820 Nonsynonymous 243,634 Synonymous 179,902 Nonsyn/Syn ratio 1.35 Stop-gain 9,699 Stop-loss 518 Unknown 67 Table 2.
The number of large-effect SNPs.
-
FST Assamica1 Assamica2 OLMS LMS Sinensis Assamica1 0.236 0.239 0.236 0.321 Assamica2 0.281 0.282 0.328 OLMS 0.036 0.209 LMS 0.212 Sinensis Table 3.
Genetic differentiation coefficient (FST) among groups. FST values range from 0 and 1, with higher values indicating greater genetic differences among populations.
Figures
(4)
Tables
(3)