-
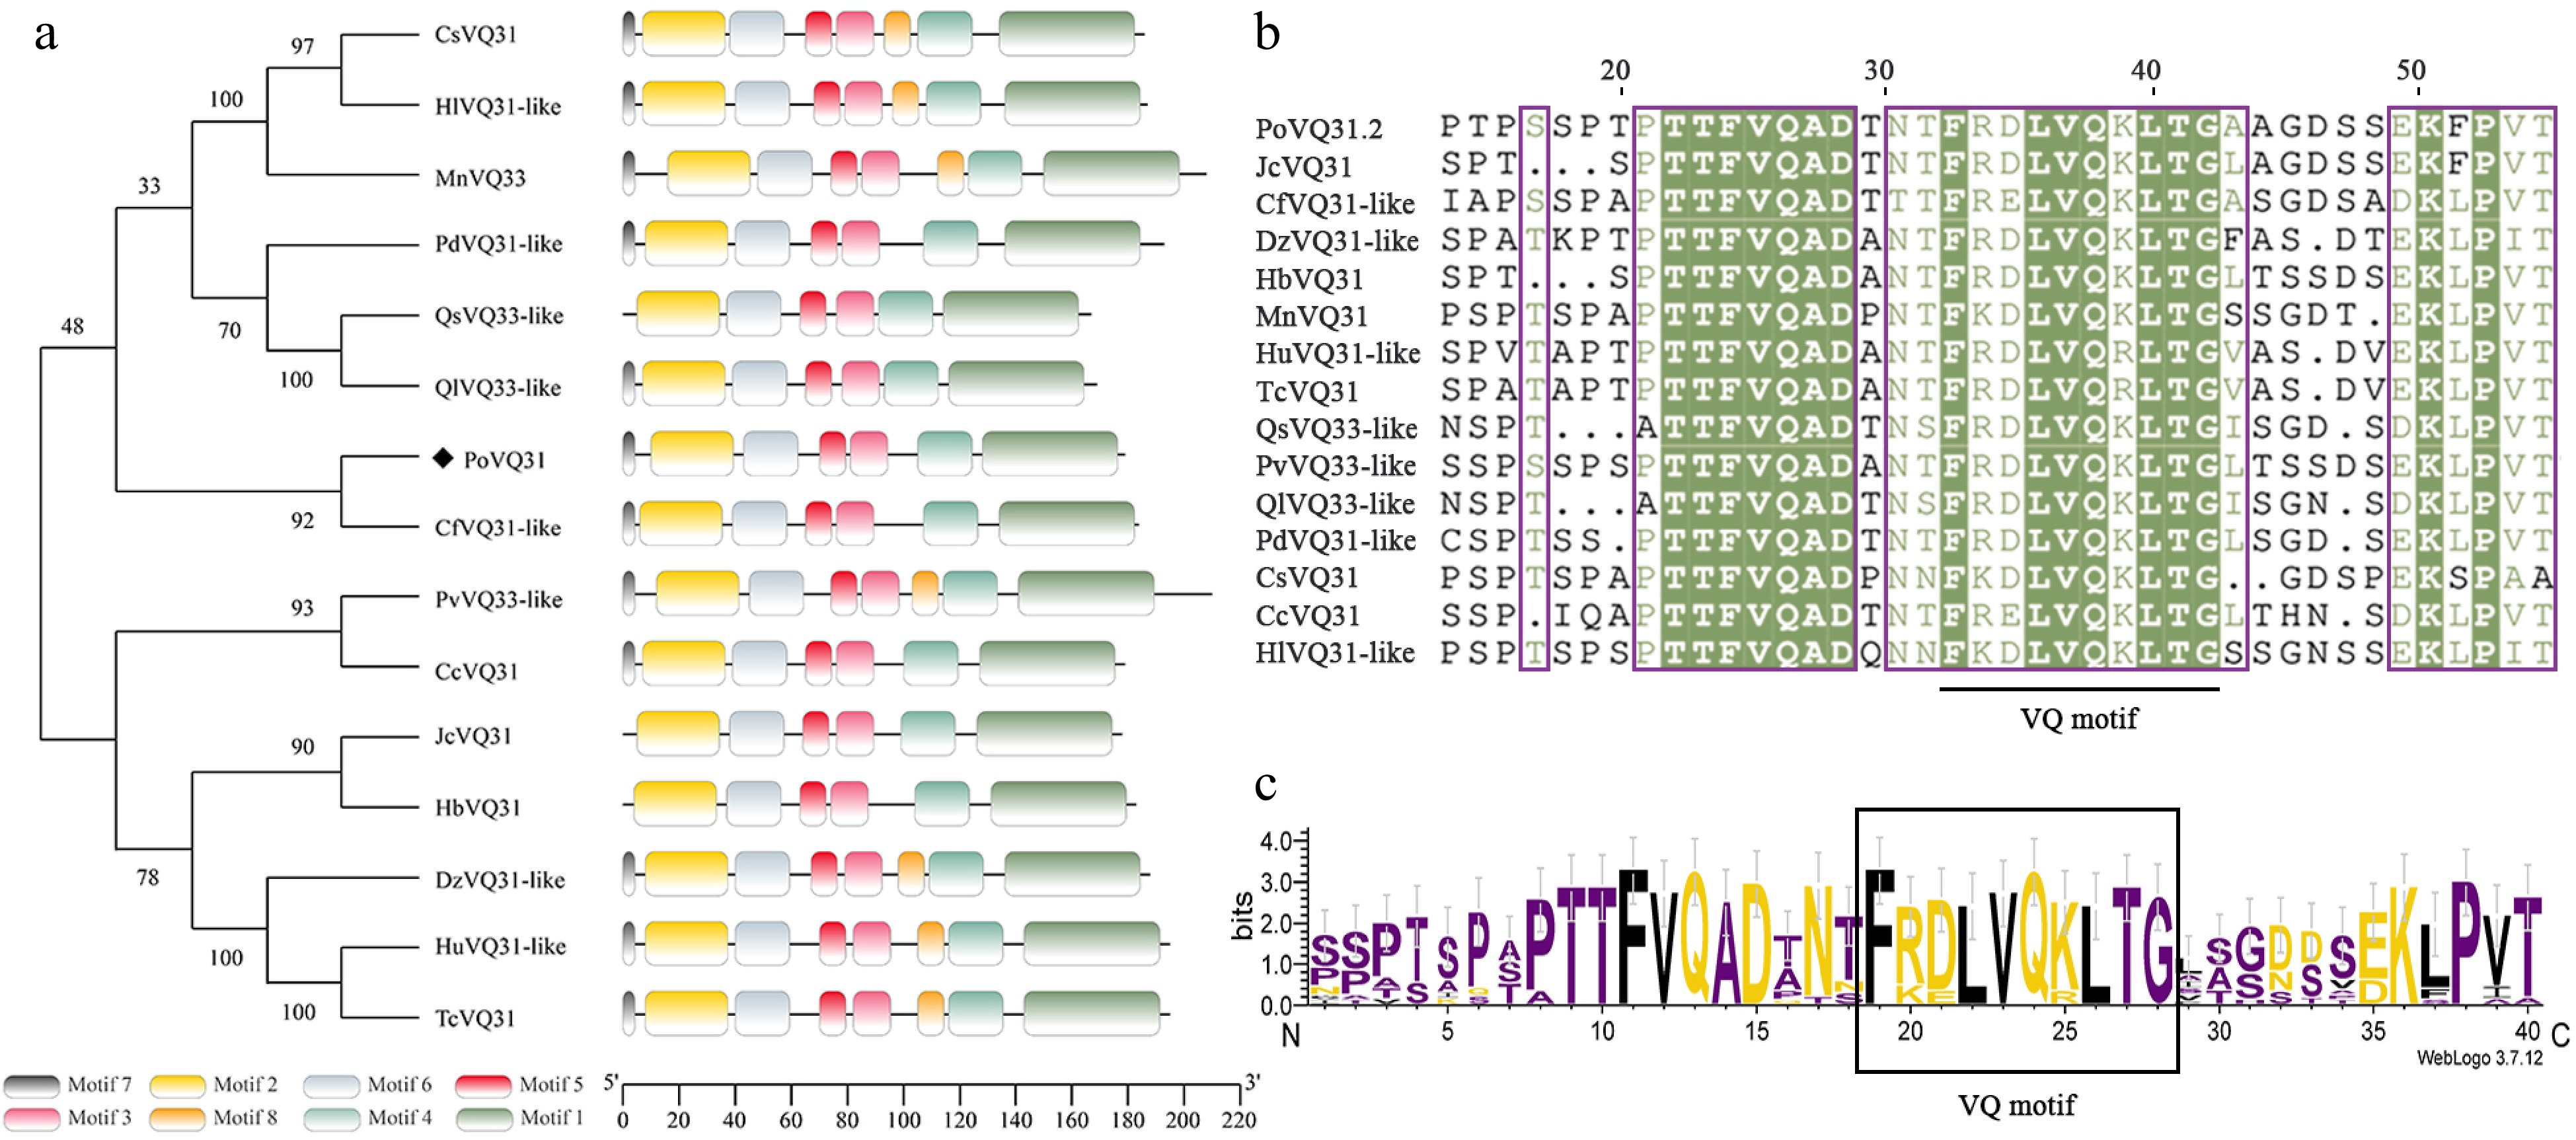
Figure 1.
Phylogenetic analysis and structure characterization of PoVQ31. (a) Phylogenetic tree constructed by Paeonia ostii 'Fengdan' PoVQ31 and other species's VQ proteins. Conserved motifs of VQ proteins, each denoted by a distinct color. (b) Multiple sequence alignment of the PoVQ31. (c) The specific highly conserved motif of VQ protein.
-
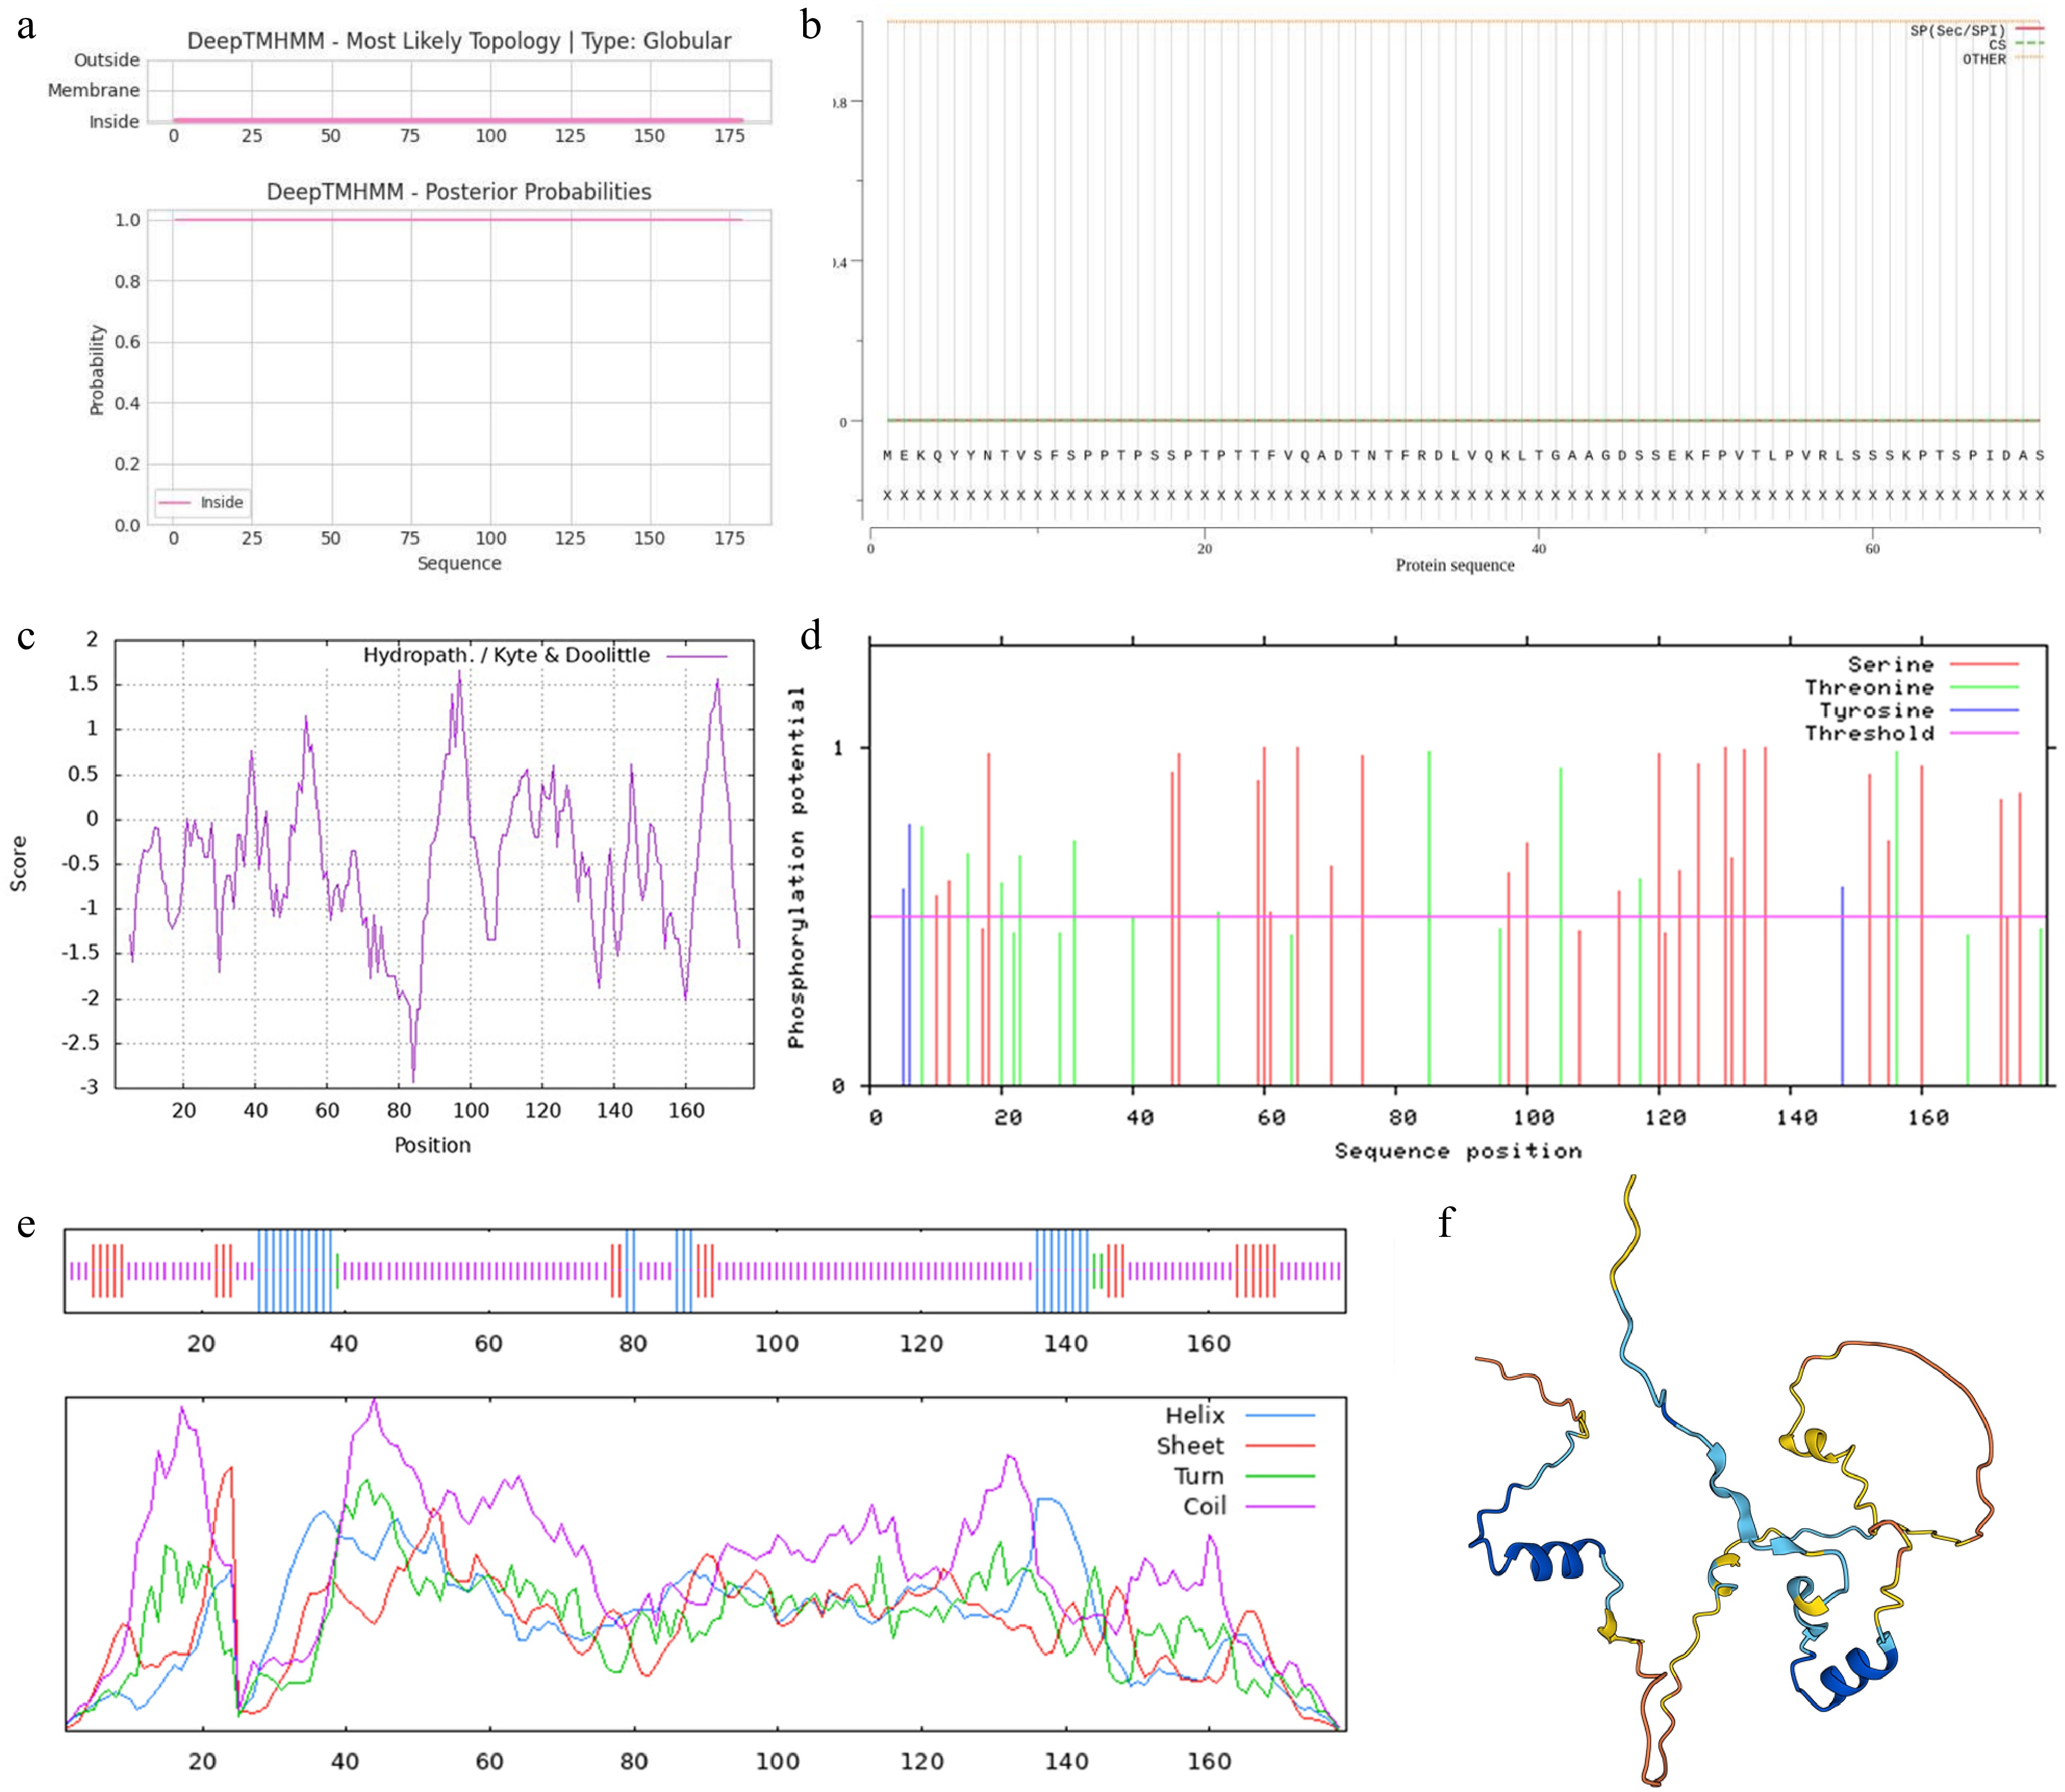
Figure 2.
Bioinformatics analysis of PoVQ31. Prediction of (a) transmembrane structure, (b) signal peptide, (c) hydrophilicity/hydrophobicity, (d) phosphorylation sites, (e) secondary structure, and (f) tertiary structure of PoVQ31 protein.
-
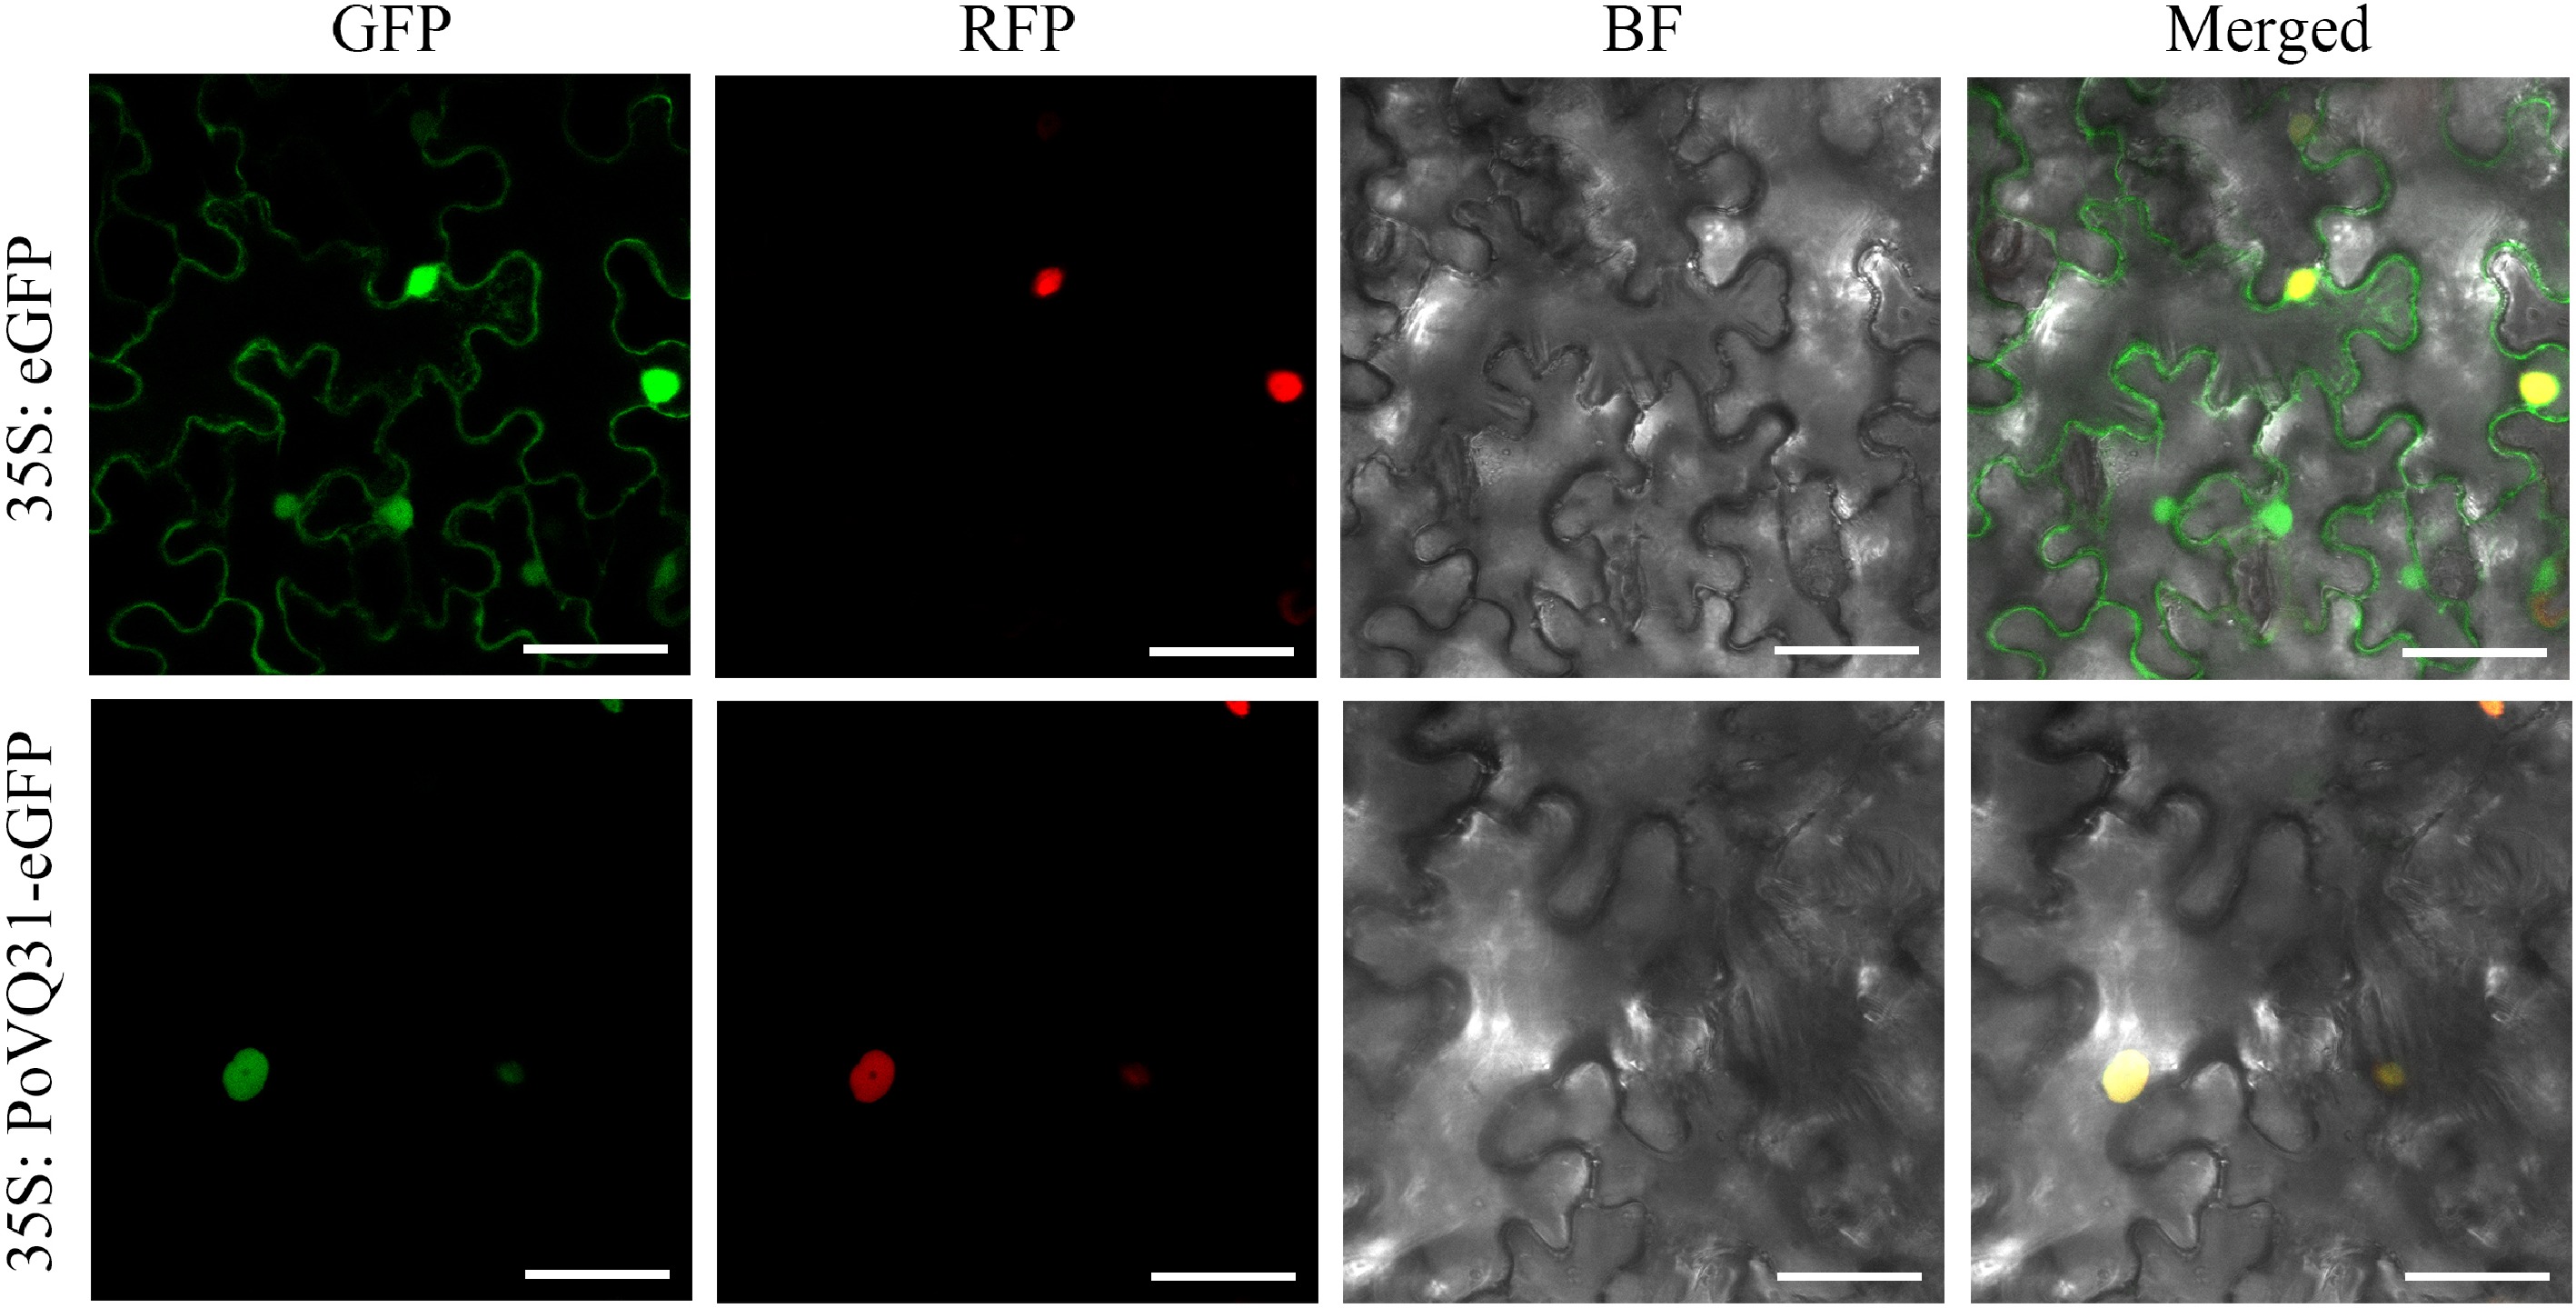
Figure 3.
Subcellular localization of PoVQ31. GFP, green fluorescent protein; RFP, nuclear localization signal exhibited by the red fluorescent protein; BF, bright-field image; merged, overlay images. Scale bars = 50 μm.
-
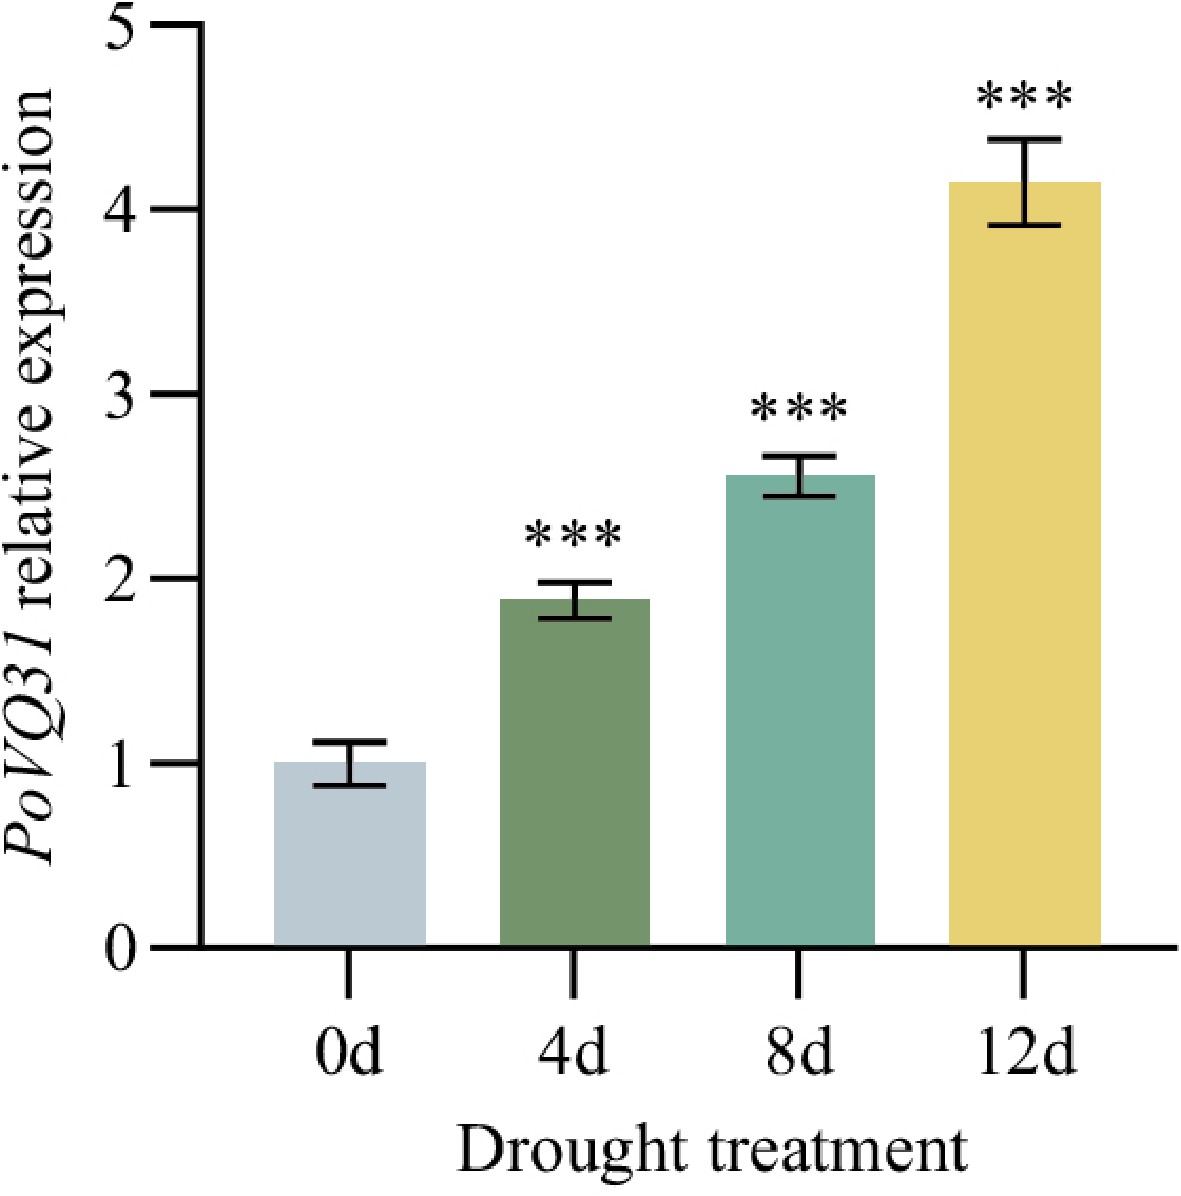
Figure 4.
Relative expression level of PoVQ31 under drought stress at different times. Data are presented as the mean ± standard error of the mean. Significant differences from the 0d were determined by Student's t-test (*** p < 0.001).
-
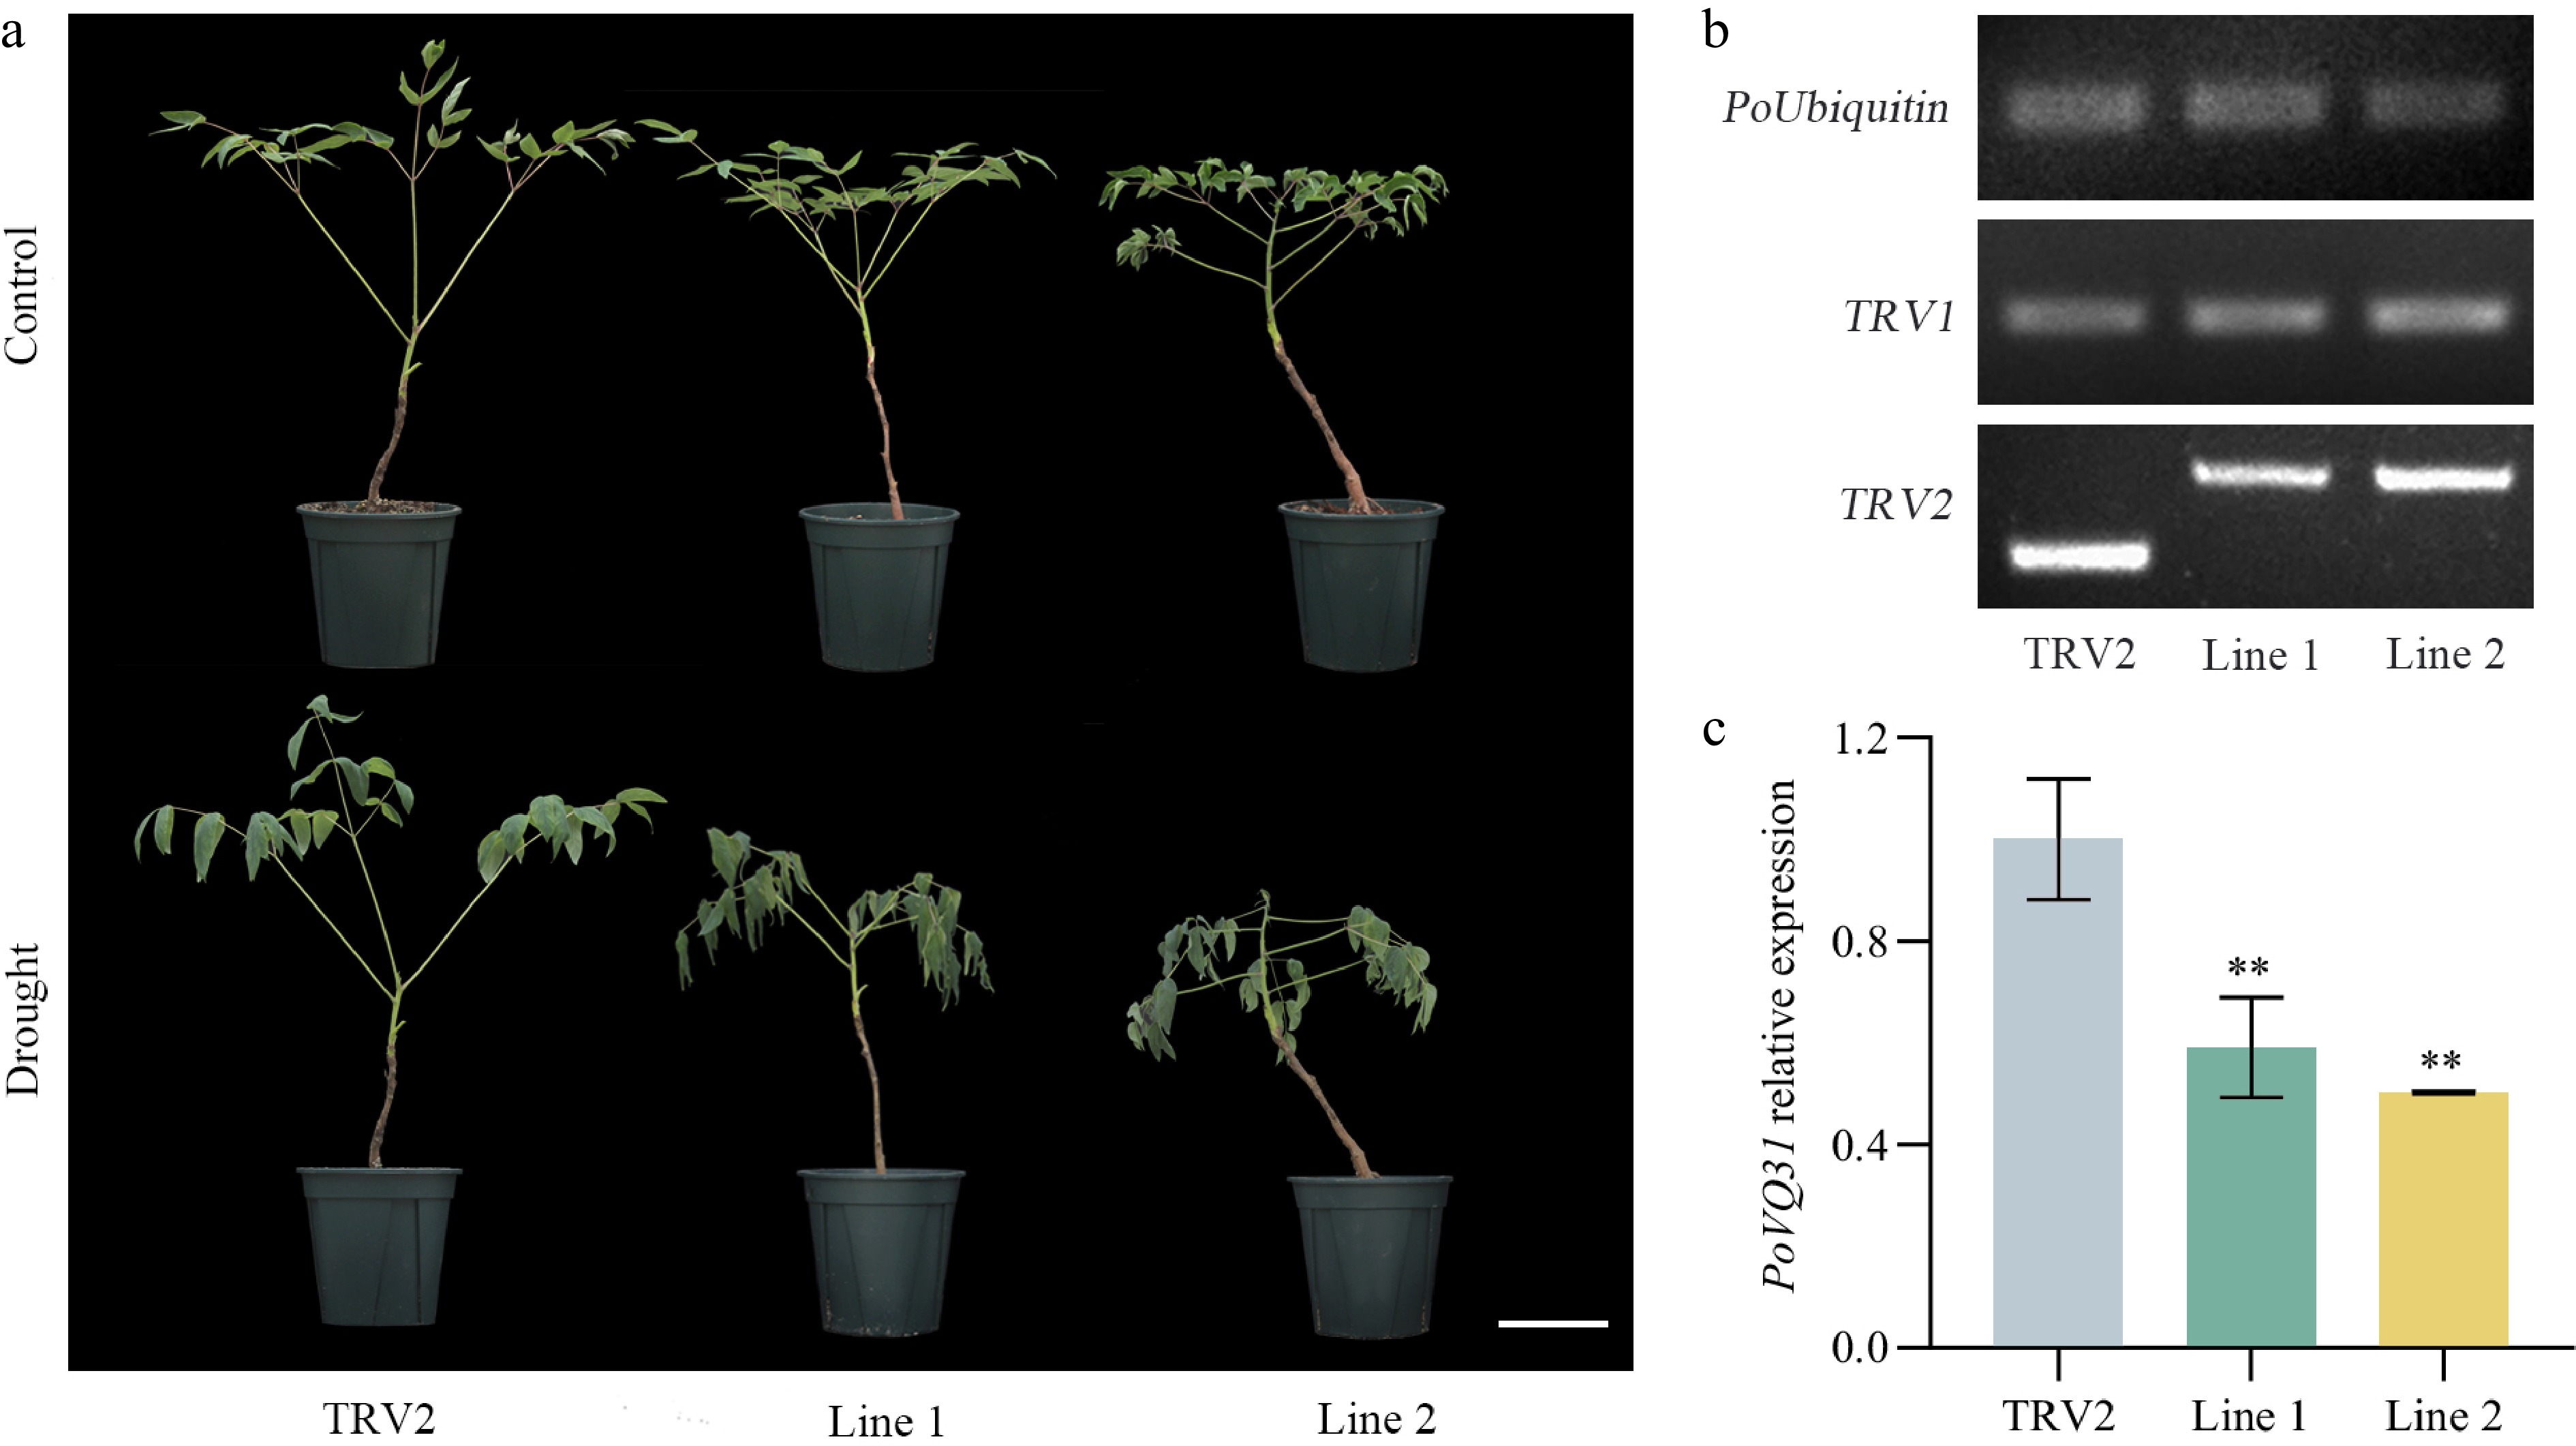
Figure 5.
Virus induced gene silencing of PoVQ31 in Paeonia ostii 'Fengdan'. (a) Phenotypic comparison of TRV2 (empty vector-transformed) and silenced plants after 15 d of drought treatment. Scale bars = 10 cm. (b) Identification of positive plants by PCR technology. (c) Silencing efficiency detection of positive lines by qRT-PCR technology. Data are presented as the mean ± standard error of the mean. Significant differences from the TRV2 were determined by Student's t-test (** p < 0.01).
-
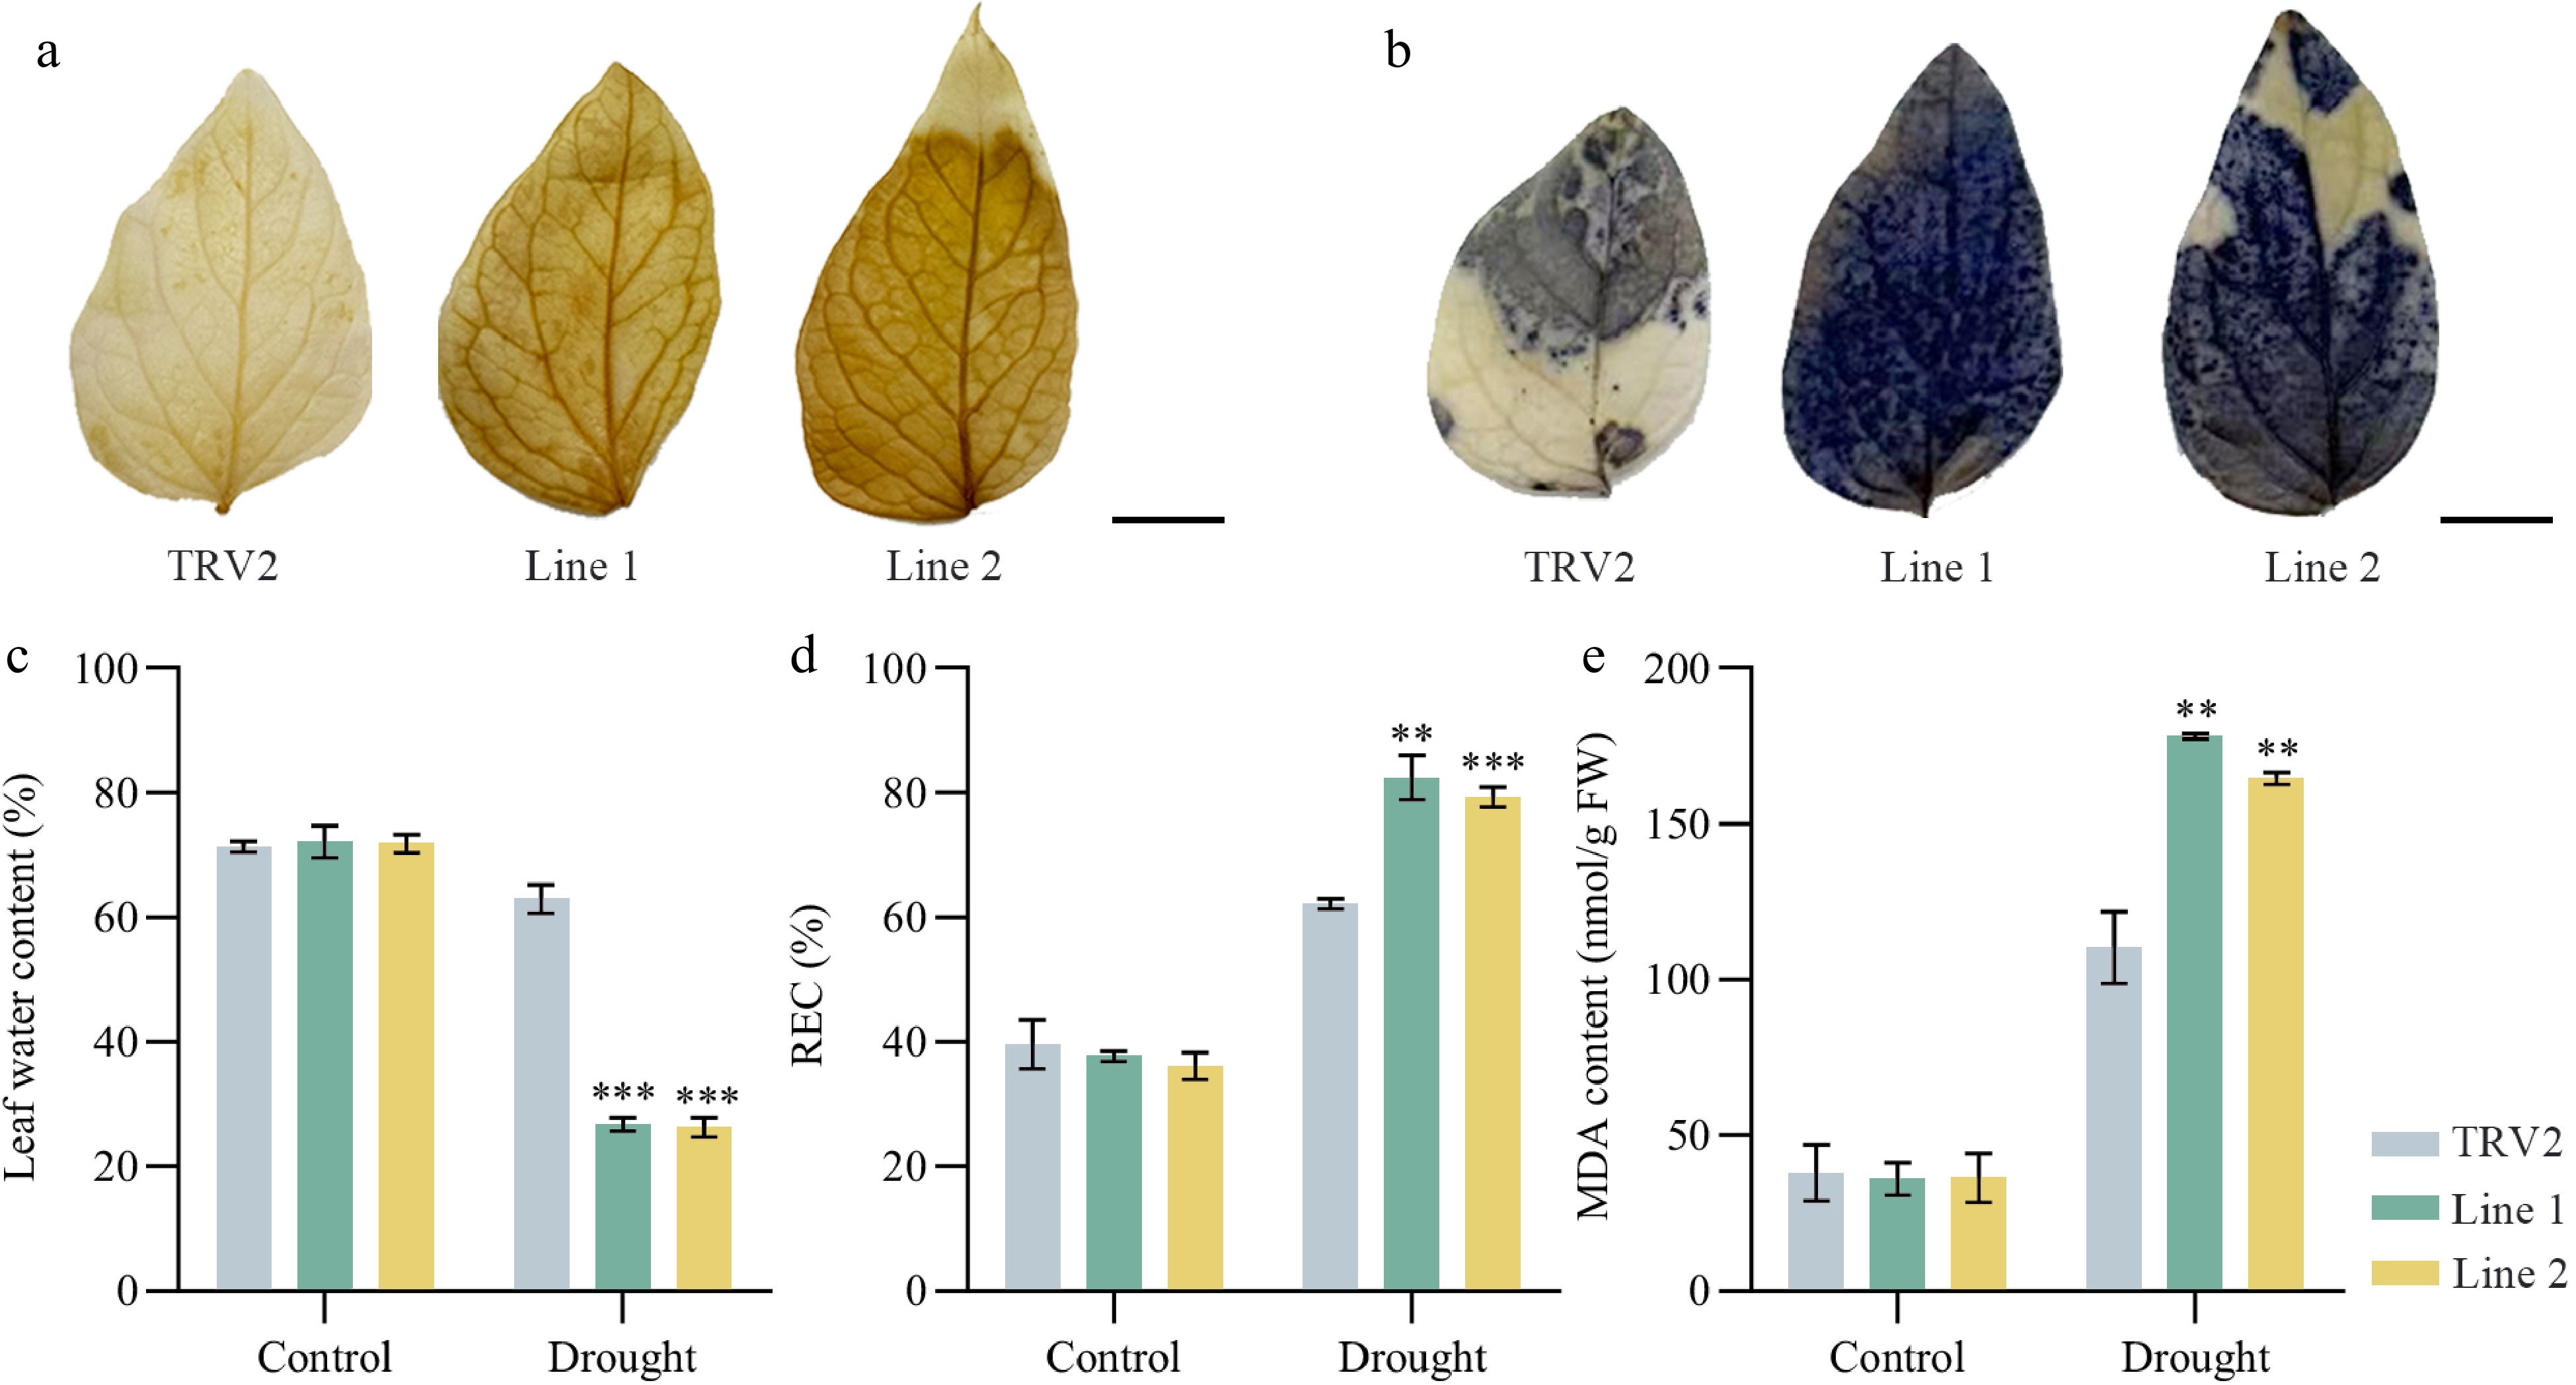
Figure 6.
Physiological indices of TRV2 and PoVQ31-silenced plants under drought treatment. (a) DAB and (b) NBT staining of Paeonia ostii 'Fengdan' leaves. Greater superoxide accumulation is indicated by darker staining. Scale bars = 1 cm. (c) Leaf water content. (d) Leaf REC. REC, relative electric conductivity. (e) Leaf MDA content. MDA, malondialdehyde. Data are presented as the mean ± standard error of the mean. Significant differences from the TRV2 were determined by Student's t-test (** p < 0.01, *** p < 0.001).
-
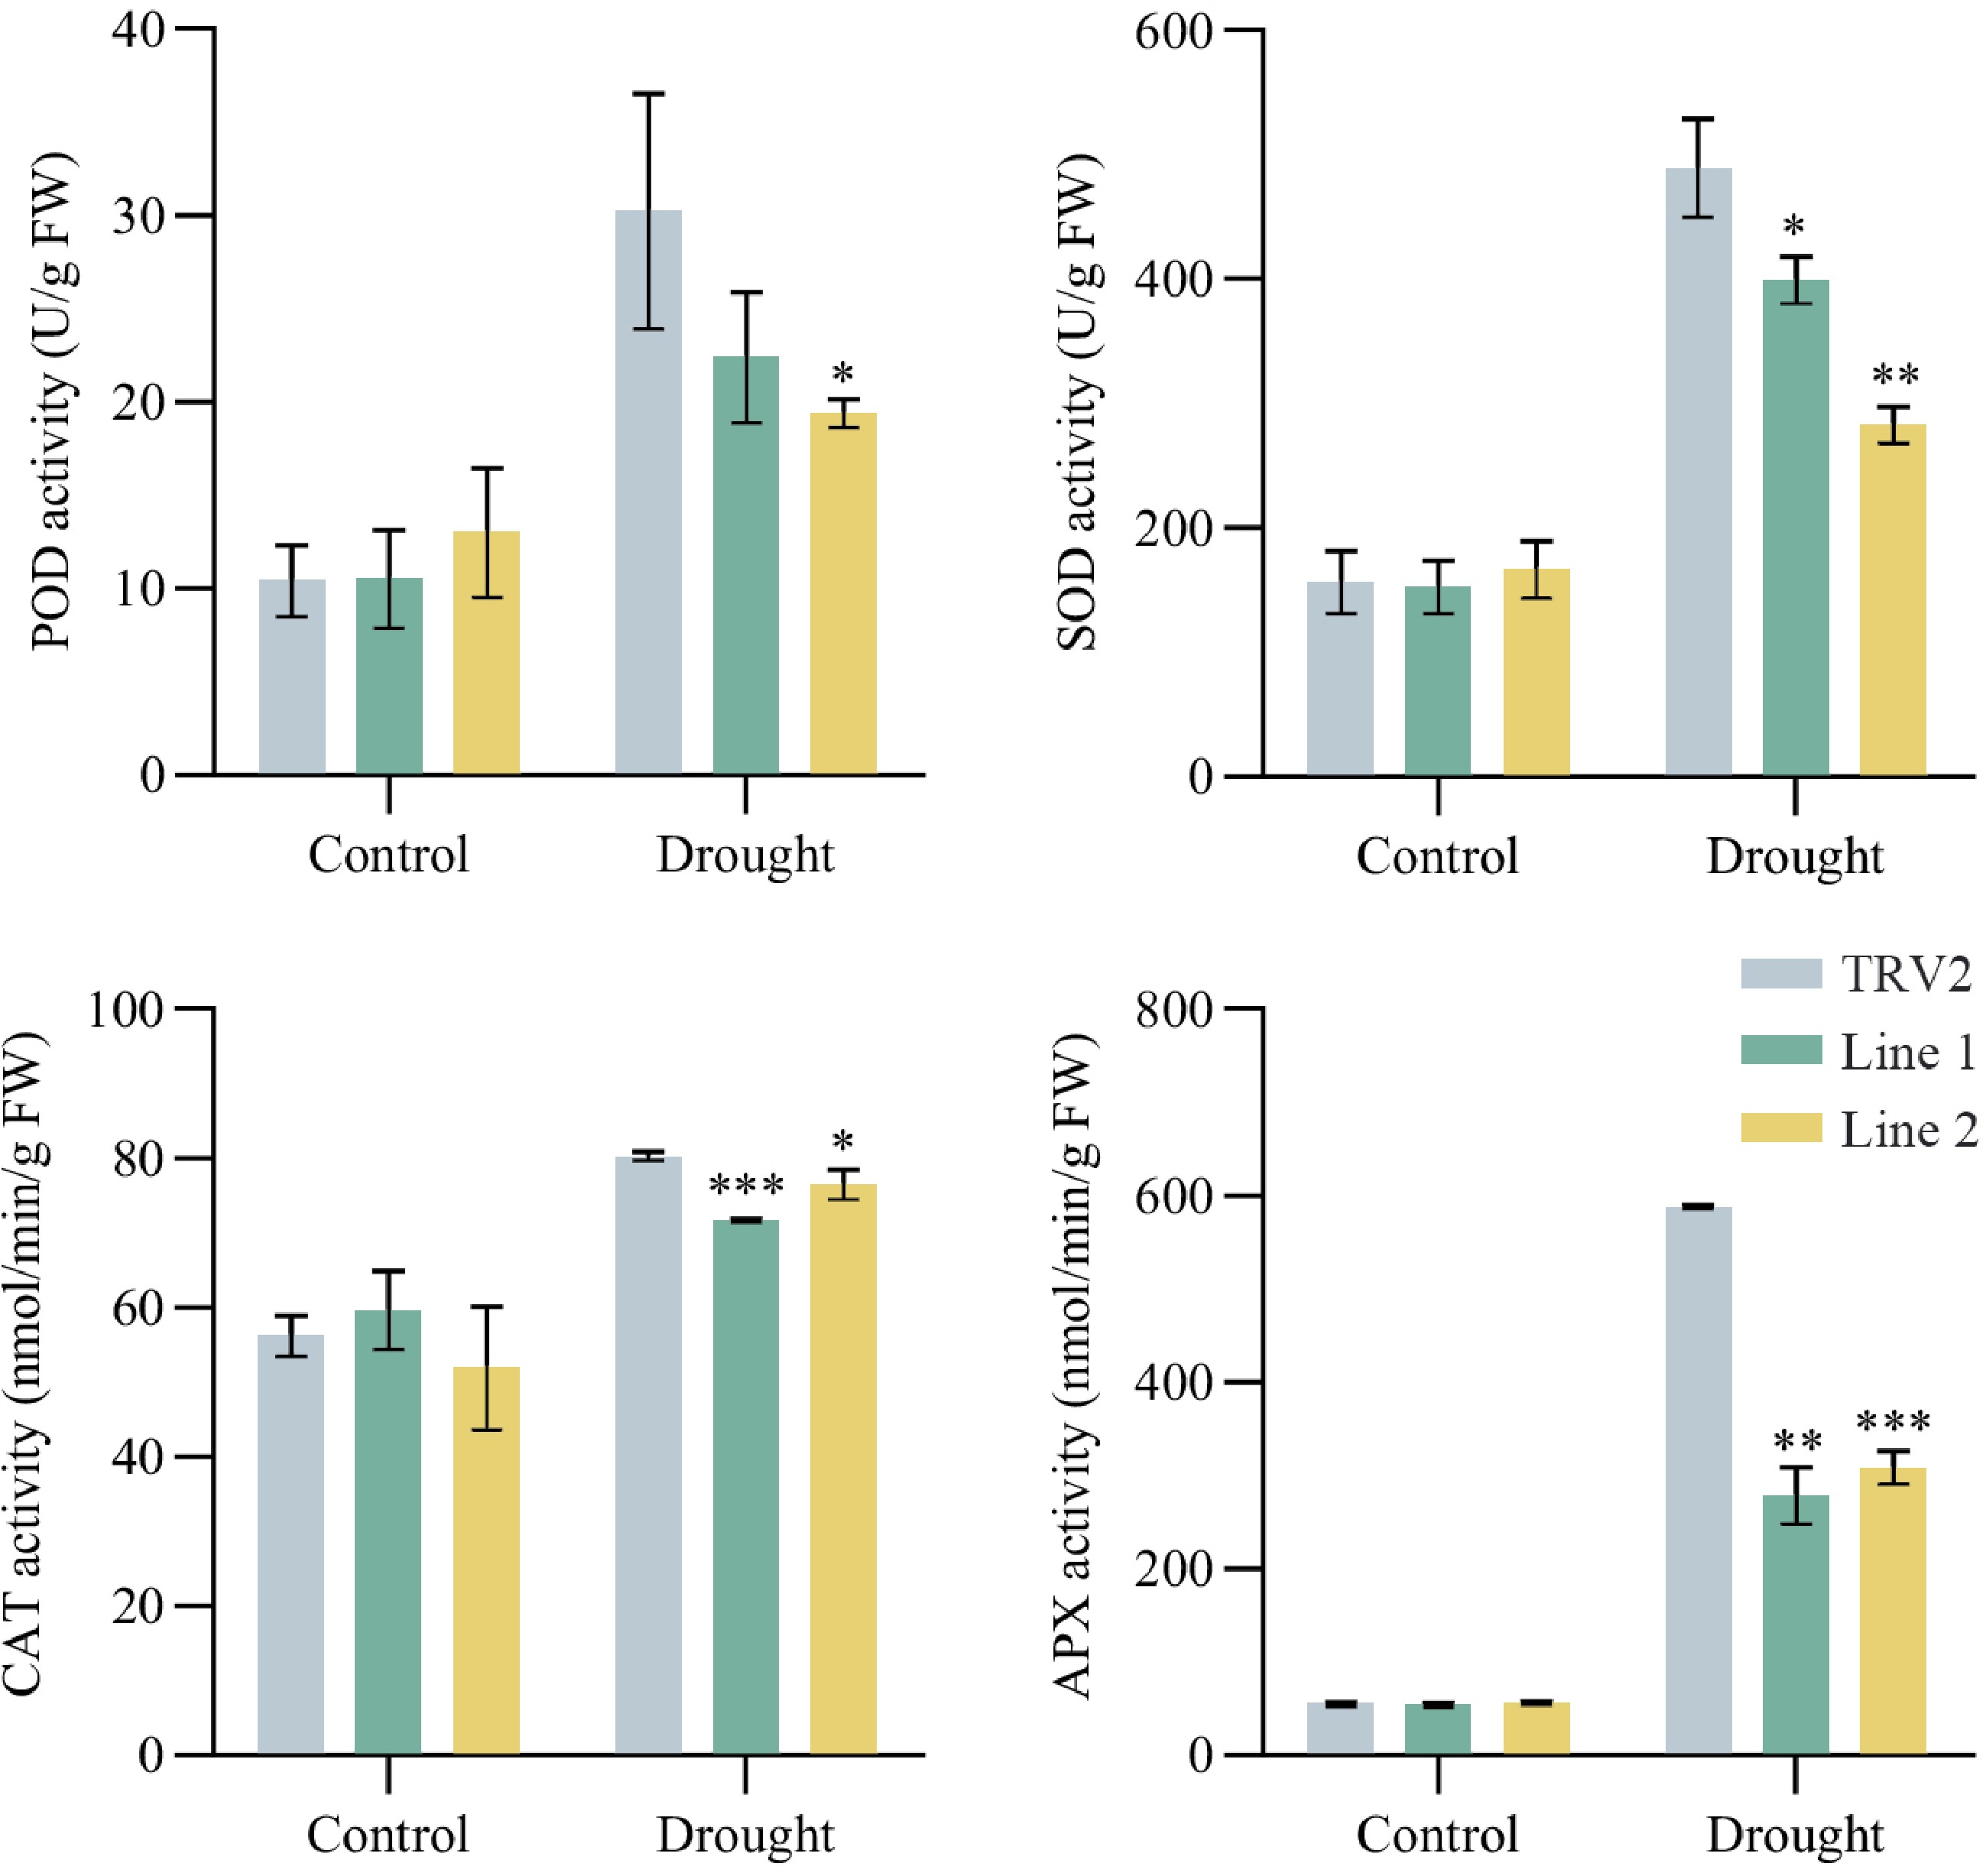
Figure 7.
Enzyme activities of TRV2 and PoVQ31-silenced plants under drought treatment. POD, peroxidase; SOD, superoxide dismutase; CAT, catalase; APX, ascorbate peroxidase. Data are presented as the mean ± standard error of the mean. Significant differences from the TRV2 were determined by Student's t-test (* p < 0.05, ** p < 0.01, *** p < 0.001).
Figures
(7)
Tables
(0)