-
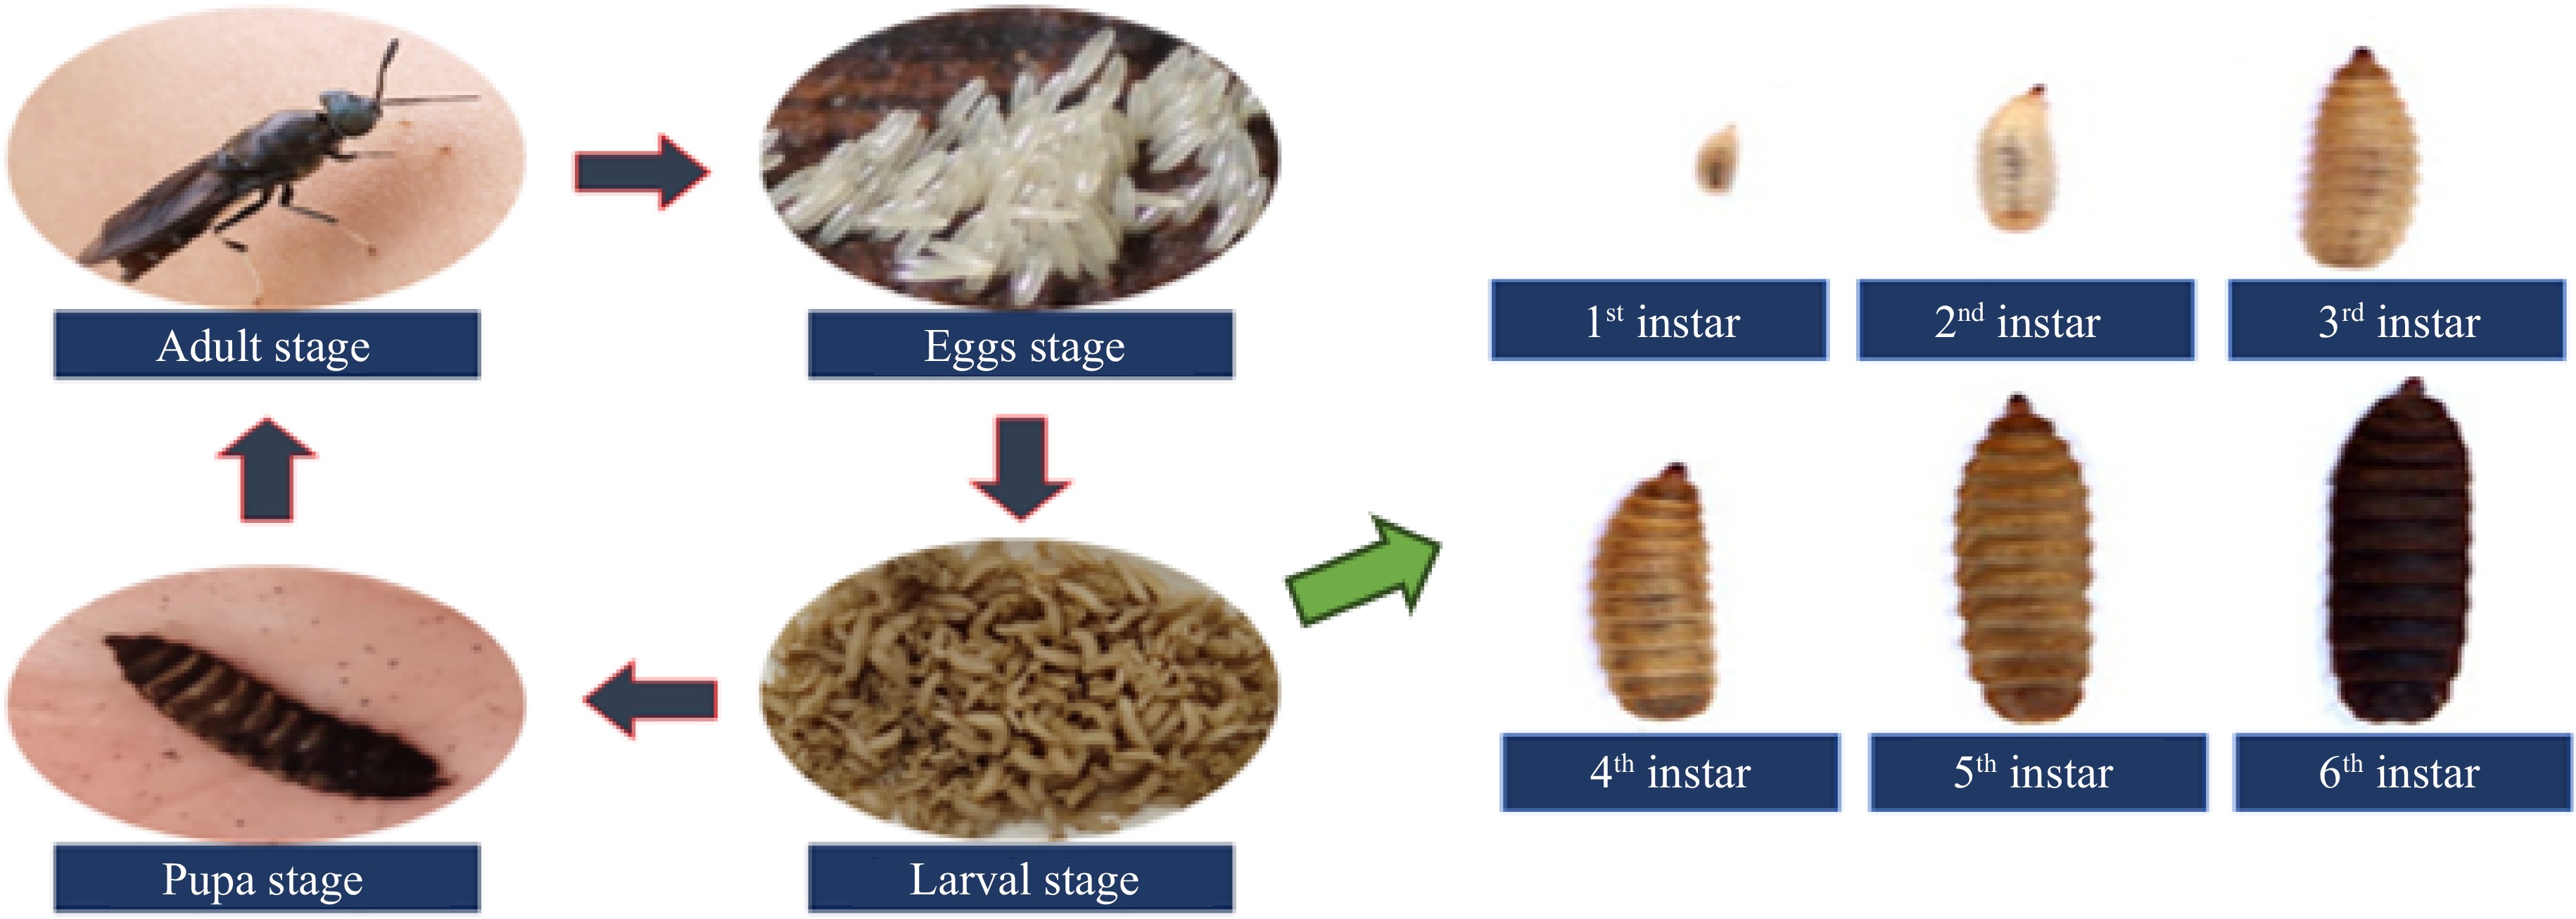
Figure 1.
The life cycle of black soldier flies in four phases and six stages of larvae in different instars.
-
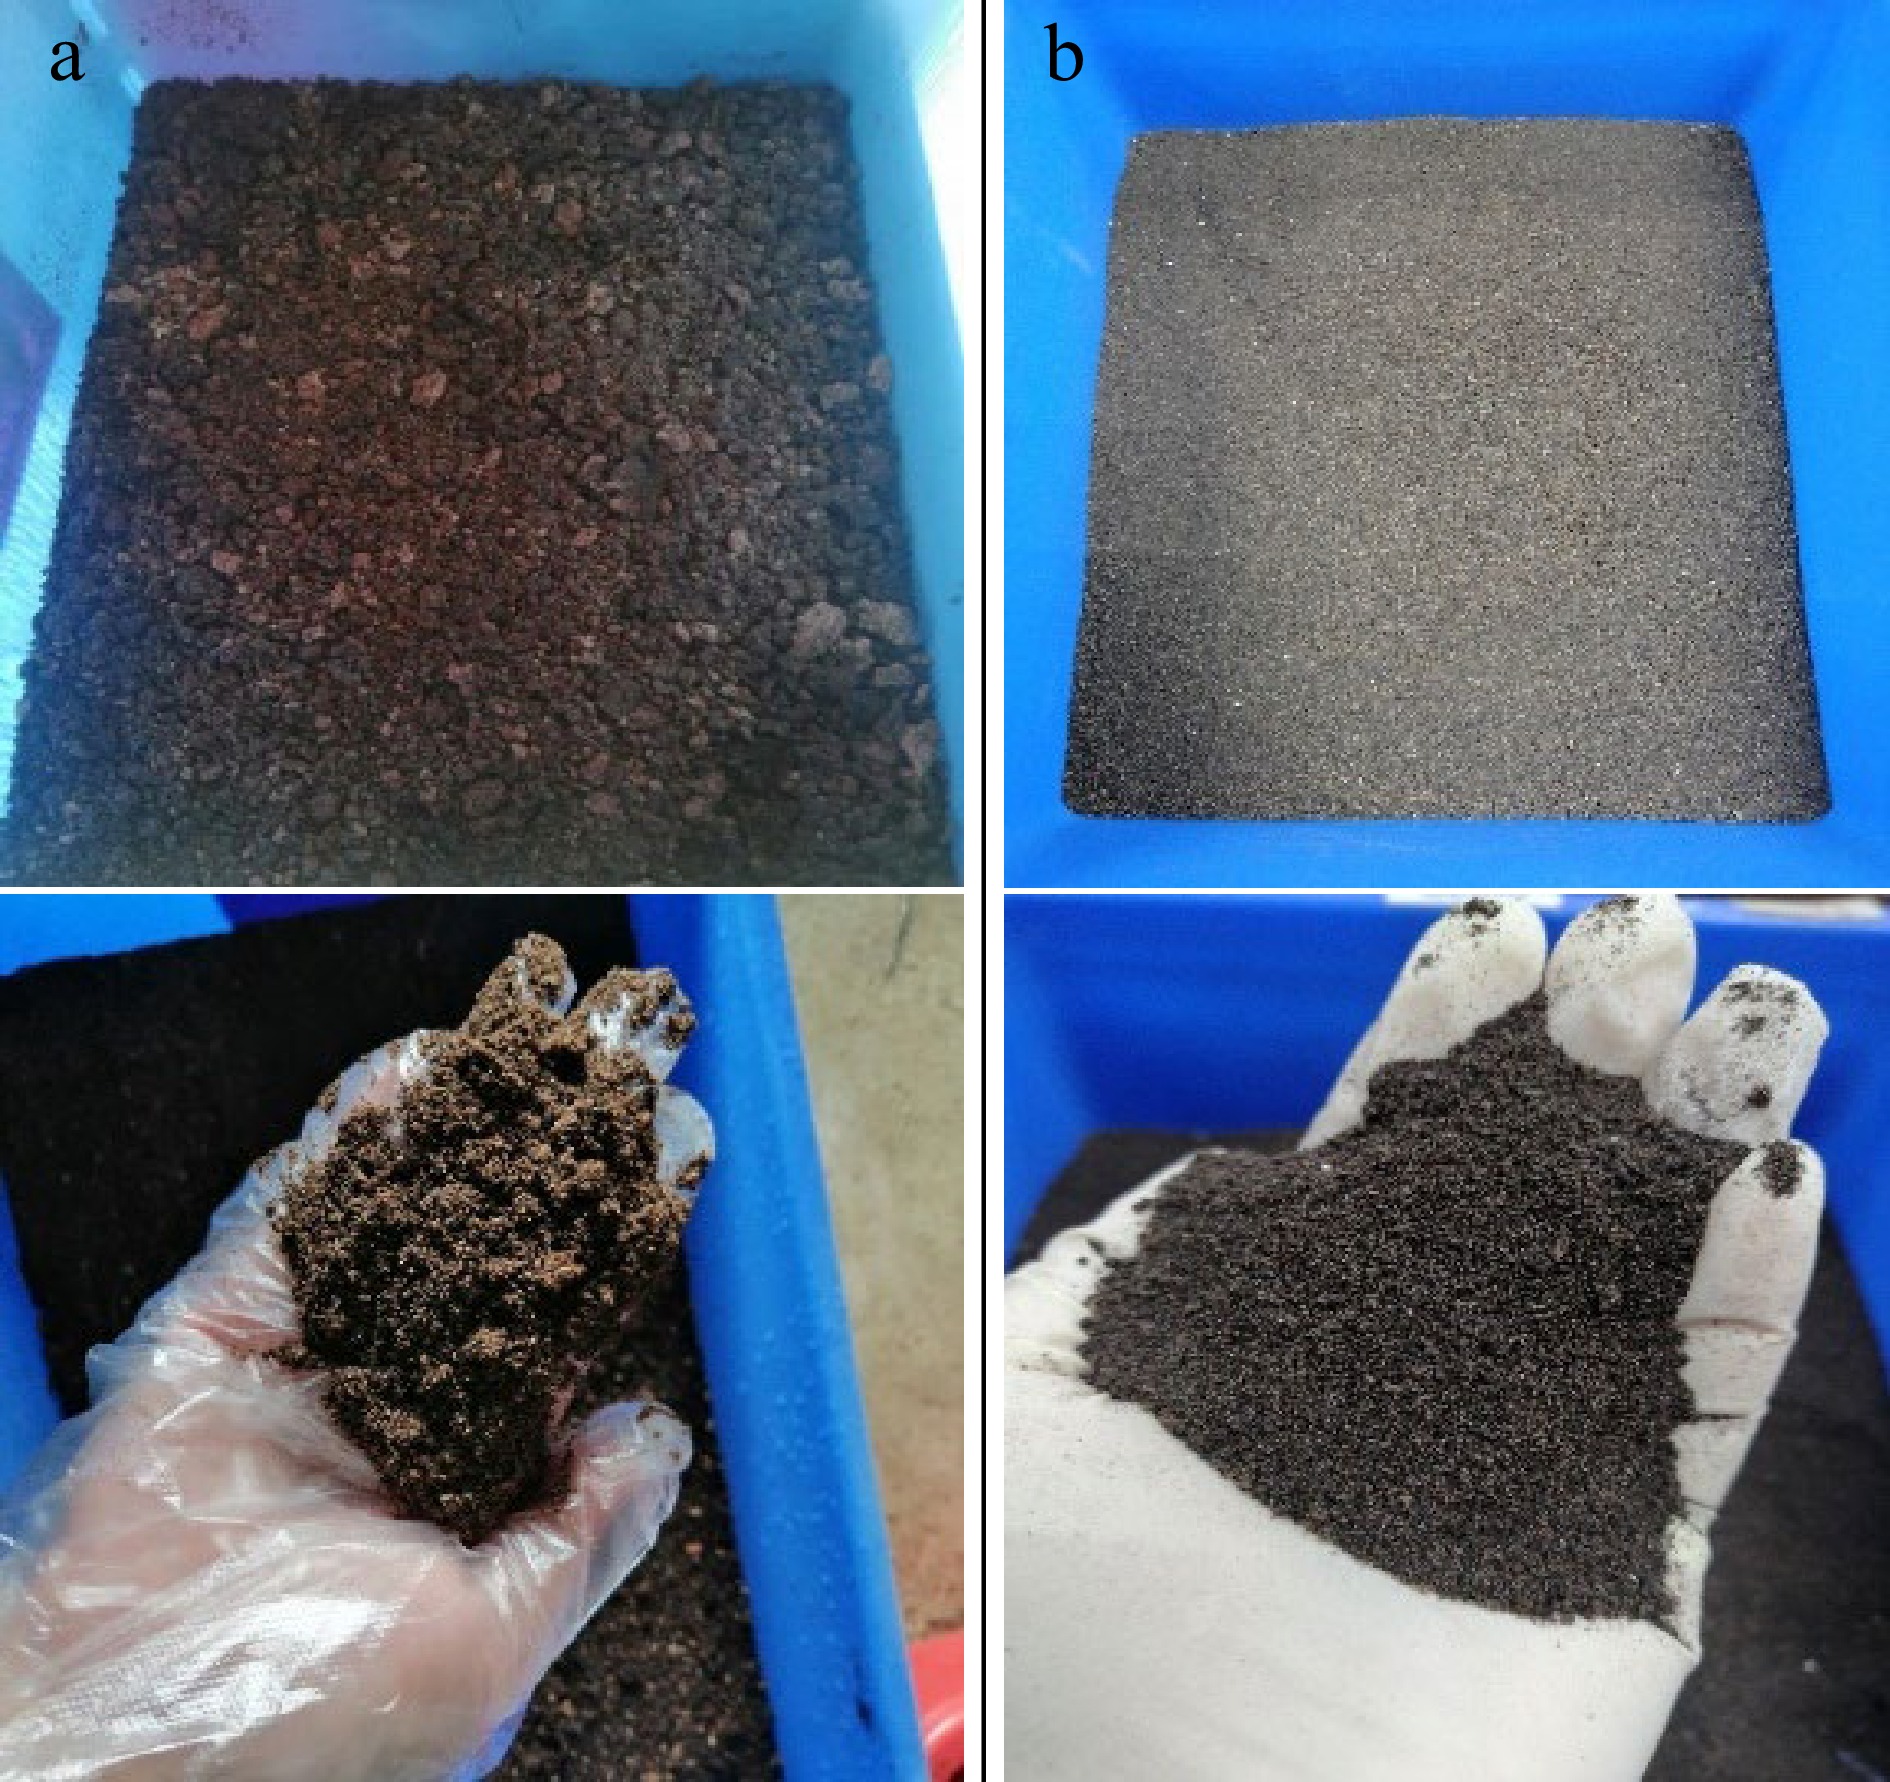
Figure 2.
(a) Colour and texture of undigested substrate (DC and PKE mixture). (b) Colour and texture of BSFL frass after being fed on DC and PKE mixture.
-
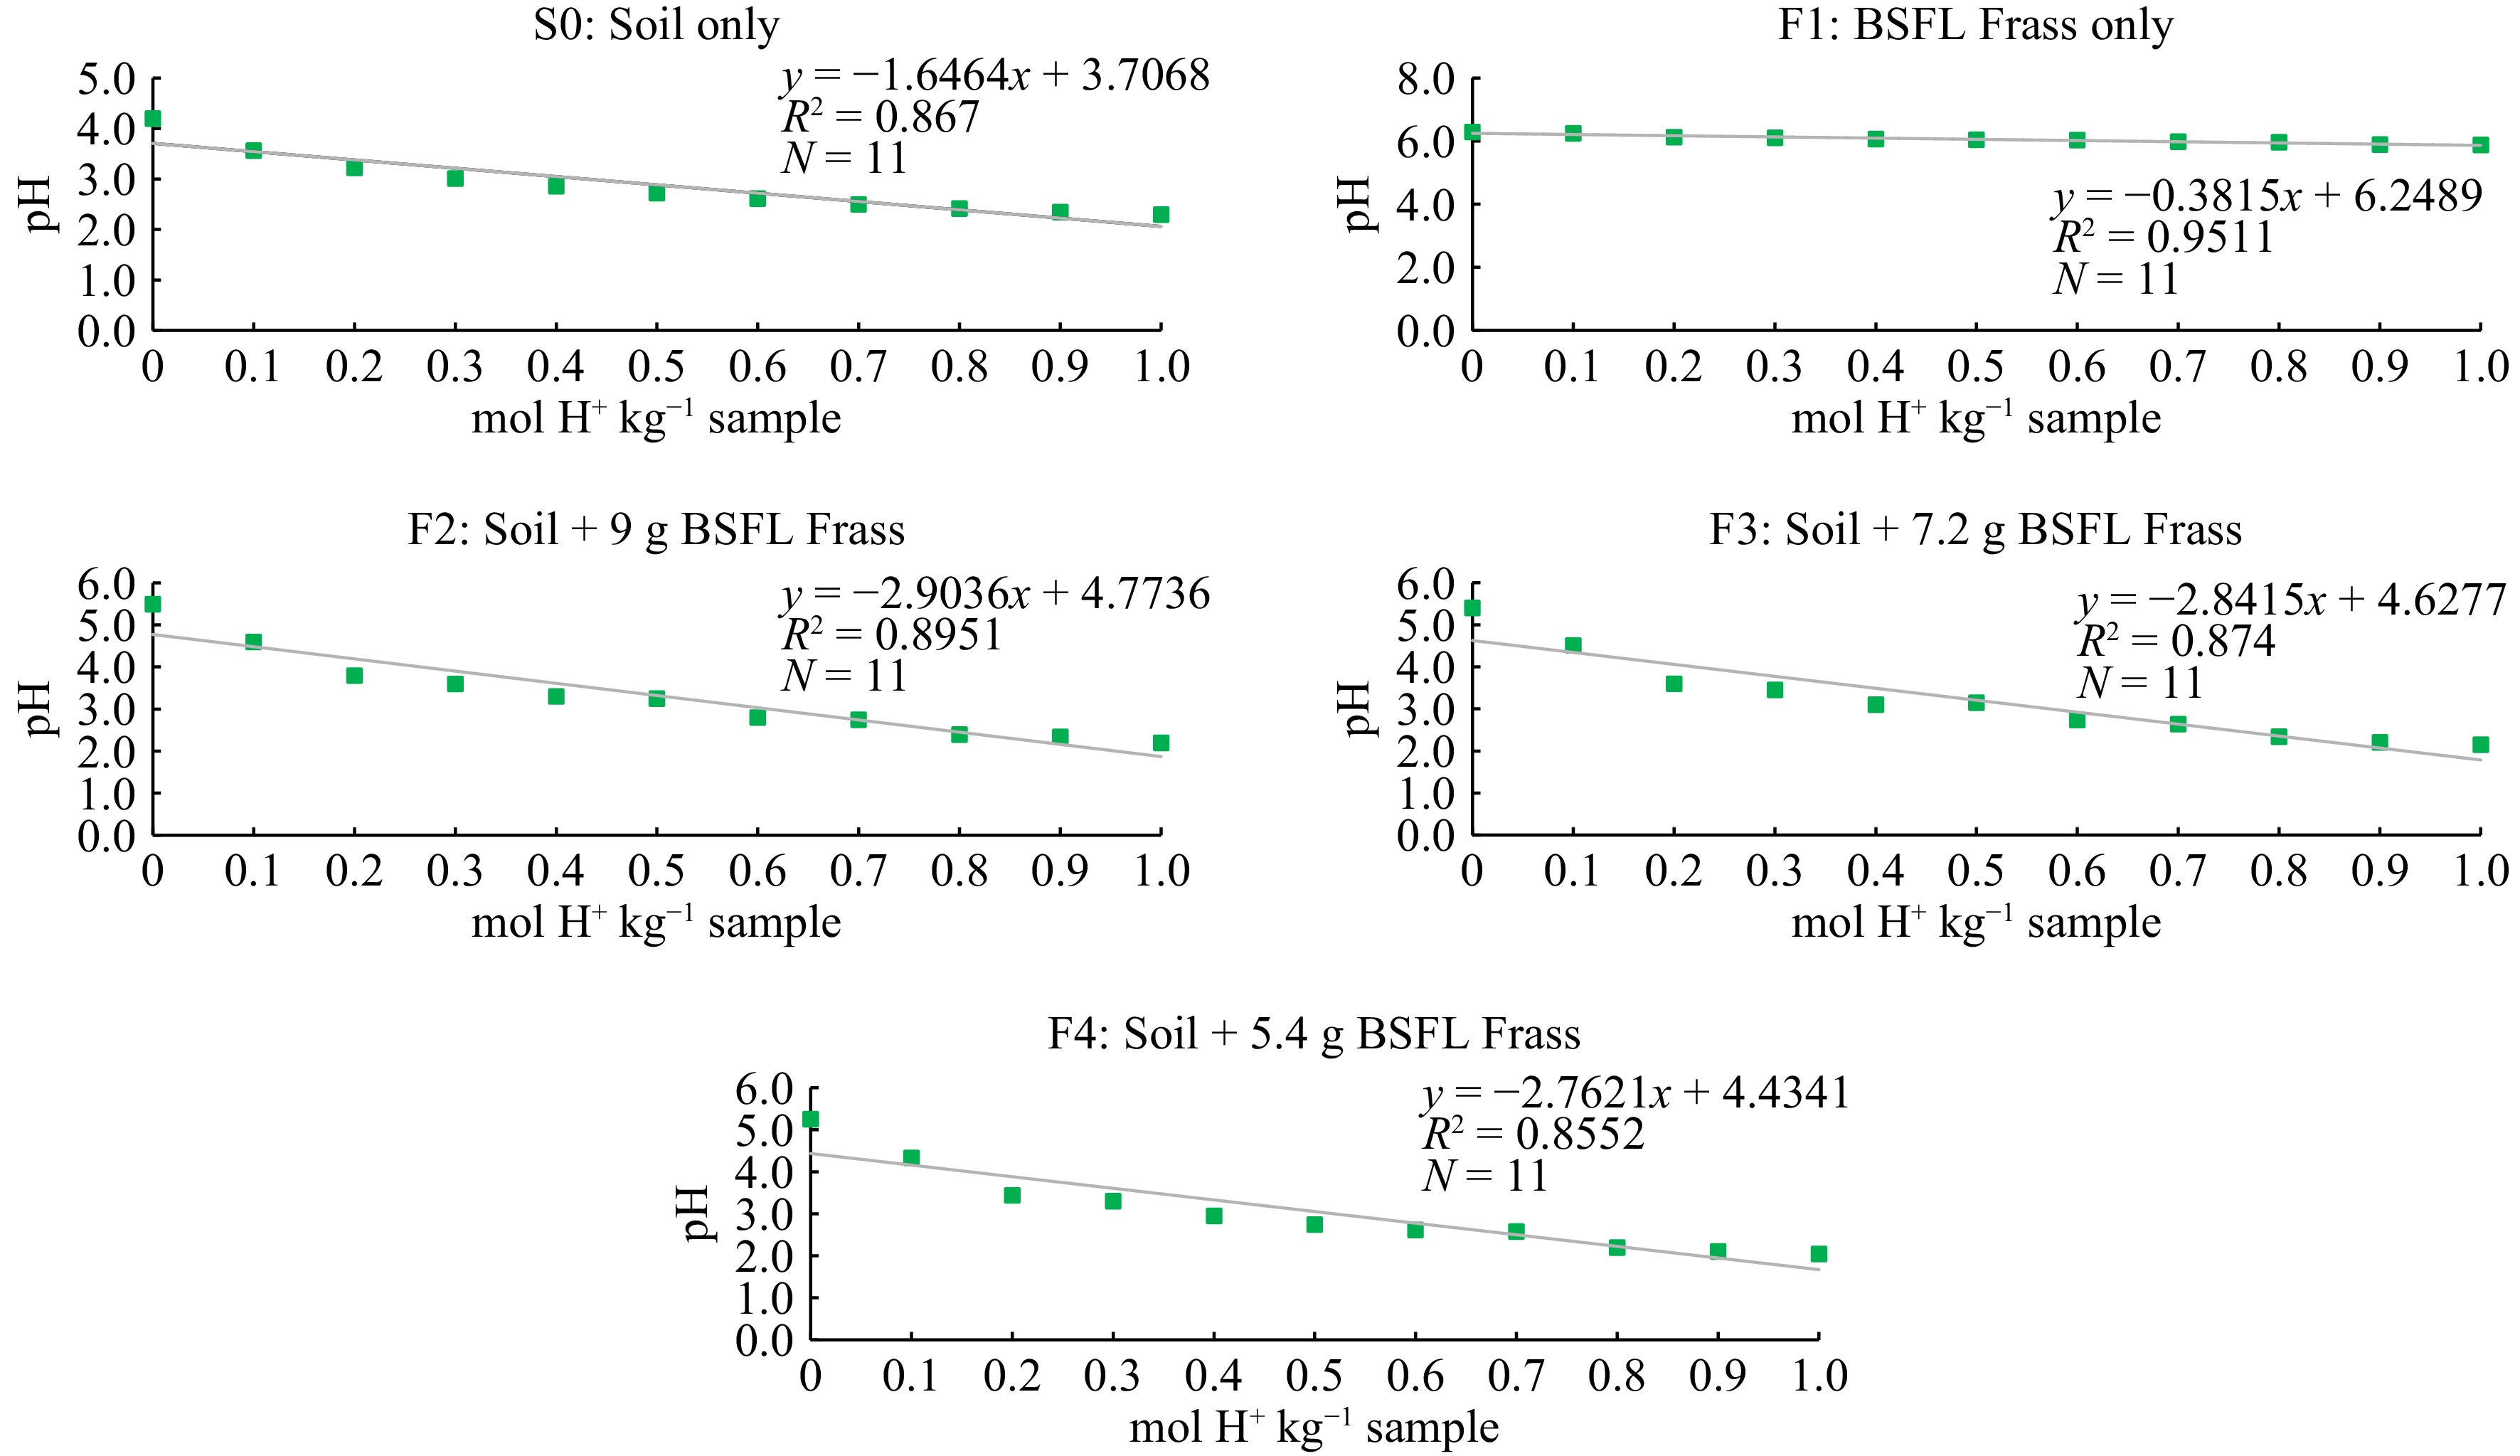
Figure 3.
Relationship between acid addition and pH of samples. * represents a significant difference at p ≤ 0.05.
-
Properties Mixture of DC and PKE pHwater 6.33 ± 0.03 CEC (cmol kg−1) 10.1 ± 1.63 Exchangeable NH4+ (mg kg−1) 3.97 ± 0.62 Available NO3− (mg kg−1) 3.27 ± 0.23 Total N (%) 1.72 ± 0.14 Total P (mg kg−1) 2976 ± 87.9 TOM (%) 82.5 ± 2.09 TOC (%) 47.8 ± 1.21 C/N ratio 28:1 The values given are based on a dry-weight basis. Mean value followed by ± standard error. Table 1.
Selected chemical properties of decanter cake and palm kernel expeller.
-
Property Value obtained pHwater 4.67 ± 0.25 CEC (cmol kg−1) 11.67 ± 0.21 Total N (%) 0.37 ± 0.42 Total P (mg kg−1) 5.27 ± 0.31 Available P (mg kg−1) 0.114 ± 0.01 OM (%) 5.03 ± 1.04 TOC (%) 2.91 ± 0.60 Exchangeable NH4+ (mg kg−1) 12.00 ± 2.49 Available NO3− (mg kg−1) 5.20 ± 1.01 The values given are based on a dry-weight basis. Mean value followed by ± standard error. Table 2.
Initial selected chemical properties of Bekenu Series soil for pH buffering capacity determination.
-
Treatment T1 T2 T3 T4 T5 Ambient temperature (°C) 26 ± 0.30 26 ± 0.30 26 ± 0.30 26 ± 0.30 26 ± 0.30 Feeding tray temperature (°C) 27 ± 0.48 27 ± 0.41 27 ± 0.43 27 ± 0.44 27 ± 0.41 Mean value followed by ± standard error. No significant difference among the treatments at p < 0.05. T1: 15 g BSFL + 15 kg DC and PKE; T2: 20 g BSFL + 15 kg DC and PKE; T3: 25 g BSFL + 15 kg DC and PKE; T4: 30 g BSFL + 15 kg DC and PKE; T5: 35 g BSFL + 15 kg DC and PKE. Table 3.
Average temperature of ambient and feeding substrates in 54 d of rearing black soldier fly larvae.
-
BSFL
weights (g)Weight of DC and
PKE applied (kg)BSFL frass
produced (kg)Material reduction WRR (%) WRI (d−1) T1−15 15 2.43 83.79 ± 0.69 1.55 ± 0.01 T2−20 15 2.65 82.36 ± 0.64 1.53 ± 0.01 T3−25 15 2.75 81.69 ± 0.83 1.51 ± 0.02 T4−30 15 2.66 82.25 ± 0.53 1.52 ± 0.01 T5−35 15 2.42 83.84 ± 1.56 1.55 ± 0.03 The weight of DC and PKE are based on a wet-weight basis. The value of the frass given is based on a dry-weight basis. Mean value followed by ± standard error. No significant difference among the treatments at p < 0.05. T1: 15 g BSFL + 15 kg DC and PKE; T2: 20 g BSFL + 15 kg DC and PKE; T3: 25 g BSFL + 15 kg DC and PKE; T4: 30 g BSFL + 15 kg DC and PKE; T5: 35 g BSFL + 15 kg DC and PKE. Table 4.
Bioconversion of feeding substrates into frass excreted by black soldier fly larvae.
-
Property Treatments T1 T2 T3 T4 T5 pH in water 7.77 ± 0.1 7.68 ± 0.1 7.46 ± 0.2 7.70 ± 0.1 7.98 ± 0.1 CEC (cmol kg−1) 21.00 ± 0.3 20.63 ±1.5 20.43 ± 1.0 20.37 ± 0.4 20.23 ± 1.2 OM (%) 74.7 ± 2.4 71.3 ± 2.9 73.3 ± 2.7 74.0 ± 0.0 72.7 ± 0.7 Exchangeable NH4+ (mg kg−1) 101.57± 2.5 97.14± 6.4 113.95 ± 3.1 120.72±8.3 114.65 ± 5.3 Available NO3− (mg kg−1) 110.68 ± 4.2 100.17±1.2 84.99 ± 5.5 88.03 ± 9.5 103.44 ± 6.5 Total N (%) 2.51 ± 0.2 2.37 ± 0.2 2.51 ± 0.3 2.55 ± 0.2 2.46 ± 0.3 TOC (%) 43.31 ± 1.4 41.37 ± 1.7 42.53 ± 1.6 42.92 ± 0.0 42.15 ± 0.4 Total P (mg kg−1) 4896.8 ± 56.2 4355.3 ± 158.1 4421.7 ± 236.9 4607.0 ± 332.2 5341.7 ± 299.4 C/N ratio 17:1 18:1 17:1 17:1 17:1 The values given are based on a dry-weight basis. Mean value followed by ± standard error. No significant difference among the treatments at p < 0.05. T1: 15 g BSFL + 15 kg DC and PKE; T2: 20 g BSFL + 15 kg DC and PKE; T3: 25 g BSFL + 15 kg DC and PKE; T4: 30 g BSFL + 15 kg DC and PKE; T5: 35 g BSFL + 15 kg DC and PKE. Table 5.
Selected chemical properties of black soldier fly larvae frass fed on mixed DC and PKE.
-
Extractant Concentration Root length (cm) Shoot length (cm) RSG (%) GI (%) C Distilled water 1.26 ± 0.15 2.01 ± 0.13 100.0 100 T1 IE 3.14 ± 0.36 1.54 ± 0.22 80.0 100 D1 5.91 ± 0.45 2.63 ± 0.25 93.3 100 D2 4.29 ± 0.32 2.20 ± 0.20 90.0 100 D3 4.07 ± 0.30 2.19 ± 0.20 93.3 100 T2 IE 5.13 ± 0.43 2.17 ± 0.24 90.0 100 D1 4.69 ± 0.38 2.48 ± 0.23 93.3 100 D2 5.03 ± 0.46 2.14 ± 0.19 86.7 100 D3 3.05 ± 0.36 1.74 ± 0.21 80.0 100 T3 IE 4.03 ± 0.44 1.77 ± 0.24 86.7 100 D1 4.19 ± 0.49 2.42 ± 0.32 80.0 100 D2 4.19 ± 0.38 2.39 ±0.20 93.3 100 D3 3.40 ± 0.41 1.79 ± 0.23 80.0 100 T4 IE 3.36 ± 0.43 1.73 ± 0.28 83.3 100 D1 4.82 ± 0.47 2.29 ± 0.25 86.7 100 D2 3.20 ± 0.21 1.93 ± 0.17 96.7 100 D3 3.20 ± 0.28 2.10 ± 0.18 93.3 100 T5 IE 3.36± 0.42 1.42 ± 0.20 80.0 100 D1 4.02 ± 0.40 2.19 ± 0.25 86.7 100 D2 3.59 ± 0.37 1.74 ± 0.23 83.3 100 D3 3.47 ± 0.25 2.16 ± 0.18 93.3 100 Mean value followed by ± standard error. C is distilled water served as control. IE is initial extraction. D1, D2, D3 are three times dilutions. RSG is relative seed germination. GI is the germination index. Table 6.
Plant bioassay test of treatments in different concentrations of extractants.
-
Treatment code Initial pH pH buffering
capacityR2 Soil only (S0) 5.93 ± 0.06 0.6074 0.8670* BSFL frass only (F1) 7.94 ± 0.10 2.6212 0.9511* Soil + 9 g BSFL frass (F2) 6.50 ± 0.04 0.3444 0.8951* Soil + 7.2 g BSFL frass (F3) 6.43 ± 0.02 0.3519 0.8740* Soil + 5.4 g BSFL frass (F4) 6.11 ± 0.04 0.3620 0.8552* * represents a significant difference at p ≤ 0.05. Table 7.
Summary of soil pH buffering capacity affected by soil alone, BSFL frass alone and soil with the BSFL frass.
Figures
(3)
Tables
(7)