-
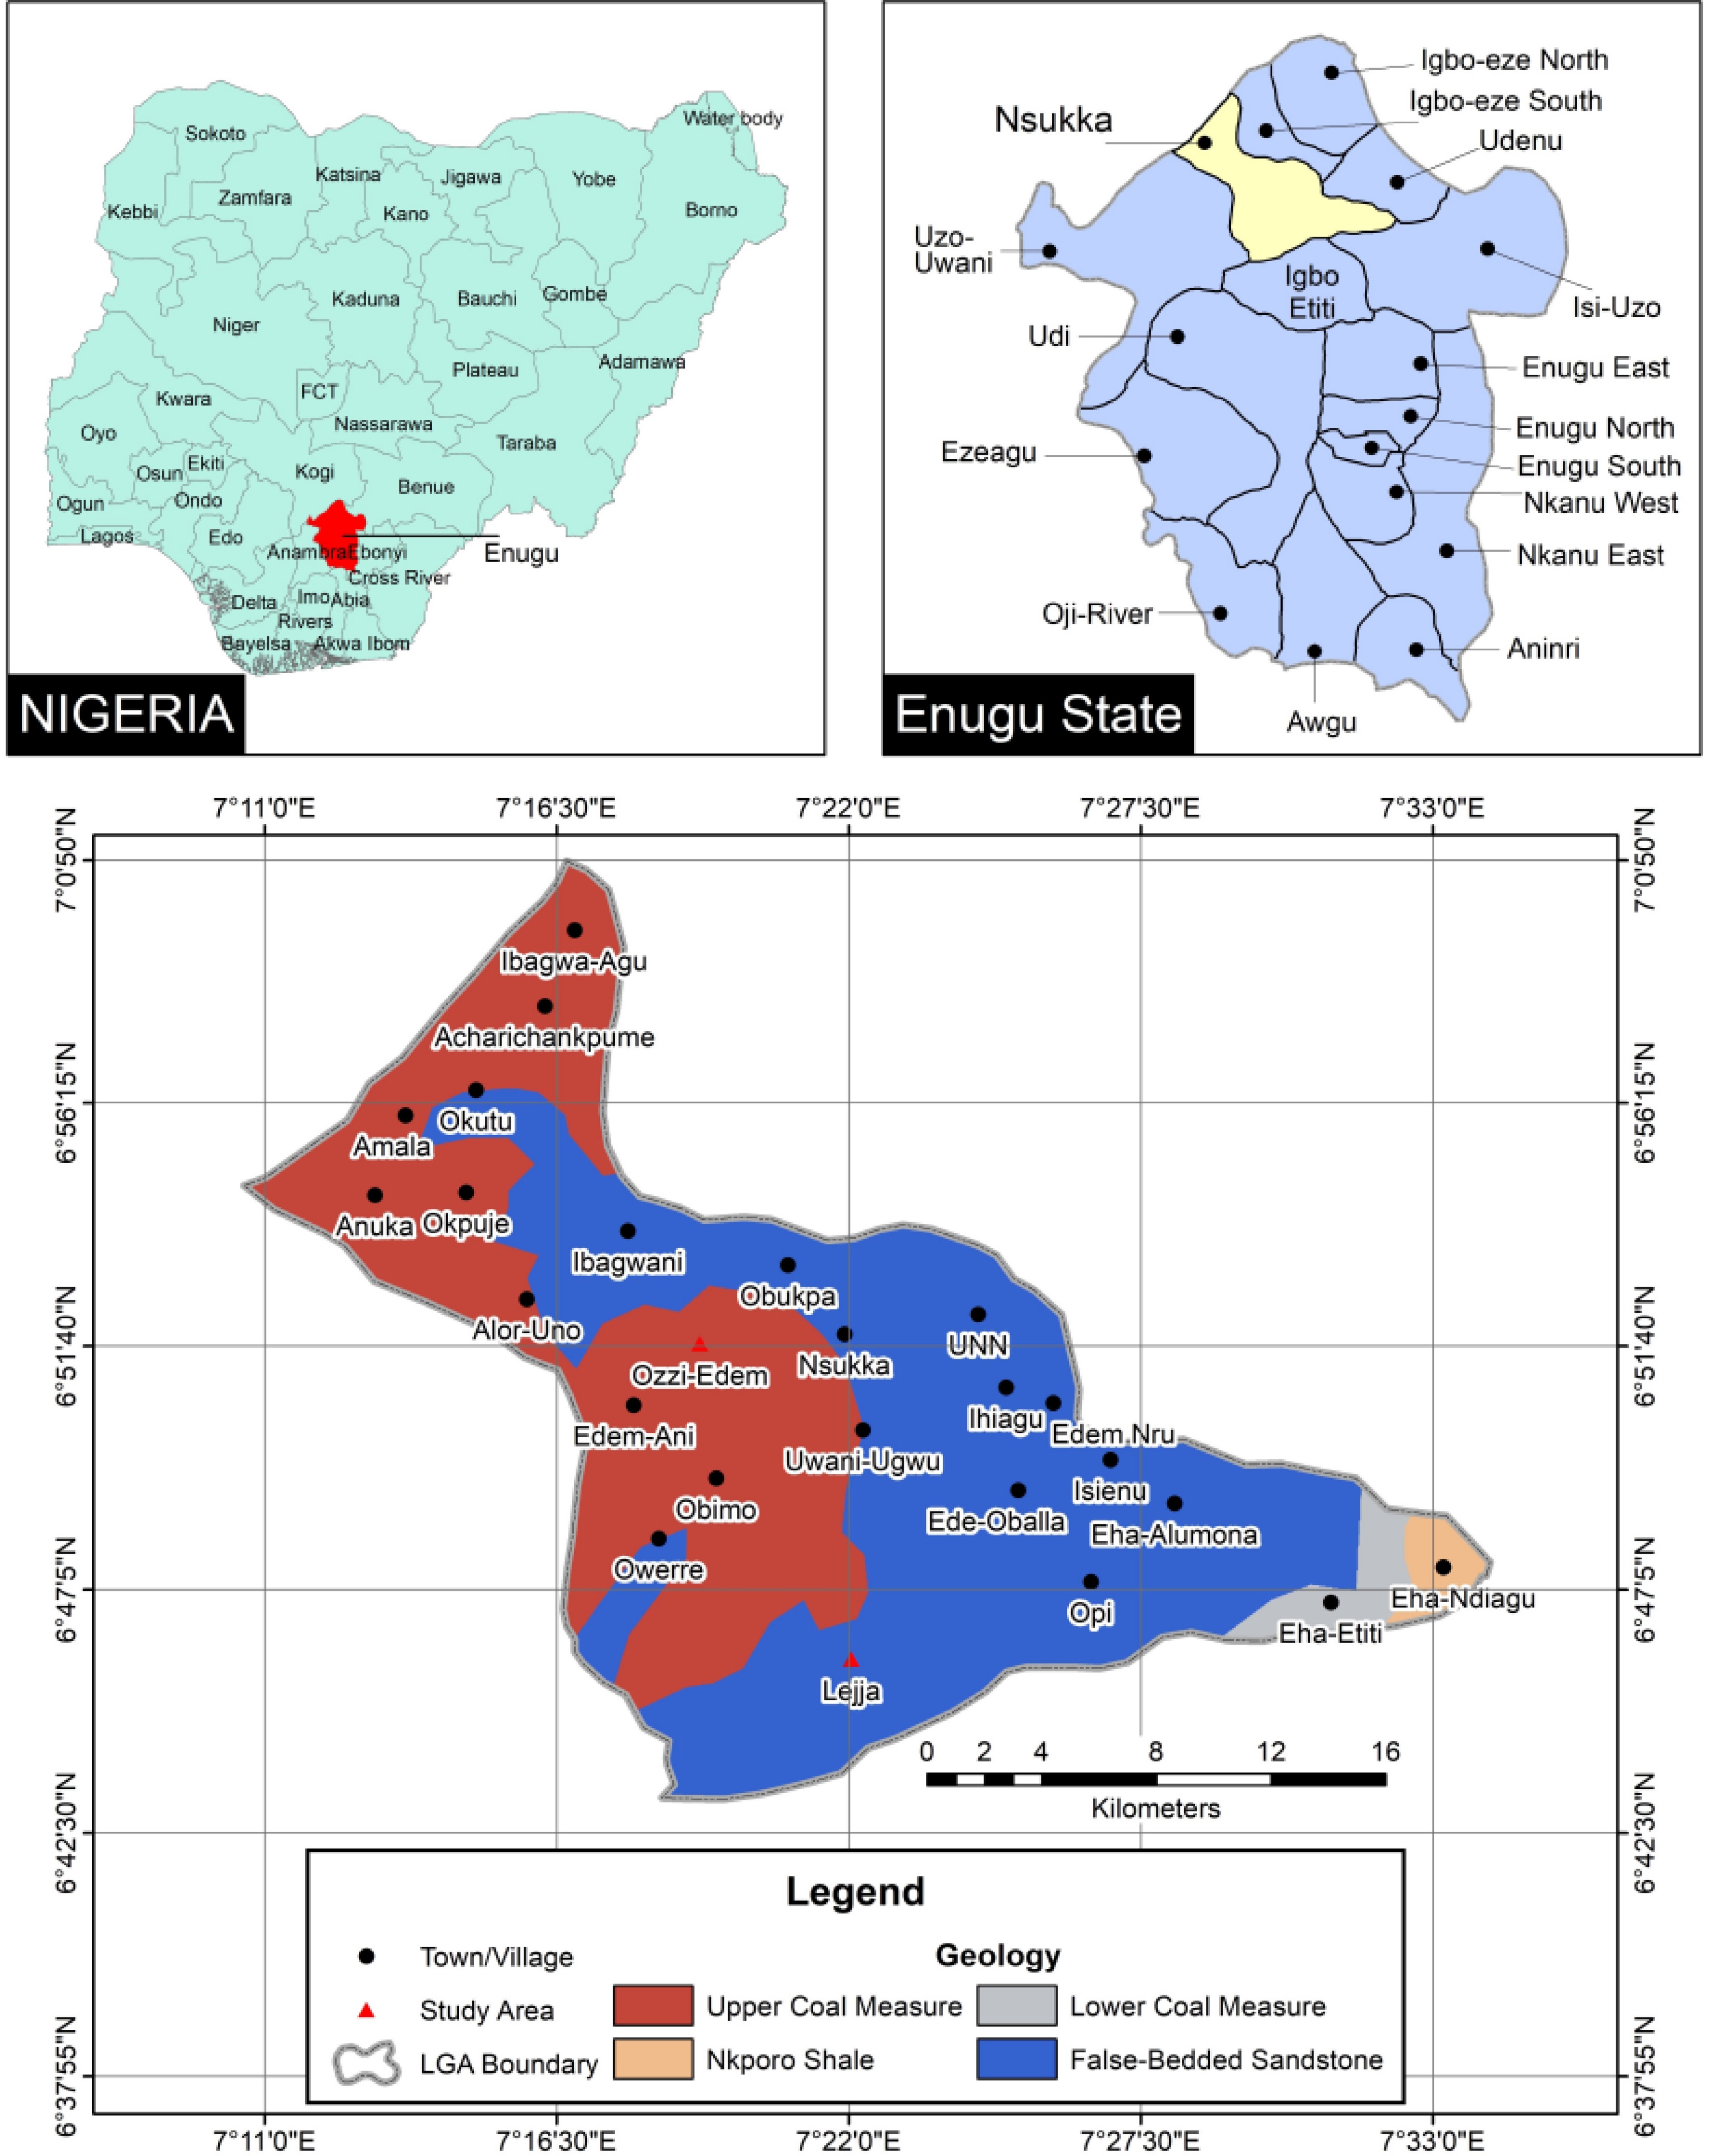
Figure 1.
Map of the study area showing different geological materials and sampling points.
-
Horizon Depth (cm) Colour Texture Structure Consistency Pores Roots Faunal activity Other soil features Boundary Drainage Dry Moist Wet Moist Dry Amelu-Lejja (Pedon I), (6°45'47.984" N, 7°22'3.133" E, elevation = 381 m) Ap1 0−7 2.5 YR 6/4 (dull orange) 2.5 YR 3/6 (dark reddish brown) S Sg nsnp l l cirme cmeco − − DW Well-drained Ap2 7−22 2.5 YR 5/4 (dull reddish brown) 5 YR 4/6 (reddish brown) S 1cogr nsnp l l vfirfi ffi − Presence of charcoal DW Well-drained B1 22−81 5 YR 5/4 (dull reddish brown) 2.5 YR 4/6 (reddish brown) S Sg nsnp l l firvfi cfi − − DW Well-drained B2 81−200 2.5 YR 6/6 (orange) 2.5 YR 4/8 (reddish brown) LS 0 sssp vfr l firme ffi − − − Well-drained Ozzi-Edem (Pedon II), (6°51'41.108" N, 7°19'12.086" E, elevation = 379 m) A 0−14 2.5 YR 5/4 (dull reddish brown) 2.5 YR 3/6 (dark reddish brown) SC 2mcr sp vfr slh circo vffi − − GW Well-drained Bt1 14−37 5 YR 6/8 (orange) 10 R 3/4 (red) SC 1mcr sssp vfr slh circo cfi termites − DW Well-drained Bt2 37−74 5 YR 5/8 (bright reddish brown) 10 R 3/6 (dark red) SiC 2mcr sssp frf h ctaco modffi termites − DI Well-drained Bt3 74−200 2.5 YR 6/6 (orange) 2.5 YR 5/8 (bright brown) SiC 2mcr vsvp vf h mirme fvfi − − − Well-drained Symbols or codes according to FAO (2006), Texture: S = Sand; LS = Loamy sand; SC = sandy clay; SiC = Silty clay. Structure: 0 = structureless; 1 = weak; 2 = moderate; f = fine; m = medium; co = coarse; cr = crumb; gr = granular; Sg = single-grained. Consistency: sssp = slightly sticky and slightly plastic; nsnp = non-sticky and non-plastic; sp = sticky and plastic; vsvp = very sticky and very plastic; l = loose; slh = slightly hard; h = hard; vfr = very friable; frf = friable firm; vf = very firm. Roots/pores: vf = very few; f = few; modf = moderately few; c = common; m = many; ir = irregular; ta = tabular; vfi = very fine; fi = fine; me = medium; co = coarse. Boundary: G = gradual; D =diffuse, I = irregular; W = Wavy. Table 1.
Morphological properties of soils of the study sites.
-
Location/soil depth (cm) Silt
(g kg−1)Clay
(g kg−1)Sand
(g kg−1)TC SCR Amelu-Lejja (Pedon I) 0−7 50.00 130.00 820.00 LS 0.38 7−22 50.00 130.00 820.00 LS 0.38 22−81 50.00 130.00 820.00 LS 0.38 81−200 50.00 150.00 800.00 LS 0.33 Mean 50.00 135.00 815.00 0.37 Ozzi-Edem (Pedon II) 0−14 150.00 130.00 720.00 LS 1.15 14−37 150.00 170.00 680.00 SL 0.88 37−74 110.00 250.00 640.00 SCL 0.44 74−200 110.00 220.00 670.00 SCL 0.50 Mean 130.00 192.50 677.50 0.74 CV (%) 50.40 26.49 9.72 53.08 TC = Textural class, SCR = silt clay ratio. Table 2.
Soil particle size distribution of the various horizons of the study locations.
-
Location/soil depth (cm) BD
(g cm−3)TP
(%)Ksat (cm h−1) AS
(%)MWD Amelu-Lejja (Pedon I) 0−7 1.54 41.89 12.63 58.37 1.75 7−22 1.44 45.66 13.93 69.17 2.06 22−81 1.43 46.04 15.66 78.67 2.18 81−200 1.46 44.91 7.58 26.70 0.57 Mean 1.47 44.63 12.45 58.23 1.64 Ozzi-Edem (Pedon II) 0−14 1.37 48.30 16.16 88.41 2.62 14−37 1.39 47.55 5.55 83.08 2.53 37−74 1.57 40.75 5.05 88.29 2.90 74−200 1.67 36.98 9.09 74.89 3.18 Mean 1.50 43.40 8.96 83.67 2.81 CV% 6.85 8.72 41.67 28.92 36.40 BD = bulk density, TP = total porosity, MWD = mean weight diameter, AS = aggregate stability, Ksat = saturated hydraulic conductivity. Table 3.
Some physical properties of the soils of the study locations.
-
Location/
soil depth (cm)pH
H2OpH
KClOC
(g kg−1)TN
(g kg−1)Av. P
(mg kg−1)Ca2+
(cmolc kg−1)Mg2+
(cmolc kg−1)Na+
(cmolc kg−1)K+
(cmolc kg−1)H+
(cmolc kg−1)Al3+
(cmolc kg−1)CEC
(cmolc kg−1)BS
(%)Amelu-Lejja (Pedon I) 0−7 6.6 4.6 5.30 0.56 8.39 0.40 0.40 0.02 0.05 2.20 0.20 15.20 26.61 7−22 6.5 4.4 5.63 0.56 9.33 0.60 0.40 0.02 0.05 2.80 0.40 17.60 25.06 22−81 6.5 4.0 3.97 0.42 5.60 0.40 0.40 0.01 0.03 2.20 0.20 13.60 25.93 81−200 5.8 4.1 1.66 0.42 3.73 0.60 0.80 0.01 0.03 2.20 0.20 16.80 37.50 Mean 6.35 4.28 4.14 0.49 6.76 0.50 0.50 0.02 0.04 2.35 0.25 15.80 28.77 Ozzi-Edem (Pedon II) 0−14 6.6 5.5 15.90 0.56 30.74 3.60 0.80 0.06 0.11 2.00 0.20 26.40 67.50 14−37 6.3 5.2 10.27 0.70 10.26 1.00 0.60 0.04 0.09 2.00 0.40 27.20 29.17 37−74 5.3 4.0 8.28 0.42 4.66 1.00 2.80 0.03 0.07 2.00 0.20 25.60 63.93 74−200 5.3 4.0 6.29 0.28 5.60 2.00 1.40 0.03 0.07 2.00 0.20 24.80 61.40 Mean 5.88 4.68 10.19 0.49 12.82 1.90 1.40 0.04 0.09 2.45 0.25 26.00 55.50 CV (%) 9.23 13.13 61.15 26.45 89.68 91.72 86.25 60.69 45.05 25.97 37.03 26.87 49.33 OC = organic carbon, TN = total nitrogen, CEC = cation exchange capacity, Ca2+, Mg2+, Na2+, K+, H+ and Al3+ = exchangeable calcium, magnesium, sodium, potassium, hydrogen, and aluminium, BS = base saturation. Table 4.
Chemical properties of the soils of the study locations.
-
Location pH
H2OpH
KClOC
(g kg−1)TN
(g kg−1)Av. P
(mg kg−1)Ca2+
(cmolc kg−1)Mg2+
(cmolc kg−1)Na+
(cmolc kg−1)K+
(cmolc kg−1)H+
(cmolc kg−1)Al3+
(cmolc kg−1)CEC
(cmolc kg−1)BS
(%)Amelu-Lejja 6.22 4.32 4.47 0.51 4.51 0.97 0.60 0.01 0.03 2.53 0.43 18.67 33.80 Ozzi-Edem 6.47 5.20 14.19 0.72 13.37 2.27 1.17 0.05 0.11 2.20 0.30 27.53 58.67 F-LSD0.05 NS 0.73 3.25 NS 6.20 0.94 0.28 0.01 0.02 NS NS 6.37 12.08 OC = organic carbon, TN = total nitrogen, CEC = cation exchange capacity, Ca2+, Mg2+, Na2+, K+, H+ and Al3+ = exchangeable calcium, magnesium, sodium, potassium, hydrogen, and aluminium, BS = base saturation, NS = not significant. Table 5.
Main effect of location on soil chemical properties of the two geological formations.
-
Soil depth
(cm)pH
H2OpH
KClOC
(g kg−1)TN
(g kg−1)Av. P
(mg kg−1)Ca2+
(cmolc kg−1)Mg2+
(cmolc kg−1)Na+
(cmolc kg−1)K+
(cmolc kg−1)H+
(cmolc kg−1)Al3+
(cmolc kg−1)CEC
(cmolc kg−1)BS
(%)0−30 6.48 4.98 10.60 0.63 11.35 1.83 0.97 0.04 0.08 2.27 0.37 24.93 51.01 30−60 6.20 4.53 8.06 0.61 6.53 1.40 0.80 0.03 0.06 2.47 0.37 21.27 42.68 F-LSD0.05 NS NS NS NS NS NS NS NS NS NS NS NS NS OC = organic carbon, TN = total nitrogen, CEC = cation exchange capacity, Ca2+, Mg2+, Na2+, K+, H+ and Al3+ = exchangeable calcium, magnesium, sodium, potassium, hydrogen, and aluminium, BS = base saturation, NS = not significant. Table 6.
Main effect of soil depth on soil chemical properties of the geological formations.
Figures
(1)
Tables
(6)