


-
Soil as an indispensable and finite natural resource for agriculture plays a relevant role in enhancing crop production[1,2]. This role is not only limited to the supply of nutrients but also involves effective nutrient management. Decline in soil fertility and productivity has been related to continuous cropping due to increasing demand for food[3,4]. Most often, the extent to which a soil is productive depends on its properties[5], however, poor knowledge of the soils, inadequate information about soil properties and the influence of geological materials on those properties are lacking. Appropriate knowledge and holistic understanding of the soil properties is required for proper management of soils. A detailed soil survey and characterization provides information on soil properties and distribution, which are crucial for appropriate land-use planning and implementation of suitable nutrient management practices that aid in restoring soil fertility status and degraded lands[6−8].
Soil is known to deliver requisite ecological system services, comprising and not limited to serving as a medium for plant growth and performing agronomic roles such as nutrient cycling, regulating vital gas fluxes between the subsurface and atmosphere, mechanical support to terrestrial plants, supplying necessary resources such as water, nutrients, and oxygen[9]. The capacity of any soil to perform these roles is inarguably determined by the type of geological material the soil developed from. The soil's bearing capacity to tolerate load, subsist, store and supply nutrients, produce a given crop population, and its susceptibility to degradation and degree of weathering is attributed to geological materials[10,11]. Geological materials are regarded as indispensable factors in soil formation that determine soil type[12,13] and contribute to soil variation as their weathering brings about soil mass and nutrient elements release to the soil for crop use.
The derived savannah agro-ecological zone of Nigeria, originally characterized by forest vegetation has been altered to savanna vegetation due to human impacts[14]. Nonetheless, the soils in this zone have received enormous acceptance for agricultural purposes and other related uses[14,15]. In Enugu State, most rural farmers with limited knowledge of soil pedogenetic processes often categorize soils in the same geographical site to possess similar soil properties. It is against this assumption that Onweremadu[16] remarked that soils even when formed on similar geological materials are characterized by different physical and chemical properties. Previous studies by Irmak et al.[17] affirmed that different geological materials give rise to differentiation in the morpho-physicochemical properties of the soils, even under the same agroecological conditions. In addition, understanding how soil properties are being distributed along profile depths overlying different geological materials could aid the vulnerability of such soils to the impact of erosion or flooding.
The soils in Enugu State exhibit different geological materials[18,19]. However, soils in Nsukka Local Government area, Enugu State were derived from upper coal measure, lower coal measure, Nkporo shale, and false bedded sandstones[20]. Since the area is dominated by arable crop production, plantation, grazing land and forestry[21], the knowledge of variation in soil properties within and across soil overlain by different geological materials in Nsukka is a fundamental decision-making tool for land suitability evaluation and for fertility management of the soils. This study would provide a logical plan that enables farmers to appreciate the dynamics in soil behavior and facilitate the judicious use of the soils for sustainable productivity. According to Lal[22], it is coherent to discover site-specific systems to meet the site-specific needs with regard to nutrient management. The study aims to identify soil potentials and limitations for sustainable agricultural production by assessing the morphology and fertility of soils derived from two geological materials (false bedded sandstone and upper coal measure) in Nsukka, Enugu State, Southeastern Nigeria.
-
This study was carried out in Amelu-Lejja and Ozzi-Edem autonomous communities in Lejja and Edem towns, respectively, of Nsukka Local Government Area in Enugu State. The study area is located within latitude 6°45' N, longitude 7°22' E and altitude 381 m for Amelu-Lejja, and latitude 6°51' N, longitude 7°19' E and altitude 379 m for Ozzi-Edem-Edem (Fig. 1). The study area has a tropical climate characterized by distinct rainy and dry seasons. The rainy season spans from April to October, with maximum rainfall during June, July, and September. There is a minor dry season in August often referred to as the August break, and the major dry season that spans from mid-November to March[23]. As such, the area receives an average rainfall of 1,500 mm per annum and an average minimum and maximum temperature of 21.66 and 31.03 °C, respectively. The vegetation of the study area could be described as derived savannah. The area is dominated by secondary forest since most of the primary vegetation was cleared as a result of farming activities. Common crops grown in this area include; cassava (Manihot esculenta), yam (Dioscorea spp.), cocoyam (Colocasia esculentus), oil palm (Elaeis guineensis), pepper (Capsicum spp.), cowpea (Vigna unguiculata), maize (Zea mays), and groundnut (Arachis hypogaea L.). The soils of the area are formed from diverse sedimentary geologic deposits[20], and have been classified as Ultisol. These are primarily coarse-textured or moderately coarse-textured soils, containing low-activity clays[24].
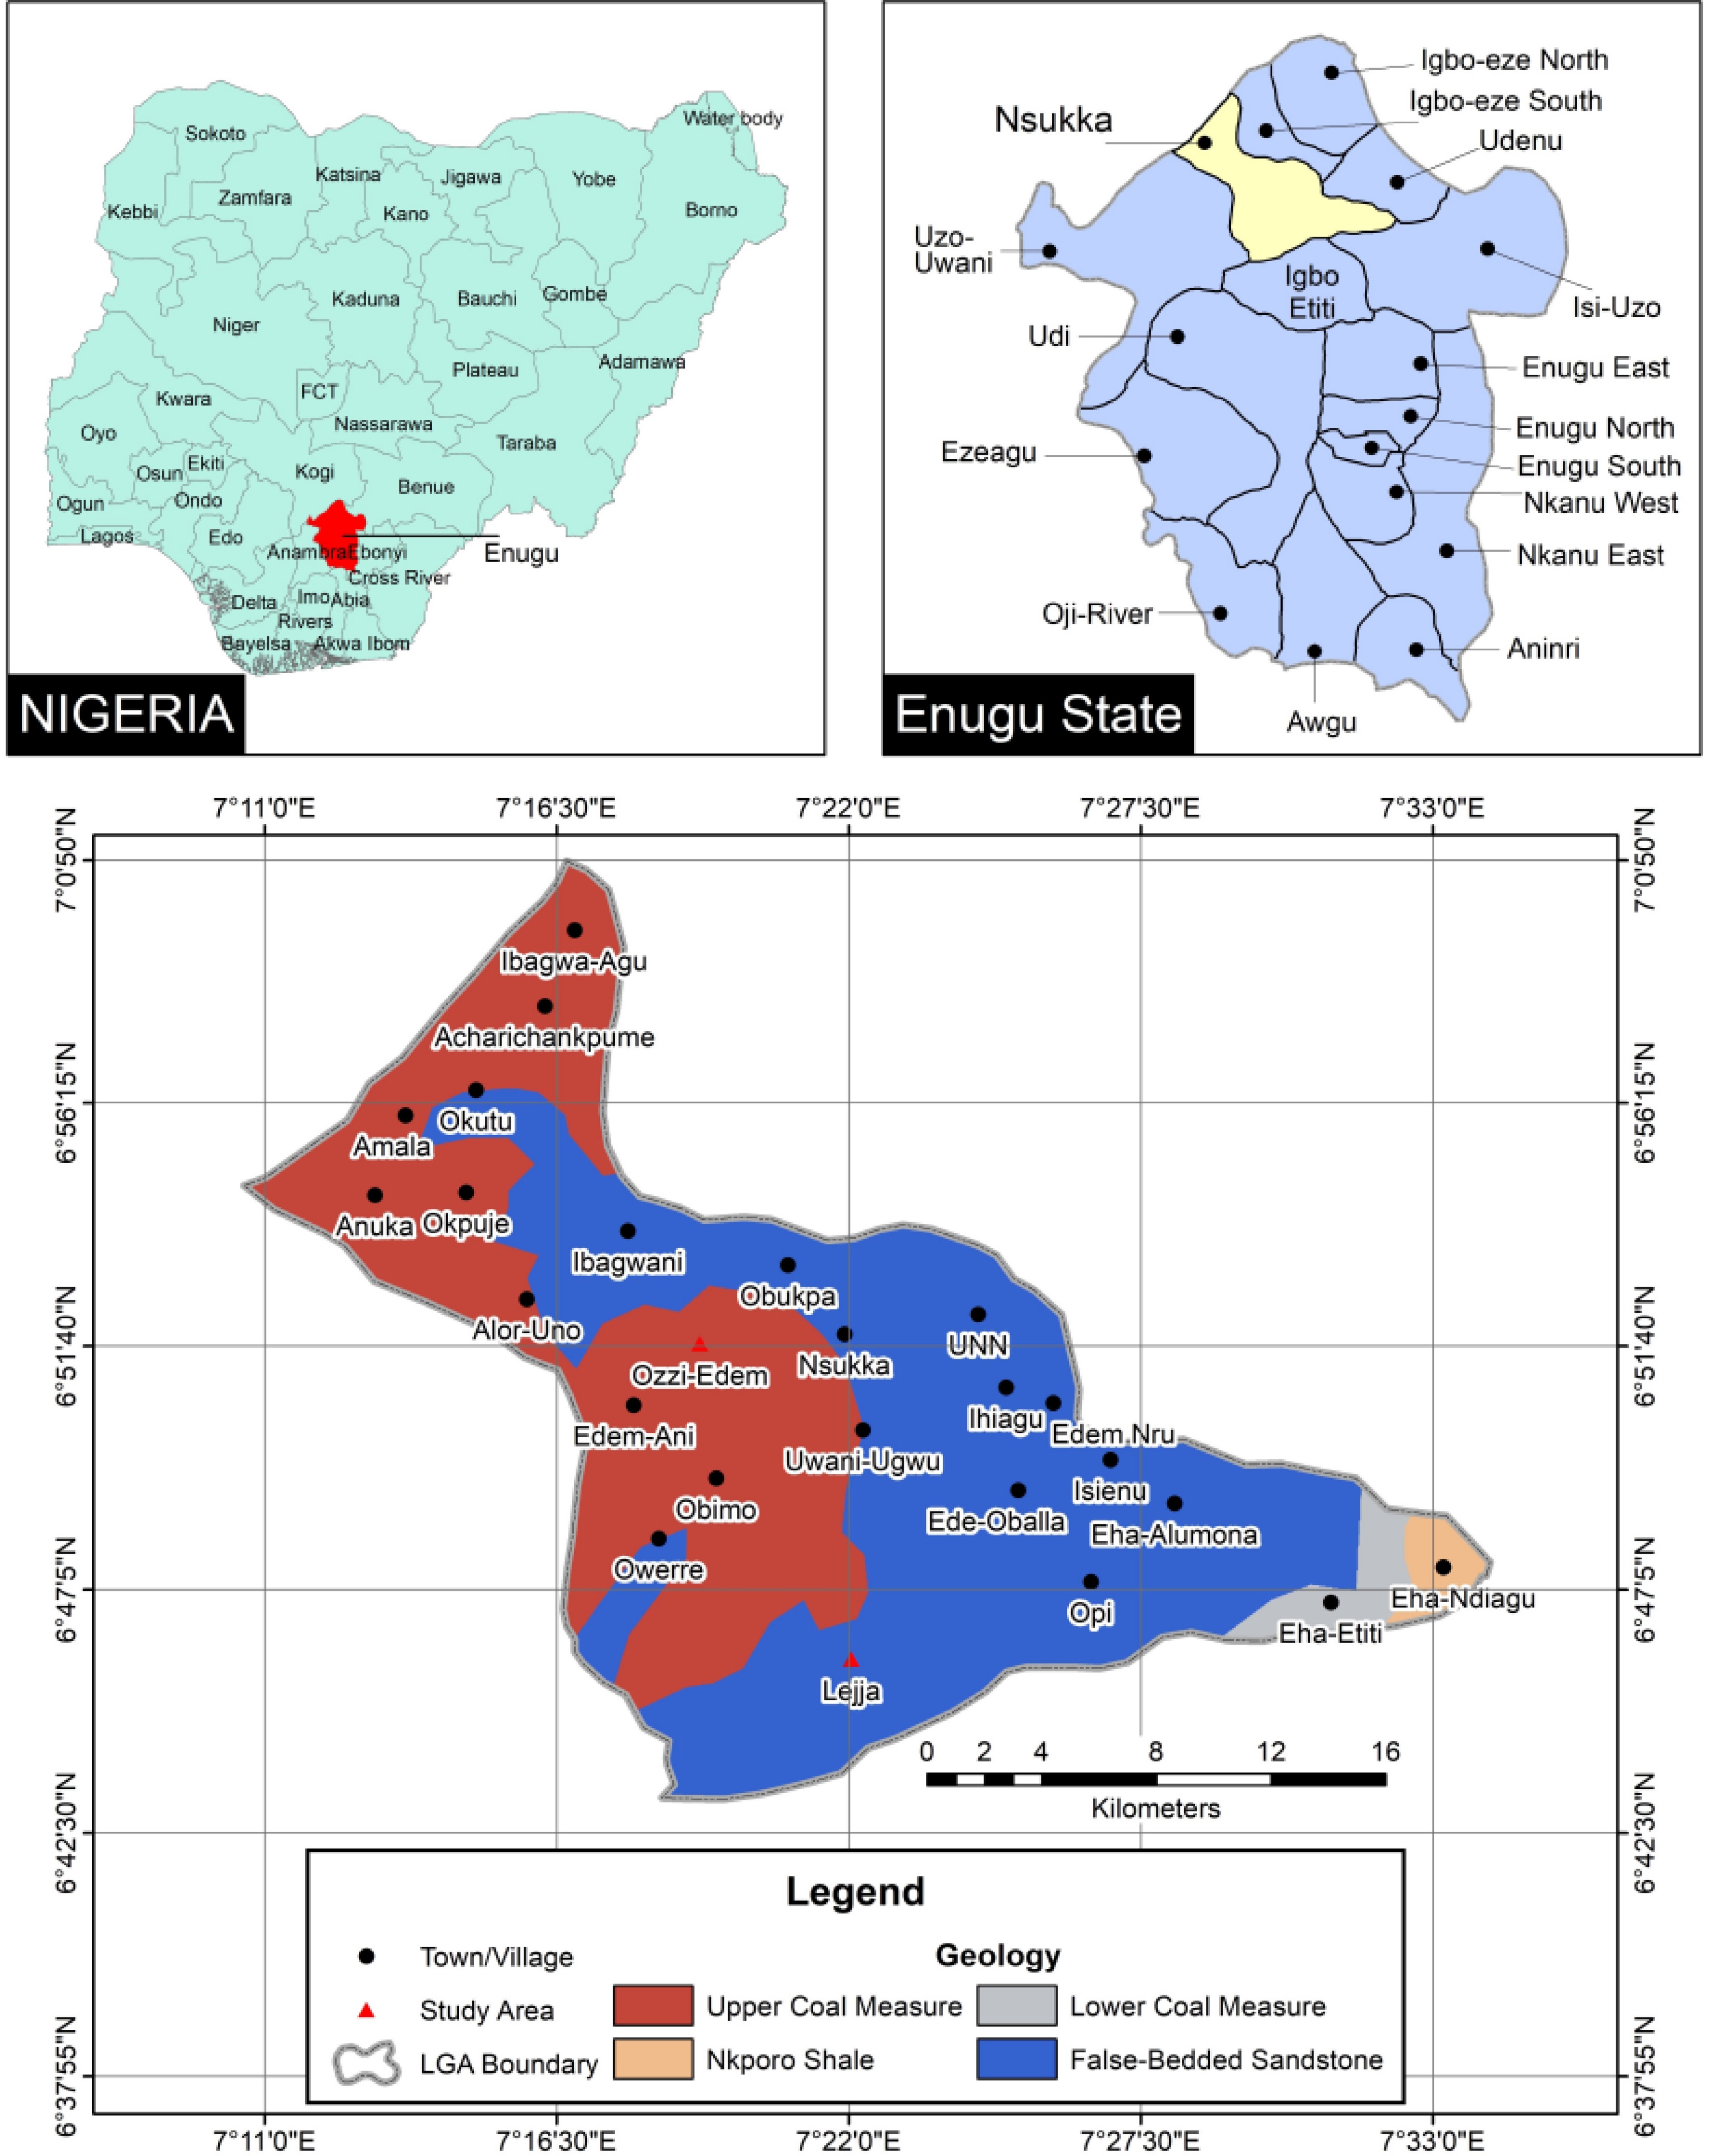
Figure 1.
Map of the study area showing different geological materials and sampling points.
Field studies
-
Using a free survey method guided by the geological map of Nsukka, which served as the base map for site selection, two geological materials whose overlying soils are commonly used for agricultural activities were identified. The geological materials, namely the false bedded sandstone (Pedon I) and upper coal measure (Pedon II), located in Amelu-Lejja and Ozzi-Edem, respectively, were selected (Fig. 1). The selected sites, which served as representative pedons for the above mentioned geological materials, were agricultural land which had not been fallowed for three years. Farmers at these sites practiced slash-and-burn agriculture and decomposing crop residues were observed on the soil surface at both sites surrounded by dense vegetation. A profile pit was dug in each of the geological material, and the pedons were delineated, studied, and sampled according to the procedures set out in the United States Department of Agriculture (USDA) and FAO/UNESCO guidelines for soil profile description[25]. Two sets (composite and undisturbed) of soil samples were collected from each of the identified genetic horizons of the pedons. The composite soil samples were collected starting from the bottom to the top horizon to avoid contamination, while the undisturbed soil samples were collected from the top horizon using cylindrical metal canisters for the determination of saturated hydraulic conductivity (Ksat), and bulk density (BD). Additional soil samples were taken at three random points 200 m from each profile pit at 0−30 and 30−60 cm depth using an auger. All soil sampling was done in triplicate and a total of 20 loose soil samples (four composite soil samples from each profile, and six auger soil samples from three random points at two soil depths per location) were collected from the two study areas. The chemical properties of these soil samples were determined and served to obtain certainty about the variability of the properties of the soil horizons. The distance of 200 m was to achieve apt variation in soil properties. All the collected samples were placed in labeled polythene bags and taken to the drying shade for air-drying and afterward to the laboratory for analysis.
Laboratory analysis
-
The air-dried composite soil samples were crushed gently, and passed through a 2 mm mesh sieve, to separate the gravel from fine earth fraction. The < 2 mm was used for the soil characterization. Particle size distribution was determined using the mechanical analysis of Bouyoucos hydrometer method modified by Gee and Or[26], after dispersing soil with sodium hexametaphosphate. From this result, the soil textural classes were determined. Soil bulk density was determined using the core method following the procedure described by Grossman & Reinch[27]. The saturated hydraulic conductivity of the soils was determined by the falling head method as described by McWhorter & Sunda[28].
Soil porosity was computed from the relationship between bulk density and particle density as described by Danielson & Sutherland[29]. The pH and electrical conductivity of the soils were determined electrometrically in a 1:2.5 soil-water ratio using a pH meter and an electrical conductivity meter, respectively. Soil organic carbon (SOC) was determined by the modified Walkey and Black wet digestion method[30]. Total nitrogen was determined by the modified micro-Kjeldahl technique[31], while available phosphorus was determined by the Bray-II method as outlined by Olsen & Sommers[32]. Cation exchange capacity (CEC) was determined using 1N neutral ammonium acetate (NH4OAC) leachate method[33]. Exchangeable basic cations were extracted by leaching the soil samples using 1 ml neutral ammonium acetate (NH4OAC). Exchangeable calcium and magnesium were determined by the ethylene diamine-tetraacetic acid (EDTA) complexometric titration method, whereas exchangeable sodium and potassium were determined by flame photometry technique[31]. Exchangeable acidity was determined by the titration technique outlined by Hendershot et al.[34]. Effective cation exchange capacity (ECEC) was computed as the summation of the exchangeable bases and the exchangeable acidity, whereas percentage base saturation (BS) was calculated as the percentage ratio of exchangeable bases to ECEC.
Statistical analysis
-
The degree of variability of the soil properties of the horizons within the studied pedons was determined using coefficient of variation (CV). The CV, defined as the ratio of the standard deviation to the mean was ranked by the procedure of Wilding et al.[35]; where CV of < 15% = low variation, 15 to ≤ 35% = moderate variation, and > 35% = high variation. Data from the auger soil samples were subjected to a two-way ANOVA using GenStat (11th edition) for PC/Windows. The test for significance and mean separation was performed using the least significant difference (LSD) at a 5% probability to determine the effect of location, soil depth, and their interaction on soil chemical properties of the two geological formations.
-
The morphological properties of the soils show that the pedons are well drained with distinctively A and B horizons (Table 1). The soils are generally deep (> 150 cm) and have no impenetrable layer. Both pedons exhibited shallow Ap horizons and thicker B horizons. The soils had color (dry and moist) variations of 2.5 YR, 5 YR, and 10 R (hue). In Pedon I, underlined by false bedded sandstones, the soil color (dry and moist) was dull orange (dry) (2.5 YR 6/4) and dark reddish brown (moist) (2.5 YR 3/6) in the Ap horizon and the dominance of various shades of dull reddish brown in the subsurface soils. In Pedon II, underlined by the upper coal measure, the colour was dull reddish brown (dry) (2.5 YR 5/4) and dark reddish brown (moist) (2.5 YR 3/6) in the A horizon over orange (dry) (5 YR 6/8), red (moist) (10 R 3/4), bright reddish brown (dry) (5 YR 5/8), dark red (moist) (10 R 3/6), orange (dry) (2.5 YR 6/6), bright brown (2.5 YR 5/8) horizons.
Table 1. Morphological properties of soils of the study sites.
Horizon Depth (cm) Colour Texture Structure Consistency Pores Roots Faunal activity Other soil features Boundary Drainage Dry Moist Wet Moist Dry Amelu-Lejja (Pedon I), (6°45'47.984" N, 7°22'3.133" E, elevation = 381 m) Ap1 0−7 2.5 YR 6/4 (dull orange) 2.5 YR 3/6 (dark reddish brown) S Sg nsnp l l cirme cmeco − − DW Well-drained Ap2 7−22 2.5 YR 5/4 (dull reddish brown) 5 YR 4/6 (reddish brown) S 1cogr nsnp l l vfirfi ffi − Presence of charcoal DW Well-drained B1 22−81 5 YR 5/4 (dull reddish brown) 2.5 YR 4/6 (reddish brown) S Sg nsnp l l firvfi cfi − − DW Well-drained B2 81−200 2.5 YR 6/6 (orange) 2.5 YR 4/8 (reddish brown) LS 0 sssp vfr l firme ffi − − − Well-drained Ozzi-Edem (Pedon II), (6°51'41.108" N, 7°19'12.086" E, elevation = 379 m) A 0−14 2.5 YR 5/4 (dull reddish brown) 2.5 YR 3/6 (dark reddish brown) SC 2mcr sp vfr slh circo vffi − − GW Well-drained Bt1 14−37 5 YR 6/8 (orange) 10 R 3/4 (red) SC 1mcr sssp vfr slh circo cfi termites − DW Well-drained Bt2 37−74 5 YR 5/8 (bright reddish brown) 10 R 3/6 (dark red) SiC 2mcr sssp frf h ctaco modffi termites − DI Well-drained Bt3 74−200 2.5 YR 6/6 (orange) 2.5 YR 5/8 (bright brown) SiC 2mcr vsvp vf h mirme fvfi − − − Well-drained Symbols or codes according to FAO (2006), Texture: S = Sand; LS = Loamy sand; SC = sandy clay; SiC = Silty clay. Structure: 0 = structureless; 1 = weak; 2 = moderate; f = fine; m = medium; co = coarse; cr = crumb; gr = granular; Sg = single-grained. Consistency: sssp = slightly sticky and slightly plastic; nsnp = non-sticky and non-plastic; sp = sticky and plastic; vsvp = very sticky and very plastic; l = loose; slh = slightly hard; h = hard; vfr = very friable; frf = friable firm; vf = very firm. Roots/pores: vf = very few; f = few; modf = moderately few; c = common; m = many; ir = irregular; ta = tabular; vfi = very fine; fi = fine; me = medium; co = coarse. Boundary: G = gradual; D =diffuse, I = irregular; W = Wavy. Soil texture ranged from sand to loamy sand and sandy clay to silty clay in Pedon I and Pedon II, respectively. The soil structures were predominated by single-grained and crumbly structures, as observed in Pedons I and II. The consistency of the soils was predominantly non-sticky and non-plastic (wet) and loose (moist, dry) in Pedon I, whereas in Pedon II, it was slightly plastic (wet), very friable (moist) and slightly hard (dry) in the A horizon, over slightly sticky and slightly plastic (wet), very friable to friable firm (moist) and slightly hard to hard (dry) sub-horizons. Charcoal was observed in the Ap2 horizon of Pedon I, while termites were observed in the subsurface horizons (Bt1 and Bt2) of Pedon II.
Physical properties of the studied soils
-
The particle size distribution of the soils in the various soil horizons shows that total sand accounts for 80%−82% and 64%−72% of the mineral fractions in Pedons I and II, respectively, indicating a dominance of the sand fraction (Table 2). The silt content in Pedon I was the lowest at all soil depths (5%), compared to the average clay content of 14%. In contrast, the clay content of Pedon II increased with increasing depth and ranged from 13% to 25%, while the silt content was about 13% across the soil horizons. The silt and clay ratio (SCR) of the surface soil was 0.38 and 1.15, while the mean SCR of the subsoils for Pedon I and II were 0.37 and 0.61, respectively. The average SCR of 0.74 in Pedon II was twice that in Pedon I and had a high CV of 53.08%.
Table 2. Soil particle size distribution of the various horizons of the study locations.
Location/soil depth (cm) Silt
(g kg−1)Clay
(g kg−1)Sand
(g kg−1)TC SCR Amelu-Lejja (Pedon I) 0−7 50.00 130.00 820.00 LS 0.38 7−22 50.00 130.00 820.00 LS 0.38 22−81 50.00 130.00 820.00 LS 0.38 81−200 50.00 150.00 800.00 LS 0.33 Mean 50.00 135.00 815.00 0.37 Ozzi-Edem (Pedon II) 0−14 150.00 130.00 720.00 LS 1.15 14−37 150.00 170.00 680.00 SL 0.88 37−74 110.00 250.00 640.00 SCL 0.44 74−200 110.00 220.00 670.00 SCL 0.50 Mean 130.00 192.50 677.50 0.74 CV (%) 50.40 26.49 9.72 53.08 TC = Textural class, SCR = silt clay ratio. The bulk density (BD) of the soils ranged from 1.43 to 1.54 g cm−3 for Pedon I and from 1.37 to 1.67 g cm−3 for Pedon II, with an overall CV of 6.85% (Table 3). The total porosity (TP) of Pedon I and II averaged 44.63 and 43.40%, respectively, with a CV of 8.72%.
Table 3. Some physical properties of the soils of the study locations.
Location/soil depth (cm) BD
(g cm−3)TP
(%)Ksat (cm h−1) AS
(%)MWD Amelu-Lejja (Pedon I) 0−7 1.54 41.89 12.63 58.37 1.75 7−22 1.44 45.66 13.93 69.17 2.06 22−81 1.43 46.04 15.66 78.67 2.18 81−200 1.46 44.91 7.58 26.70 0.57 Mean 1.47 44.63 12.45 58.23 1.64 Ozzi-Edem (Pedon II) 0−14 1.37 48.30 16.16 88.41 2.62 14−37 1.39 47.55 5.55 83.08 2.53 37−74 1.57 40.75 5.05 88.29 2.90 74−200 1.67 36.98 9.09 74.89 3.18 Mean 1.50 43.40 8.96 83.67 2.81 CV% 6.85 8.72 41.67 28.92 36.40 BD = bulk density, TP = total porosity, MWD = mean weight diameter, AS = aggregate stability, Ksat = saturated hydraulic conductivity. There are clear differences in the Ksat of the soils (CV = 41.67%). In general, Pedon I had a higher average Ksat than Pedon II. While higher Ksat marked the Ap1, Ap2, and B1 horizons in Pedon I, Ksat was higher in the A horizon than in the sub-horizons in Pedon II. The percentage aggregate stability (AS) ranged from 26.70 to 69.17% in Pedon I, but from 74.89 to 88.41% in Pedon II (Table 3). These AS values were unevenly distributed across the soil depths. The mean weight diameter (MWD) exhibited a range of values from 0.57 to 2.18 mm in Pedon I and from 2.53 to 3.18 mm in Pedon II. These values also showed an irregular pattern of variation with soil depth.
Chemical properties of the studied soils
-
The chemical properties of the studied soils (Table 4) showed generally higher pH values in H2O than in KCl. Also, the pH (H2O) values, which ranged from 5.8 to 6.6 and from 5.3 to 6.6 in Pedon I and II, respectively, with CV 9.23%, showed a decrease in pH with increasing soil depth. The OC content in Pedon I ranged from 3.97 to 5.63 g kg−1 with a mean of 4.14 g kg−1, while in Pedon II ranged from 6.29 to 15.90 g kg−1 with a mean of 10.19 g kg−1, and an overall CV of 61.15%. In both locations, the OC content was higher in the topmost two horizons than the sub-horizons, although a decrease in OC with increasing depth was observed in Pedon II. The soil pedons had TN values ranging from 0.28 to 0.70 g kg−1, with a similar mean value of 0.49 g kg−1. Accordingly, the two topmost horizons had relatively higher TN values of ≥ 0.56 g kg−1 than the lowest horizons. The available phosphorus (Av.P) concentrations in Pedon I were low and ranged from 3.73 to 8.39, showing a decreasing trend with depth (Table 4). In contrast, Av.P values in Pedon II varied irregularly with depth, indicating a moderate Av.P concentration in the topmost A horizon (30.74 mg kg−1) and a low Av.P concentration in the sub-horizons.
Table 4. Chemical properties of the soils of the study locations.
Location/
soil depth (cm)pH
H2OpH
KClOC
(g kg−1)TN
(g kg−1)Av. P
(mg kg−1)Ca2+
(cmolc kg−1)Mg2+
(cmolc kg−1)Na+
(cmolc kg−1)K+
(cmolc kg−1)H+
(cmolc kg−1)Al3+
(cmolc kg−1)CEC
(cmolc kg−1)BS
(%)Amelu-Lejja (Pedon I) 0−7 6.6 4.6 5.30 0.56 8.39 0.40 0.40 0.02 0.05 2.20 0.20 15.20 26.61 7−22 6.5 4.4 5.63 0.56 9.33 0.60 0.40 0.02 0.05 2.80 0.40 17.60 25.06 22−81 6.5 4.0 3.97 0.42 5.60 0.40 0.40 0.01 0.03 2.20 0.20 13.60 25.93 81−200 5.8 4.1 1.66 0.42 3.73 0.60 0.80 0.01 0.03 2.20 0.20 16.80 37.50 Mean 6.35 4.28 4.14 0.49 6.76 0.50 0.50 0.02 0.04 2.35 0.25 15.80 28.77 Ozzi-Edem (Pedon II) 0−14 6.6 5.5 15.90 0.56 30.74 3.60 0.80 0.06 0.11 2.00 0.20 26.40 67.50 14−37 6.3 5.2 10.27 0.70 10.26 1.00 0.60 0.04 0.09 2.00 0.40 27.20 29.17 37−74 5.3 4.0 8.28 0.42 4.66 1.00 2.80 0.03 0.07 2.00 0.20 25.60 63.93 74−200 5.3 4.0 6.29 0.28 5.60 2.00 1.40 0.03 0.07 2.00 0.20 24.80 61.40 Mean 5.88 4.68 10.19 0.49 12.82 1.90 1.40 0.04 0.09 2.45 0.25 26.00 55.50 CV (%) 9.23 13.13 61.15 26.45 89.68 91.72 86.25 60.69 45.05 25.97 37.03 26.87 49.33 OC = organic carbon, TN = total nitrogen, CEC = cation exchange capacity, Ca2+, Mg2+, Na2+, K+, H+ and Al3+ = exchangeable calcium, magnesium, sodium, potassium, hydrogen, and aluminium, BS = base saturation. The concentrations of all the exchangeable base cations were generally low in both soils studied. The cation exchange capacity (CEC) of the soil horizons varied between 13.6 and 17.6 cmolc kg−1 in Pedon I and between 24.80 and 27.20 cmolc kg−1 in Pedon II. The percent base saturation (BS) varied across the soil horizons in Pedon I, but tended to decrease with increasing depth in Pedon II. Accordingly, Pedon I and II had average BS values of 28.77% and 55.50%, respectively.
Effect of location and soil depth on soil chemical properties
-
Statistical analysis of the randomly collected soil samples from the studied locations at two depths (0-30 and 30-60 cm) revealed a significant influence of locations on soil chemical properties (Table 5), but no significant influence of soil depth (Table 6) and location * soil depth interaction (data not shown). In general, pHKCl, SOC, Av.P, Ca2+, Mg2+, Na+, K+, CEC, and BS were significantly higher in Pedon II than in Pedon I.
Table 5. Main effect of location on soil chemical properties of the two geological formations.
Location pH
H2OpH
KClOC
(g kg−1)TN
(g kg−1)Av. P
(mg kg−1)Ca2+
(cmolc kg−1)Mg2+
(cmolc kg−1)Na+
(cmolc kg−1)K+
(cmolc kg−1)H+
(cmolc kg−1)Al3+
(cmolc kg−1)CEC
(cmolc kg−1)BS
(%)Amelu-Lejja 6.22 4.32 4.47 0.51 4.51 0.97 0.60 0.01 0.03 2.53 0.43 18.67 33.80 Ozzi-Edem 6.47 5.20 14.19 0.72 13.37 2.27 1.17 0.05 0.11 2.20 0.30 27.53 58.67 F-LSD0.05 NS 0.73 3.25 NS 6.20 0.94 0.28 0.01 0.02 NS NS 6.37 12.08 OC = organic carbon, TN = total nitrogen, CEC = cation exchange capacity, Ca2+, Mg2+, Na2+, K+, H+ and Al3+ = exchangeable calcium, magnesium, sodium, potassium, hydrogen, and aluminium, BS = base saturation, NS = not significant. Table 6. Main effect of soil depth on soil chemical properties of the geological formations.
Soil depth
(cm)pH
H2OpH
KClOC
(g kg−1)TN
(g kg−1)Av. P
(mg kg−1)Ca2+
(cmolc kg−1)Mg2+
(cmolc kg−1)Na+
(cmolc kg−1)K+
(cmolc kg−1)H+
(cmolc kg−1)Al3+
(cmolc kg−1)CEC
(cmolc kg−1)BS
(%)0−30 6.48 4.98 10.60 0.63 11.35 1.83 0.97 0.04 0.08 2.27 0.37 24.93 51.01 30−60 6.20 4.53 8.06 0.61 6.53 1.40 0.80 0.03 0.06 2.47 0.37 21.27 42.68 F-LSD0.05 NS NS NS NS NS NS NS NS NS NS NS NS NS OC = organic carbon, TN = total nitrogen, CEC = cation exchange capacity, Ca2+, Mg2+, Na2+, K+, H+ and Al3+ = exchangeable calcium, magnesium, sodium, potassium, hydrogen, and aluminium, BS = base saturation, NS = not significant. -
The shallow Ap horizons of the pedons indicate the influence of surface erosion, while thicker B horizons suggest a high degree of eluviation-illuviation processes. The color differences within and among pedons could be related to drainage conditions, as influenced by the observed SCR and Ksat of the soil (Tables 1 & 2). In addition, Alem et al.[36] reported that parent materials and environmental factors (high and low rainfall, temperature, and humidity) could be responsible for soil color variations of horizons. However, the dark red and red color tinge in the subsurface horizons of Pedon II indicates the well-drained nature of the soil with oxidized and hydrated iron (ferric) compounds, while the dark reddish brown, reddish brown and bright brown coloration observed in the various horizons of the pedons suggest the influence of OM as a colourant in tropical soils[37]. The orange color that dominates the subsurface horizons (Bt1 and Bt3) of pedon II indicates the presence of goethite as a form of ferric oxyhydroxide (FeO (OH)) bound to clay and OM colloids. This soil could also be periodically affected by waterlogging.
The differences in soil structures among the pedons are therefore probably due to their different textural properties. The presence of charcoal as observed in the Ap2 horizon of Pedon I indicates human activity/occupation in the past whereas the termites found in the subsurface horizons (Bt1 and Bt2) of Pedon II depicts the relative amount of faunal activities in the soils, which facilitates soil mixing (faunal pedoturbation). This could be responsible for the enlargement of soil pores. Different roots and soil pores were detected in all horizons of Pedons I and II, indicating biological activities in the soils, with root variations related to the depth differentiation in the horizons, the root system of the plants, and the types of plants present in the studied areas. Diffuse and wavy, were the dominant distinctness and topography of the boundaries between the observed horizons.
Physical properties of the studied soils
-
The increasing clay content with increasing soil depth observed in the Pedon II could be due to the disaggregation of soil components through biological or agricultural processes and the downward movement of clay particles by leaching, or possibly a combination of these factors[38]. Idoga et al.[39] attributed an increase in clay content with depth to illuviation processes and to contributions of the underlying geology through weathering. The dominance of the sand fraction in the studied soils (CV, 9.72%) reflects the geological formations of the soils, which primarily determine the physical properties of soils[40]. Accordingly, the textural class of Pedon I was loamy sand, while Pedon II was loamy sand over sandy loam and sandy clay loam. The SCR value of Pedon II, which was twice as high as that of Pedon I, suggests that the air-filled porosity, saturated hydraulic conductivity and volume of migrating particles are better in the former soil than in the latter.
The low BD of both pedons is typical of coarse-textured soils and ideal for plant growth[41]. Accordingly, the BD values were generally below the threshold value (1.75 g cm−3) that would not restrict root proliferation, and air and water transport. The low BD of the soils imply more pore space for improved air and water permeability. water. Therefore, the high porosity of soils is expected to be inversely related to BD. Soils with a TP value of > 40% offer plants a high water retention capacity and do not pose a risk of compaction[42]. The higher Ksat of the A horizon compared to the sub-horizons could be related to differences in soil texture, which partly explains the clay illuviation mentioned earlier. This accumulation of suspended clay particles in the Bt horizons through leaching contributed to their low permeability. However, an indication of the rapid water permeability of the surface soil to a depth of 81 cm in Pedon I could be related to the consistent coarse LS texture, which favors increased leaching of water and nutrients[43]. We believe that this increased leaching potential of Pedon I is most likely responsible for their very low exchangeable base cations content compared to Pedon II (Tables 4 & 5).
The higher average MWD and AS of Pedon II compared to Pedon I indicates better structural stability and the ability of soil aggregates to resist the disruptive effects of water-induced dispersion and disintegration of Pedon II[44]. This could be the influence of the higher contents of OM and clay particles that contribute to the formation of aggregates and structural stability of the soil.
Chemical properties of the studied soils
-
The pH (H2O) range indicates that the soils are moderate to slightly acid[45], which represents the pH of mineral soils in the humid tropics. The slight acid pH (H2O) of the B2 (Pedon I) and the Bt2 and Bt3 (Pedon II) horizons could be attributed to aluminum hydrolysis releasing hydrogen ions which lower the soil pH. In addition, the acidity of the soils may also be due to the acidic nature of the parent material, the effect of cultivation, and leaching of nutrients or a combination of these. Nonetheless, the pH of the studied soils, is similar to that reported by Umeugokwe et al.[19], and is within the ideal pH range of 5.5 to 7.0 for overall satisfactory availability of plant nutrients[46,6]. The favorable pH condition represents the potential of both soils for crop production, though judicious lime application may be required for alkaline-tolerate crops.
The OC content was moderately high in Pedon II formed from upper coal measure, inconsistent with the reports of Umeugokwe et al.[19] on similar geological formations and regions. In Pedon II, the higher OC content in the upper horizons compared to the lower horizons could be attributed to the high litter fall occasioned by the high vegetation density in the area and their higher SCR. Matus[47] showed that the silt and clay content is the main factor defining an upper SOC accumulation in soils. Low faunal activities in the underlying horizons might be responsible for the decrease in OC content with increasing soil depth. Lawal et al.[48] and Afu et al.[49] observed a similar OC trend with soil depth. The moderately low OC content in Pedon I could be attributed to the rapid mineralization of SOM, intensive utilization of the land for crop cultivation, and the evidence of reoccurring bushing burning observed in the area. These reasons could also account for the low CEC of the soils since SOM provides proportional amounts of the CEC and water-holding capacity of soils[50]. The variation in the OC content between the upper and the lower horizons found in both pedons suggests that Pedon II had higher SOC content compared to Pedon I.
As similarly found in the OC content, the two pedons exhibited moderate TN content in the uppermost horizons compared to the lower horizons. This further buttressed Meysner et al.[51] remark that the amount of TN reflects the amount of OC in the soils, as OC accounts for 93% to 97% of TN. However, the > 1% TN in both soils could be a result of prevailing high temperatures and relatively humid environmental conditions, which favor rapid decomposition and mineralization of SOM. The low C/N of the soil lends credence to this inference. Due to the important role of N in plant nutrition, external N addition may be required in crop cultivation.
The differences in the Av.P concentrations between the A horizon and the sub-horizons could be related to the influence of soil pH on P availability, as Av.P is maximum between pH 5.3 and 7.5[52]. Additionally, the moderate concentration of Av.P in the surface soil may be related to the corresponding high OM content and the low solubility and mobility of P in soil[53], while the low Av.P in the subsoils for both pedon species may be due to the low OM content and the fixation of P by Fe and Al oxides and hydroxides and clay[54]. Given the critical functions of the major primary nutrients in soils, the moderate Av.P concentration in Pedon II represents the soil’s potential for agricultural production. However, the main potentially limiting nutrients were N and K for Pedon II, and N, P and K for Pedon I.
Concentrations of base cations are frequently in the deficiency range in Ultisols and this can be attributed to leaching, erosion, and runoff losses due to the heavy rainfall in the study region[55]. Both the CEC and BS of Pedon II were about 65 to 93% greater than those of Pedon I. The very low exchangeable base cations content, and the low CEC and BS conditions in the Pedon I is an indication of highly weathered and excessively leached soil[56]. This agrees with the reports of Ndukwu et al.[57] and Umeugokwe et al.[19] on similar soils of Southeastern Nigeria. The present results suggest that agricultural output on Pedon I may be adversely affected and that crop cultivation may require several applications of the appropriate recommended fertilizer rate for a given crop during the growing season. Due to the moderately low N levels and the deficient status of the other essential nutrients, the major primary nutrients N, P, and K should be frequently applied along with secondary plant nutrients such as Ca and Mg. Considering the loamy sand texture of the soil, the combination of organic and inorganic fertilizers would help to improve the soil structure and reduce nutrient losses. In addition, fertilizer placement methods should aim to enhance fertilizer use efficiency and minimize leaching or volatilization of N and P fixation. On the other hand, the high percentages of CEC and BS found in all horizons of Pedon II indicate their capacity to retain important nutrients due to the aforementioned contribution of higher colloidal content. Sustainable agricultural production on Pedon II would therefore require the maintenance of soil fertility through standard fertilization practices, as opposed to several fertilization management practices in Pedon I.
The results of the study undoubtedly show that Pedon II is more favorable for agricultural production than Pedon I. However, given the influence of soil formation factors (e.g. topography, weather variables such as rainfall and temperature) on soil heterogeneity and the different nutrient requirements of the different arable crops for optimal performance, this inference may not apply to all the pedons of the similar geological materials studied. Moreover, the two sites are also not sufficiently representative of all pedons of the geological materials studied, and so the results of similar studies elsewhere may differ significantly. Therefore, the inference from this study may be limited to the areas studied and other areas with similar morphology, physiochemical and environmental characteristics, and soil management practices. Despite this limitation, knowledge of soil morphological and physiochemical properties is an essential part of soil suitability evaluation and management as well as crop productivity improvement. Since soil productivity includes not only soil fertility but also the inherent and management-related factors affecting crop growth and yield, it would therefore be beneficial to evaluate the suitability of these soils for producing crops commonly grown at the two locations. Soils with low fertility may have limited suitability for rainfed maize cultivation[58].
Effect of location and soil depth on soil chemical properties
-
The pHKCl, SOC, Av.P, exchangeable bases, CEC, and BS were the main soil fertility parameters that differentiated Pedon II from Pedon I. These results, which support the findings from the characterization of the soil horizons of both pedons, indicate that the soils were formed from similar geological material and thus fall under a similar land use type. Our results suggest that Pedon II, which is overlain by upper coal measure geological materials provide more favorable conditions for agricultural production due to its higher nutrient reserve and the near favorable pH (5.2). The optimal pH range for most crops is between 5.5 and 7.5, and below 5.0 (CaCl2), toxic amounts of Al and Mn are soluble and released into the soil solution[46]. Although there was no statistical difference in the soil chemical properties of the two soil depths, a trend was observed indicating higher values at the uppermost 0−30 cm compared to the 30−60 cm subsoil. The higher SOC, CEC, and BS in Pedon II, which indicates a larger nutrient reserve, allow a better prediction of nutrient availability for crop production. This implies that shallow-rooted plants would be able to take up more nutrients within the 0−30 cm plough layer than deep-rooted plants. Nevertheless, it would therefore be more profitable to evaluate the suitability of the studied pedons for the production of a given crop, as emphasized earlier.
-
Morphologically, soils developed from false-bedded sandstone (Pedon I) and upper coal measure (Pedon II) are generally deep (> 150 cm), coarse-textured, and have darker topsoils than subsoils due to pedogenic processes. Pedon I has distinct coarse textural characteristics with better drainage properties and greater leaching potential. Pedon II are characterized by a mixture of coarse and fine textures and are structurally more stable to withstand the erosive rainfall prevalent in the study region. Both pedon species were moderately to slightly acidic and had moderate TN content. However, Pedon II are characterized by a higher content of organic carbon and essential nutrients, including cation exchange capacity and base saturation, than Pedon I. Thus, the potential of Pedon II for agricultural production lies in favorable pH, SOC, total N, and available P, while P and K are the most important potentially limiting nutrients in Pedon I. Given the better soil structure and larger nutrient reserves, which enable better prediction of nutrient availability for plant growth, Pedon II is more favorable for agricultural production than Pedon I.
Sustainable crop production on Pedon II would therefore require maintaining soil fertility through conventional fertilization practices, as opposed to more frequent fertilization in Pedon I. In addition, cover cropping, mulching, and the integrated use of organic and inorganic fertilizers are strongly recommended as strategies to increase nutrient content and improve soil structure, especially in Pedon I. Furthermore, appropriate fertilizer application methods are needed to increase the efficiency of fertilizer use and minimize nutrient losses through leaching, volatilization, or fixation in both soils. It would therefore be more profitable to evaluate the suitability of the studied pedons for the production of a given crop.
-
The authors confirm contribution to the paper as follows: study conception and design: Okebalama CB; data collection: Anih FC; analysis and interpretation of results: Okebalama CB, Anih FC, Awaogu CE; draft manuscript preparation: Okebalama CB, Awaogu CE. All authors reviewed the results and approved the final version of the manuscript.
-
The datasets generated during and/or analyzed during the current study are available from the corresponding author on reasonable request.
The field study and laboratory analysis were financially supported by the second author. The authors thank the laboratory staff of the Department of Soil Science, University of Nigeria, Nsukka, Nigeria, where the entire laboratory study was carried out. We thank Mr Chigozie Pascal Umeugokwe for preparing the map of the study area.
-
The authors declare that they have no conflict of interest.
- Copyright: © 2024 by the author(s). Published by Maximum Academic Press, Fayetteville, GA. This article is an open access article distributed under Creative Commons Attribution License (CC BY 4.0), visit https://creativecommons.org/licenses/by/4.0/.
-
About this article
Cite this article
Okebalama CB, Anih FC, Awaogu CE. 2024. Morphology and fertility evaluation of soils from different geological materials for agricultural production in Southeastern Nigeria. Technology in Agronomy 4: e018 doi: 10.48130/tia-0024-0017 

Morphology and fertility evaluation of soils from different geological materials for agricultural production in Southeastern Nigeria
- Received: 06 March 2024
- Revised: 01 May 2024
- Accepted: 21 May 2024
- Published online: 10 July 2024
Abstract: Knowledge of the properties of soils overlain by different geological materials is a fundamental decision-making tool for land suitability evaluation and soil fertility management. The morphological and physiochemical properties of soils overlying false-bedded sandstone (Pedon I) and upper coal measure (Pedon II) in Nsukka, Nigeria were investigated. Field studies involving excavation, delineation, description, and sampling were designed to determine the potential and limitations of each pedon species for agricultural production. Morphologically, both pedons were generally deep (> 150 cm), coarse-textured, and had darker topsoil than subsoil. The soils were predominately single-grained and crumbly, except for the structureless lower horizon of Pedon I. Pedon I had a uniform loamy sand texture, while Pedon II had an irregular loamy sand texture over sandy loam and sandy clay loam, with a silt:clay twice that of the former. A higher saturated hydraulic conductivity characterized Pedon I, while higher percentage aggregate stability and mean weight diameter characterized Pedon II. Both pedons were moderately to slightly acidic and had similar bulk density and total porosity, including N content. However, the organic carbon, available P, and exchangeable base contents were higher in Pedon II than in Pedon I. While favorable pH, organic matter, total N, and available P represent the potential of Pedon II for agricultural production, P and K are the main potentially limiting nutrients in Pedon I. Therefore, Pedon II is more favorable for crop production than Pedon I. Sustainable agricultural production on Pedon II would consequently require maintaining soil fertility through standard fertilization, as opposed to multiple fertilization in Pedon I.
-
Key words:
- False-bedded sandstone /
- Upper coal measure /
- Soil properties /
- Soil horizons /
- Soil texture