-
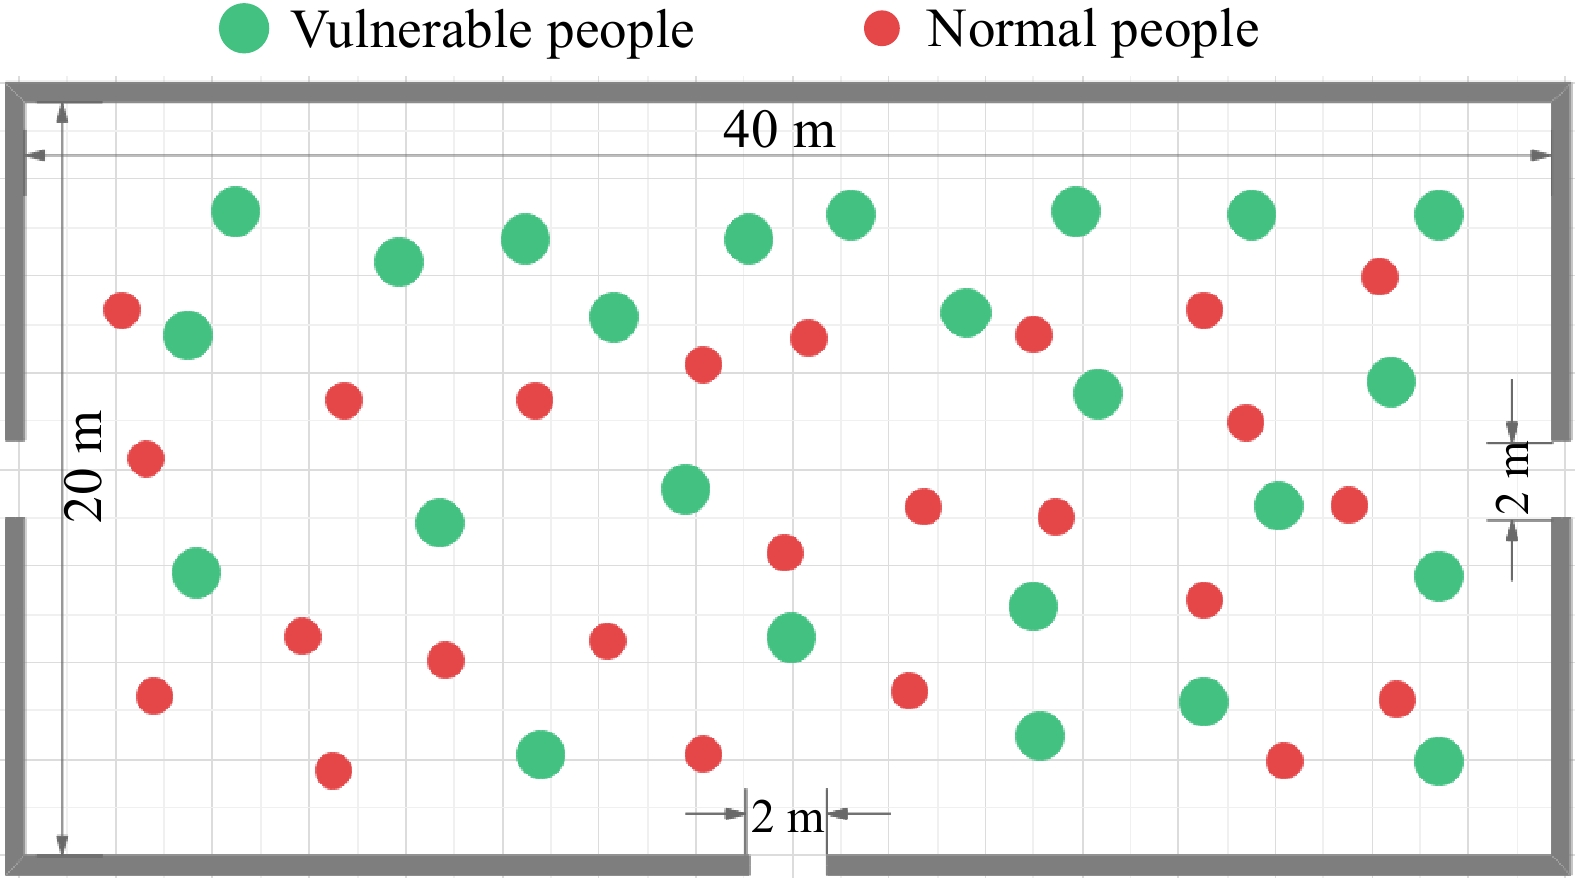
Figure 1.
Schematic diagram of the simulated scene.
-
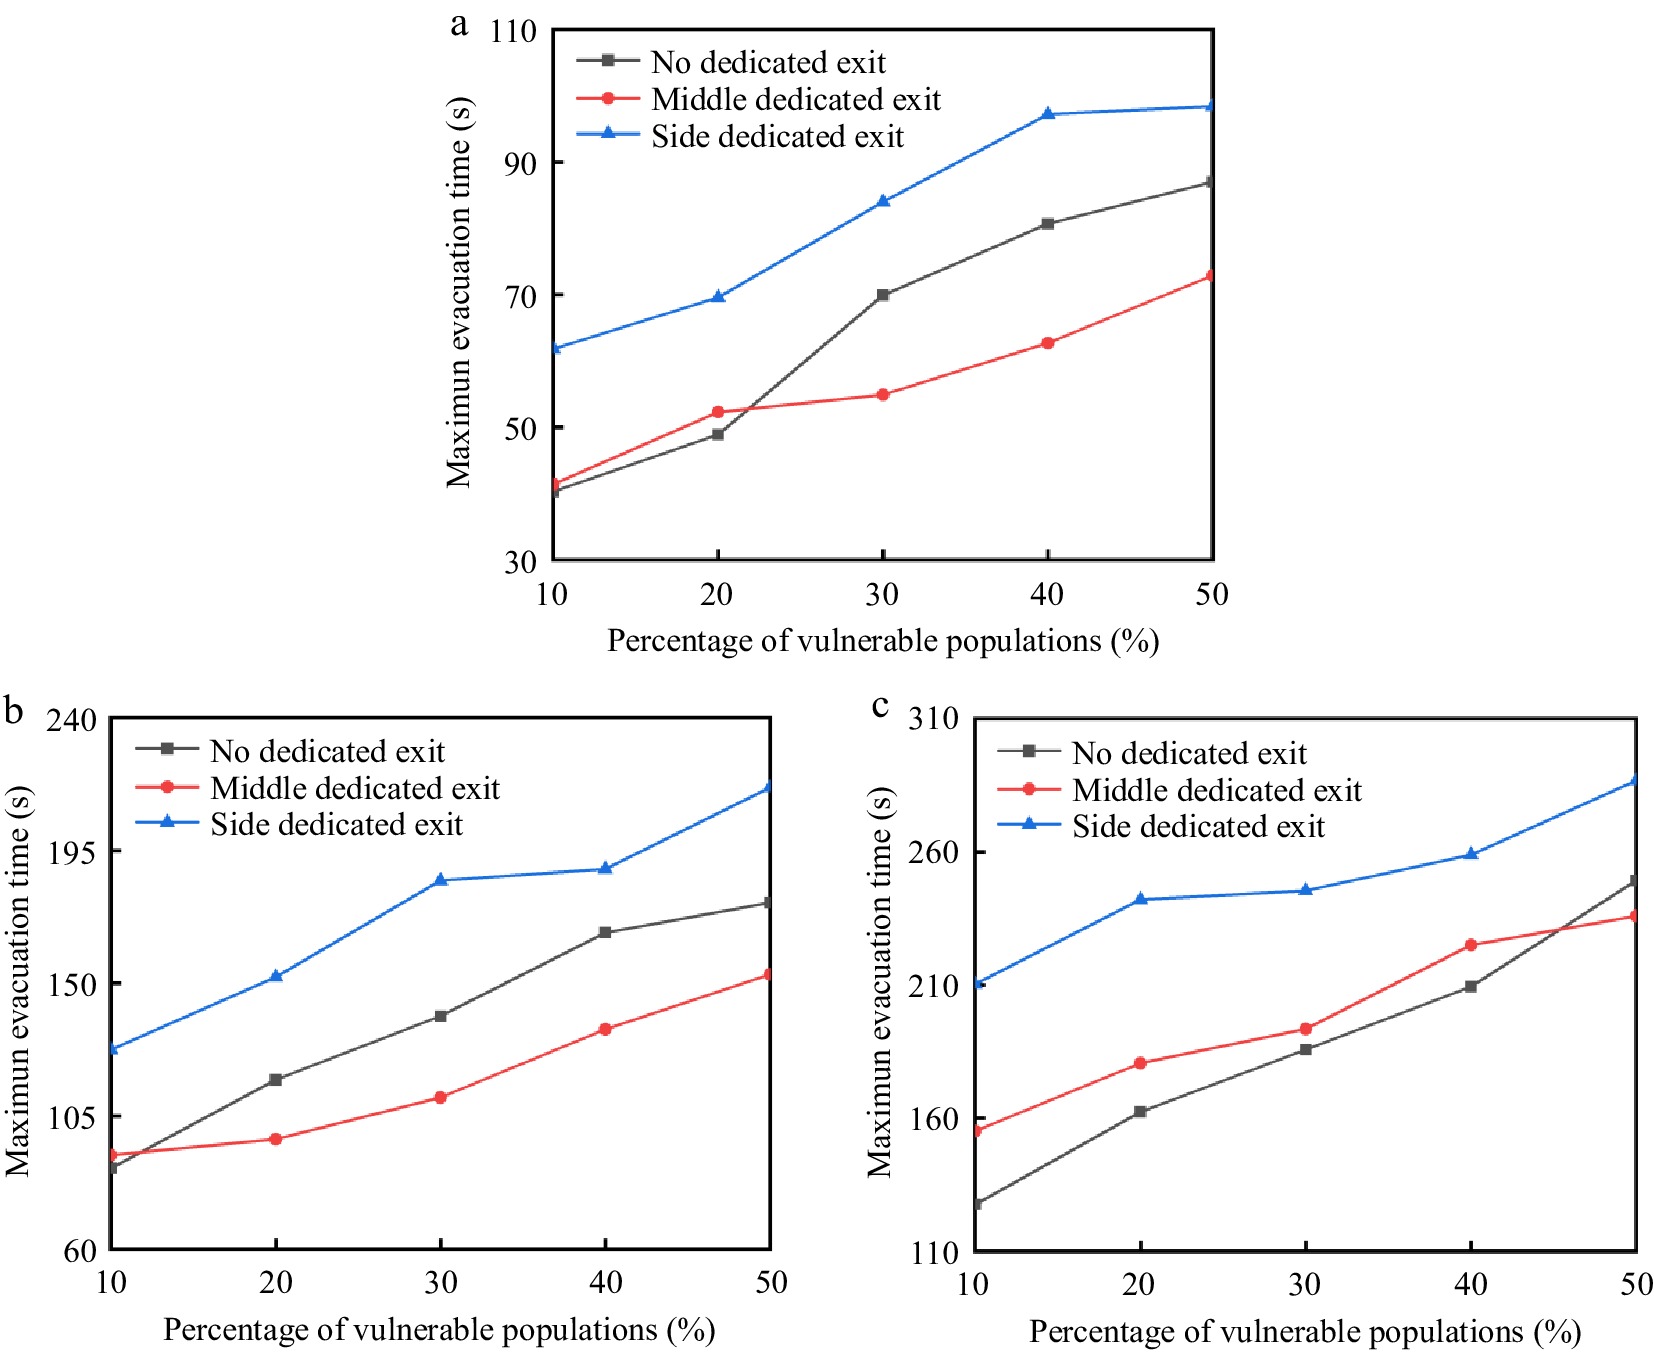
Figure 2.
Maximum evacuation time: (a) 200 people, (b) 400 people, (c) 600 people.
-
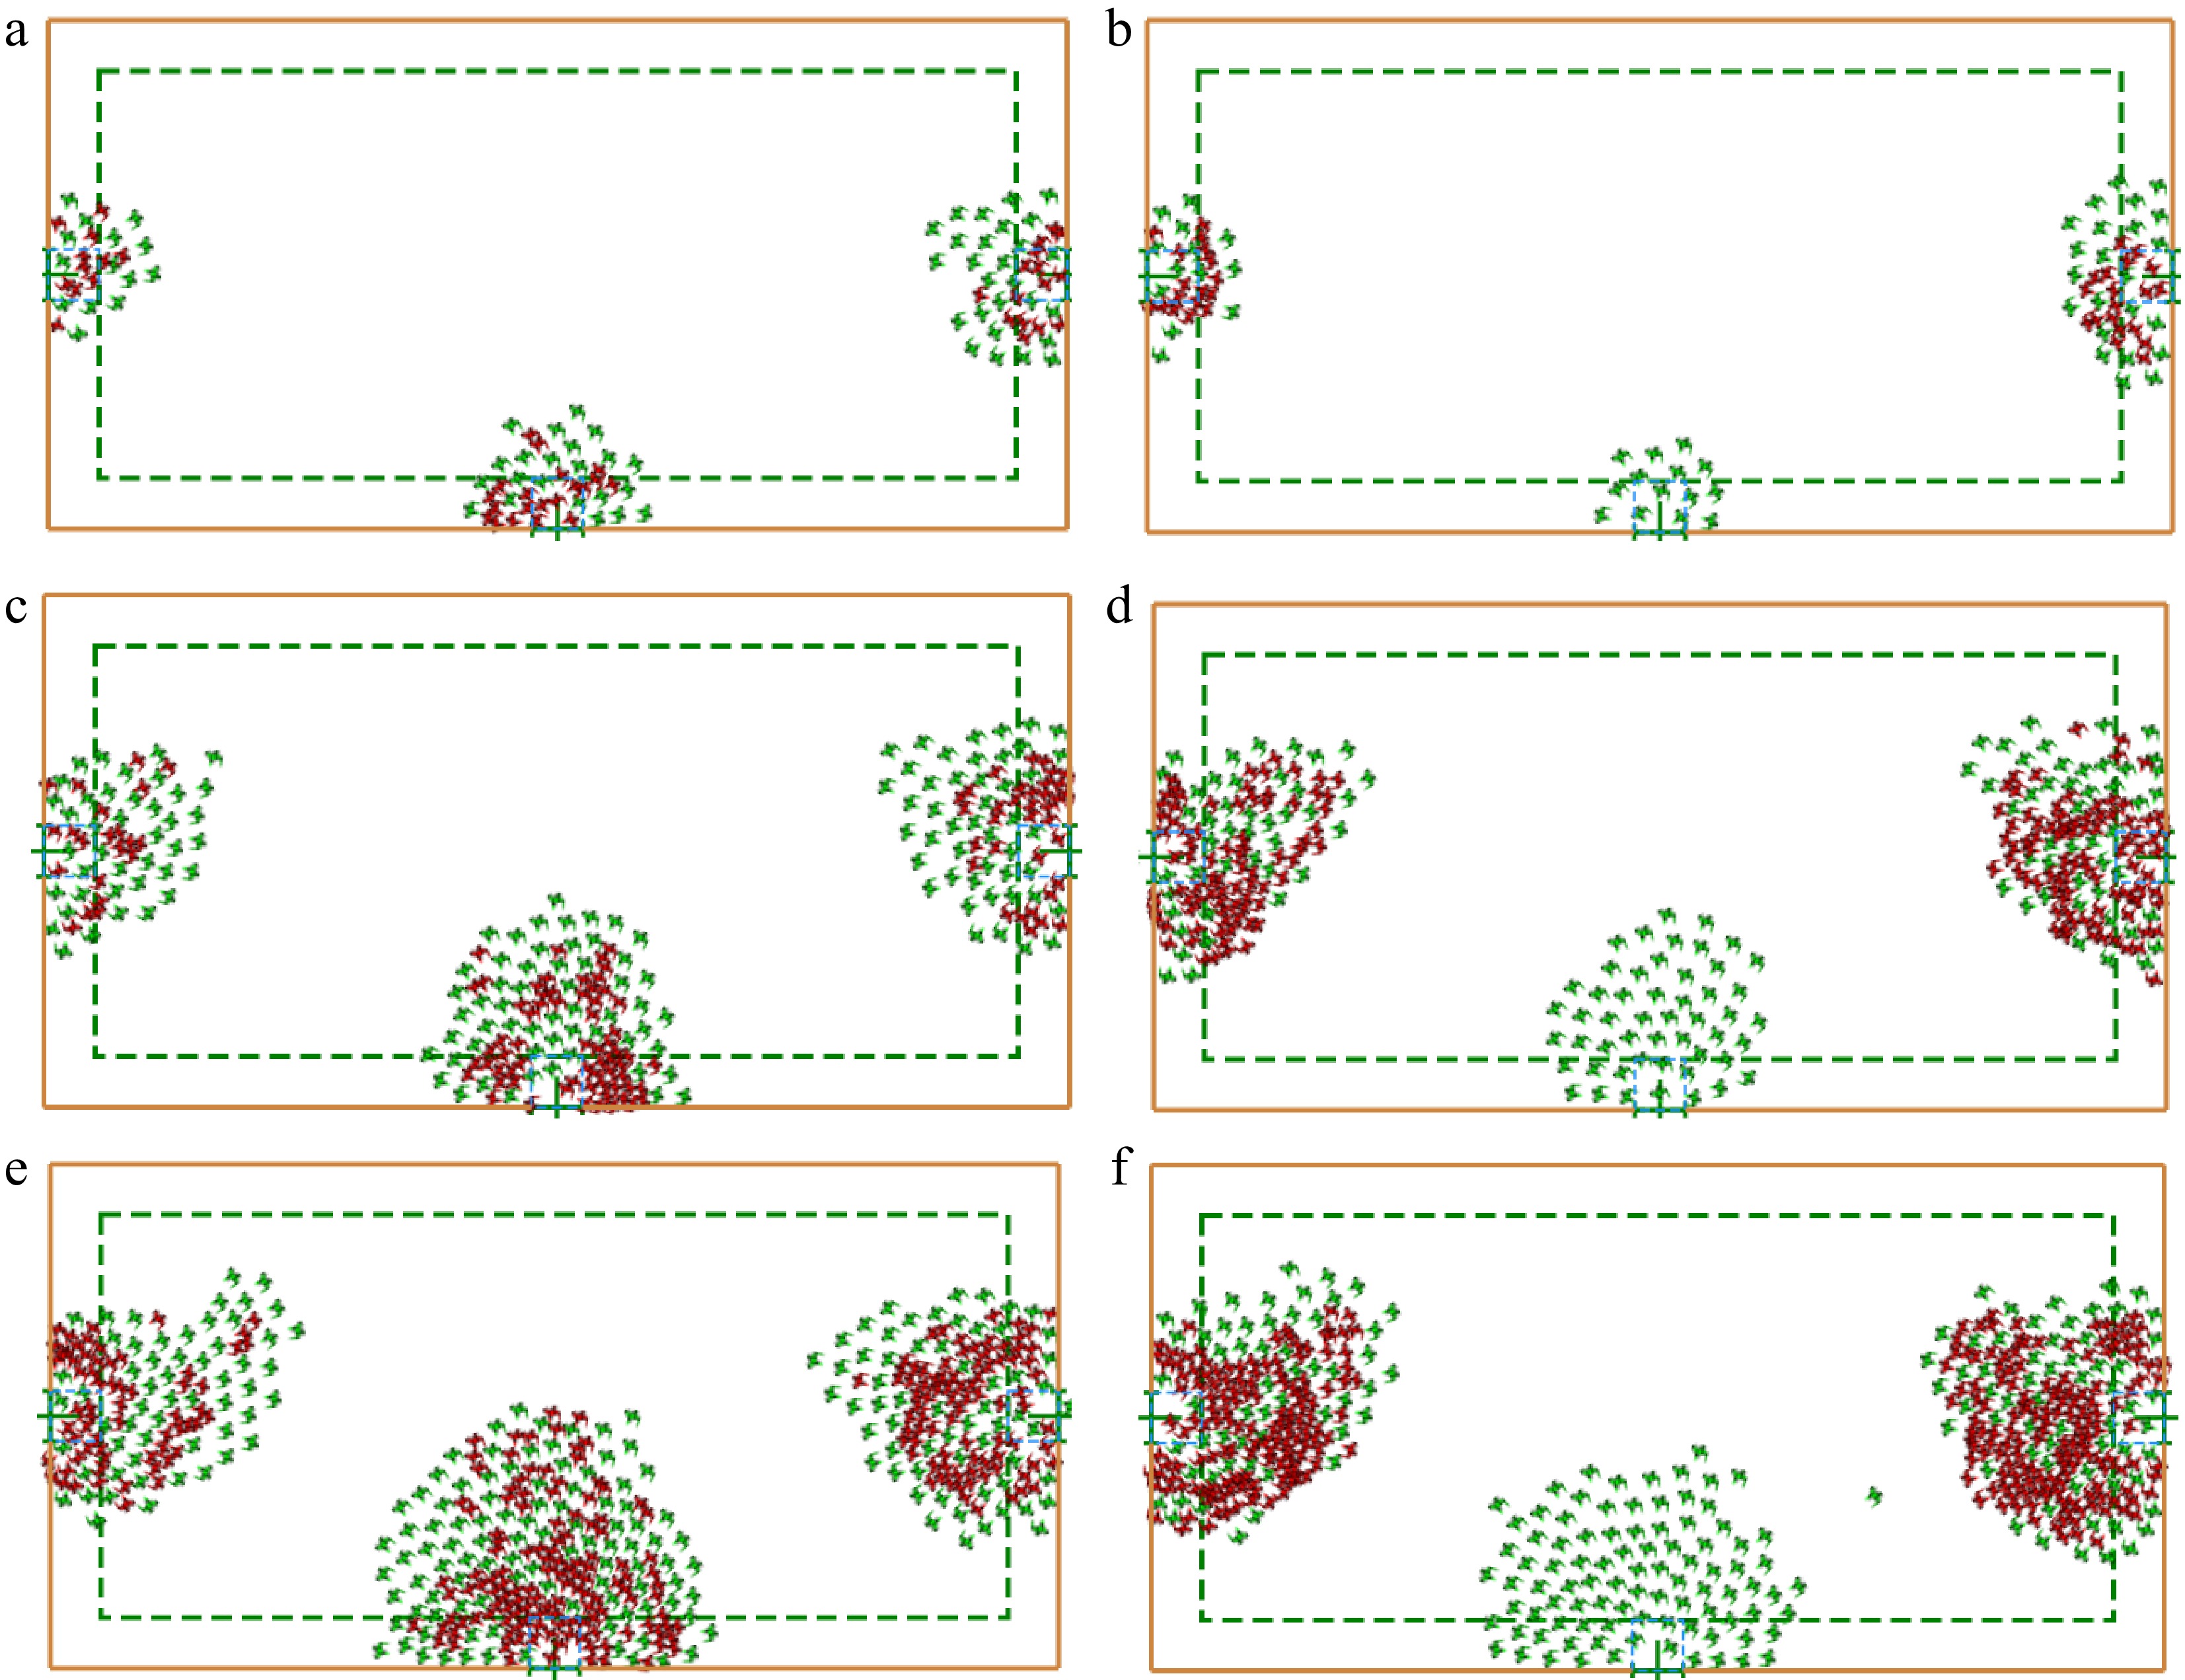
Figure 3.
Simulation chart: (a) 200 people without dedicated exits, (b) 200 people with dedicated exits, (c) 400 people without dedicated exits, (d) 400 people with dedicated exits, (e) 600 people without dedicated exits, (f) 600 people with dedicated exits.
-
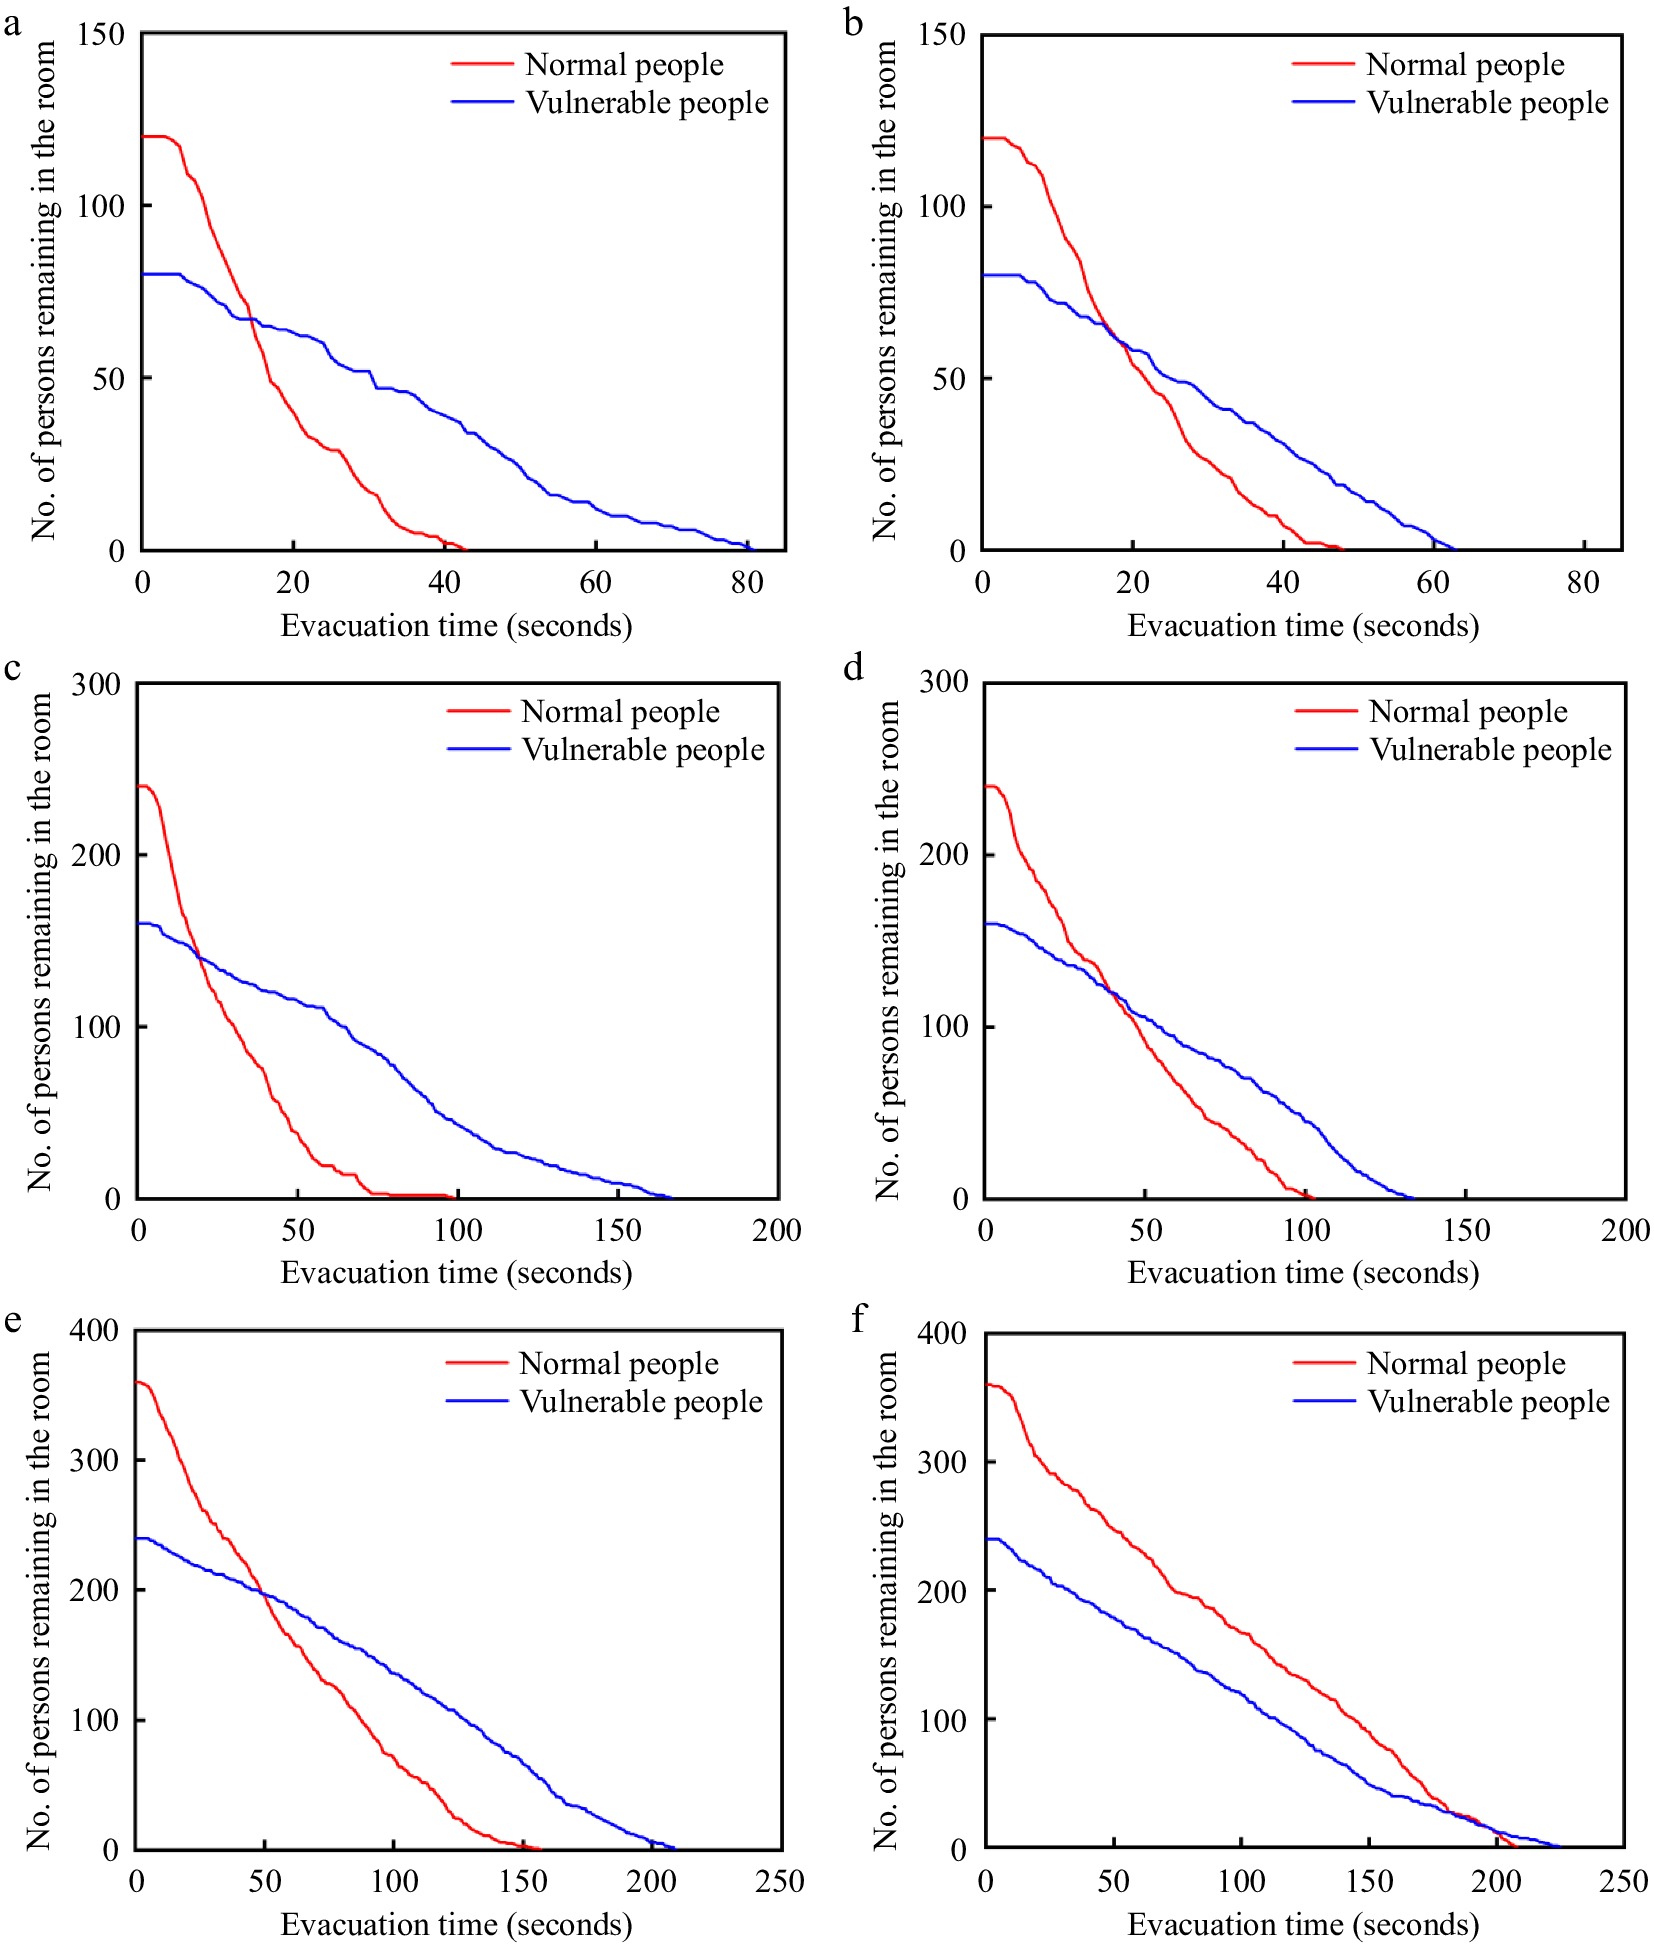
Figure 4.
Change in the number of people remaining in the room over time: (a) 200 people without dedicated exits, (b) 200 people with dedicated exits, (c) 400 people without dedicated exits, (d) 400 people with dedicated exits, (e) 600 people without dedicated exits, (f) 600 people with dedicated exits.
-
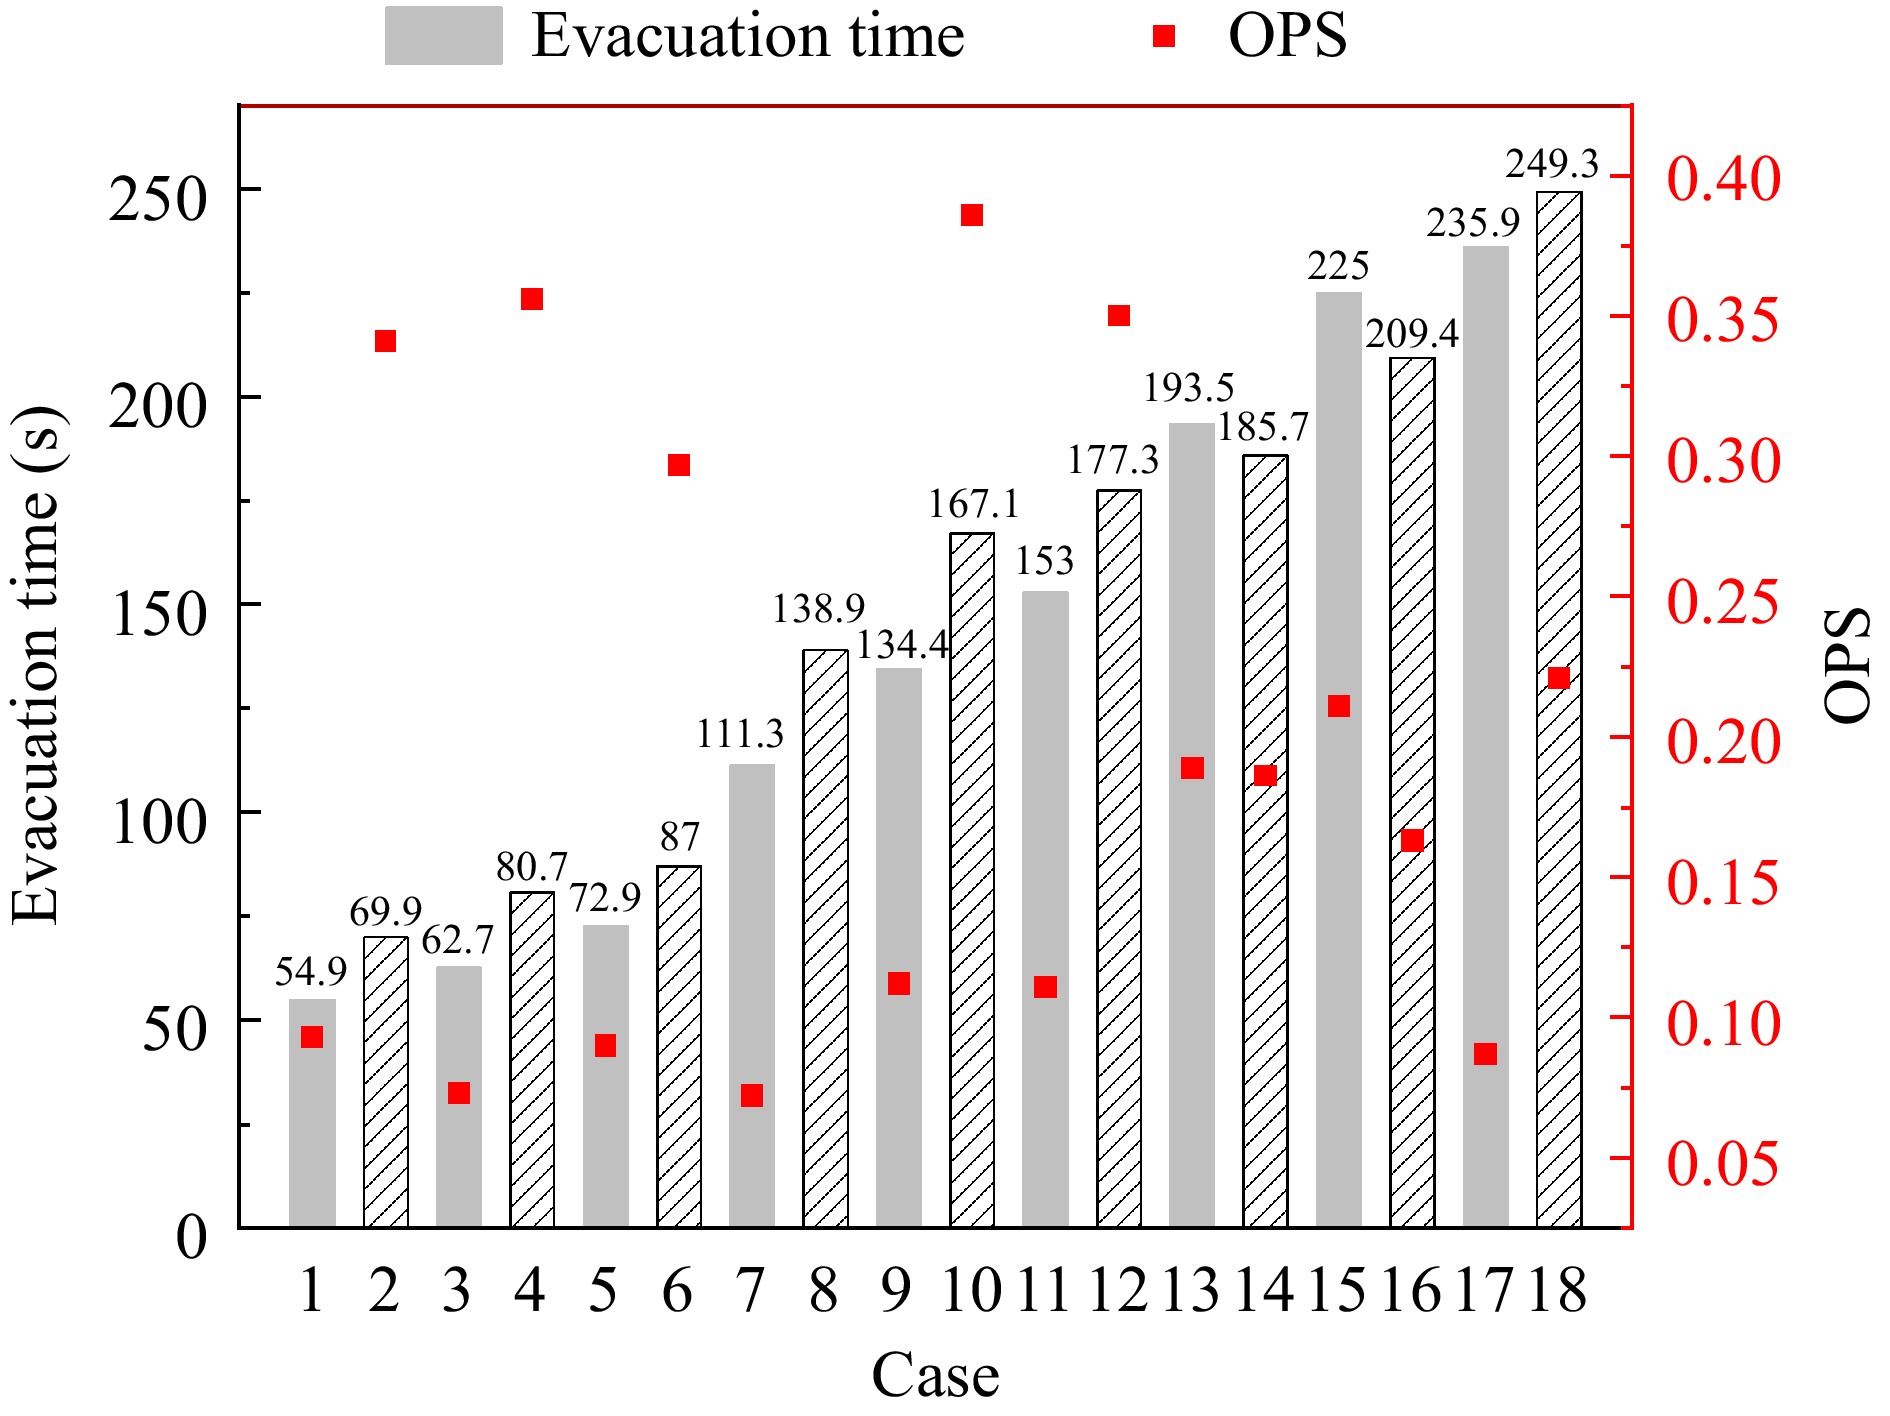
Figure 5.
Statistical graph of maximum evacuation time and OPS value for each working condition.
-
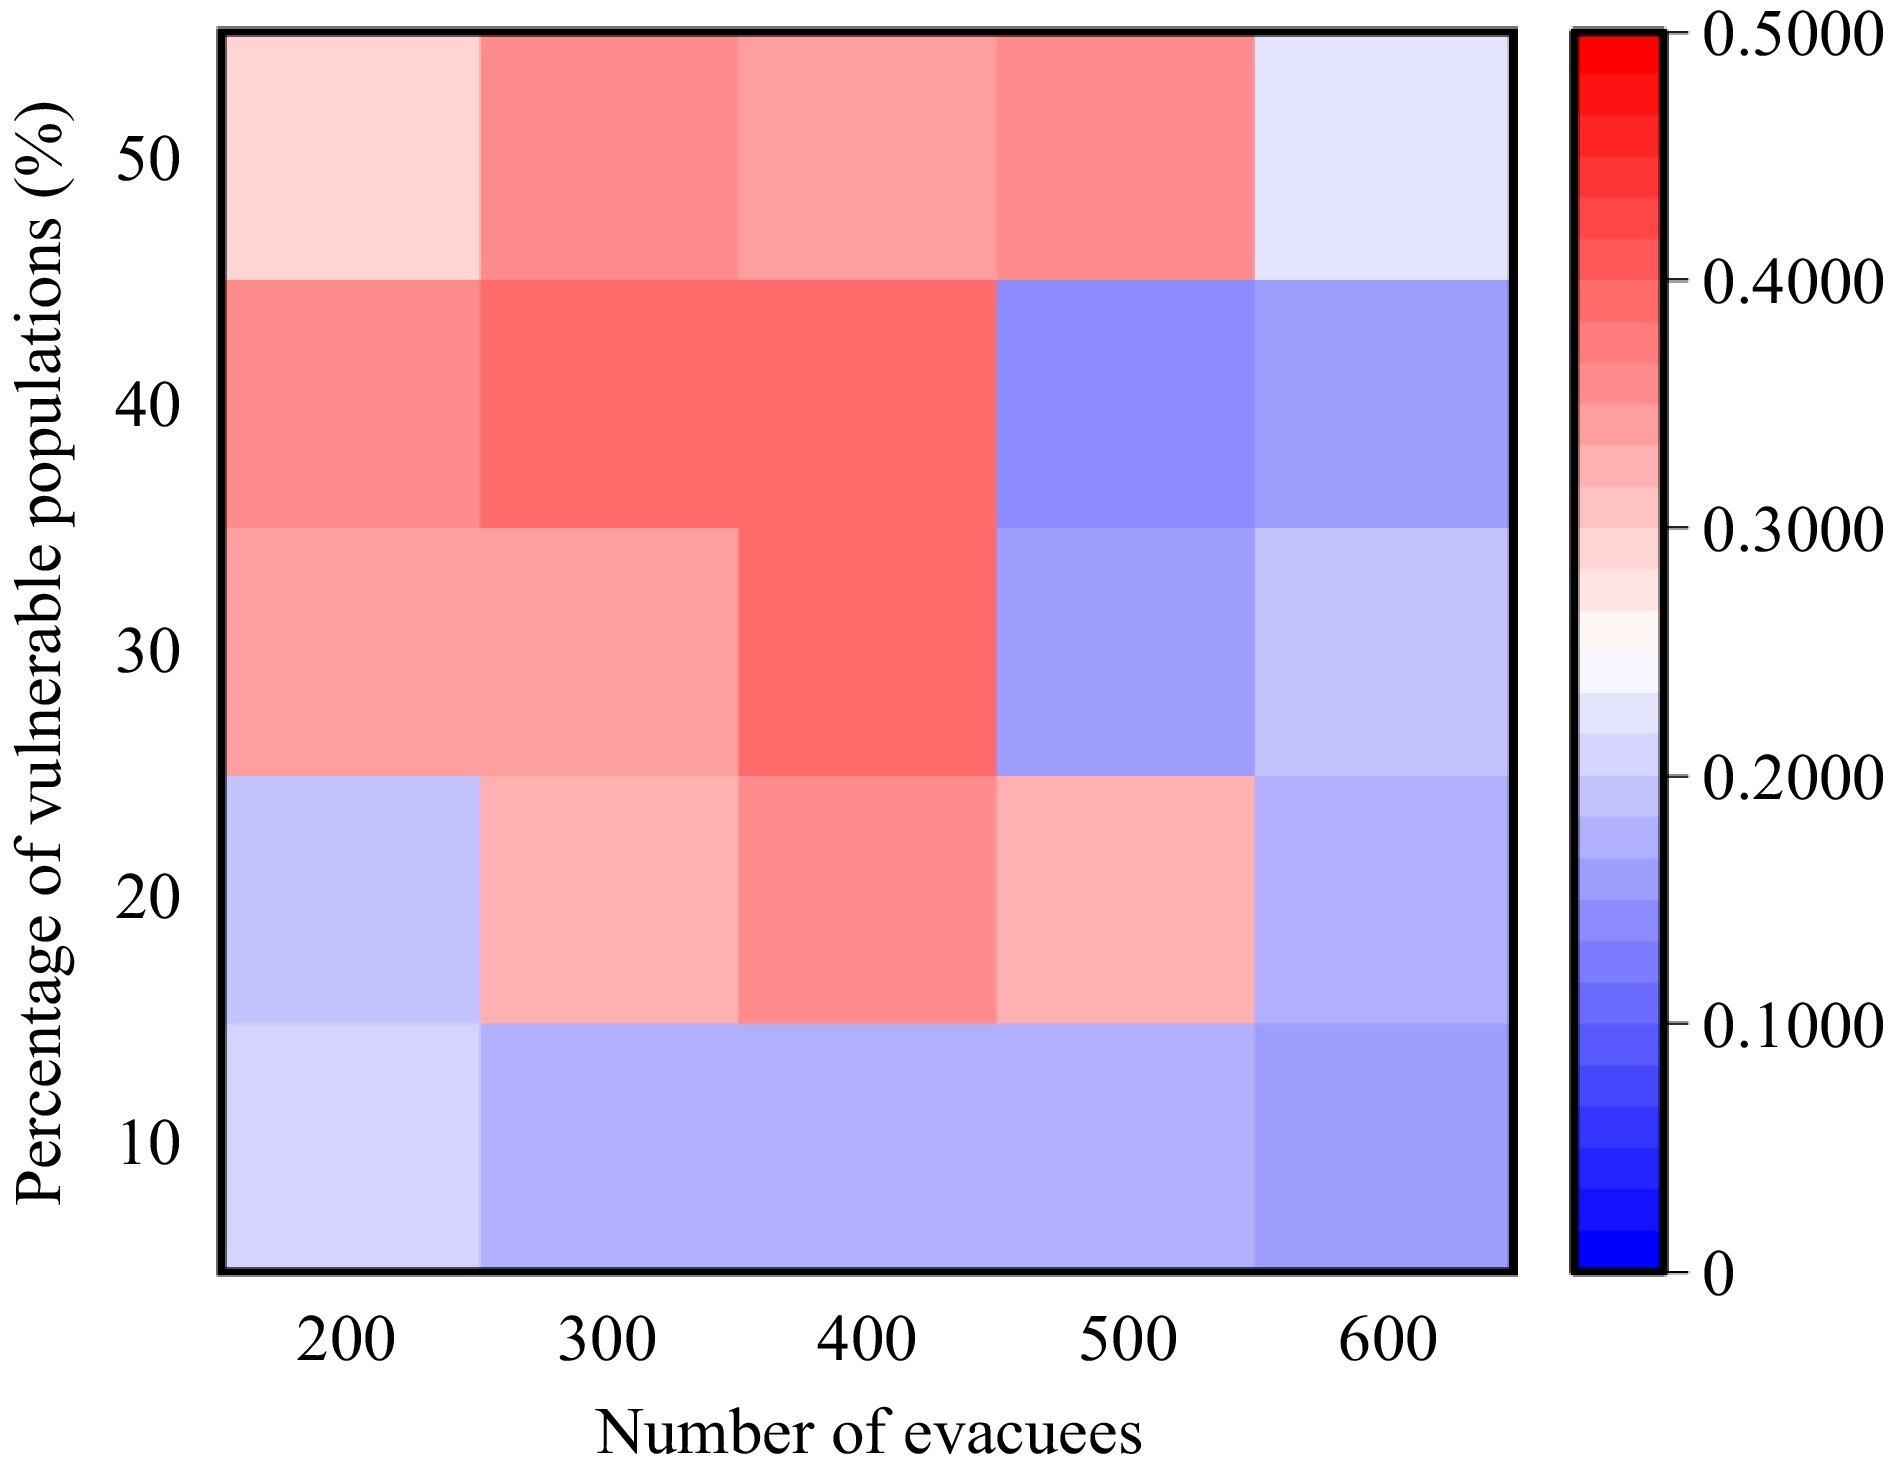
Figure 6.
Heat map of OPS values for evacuation without dedicated exits.
-
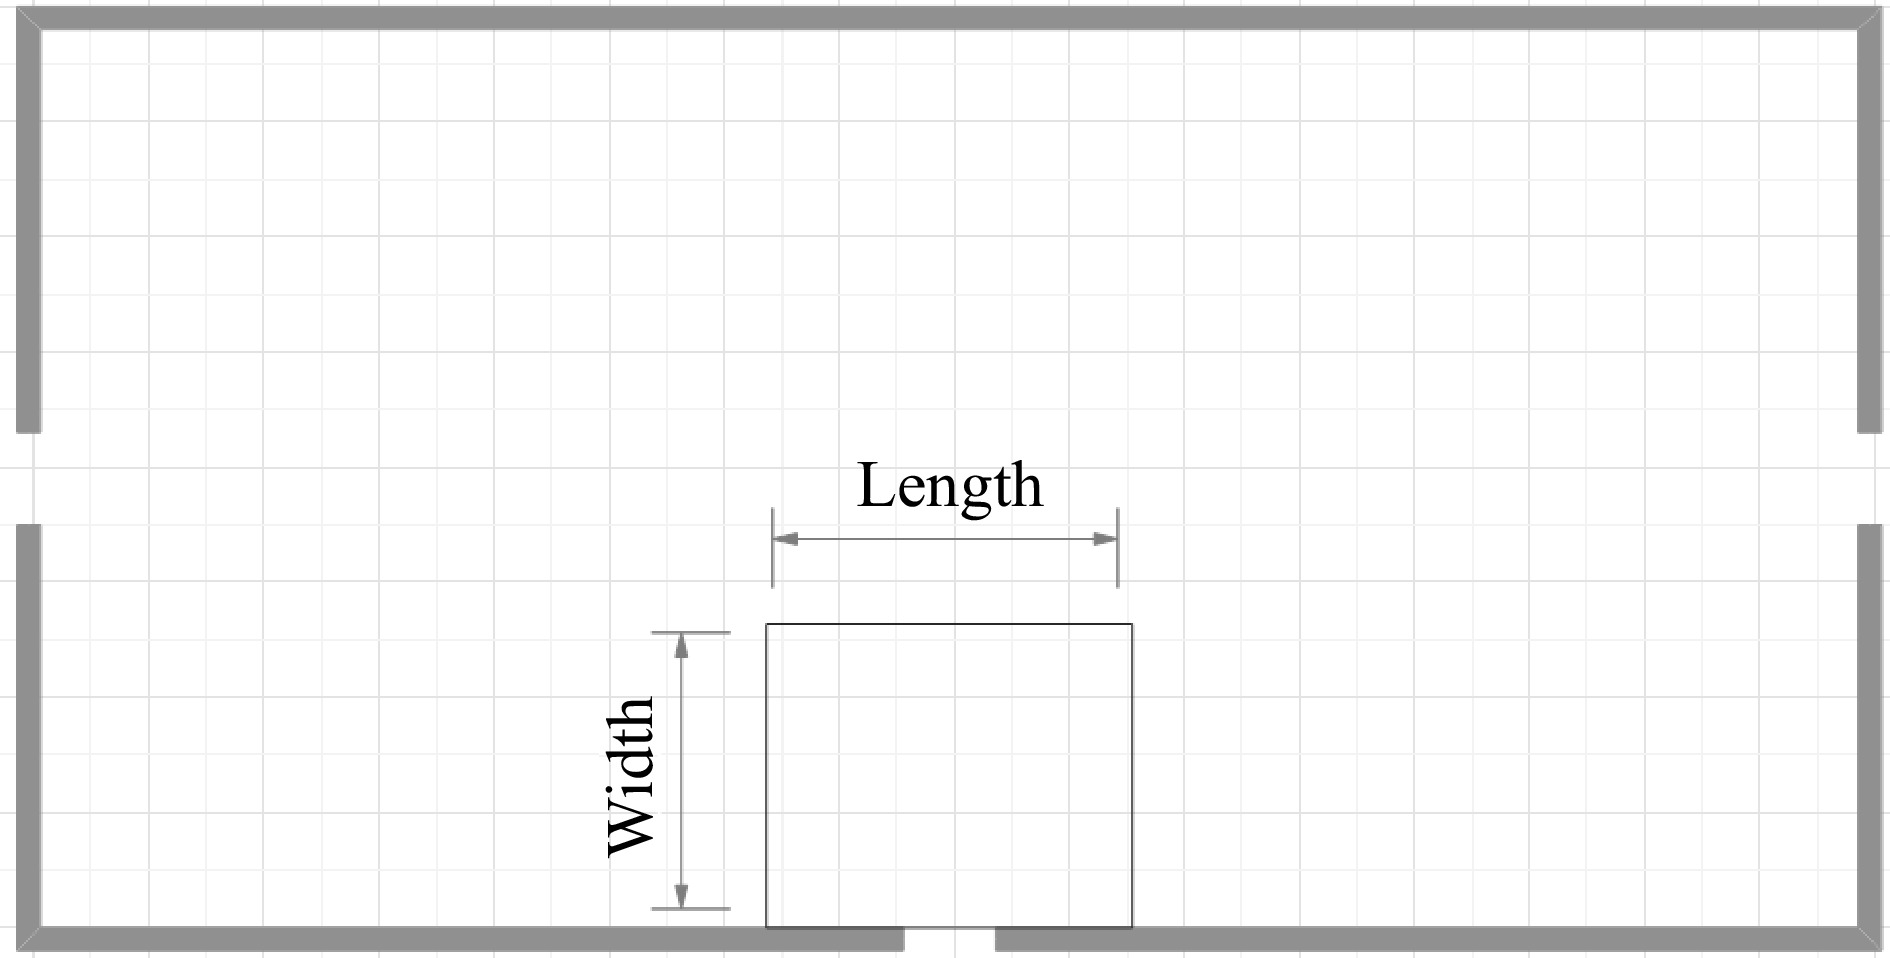
Figure 7.
Schematic diagram of the designated area.
-
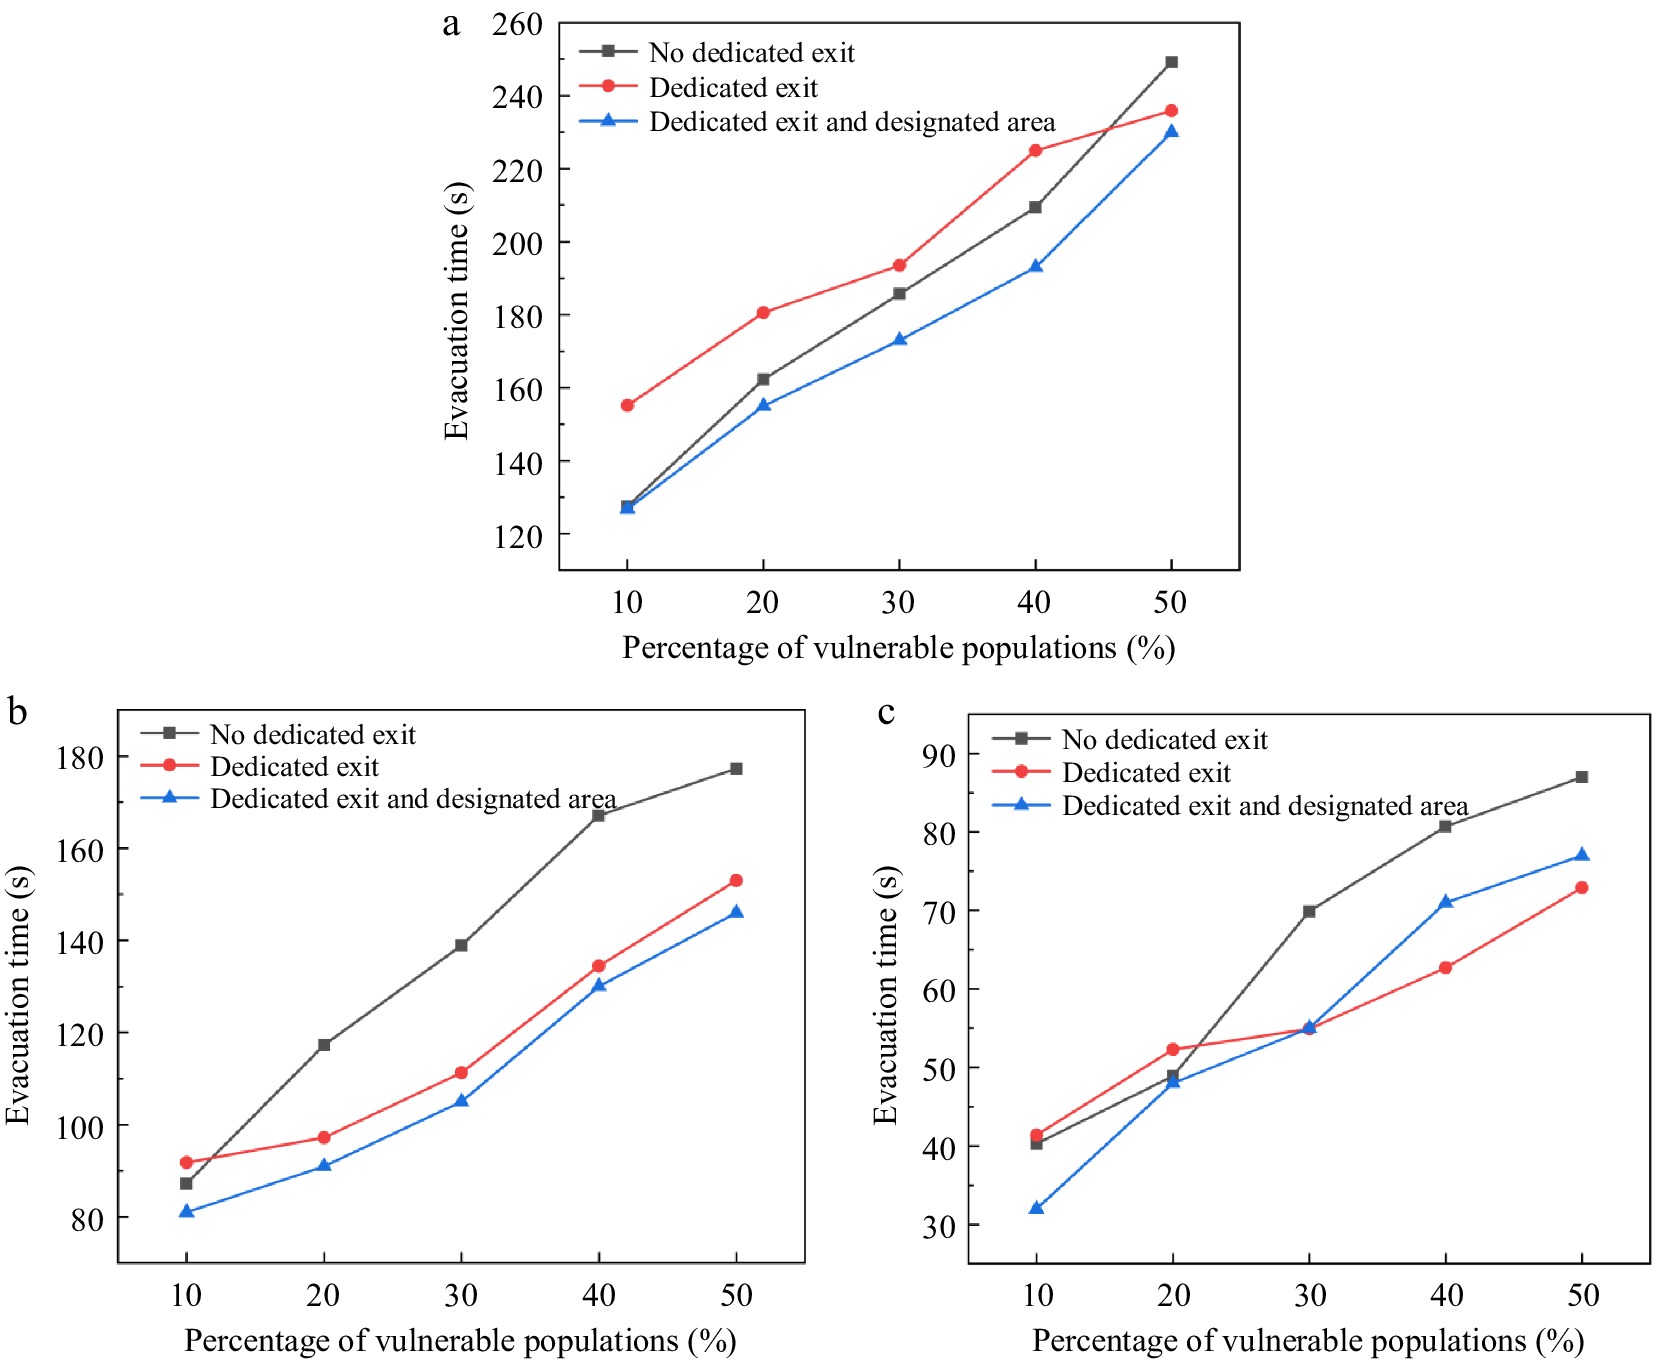
Figure 8.
Evacuation time: (a) 600 people, (b) 400 people, (c) 200 people.
-
Parameters Sense Value $ {\mathit{v}}_{\mathit{i}} $ Pedestrian velocity vector $ {\mathit{v}}_{\mathit{i}}^{0} $ Pedestrian desired speed $ {\mathit{e}}_{\mathit{i}}^{0} $ Direction of expected pedestrian speed $ {\mathit{v}}_{\mathit{i}} $ Actual pedestrian speed $ \mathit{m} $ Pedestrian quality 80 kg $ \mathit{r} $ pedestrian radius 0.2−0.25 m $ {\mathit{r}}_{\mathit{i}\mathit{j}} $ Sum of the radii of two pedestrians $ {\mathit{d}}_{\mathit{i}\mathit{j}} $ Distance between the centers of two pedestrians A social exclusion 2,000 N B Distance to social exclusion characteristics 0.08 m $ \mathit{\kappa } $ coefficient of sliding friction 240,000 kg/m/s k Body Compression Factor 120,000 kg/s2 $ {\mathit{\tau }}_{\mathit{i}} $ Pedestrian response time 0.5 s Table 1.
Parameters and their meanings in the social force model.
-
Pedestrian density (p/m2) Level of servive 0−0.31 A 0.31−0.43 B 0.43−0.72 C 0.72−1.08 D 1.08−2.17 E 2.17−5.4 F Table 2.
Level of service value.
-
Percentage of
vulnerable populationsMaximum evacuation time 200 people 400 people 600 people Option 1 Option 2 Option 3 Option 1 Option 2 Option 3 Option 1 Option 2 Option 3 10% 40.3 s 41.4 s 61.8 s 87.3 s 91.8 s 127.5 s 127.5 s 155.1 s 210.3 s 20% 48.9 s 54.3 s 69.6 s 117.3 s 97.2 s 152.1 s 162.3 s 180.6 s 242.1 s 30% 69.9 s 54.9 s 84.0 s 138.9 s 111.3 s 184.8 s 185.7 s 193.5 s 245.4 s 40% 80.7 s 62.7 s 97.2 s 167.1 s 134.4 s 188.7 s 209.4 s 225.0 s 258.9 s 50% 87 s 72.9 s 98.4 s 177.3 s 153 s 216.3 s 249.3 s 235.9 s 286.8 s Table 3.
Maximum evacuation time.
-
Percentage of
vulnerable populationsAverage evacuation time for normal populationa 200 people 400 people 600 people Option 1 Option 2 δT Option 1 Option 2 T Option 1 Option 2 T 10% 14.1 s 17.8 s −26.2% 23.4 s 38.1 s −74.4% 39.1 s 60.8 s −55.5% 20% 14.1 s 20.8 s −47.5% 25.5 s 35.4 s −38.8% 49.2 s 74.4 s −51.2% 30% 14.3 s 20.1 s −40.6% 27.1 s 35.6 s −31.4% 46.9 s 83.7 s −79.5% 40% 17.6 s 20.5 s −16.5% 28.9 s 42.7 s −47.8% 60.4 s 94.6 s −56.6% 50% 18.8 s 21.7 s −15.4% 32.1 s 42.7 s −33.0% 59.5 s 95.1 s −59.8% Table 4.
Average evacuation time for normal populations.
-
Percentage of
vulnerable populationsAverage evacuation time for vulnerable populations 200 people 400 people 600 people Option 1 Option 2 δT Option 1 Option 2 δT Option 1 Option 2 δT 10% 24.7 s 20.6 s 16.6% 52.6 s 44.7 s 15.0% 76.7 s 63.6 s 17.1% 20% 27.4 s 24.5 s 10.6% 62.7 s 52.8 s 15.8% 87.1 s 72.8 s 16.4% 30% 32.7 s 31.4 s 4.0% 68.1 s 61.2 s 10.1% 95.1 s 91.8 s 3.5% 40% 38.6 s 33.2 s 14.0% 76.0 s 70.7 s 7.0% 108.6 s 99.2 s 8.7% 50% 41.3 s 39.0 s 5.6% 81.4 s 70.7 s 13.1% 117.3 s 108.5 s 7.5% Table 5.
Average evacuation time for vulnerable populations.
-
Working
conditionDedicated exit location Number of evacuees Percentage of vulnerable populations Middle Side No 200 people 400 people 600 people 30% 40% 50% 1 ● ● ● 2 ● ● ● 3 ● ● ● 4 ● ● ● 5 ● ● ● 6 ● ● ● 7 ● ● ● 8 ● ● ● 9 ● ● ● 10 ● ● ● 11 ● ● ● 12 ● ● ● 13 ● ● ● 14 ● ● ● 15 ● ● ● 16 ● ● ● 17 ● ● ● 18 ● ● ● Table 6.
Working conditions.
-
Case E1 (left exit) E2 (right exit) E3 (middle exit) OPS 1 0.944 0.852 0.759 0.093 2 0.609 0.609 0.797 0.341 3 0.694 0.806 0.887 0.073 4 0.575 0.613 0.925 0.356 5 0.931 0.778 0.917 0.09 6 0.686 0.64 0.93 0.297 7 0.856 0.955 0.919 0.072 8 0.529 0.616 0.971 0.395 9 0.828 0.963 0.888 0.112 10 0.539 0.635 0.976 0.386 11 0.539 0.635 0.976 0.111 12 0.621 0.627 0.977 0.35 13 0.974 0.959 0.627 0.189 14 0.73 0.854 0.978 0.186 15 0.679 0.847 0.984 0.211 16 0.761 0.876 0.981 0.163 17 0.973 0.987 0.813 0.087 18 0.679 0.847 0.984 0.221 Table 7.
Evacuation efficiency and OPS of each exits under different working conditions.
-
Width (m) Length (m) 10 12 14 16 18 20 5 174 s 163 s 162 s 158 s 164 s 169 s 6 179 s 166 s 161 s 158 s 166 s 160 s 7 179 s 167 s 162 s 155 s 156 s 161 s 8 156 s 157 s 159 s 153 s 150 s 159 s 9 168 s 155 s 152 s 150 s 145 s 144 s 10 165 s 162 s 154 s 162 s 142 s 150 s Table 8.
Evacuation times for different zone sizes for 20% of vulnerable populations.
-
Width (m) Length (m) 10 12 14 16 18 20 5 185 s 192 s 184 s 184 s 191 s 193 s 6 200 s 186 s 176 s 171 s 190 s 186 s 7 198 s 182 s 177 s 173 s 174 s 176 s 8 190 s 180 s 176 s 181 s 177 s 175 s 9 191 s 175 s 178 s 172 s 177 s 171 s 10 193 s 183 s 183 s 187 s 170 s 176 s Table 9.
Evacuation times for different zone sizes for 30% of vulnerable populations.
-
Width (m) Length (m) 10 12 14 16 18 20 5 215 s 215 s 209 s 204 s 200 s 212 s 6 209 s 199 s 200 s 203 s 217 s 199 s 7 207 s 208 s 212 s 193 s 204 s 199 s 8 206 s 205 s 202 s 198 s 201 s 195 s 9 212 s 204 s 202 s 198 s 196 s 203 s 10 223 s 205 s 217 s 217 s 213 s 200 s Table 10.
Evacuation times for different zone sizes for 40% of vulnerable populations.
Figures
(8)
Tables
(10)