


-
On April 18, 2023, at 12:50 a.m., a major fire accident occurred at Changfeng Hospital in Beijing (China), resulting in 29 deaths and 42 injuries. Of the 29 people who died, 26 were inpatients at Changfeng Hospital, and the average age of those who died was 71.2 years old, with the youngest being 40 years old and the oldest being 88 years old, of which 21 were over 60 years old[1]. Vulnerable groups with limited mobility accounted for most of the deaths. As the size of the elderly and disabled groups increases, understanding their behavioral patterns in emergency evacuation situations and improving their evacuation efficiency is crucial to public safety. The design of evacuation strategies for vulnerable populations and the rational planning of building facilities will play an important role in reducing casualties and improving evacuation efficiency.
The data shows that the problem of social aging is gradually highlighted, all public places will contain a certain percentage of vulnerable groups, such as the elderly, disabled, children, pregnant women, and so on. In 2006, the total number of disabled people in China accounted for 6.34% of the national population, and the proportion of disabled people in public places in China was 8%[2]. About 40% of people with disabilities often move around in public places; 60% stay in hotels; 30% work; and 50% spend money in shopping malls from time to time[3]. As the age structure of the population ages, the proportion of these vulnerable groups in the population will continue to increase.
In-depth study of the evacuation safety of disadvantaged groups is particularly important. On the one hand, it can show that society cares for vulnerable groups; on the other hand, it also reflects the ability of public place managers to cope with emergencies from the side. However, the study of evacuation dynamics for disadvantaged groups is relatively weak. Therefore, based on pedestrian evacuation dynamics research, it is necessary to carry out disadvantaged crowd evacuation simulation for the unique psychological and behavioral characteristics of vulnerable groups. It can propose an effective evacuation plan, rationally design the internal distribution of the building, and thus strengthen the emergency response capacity of public places and safeguard the lives and properties of the crowd. Using simulation software to study the evacuation of vulnerable populations can provide strong support for decision-making in related fields.
Several major simulation models are available, including the meta cellular automata model, the social force model, the multi-agent model, and the hydrodynamic model. In the social force model, the interactions between pedestrians are quantified as forces, and the motion of each pedestrian in a continuous space is controlled by a combination of forces that act as the motion of an object in Newtonian mechanics. The social force model was first proposed by Helbing & Molnár[4]. Since then, many extensions of the social force model have been developed. Helbing et al.[5] proposed a modified social force model to simulate the panic behavior of pedestrians in a crowd evacuation. Moussaïd et al.[6] extended the social force model from a cognitive science perspective. They showed that pedestrians' behavior can be determined by some simple rules. For other extended social force models in recent years, we can refer to some literature. Wang et al.[7] modified the social force model to study the evacuation of station crowds during the Spring Festival. The simulation results show that factors such as passenger flow, security check method, luggage volume, and emotional state effect evacuation time. Helbing et al.[8] proposed a method for modeling the study of particles moving on periodic strips, subject to random forces, and realizing the transition from a fluid state to a higher energy crystalline state by increasing the amount of fluctuation. Contributions are made to the development of the social force model. Helbing et al.[9] proposed a microsimulation research methodology based on a social force model for characterizing the dynamics of pedestrian behavior and conducted experimental observations and phenomenological studies to propose feasible solutions for pedestrian crowding and stampede events. Hou et al.[10] combined the improved social force model with the evacuation mechanism, analyzes the influence of the number and location of leaders on the evacuation effect, and proposes a reasonable leader-setting method in the case of multiple exits. Shao & Yang[11] proposed an extended autonomous particle model considering movable exits based on the social force model, and based on this, he proposed an effective self-organized evacuation strategy, in the simulation it was found that setting the exits at the corners was the best choice, which effectively accelerated evacuation. Ma et al.[12] proposed an evacuation simulation method based on a social force model that considered the role of leaders in evacuation. Through simulation experiments, the effects of leader ratio, and the visible range on evacuation efficiency are explored. The experimental results show that appropriate leader ratio and visible range can effectively improve the evacuation efficiency. The modification of the social force model by Lakoba et al.[13] to introduce the effect of pedestrians' memory of the location of exits is an approach that achieves properties largely consistent with the original model in simulation results and validates some of the observations.
Evacuation of vulnerable populations is of increasing concern to public administrators and researchers. Pan et al.[14] used a funnel-type bottleneck experiment to study the effects of bottleneck shape and the proportion of wheelchair users on crowd dynamics, which is important for guiding the evacuation of pedestrians through bottlenecks by wheelchair users. Wu et al.[15] proposed the behavioral heterogeneity model (BHSFM) based on the Social Force Model (SFM), which reveals the heterogeneous characteristics of social force from the perspective of individual behavior, provides a general mathematical framework for heterogeneity, and forms a more reasonable and refined evacuation process. In this model, physical and psychological coefficients are respectively introduced to quantify the physical and psychological attributes of pedestrians. These two coefficients can influence the self-driving force by changing the desired speed, thus characterizing the heterogeneity of pedestrians more realistically[16]. This model is applied to simulate the evacuation process of non-disabled, visually disabled, hearing disabled, and physically disabled pedestrians. Numerical simulation results show that the model better realizes the mixed crowd evacuation in a library scenario and reproduces the escape actions of pedestrians with multiple types of disabilities[17]. Setting up dedicated exits is an important method to help vulnerable groups evacuate, Liu[18] investigated the effect of dedicated exits on pedestrian evacuation. A simple room model with two exits was used to study the effect of dedicated exit width and location on the evacuation of heterogeneous pedestrians, which provided theoretical guidance for the study of heterogeneous pedestrian evacuation strategies. However, only two exits were considered in this study, and the conclusions cannot be applied to scenarios with more exits; which commonly exist in many large public places. Considering that crowded places such as outpatient halls of general hospitals often have middle and two side exits, this paper investigates the effect of dedicated exits on evacuation in a typical three-exit room and explains the reasons for the change in evacuation time to provide more theoretical basis for the selection of evacuation strategies for vulnerable groups of people.
This paper is divided into the following parts: The second part carries out model construction and model comparison analysis, and analyzes the influence of dedicated exit on evacuation under the conditions of different numbers of people. The third part analyzes the effect of setting up dedicated exits on the evacuation time and speed of different groups of people and analyzes the effect of the balance of exit utilization on the evacuation time. The fourth part summarizes the study.
-
Social force refers to the combined force of the psychological force that pedestrians are subjected to in the crowd and the physical force generated by the external environment, which contains three basic forces: the self-driving force, the interaction force between pedestrians, and the force between pedestrians and obstacles. Its expression is:
$ {m}_{i}\dfrac{d{v}_{i}}{dt}={m}_{i}\dfrac{{v}_{i}^{0}\left(t\right){e}_{i}^{0}\left(t\right)-{v}_{i}\left(t\right)}{{\tau }_{i}}+\sum\nolimits _{j\left(\ne i\right)}{f}_{ij}+\sum\nolimits _{w}{f}_{iw} $ (1) Where,
$ {m}_{i} $ $ i $ $ {v}_{i} $ $ {v}_{i}^{0}\left(t\right) $ $ {v}_{i}\left(t\right) $ $ {e}_{i}^{0}\left(t\right) $ $ {\tau }_{i} $ $ {f}_{ij} $ $ {f}_{iw} $ The expression for the force between travelers is:
$ {f}_{ij}={A}_{i}exp\left[\left({r}_{ij}-{d}_{ij}\right)/{B}_{i}\right]{n}_{ij}+kg\left({r}_{ij}-{d}_{ij}\right){n}_{ij}+\kappa g({r}_{ij}-{d}_{ij})\Delta {v}_{ ji}^{t}{t}_{ij} $ (2) Where,
${A}_{i}exp\left[\left({r}_{ij}-{d}_{ij}\right)/{B}_{i}\right]{n}_{ij} $ $kg\left({r}_{ij}-{d}_{ij}\right){n}_{ij} $ $\kappa g({r}_{ij}-{d}_{ij})\Delta {v}_{ ji}^{t}{t}_{ij} $ $ {r}_{ij}=({r}_{i}+{r}_{j}) $ $ {r}_{i} $ $ {r}_{j} $ $ {d}_{ij}= || {r}_{i}- {r}_{j}||$ $ {r}_{i} $ $ {r}_{j} $ $ {n}_{ij} $ $ {n}_{ij}=( {n}_{ij}^{1},{n}_{ij}^{2} )=({r}_{i}- {r}_{j})/ {d}_{ij} $ $ g\left(x\right) $ $x < 0,\; g\left(x\right)=0$ $ x > 0,\;g\left(x\right)=x $ $ \Delta {v}_{ ji}^{t} $ $ \Delta {v}_{ ji}^{t}=({v}_{j}-{v}_{i}){t}_{ij} $ $ {t}_{ij} $ $ {A}_{i} $ $ {B}_{i} $ $ k $ $ \kappa $ The expression for the force between the pedestrian and the obstacle is:
$ {f}_{iw}={A}_{i}exp{\left[\left({r}_{i}-{d}_{iw}\right)/{B}_{i}\right]n}_{iw}+kg\left({r}_{i}-{d}_{iw}\right){n}_{iw}+\kappa g({r}_{i}-{d}_{iw})({v}_{i}\cdot {t}_{iw}){t}_{iw} $ (3) Where,
$ {d}_{iw} $ $ i $ $w, {n}_{iw}$ $ {t}_{iw} $ Table 1. Parameters and their meanings in the social force model.
Parameters Sense Value $ {\mathit{v}}_{\mathit{i}} $ Pedestrian velocity vector $ {\mathit{v}}_{\mathit{i}}^{0} $ Pedestrian desired speed $ {\mathit{e}}_{\mathit{i}}^{0} $ Direction of expected pedestrian speed $ {\mathit{v}}_{\mathit{i}} $ Actual pedestrian speed $ \mathit{m} $ Pedestrian quality 80 kg $ \mathit{r} $ pedestrian radius 0.2−0.25 m $ {\mathit{r}}_{\mathit{i}\mathit{j}} $ Sum of the radii of two pedestrians $ {\mathit{d}}_{\mathit{i}\mathit{j}} $ Distance between the centers of two pedestrians A social exclusion 2,000 N B Distance to social exclusion characteristics 0.08 m $ \mathit{\kappa } $ coefficient of sliding friction 240,000 kg/m/s k Body Compression Factor 120,000 kg/s2 $ {\mathit{\tau }}_{\mathit{i}} $ Pedestrian response time 0.5 s AnyLogic is a widely used tool for modeling and simulation of discrete, system dynamics, multi-intelligence, and hybrid systems. It provides a pedestrian library based on social force model, which can simulate the simulation of pedestrian flows.
It is a high degree of application of pedestrian traffic simulation software, which is widely used in the research of emergency evacuation. Chen et al.[19] used AnyLogic to build a 3D simulation model to find out the reasons for the imbalance in the utilization of exits, propose solutions, and balance the utilization of exits to improve the efficiency of evacuation. Zuo et al.[20] used AnyLogic to optimize the layout of shelters and evacuation routes in a high-density area under the condition of limited land resources available through cyclic evacuation simulation, evaluation, and optimization. evacuation, Xu et al.[21] used AnyLogic software to establish a system dynamics model of panic spreading, which provides certain reasonable guidance for emergency evacuations in a chemical park area.
Simulation scene setting
-
In order to study the effect of dedicated exits on the evacuation of vulnerable populations, a generalized building model with three exits was built using AnyLogic evacuation simulation software. The building model has a length of 40 m, a width of 20 m, a height of 3 m, and an exit width of 2 m. Normal and vulnerable populations are set to be randomly distributed in the building, pedestrian positions are initialized randomly and remain unchanged in each simulation, the green agent represents the vulnerable population and the red agent represents the normal population, as shown in Fig. 1. Often we want to use a normal exit as a dedicated exit instead of creating a new dedicated exit, this setup is more common in reality. Therefore, in this paper, there are three cases: no dedicated exit, middle exit as dedicated exit, and side exit as dedicated exit. The dedicated exit can only be used by vulnerable people, while the other two ordinary exits are accessible to all. Vulnerable pedestrians have the right to use each exit freely while normal pedestrians can only use the ordinary exit.
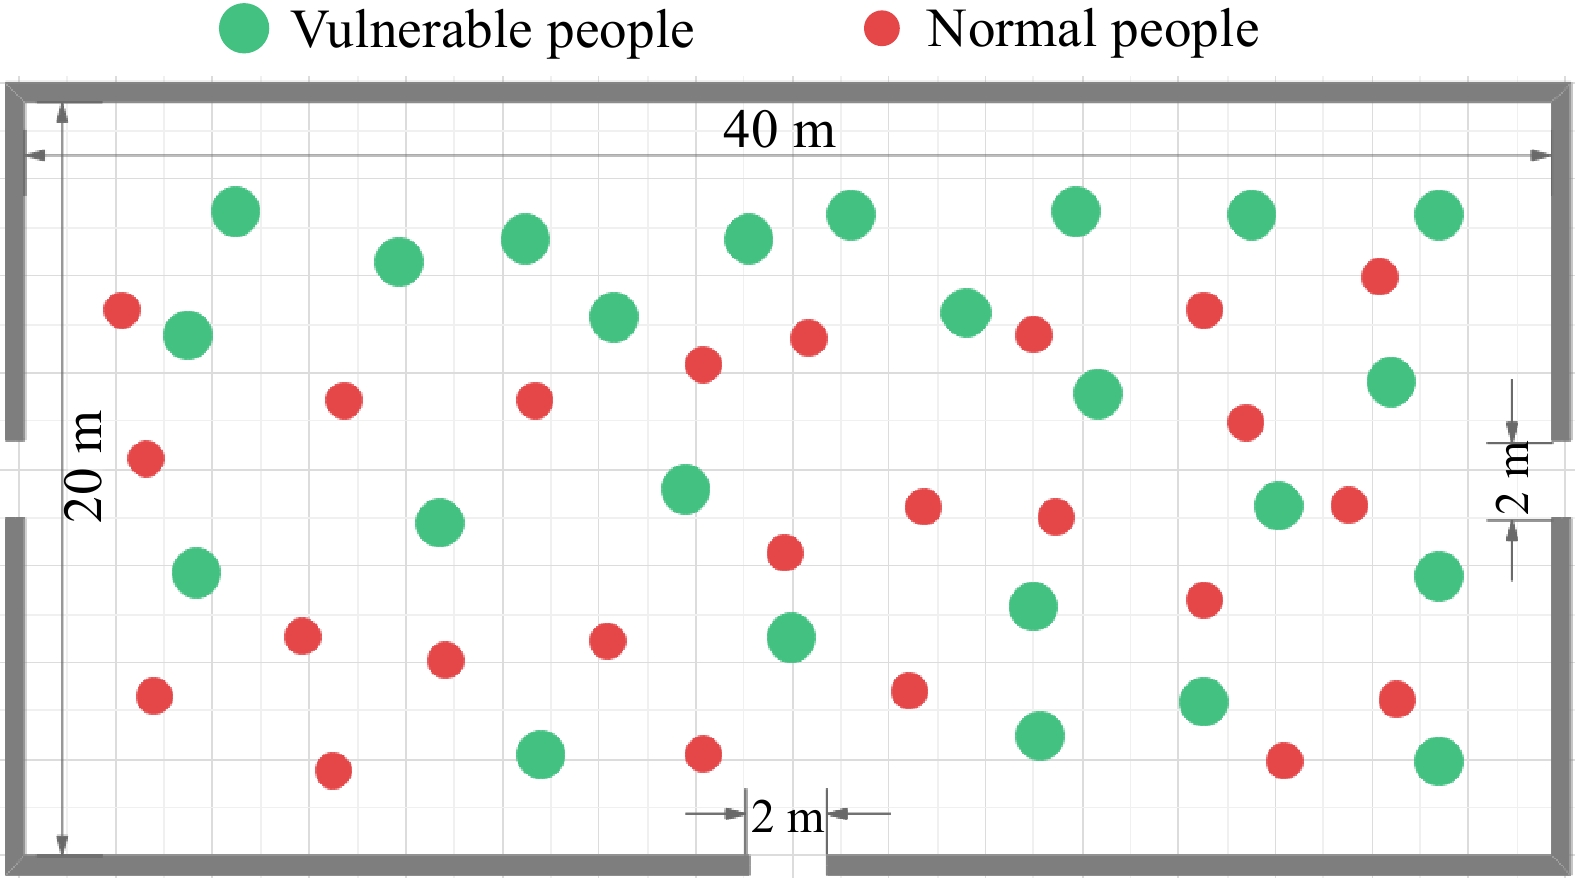
Figure 1.
Schematic diagram of the simulated scene.
Personnel parameterization
-
The composition of the people in this simulation room is divided into two categories: normal population, vulnerable population.
Vulnerable populations are defined in this article as people with limited mobility, such as the disabled, the elderly. Based on reviewing a large amount of relevant data, this paper sets the evacuation speed according to the walking speed of evacuated people with different characteristics in emergency situations. The average speed of evacuation of normal people on a horizontal ground is about 1.4 m/s[22]. Vulnerable populations evacuate at about 0.80 m/s when unassisted and 0.57 m/s when assisted[2]. In this paper, we set the range of evacuation speed for normal people as 1.3−1.5 m/s, and the range of evacuation speed for vulnerable people as 0.6−0.8 m/s. In this paper, the diameter of normal people is set to be randomly distributed in the range of (0.4 m, 0.5 m). Vulnerable populations use wheelchairs with a diameter of about 0.8−0.9 m[14]. When vulnerable people are assisted, the diameter is also twice as large as that of normal people. Therefore, the diameter of vulnerable people is set to be randomly distributed in the range of (0.8 m, 0.9 m).
In this paper, we consider the impact of the number of evacuees and the proportion of vulnerable populations on evacuation. Fruin’s Service Level is a methodology used to assess the level of service of pedestrian walkable facilities by assigning a level of service of six grades, ranging from A (best) to F (worst), with each grade having a corresponding pedestrian density, as shown in Table 2[23]. In order to investigate the effect of dedicated exits on evacuation under different personnel densities, 200, 400 and 600 people were set up in the simulation to be randomly distributed in the room, i.e., the average density of personnel was 0.25, 0.5, and 0.75 p/m2, respectively, and there was a significant difference between the three densities, which corresponded to levels A, C, and D, respectively, in the rating of service level. In this paper, these three densities are considered as low, moderately, and highly congested.
Table 2. Level of service value.
Pedestrian density (p/m2) Level of servive 0−0.31 A 0.31−0.43 B 0.43−0.72 C 0.72−1.08 D 1.08−2.17 E 2.17−5.4 F -
The initial positions of pedestrians are randomly distributed in the room. In this section, the average evacuation time and maximum evacuation time of each group are the focus. Taking vulnerable groups as an example, the average evacuation time and maximum evacuation time of vulnerable groups are respectively defined as the average evacuation time of all vulnerable groups and the evacuation time of the last vulnerable pedestrian to complete evacuation in each simulation. In this paper, no dedicated exit is regarded as Option 1, middle exit as the dedicated exit is regarded as Option 2, and side exit as the dedicated exit is regarded as Option 3. Ten sets of data under each operating condition were collected, the average of the maximum evacuation time was calculated, and the set of data whose maximum evacuation time was closest to the average was selected.
Comparative analysis of evacuation time
-
This paper compares the maximum evacuation time and average evacuation time of evacuated populations under three different options with different total evacuation numbers and different vulnerable population percentages. A previous study[18] on the effect of dedicated exits in rooms with two exits found that setting up dedicated exits could not reduce the maximum evacuation time and would increase the average evacuation time for normal crowds and decrease the average evacuation time for vulnerable crowds. This paper will compare with the conclusions drawn by the previous person.
Maximum evacuation time
-
Table 3 shows the maximum evacuation time under each working condition. From Table 3, it is known that the maximum evacuation time increases with the increase of the total number of evacuees and increases with the increase of the percentage of vulnerable populations. When the total number of evacuees and the percentage of vulnerable populations are certain, comparing the maximum evacuation time under the three options, it is found that: the maximum evacuation time of Option 3 is always the longest, which indicates that setting the side exit as a dedicated exit always inhibits evacuation; sometimes the maximum evacuation time of Option 1 is the shortest, and sometimes the maximum evacuation time of Option 2 is the shortest, which indicates that setting the middle exit as a dedicated exit helps evacuation in some cases. The evacuees in the room choose the nearest exit for evacuation. When the side exit is set as a dedicated exit since evacuation is carried out in a rectangular room, only a small number of vulnerable people close to the dedicated side exit choose the dedicated exit for evacuation and the majority of evacuees still choose the other two ordinary exits, which results in a low utilization rate of the dedicated exit and greatly increases the evacuation time. When a middle exit is designated as a dedicated exit, there are more vulnerable populations close to the dedicated exit, and therefore the dedicated exit is highly utilized, which can improve evacuation efficiency in many cases.
Table 3. Maximum evacuation time.
Percentage of
vulnerable populationsMaximum evacuation time 200 people 400 people 600 people Option 1 Option 2 Option 3 Option 1 Option 2 Option 3 Option 1 Option 2 Option 3 10% 40.3 s 41.4 s 61.8 s 87.3 s 91.8 s 127.5 s 127.5 s 155.1 s 210.3 s 20% 48.9 s 54.3 s 69.6 s 117.3 s 97.2 s 152.1 s 162.3 s 180.6 s 242.1 s 30% 69.9 s 54.9 s 84.0 s 138.9 s 111.3 s 184.8 s 185.7 s 193.5 s 245.4 s 40% 80.7 s 62.7 s 97.2 s 167.1 s 134.4 s 188.7 s 209.4 s 225.0 s 258.9 s 50% 87 s 72.9 s 98.4 s 177.3 s 153 s 216.3 s 249.3 s 235.9 s 286.8 s From Fig. 2, it is known that when the total number of evacuees is 200, setting the middle exit as a dedicated exit is favorable for evacuation when the proportion of vulnerable people is more than 20%; when the total number of evacuees is 400, setting the middle exit as a dedicated exit is favorable for evacuation when the proportion of vulnerable people is more than 10%; when the total number of evacuees is 600, setting the middle exit as a dedicated exit is favorable for evacuation when the proportion of vulnerable people is 50%.
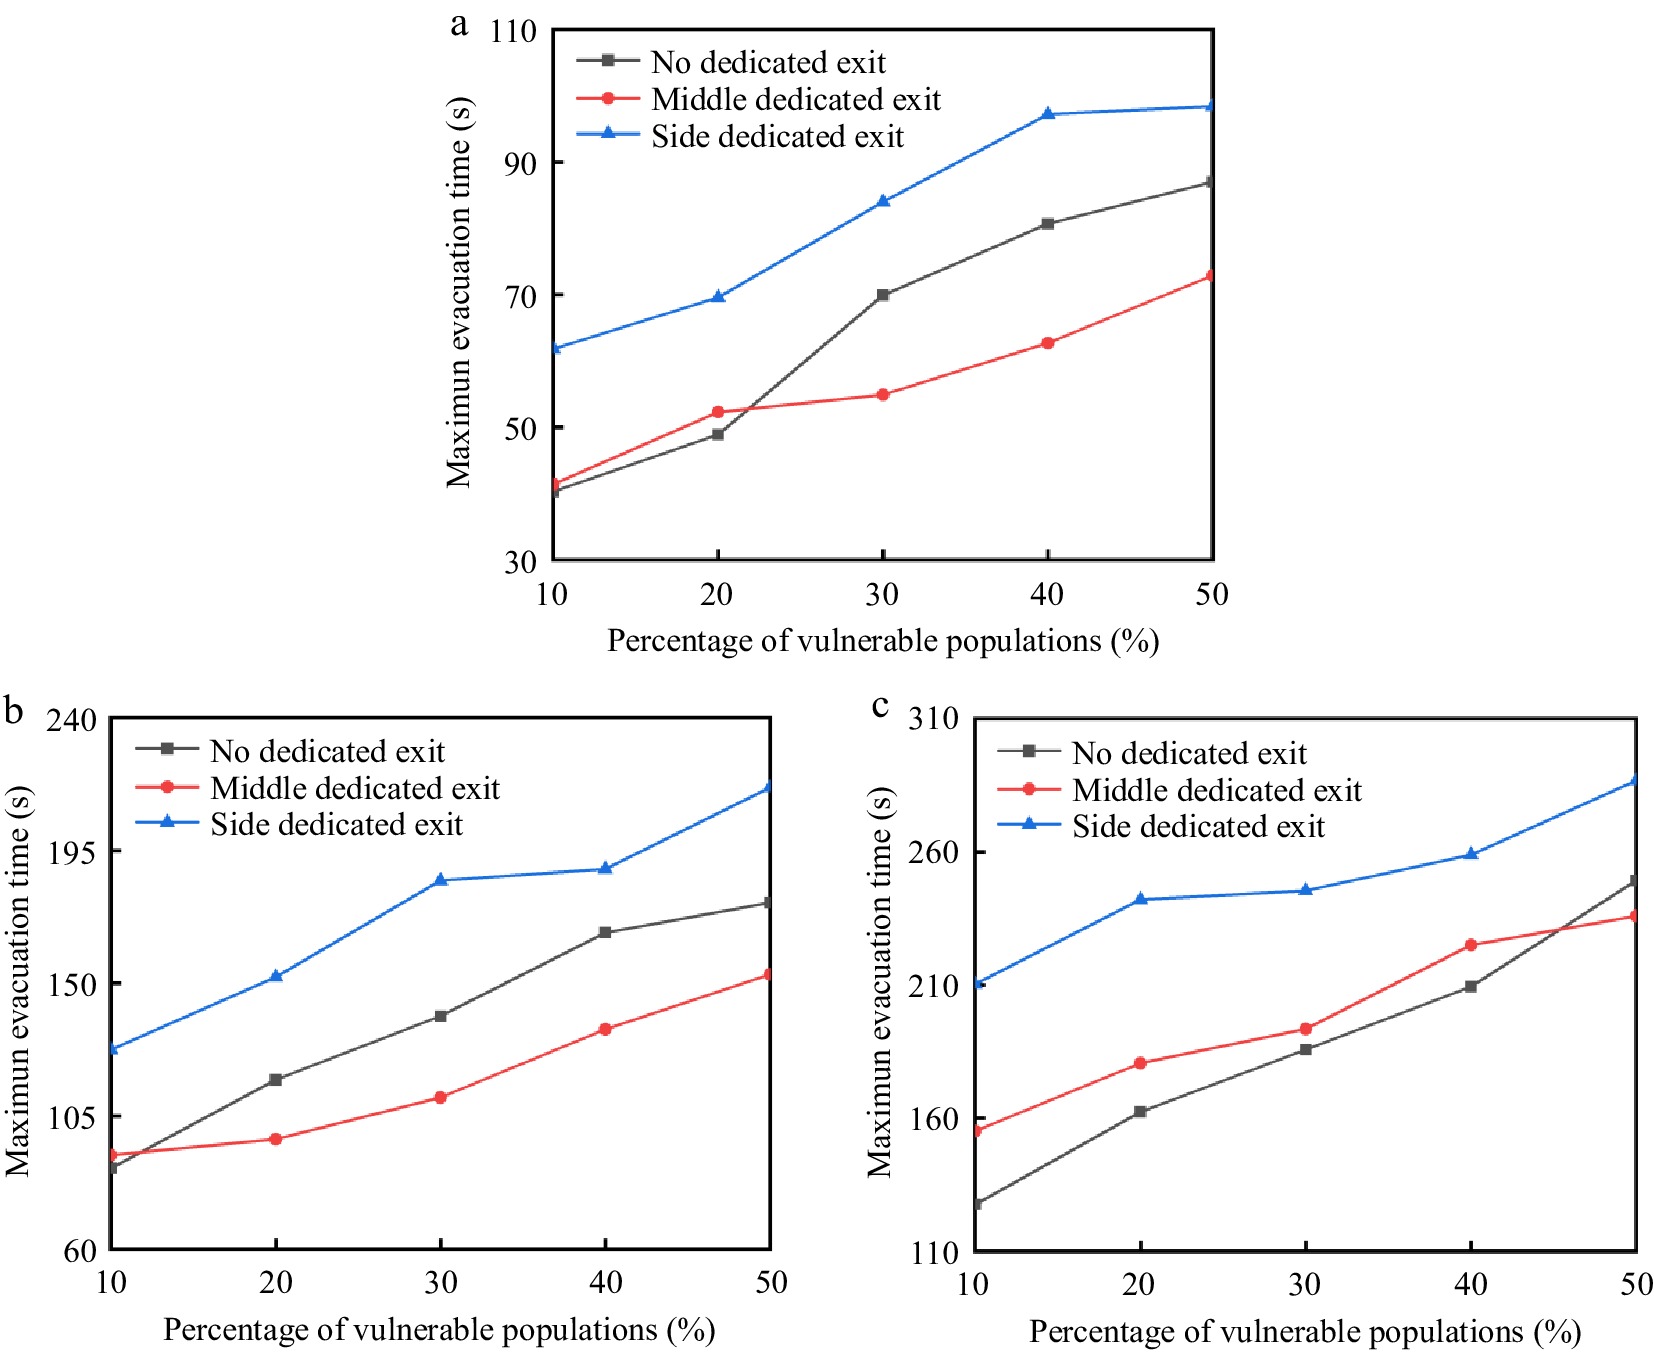
Figure 2.
Maximum evacuation time: (a) 200 people, (b) 400 people, (c) 600 people.
The reason for this is that the room is less densely populated when the number of evacuees is 200, and congestion is less likely to occur in the room. When the proportion of vulnerable groups of people is relatively small, the use of dedicated exits can not play a role in alleviating the effect of congestion. This will result in under-utilization of the dedicated exit and over-utilization of the other two ordinary exits, resulting in congestion, so the use of the dedicated exit at this time will instead increase the evacuation time. As the percentage of vulnerable populations increases, the number of vulnerable populations increases and the number of normal populations decreases, setting up a dedicated exit can help vulnerable people to quickly evacuate from the dedicated exit. Because of the large number of vulnerable populations, the dedicated exits are better utilized and there is no excessive imbalance in the evacuation of the three exits. At this time the use of dedicated exits can not only balance the utilization rate of the three exits but also can effectively relieve the vulnerable people congested in the various exits, therefore, the evacuation time is reduced.
As the number of evacuees grows from 200 to 400, the number of vulnerable populations increases, and the evacuation process is more likely to become congested, so there is a need to help vulnerable populations evacuate in more cases.
The density of people in the room at an evacuation number of 600 is high and the room is prone to congestion. Large crowds of vulnerable people flock to dedicated exits, causing large numbers of people to rush into each other and adding to the congestion in the room. When there is no dedicated exit, the crowd will choose the nearest exit to evacuate, so there will not be a large number of people rushing against each other. Therefore, if the total number of people is too large and the room is overcrowded, setting up a dedicated exit is not conducive to evacuation in most cases.
Based on the above analysis, it can be seen that when the number of evacuees is 200 (low crowd density), the dedicated exits only play a negative role when vulnerable populations account for 10% and 20% of the population, and the evacuation time increases by only 1.1 and 3.4 s, respectively; when the number of evacuees is 400 (moderate crowd density), the dedicated exits only play a negative role when vulnerable populations account for 10% of the population, and the evacuation time increases by 4.5 s. So basically, it can be concluded that it is favorable to set up dedicated exits when the number of evacuees is 200 and 400. When the number of evacuees is 600 (high crowd density), the dedicated exits only play a positive role when the percentage of vulnerable people is 50%. However, the percentage of vulnerable people in most public places is not greater than 50%, so it can be assumed that when the crowd density is high, the installation of dedicated exits is not conducive to evacuation. Therefore, the provision of dedicated exits should take into account the crowd density in the room; dedicated exits should be provided when the crowd density is low, while dedicated exits should not be provided when the crowd density is high.
Average evacuation time
-
In this paper, we calculate the average evacuation time of two kinds of crowds by calculating the rate of change to illustrate the effect of installing a middle dedicated exit on the evacuation of two types of crowds. The formula for the rate of change in average evacuation time is as follows:
$ \delta T=\dfrac{T1-T2}{T1} $ (4) Where,
$ \delta T $ Tables 4 & 5 illustrate the positive and negative values of
$ \delta $ Table 4. Average evacuation time for normal populations.
Percentage of
vulnerable populationsAverage evacuation time for normal populationa 200 people 400 people 600 people Option 1 Option 2 δT Option 1 Option 2 T Option 1 Option 2 T 10% 14.1 s 17.8 s −26.2% 23.4 s 38.1 s −74.4% 39.1 s 60.8 s −55.5% 20% 14.1 s 20.8 s −47.5% 25.5 s 35.4 s −38.8% 49.2 s 74.4 s −51.2% 30% 14.3 s 20.1 s −40.6% 27.1 s 35.6 s −31.4% 46.9 s 83.7 s −79.5% 40% 17.6 s 20.5 s −16.5% 28.9 s 42.7 s −47.8% 60.4 s 94.6 s −56.6% 50% 18.8 s 21.7 s −15.4% 32.1 s 42.7 s −33.0% 59.5 s 95.1 s −59.8% Table 5. Average evacuation time for vulnerable populations.
Percentage of
vulnerable populationsAverage evacuation time for vulnerable populations 200 people 400 people 600 people Option 1 Option 2 δT Option 1 Option 2 δT Option 1 Option 2 δT 10% 24.7 s 20.6 s 16.6% 52.6 s 44.7 s 15.0% 76.7 s 63.6 s 17.1% 20% 27.4 s 24.5 s 10.6% 62.7 s 52.8 s 15.8% 87.1 s 72.8 s 16.4% 30% 32.7 s 31.4 s 4.0% 68.1 s 61.2 s 10.1% 95.1 s 91.8 s 3.5% 40% 38.6 s 33.2 s 14.0% 76.0 s 70.7 s 7.0% 108.6 s 99.2 s 8.7% 50% 41.3 s 39.0 s 5.6% 81.4 s 70.7 s 13.1% 117.3 s 108.5 s 7.5% Comparative analysis of evacuation speed
-
This paper compares the evacuation speed of normal populations and vulnerable populations under different options. In the simulation, the evacuation characteristics of the evacuees are the same as those presented in Fig. 3, regardless of the percentage of vulnerable populations. When there is no dedicated exit, most of the vulnerable people are blocked behind the normal people and the evacuation speed of vulnerable people is much lower than that of the normal people. When there is a dedicated exit, only a small number of vulnerable populations will be blocked at the end, and most vulnerable populations can complete the evacuation through the dedicated exit, which indicates that the evacuation pattern of the crowd is similar under different vulnerable population ratios, and the evacuation speed of different populations under a vulnerable population ratio can reflect the effect of setting up a dedicated exit on the evacuation speed of the two types of populations. Therefore, the percentage of vulnerable populations in each of the three cases selected in this paper is 40%, and the total number of people is 200, 400, and 600, respectively.
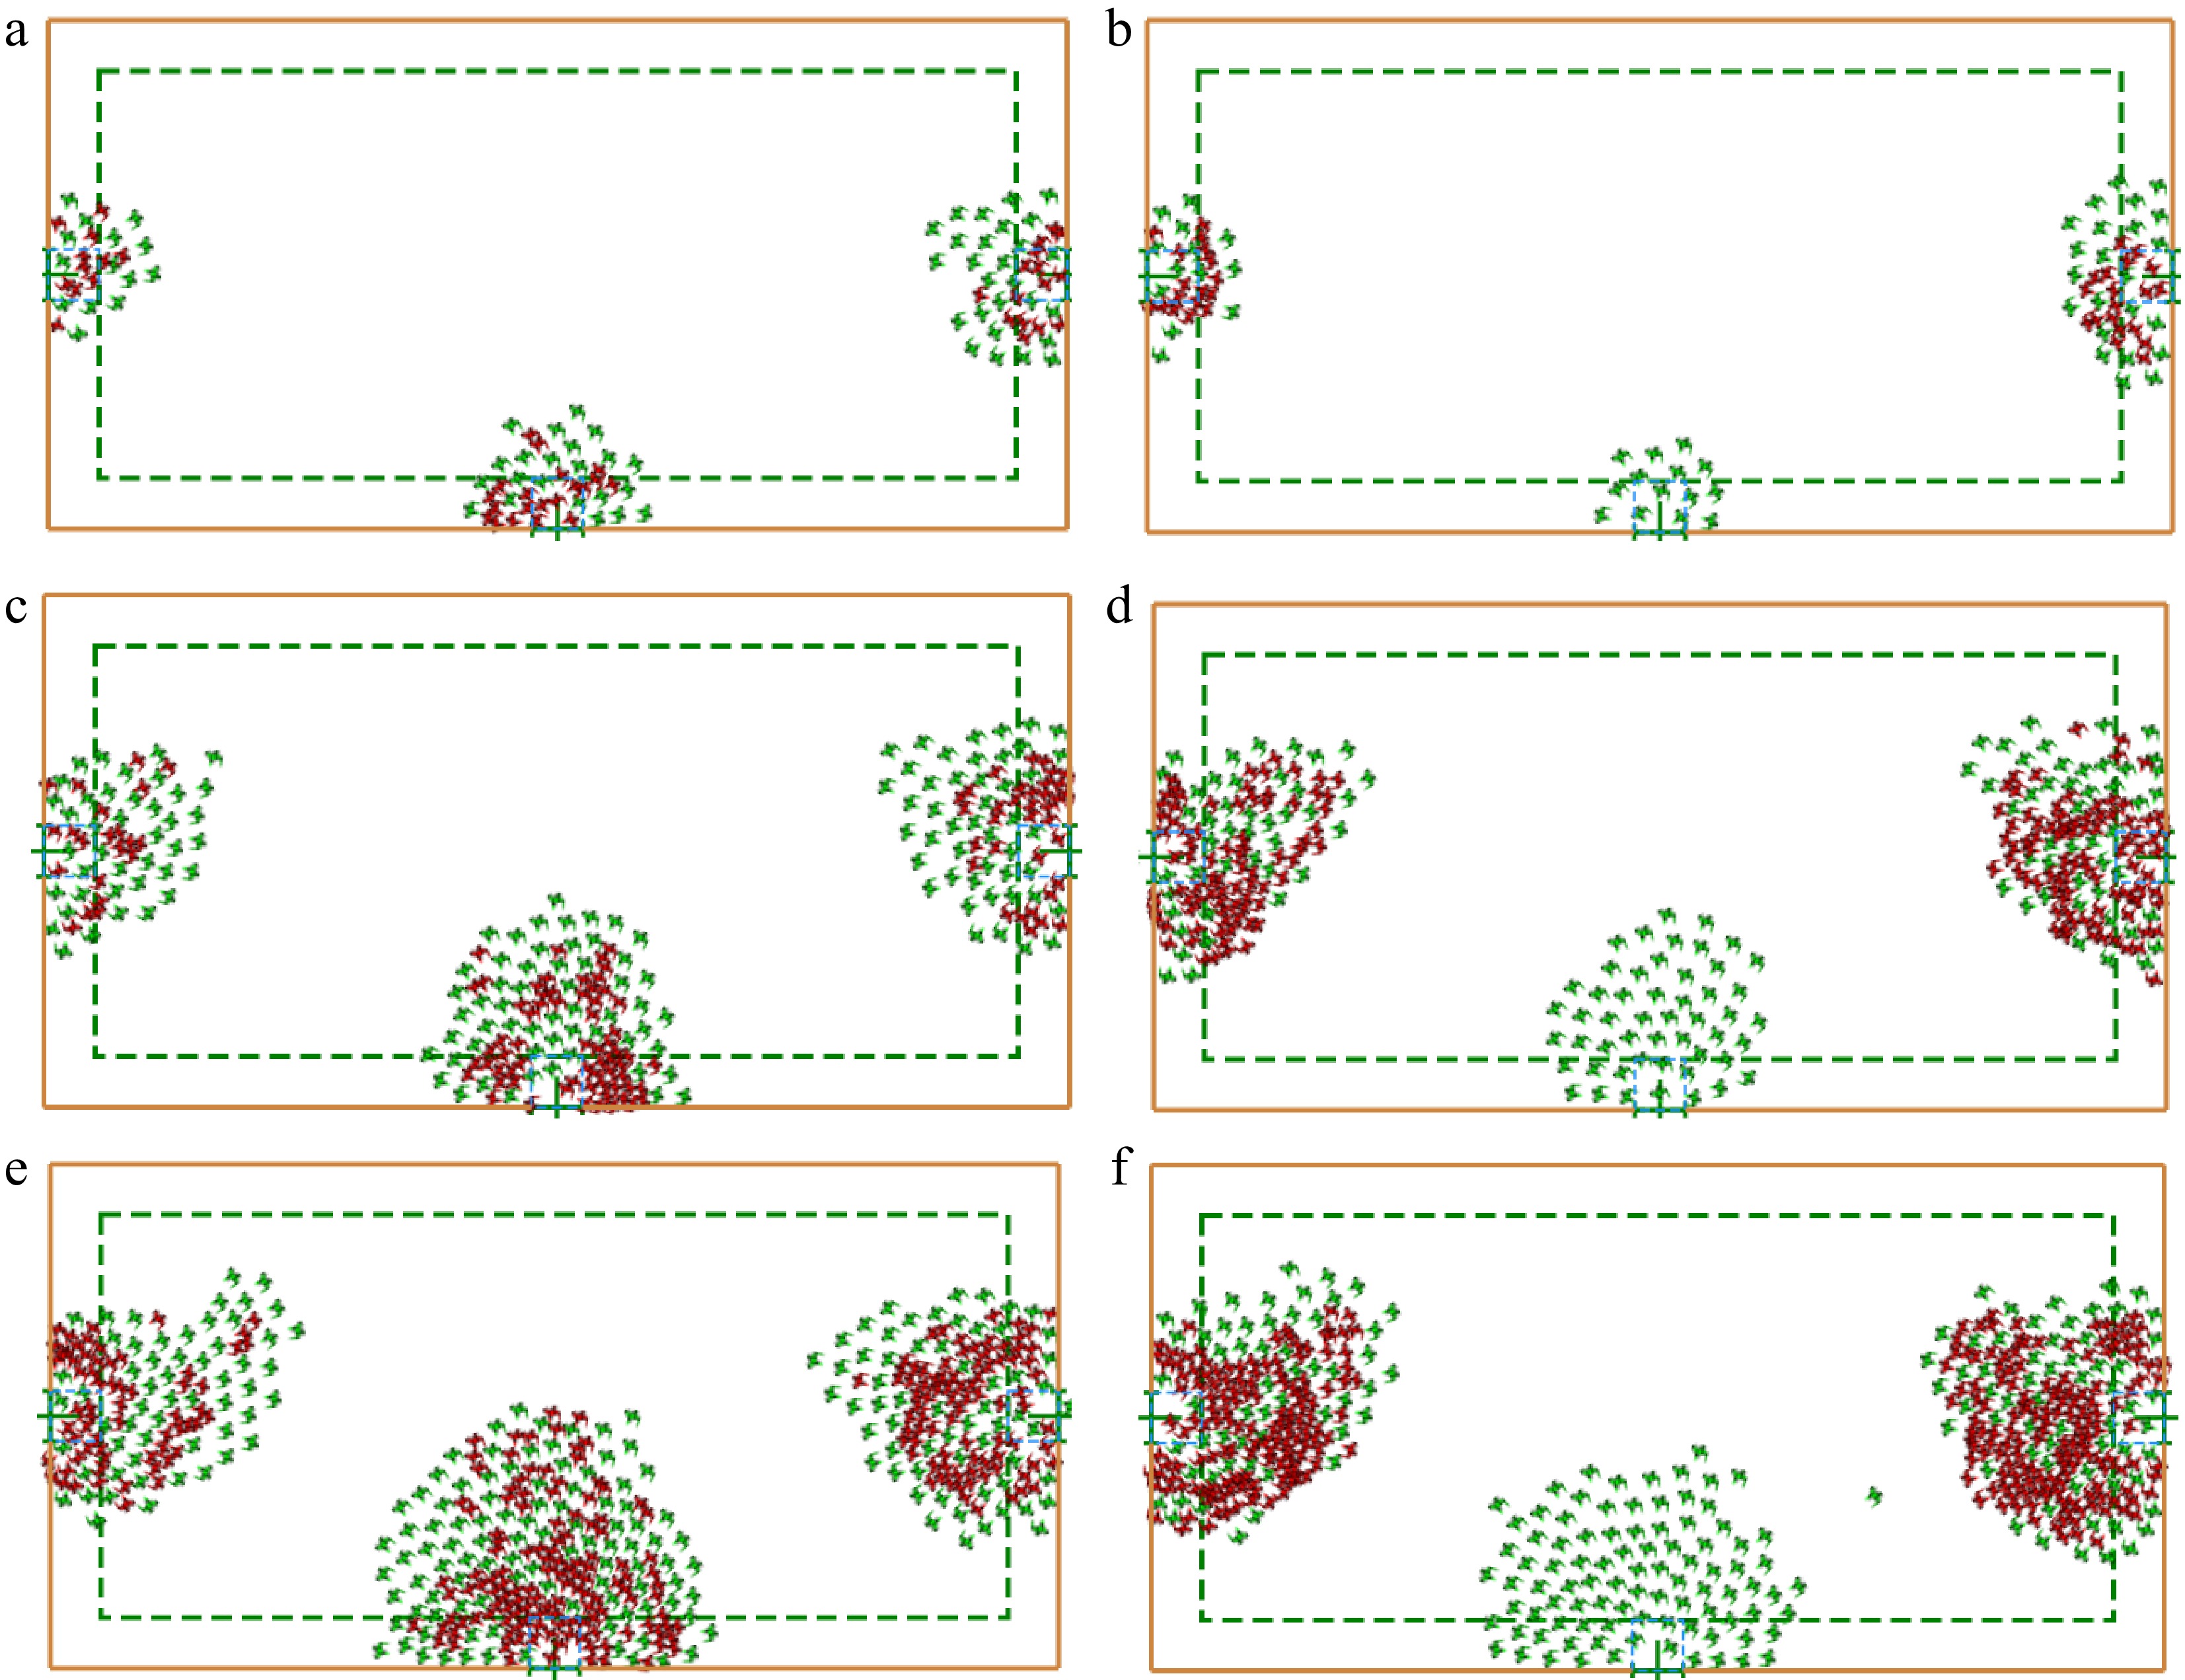
Figure 3.
Simulation chart: (a) 200 people without dedicated exits, (b) 200 people with dedicated exits, (c) 400 people without dedicated exits, (d) 400 people with dedicated exits, (e) 600 people without dedicated exits, (f) 600 people with dedicated exits.
From Fig. 4a & b, it can be seen that when the total number of evacuees is 200, the difference in evacuation completion time between normal and vulnerable populations is reduced from 38 s to 16 s, and the number of vulnerable people left to evacuate when the normal population completed evacuation was reduced from 34 to 19. Therefore, the installation of a middle dedicated exit is conducive to the evacuation of vulnerable populations. The slopes of the graphs can indicate the evacuation speeds of the two populations. Also, it is found that there is a big gap between the evacuation speeds of normal and vulnerable populations when there is no dedicated exit, and the installation of middle dedicated exits can narrow the gap between the two and make the evacuation speeds of the two groups of people more balanced.
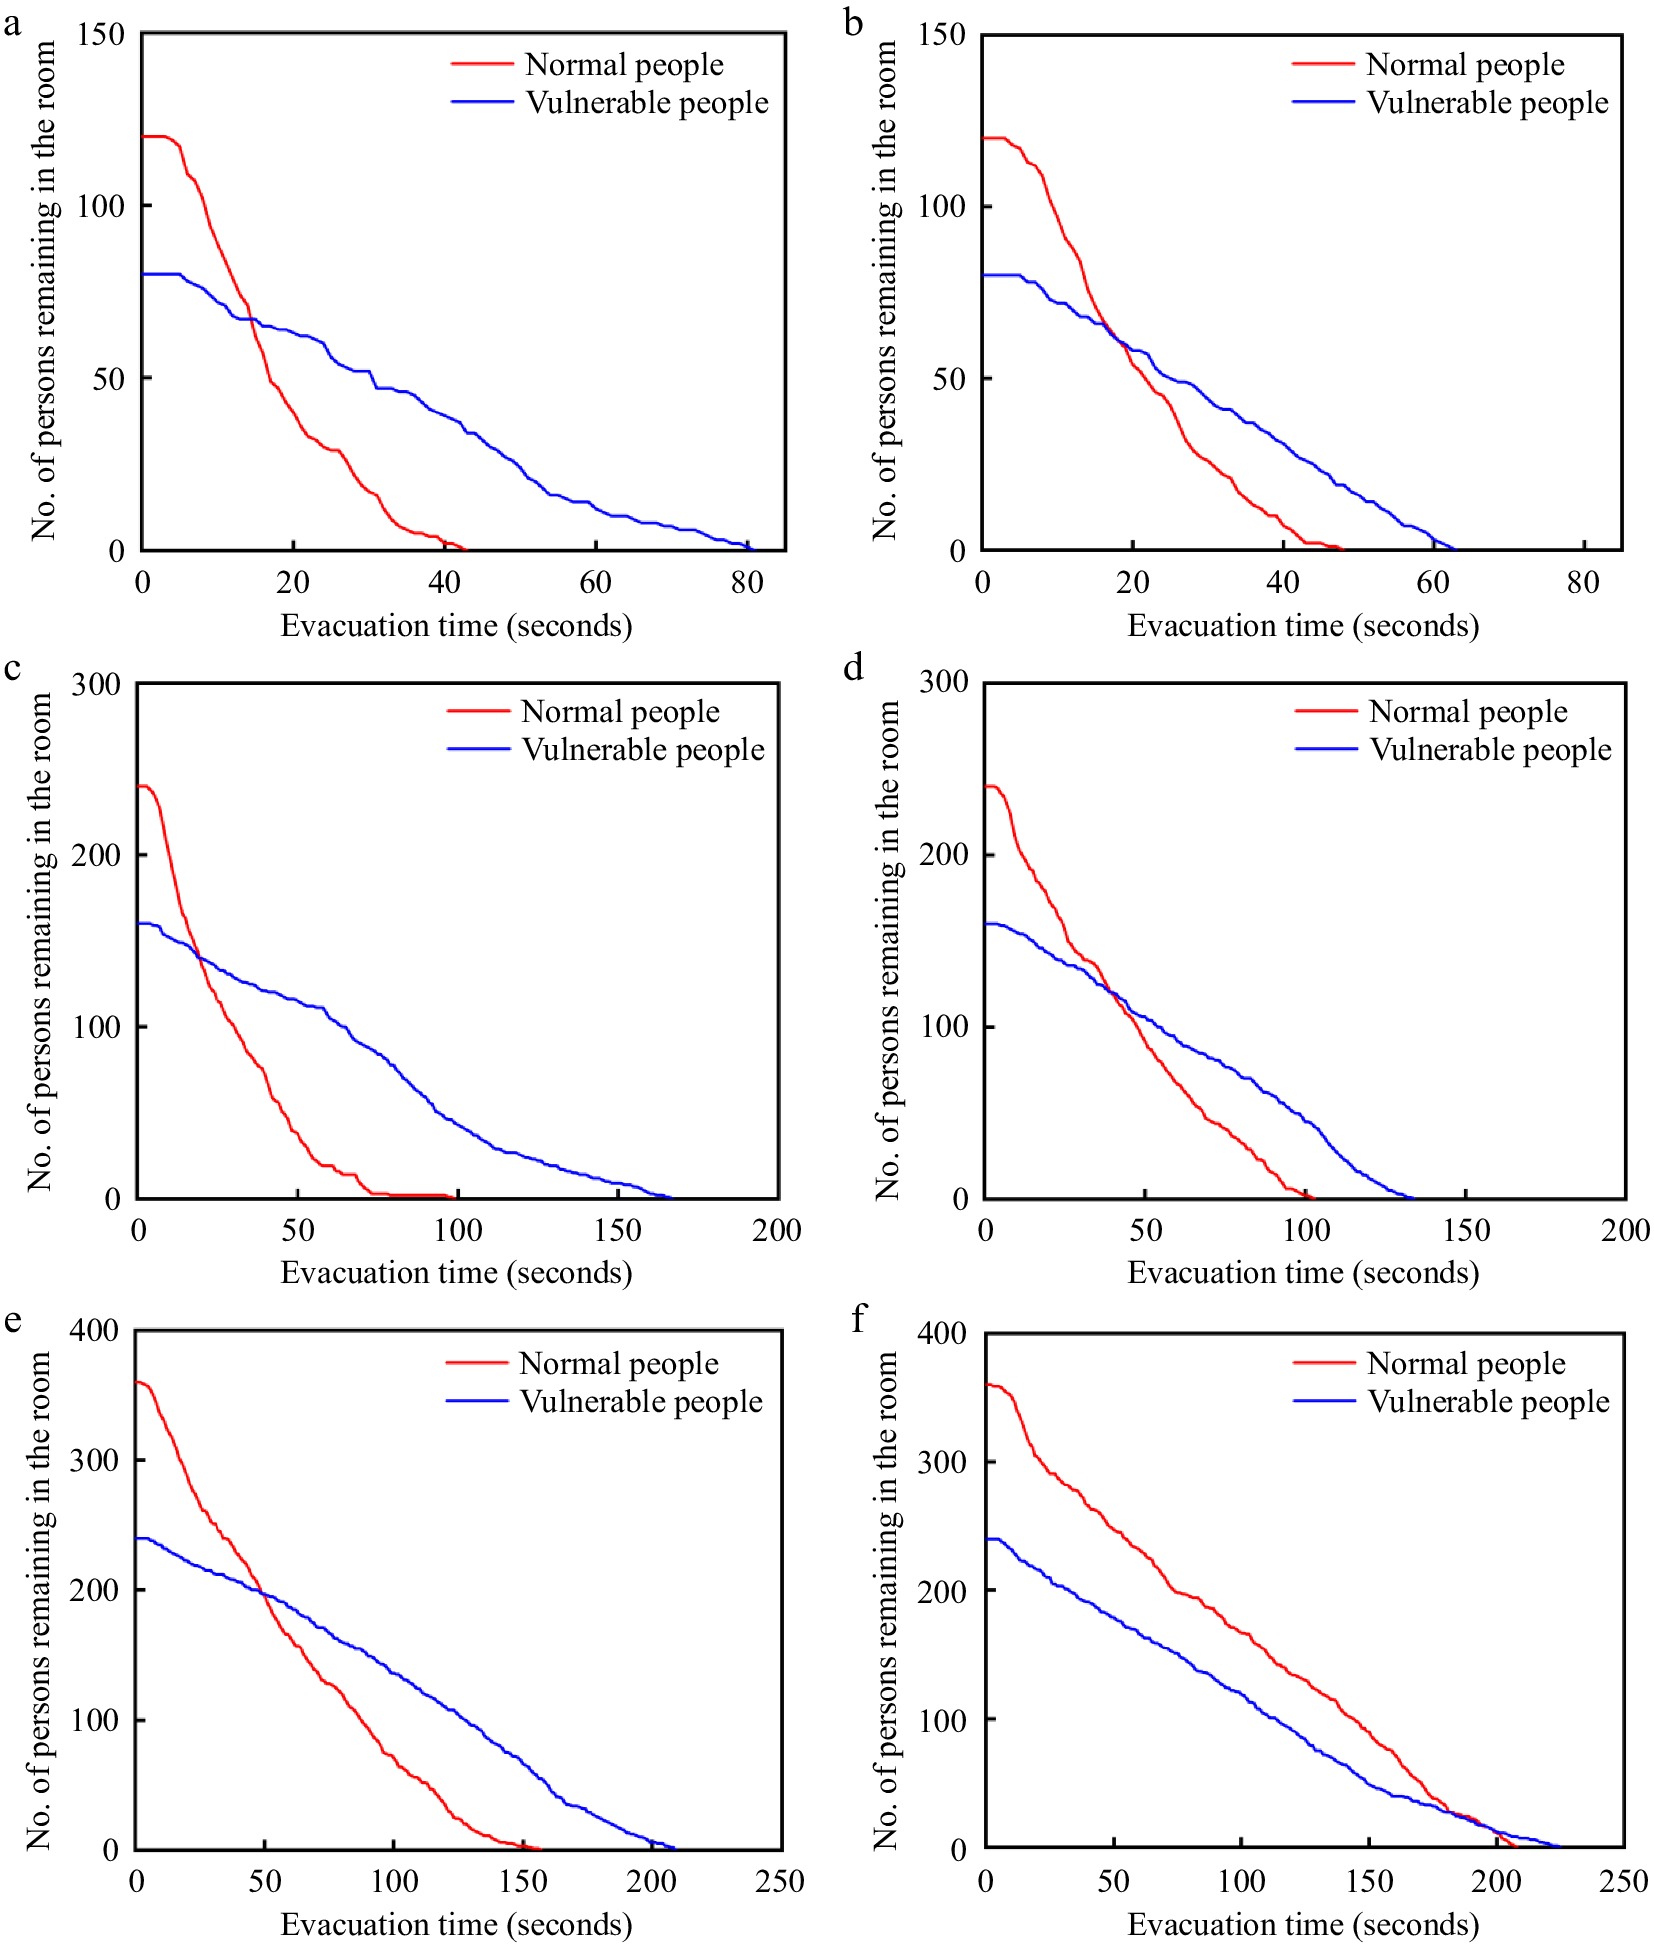
Figure 4.
Change in the number of people remaining in the room over time: (a) 200 people without dedicated exits, (b) 200 people with dedicated exits, (c) 400 people without dedicated exits, (d) 400 people with dedicated exits, (e) 600 people without dedicated exits, (f) 600 people with dedicated exits.
The specific reasons can also be observed and discovered during the simulation process, as shown in Fig. 3a & b, the green agent in the figures represent vulnerable populations and the red agent represents normal populations. When the number of evacuees is 200 there is a lot of space left in the room. The normal crowd can quickly overtake the vulnerable crowd towards the exits, resulting in the normal crowd being congested at the exits first. Most of the vulnerable people can only crowd behind the normal crowd, which is bad for evacuating vulnerable populations. The installation of middle dedicated exits can alleviate the pressure of evacuation of vulnerable groups to a certain extent.
Similarly, comparing Fig. 4c & d, it can also prove that the installation of a middle dedicated exit is conducive to the evacuation of vulnerable populations and can make the evacuation speeds of the two populations more balanced. When the total number of people is 400, the remaining space in the room is limited, and part of the normal crowd can quickly overtake the vulnerable crowd to the exit. However, due to the congestion, some normal people were blocked by vulnerable people, vulnerable populations cover a large area and are difficult to overtake once they have surged to the exit, so it was observed that it took 51 s for the last eight normal populations to complete their evacuation. Overall, vulnerable populations are still at a great disadvantage during evacuation, and the installation of middle dedicated exits can alleviate the evacuation pressure of vulnerable populations to a certain extent.
Comparing Fig. 4e & f, it can be seen that when there is no dedicated exit, the evacuation speed of normal people and vulnerable people is close to each other, and the difference is not big. The installation of middle dedicated exits can further reduce the gap between the two evacuation speeds. However, when the total number of people is 600, there is very little space left in the room and it is very crowded. Most of the normal people in the center are congested a long way from the exits and it is difficult to overtake the vulnerable people. So it is found that a lot of normal people would be congested behind the vulnerable people, which is why the evacuation speeds of the normal people and the vulnerable people in this case are very close to each other. Setting up middle dedicated exits can relieve the evacuation pressure on vulnerable groups to a certain extent, but the relief is not as effective as when the total number of evacuees is small.
Shimura et al.[24] found experimentally that elderly people with slower speeds were perceived as mobility barriers for others and acted as brief bottlenecks during overtaking. Pan et al.[14] found that the presence of wheelchairs exacerbates congestion at exits, and that congestion is more pronounced with a greater proportion of wheelchairs. The evacuation characteristics exhibited in the simulations of this paper are consistent with those found in previous related experiments, proving the rationality of the model.
Comparative analysis of export balance
-
Simulation results show that dedicated exits do not reduce the maximum evacuation time in some cases. When the percentage of vulnerable populations is low, it was observed in the simulation that setting up dedicated exits would result in an unbalanced utilization of exits, which is not in line with the normal evacuation strategy. In the case of a large number of vulnerable populations, it is not possible to clearly observe a more balanced utilization of exits with and without dedicated exits. Therefore, this section provides quantitative comparisons of export balance when vulnerable populations are more heavily represented (30%, 40%, 50%), the specific working conditions are shown in Table 6 .
Table 6. Working conditions.
Working
conditionDedicated exit location Number of evacuees Percentage of vulnerable populations Middle Side No 200 people 400 people 600 people 30% 40% 50% 1 ● ● ● 2 ● ● ● 3 ● ● ● 4 ● ● ● 5 ● ● ● 6 ● ● ● 7 ● ● ● 8 ● ● ● 9 ● ● ● 10 ● ● ● 11 ● ● ● 12 ● ● ● 13 ● ● ● 14 ● ● ● 15 ● ● ● 16 ● ● ● 17 ● ● ● 18 ● ● ● In some cases the utilization of the dedicated exit is low. After the completion of the evacuation at the dedicated exit, a large number of evacuees are still waiting to be evacuated at the other two general exits. Maybe this is the reason why a dedicated exit cannot in some cases improve the evacuation efficiency, so this paper verifies the idea by calculating the evacuation efficiency of each exit. The formula for the evacuation efficiency of each exit is as follows:
$ {E}_{i}=\dfrac{TF{T}_{i}}{TET} $ (5) Where, Ei is the evacuation efficiency of exit i, ranging from 0 to 1, larger values indicate higher export utilization; TET is the time used for the successful evacuation of all pedestrians, TFTi is the time used for the evacuation of exit i from the beginning of the evacuation of the first person to the end of the evacuation of the last person. OPS measures the balance of the entire evacuation process and the OPS is calculated using the formula[25] :
$ OPS=\dfrac{\sum _{i=1}^{n}TET-{EET}_{i}}{(n-1)\times TET} $ (6) Where, OPS is a building evacuation balance analysis indicator with a range of 0−1.0, when OPS = 0, it means that all exits complete evacuation at the same time, the closer the OPS value is to 0 the better the evacuation balance is and the more effective the evacuation is; n is the number of exits; EETi is the evacuation time for exit i (that is, the last person in exit i evacuation of the exit time used to the end of the exit); TET is the time taken for all pedestrians to successfully evacuate.
As shown in Table 7, the evacuation efficiency and OPS values of each exit under 18 operating conditions are compared and analyzed, the cases in Table 7 correspond to the working conditions in Table 6. It was found that when the number of evacuees and the percentage of vulnerable populations are certain, the greater the difference in evacuation efficiency between exits, the longer the evacuation time will be. It is inferred that the maximum evacuation time is related to the balance of exits.
Table 7. Evacuation efficiency and OPS of each exits under different working conditions.
Case E1 (left exit) E2 (right exit) E3 (middle exit) OPS 1 0.944 0.852 0.759 0.093 2 0.609 0.609 0.797 0.341 3 0.694 0.806 0.887 0.073 4 0.575 0.613 0.925 0.356 5 0.931 0.778 0.917 0.09 6 0.686 0.64 0.93 0.297 7 0.856 0.955 0.919 0.072 8 0.529 0.616 0.971 0.395 9 0.828 0.963 0.888 0.112 10 0.539 0.635 0.976 0.386 11 0.539 0.635 0.976 0.111 12 0.621 0.627 0.977 0.35 13 0.974 0.959 0.627 0.189 14 0.73 0.854 0.978 0.186 15 0.679 0.847 0.984 0.211 16 0.761 0.876 0.981 0.163 17 0.973 0.987 0.813 0.087 18 0.679 0.847 0.984 0.221 The OPS value reflects the balance of the evacuation of the building, the closer the OPS value is to 0 the better the evacuation balance is. To investigate the relationship between evacuation equilibrium and maximum evacuation time, the maximum evacuation time and OPS values for 18 operating conditions were plotted in a double Y-axis histogram-scatterplot, as shown in Fig. 5. The bars in the figure represent the maximum evacuation time, the red dots represent the OPS values. The number of evacuees and the percentage of vulnerable populations are the same for the two neighboring conditions (1 and 2, 3 and 4, 5 and 6, and so on). Therefore, this paper investigates the relationship between outlet equilibrium and evacuation time by comparing the maximum evacuation time and OPS values for each set of neighboring conditions. It can be found that a short maximum evacuation time corresponds to a small OPS value. It can be said that whether setting up dedicated exits can reduce the maximum evacuation time is largely determined by whether setting up dedicated exits can make the building evacuation more balanced. Guo et al.[25] conducted a study on emergency evacuation of a multi-exit auditorium and found that evacuation efficiency could be improved while optimizing the balance of exits. This is similiar to the conclusion reached in the present paper.
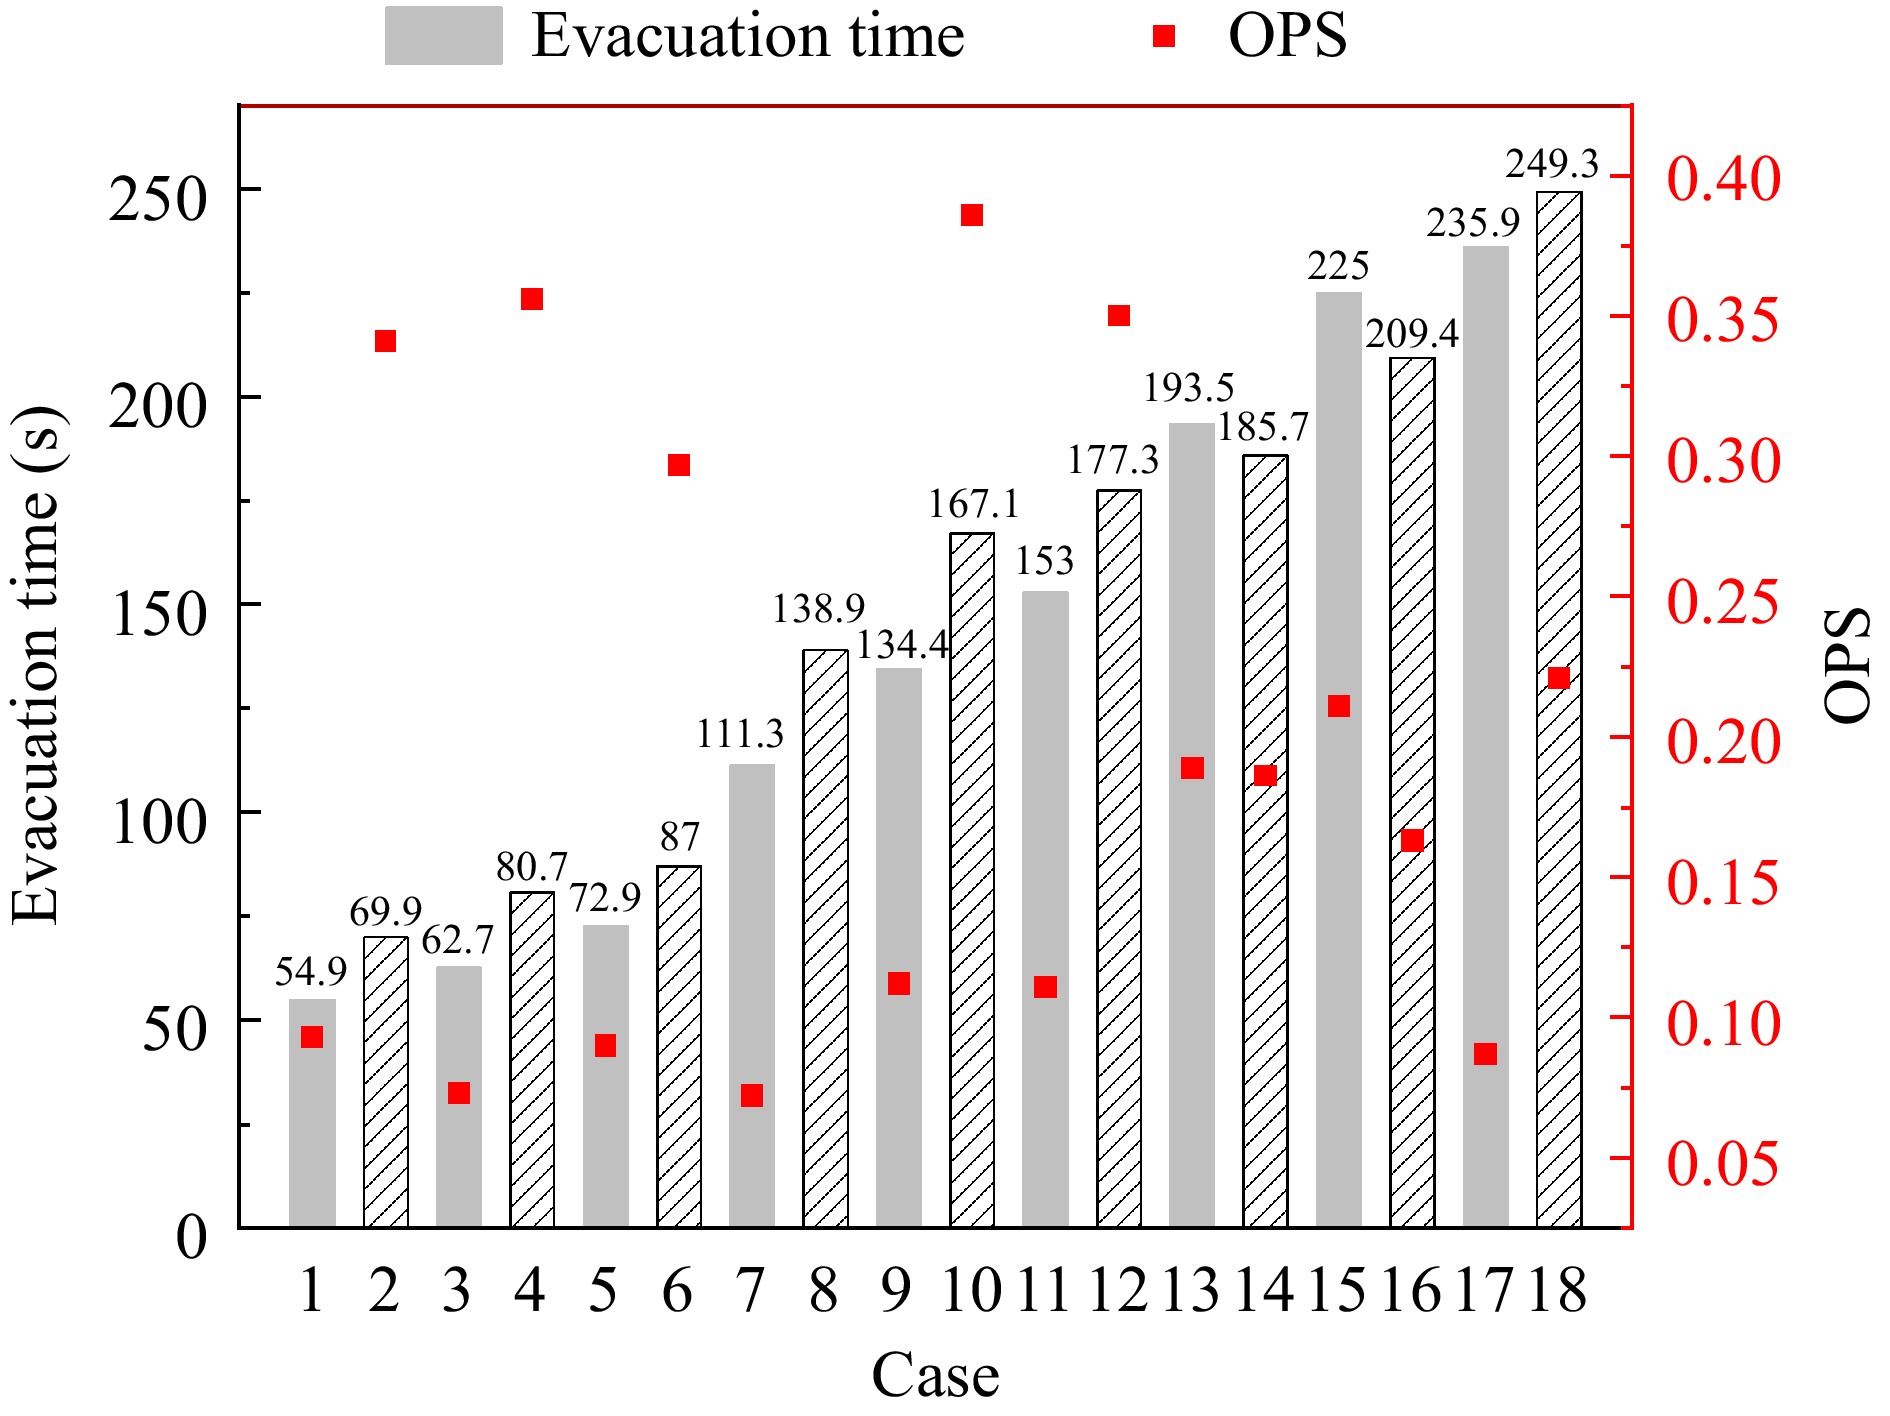
Figure 5.
Statistical graph of maximum evacuation time and OPS value for each working condition.
When the evacuation crowd is evenly distributed in the room, the calculated OPS values are in the 0-0.5 distribution. As shown in Fig. 6, The closer the color is to red, the worse the balance is. In such cases, the provision of dedicated exits has a high potential to reduce evacuation times. The color close to blue indicates that the balance is good and a dedicated exit is not needed to improve evacuation efficiency. However, setting up dedicated exits is not the only evacuation strategy. There are many other evacuation strategies such as setting up guides, signage, zoned evacuation, etc. We can decide whether to adopt other evacuation strategies based on the OPS value heat map.
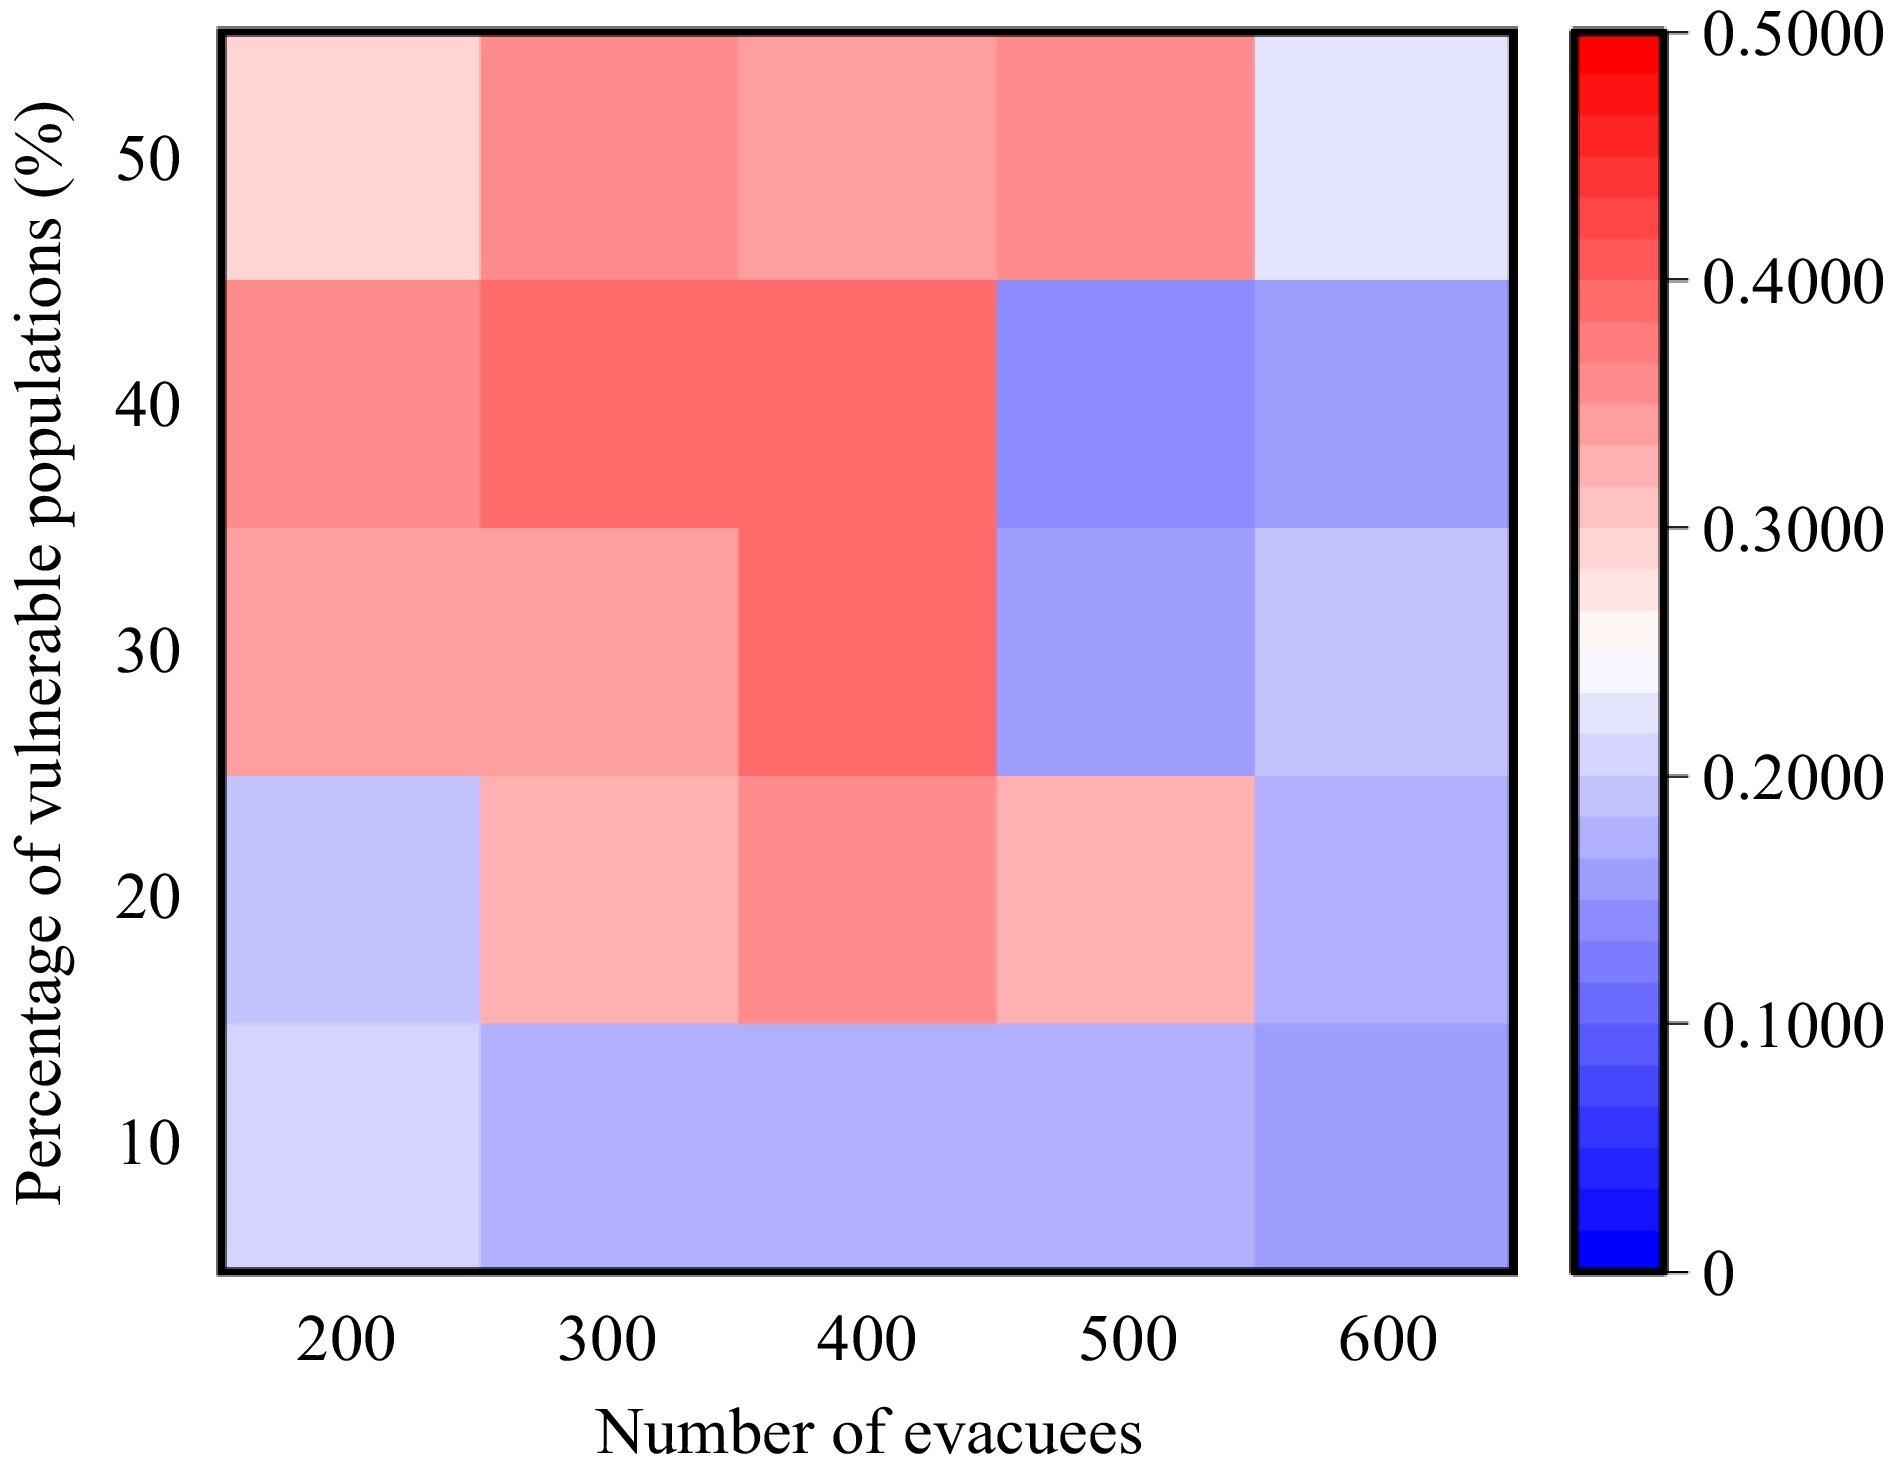
Figure 6.
Heat map of OPS values for evacuation without dedicated exits.
Comparative analysis of evacuation time after evacuation strategy optimization
-
Dedicated exits play a negative role in high crowd density. In the meantime, the normal population near to dedicated exits may not strictly adhere to such evacuation rules in an emergency. In this paper, the evacuation strategy is optimized for the evacuation when the crowd density is high, and a rectangular evacuation area is set up in front of the dedicated exit with the dedicated exit as the center. The pedestrians in the area, regardless of whether they are normal or vulnerable people, will be evacuated to the dedicated exit uniformly, as shown in Fig. 7.
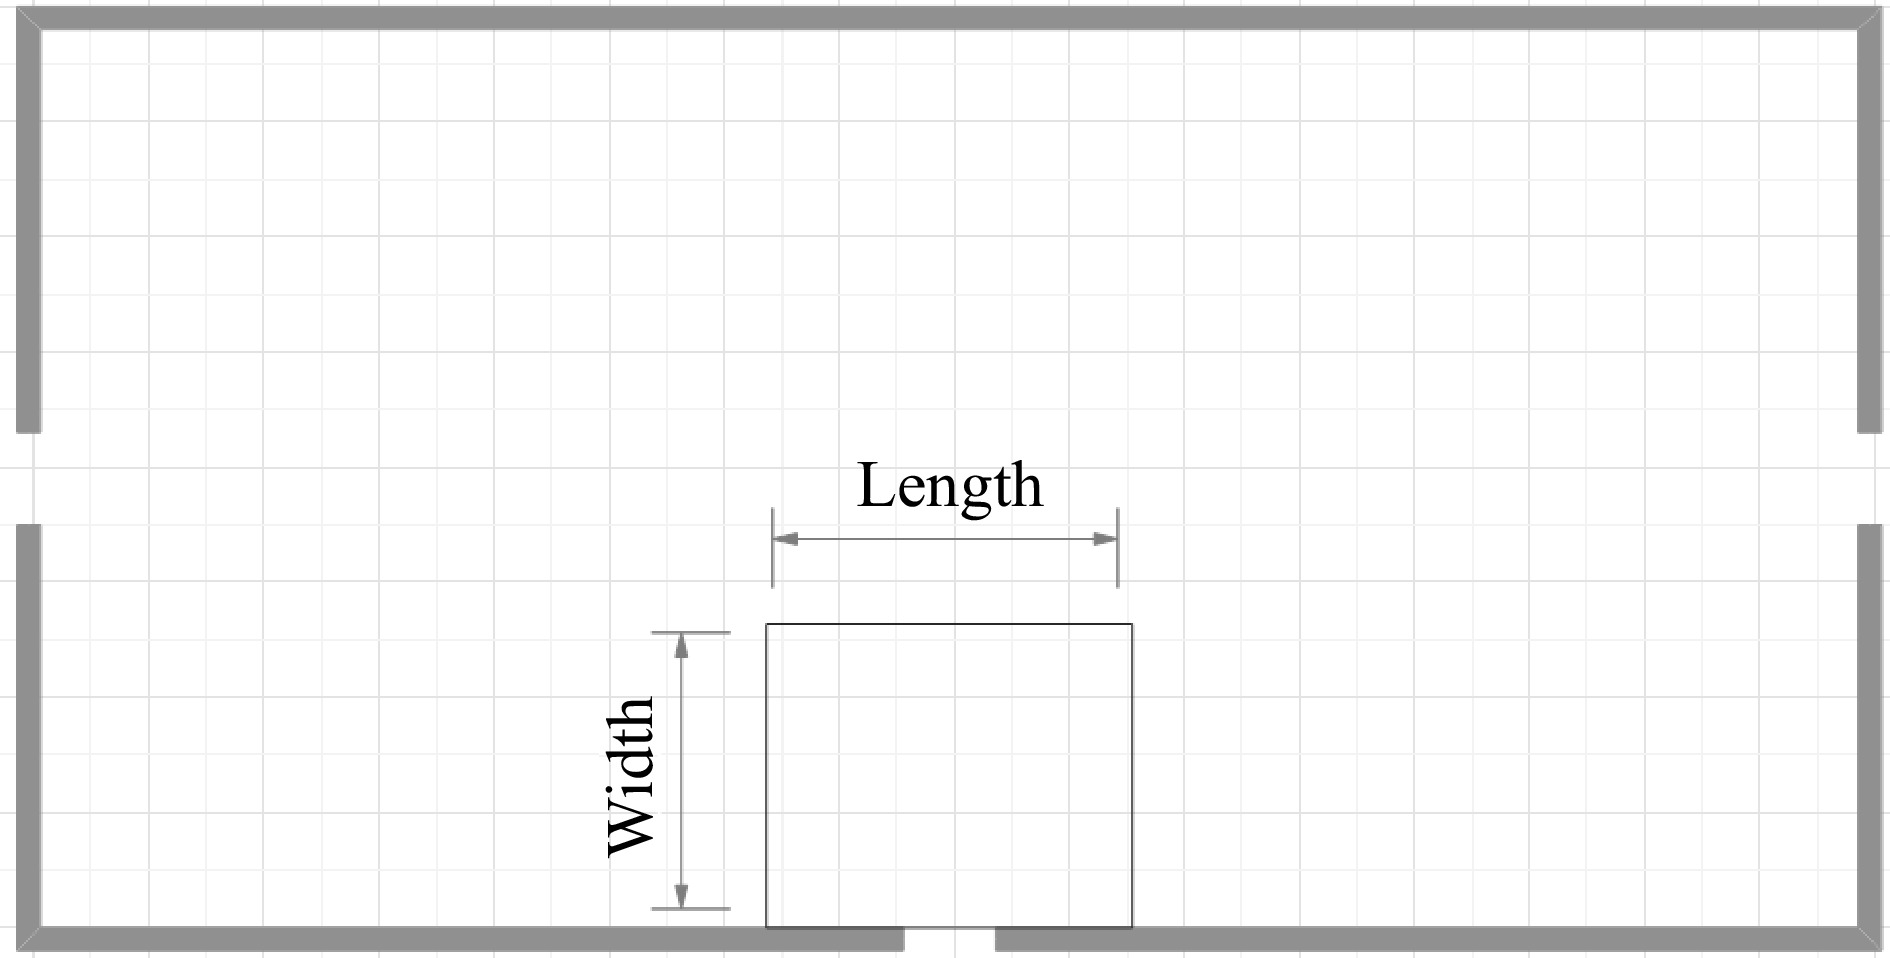
Figure 7.
Schematic diagram of the designated area.
In this paper, six sets of area width values were tested from 5 to 10 m by increasing each set of values by 1 m. Six sets of area length values were tested from 10 to 20 m by increasing each set of values by 2 m. The evacuation time when vulnerable populations accounted for 20%, 30%, and 40% are shown in Tables 8, 9, & 10, respectively.
Table 8. Evacuation times for different zone sizes for 20% of vulnerable populations.
Width (m) Length (m) 10 12 14 16 18 20 5 174 s 163 s 162 s 158 s 164 s 169 s 6 179 s 166 s 161 s 158 s 166 s 160 s 7 179 s 167 s 162 s 155 s 156 s 161 s 8 156 s 157 s 159 s 153 s 150 s 159 s 9 168 s 155 s 152 s 150 s 145 s 144 s 10 165 s 162 s 154 s 162 s 142 s 150 s Table 9. Evacuation times for different zone sizes for 30% of vulnerable populations.
Width (m) Length (m) 10 12 14 16 18 20 5 185 s 192 s 184 s 184 s 191 s 193 s 6 200 s 186 s 176 s 171 s 190 s 186 s 7 198 s 182 s 177 s 173 s 174 s 176 s 8 190 s 180 s 176 s 181 s 177 s 175 s 9 191 s 175 s 178 s 172 s 177 s 171 s 10 193 s 183 s 183 s 187 s 170 s 176 s Table 10. Evacuation times for different zone sizes for 40% of vulnerable populations.
Width (m) Length (m) 10 12 14 16 18 20 5 215 s 215 s 209 s 204 s 200 s 212 s 6 209 s 199 s 200 s 203 s 217 s 199 s 7 207 s 208 s 212 s 193 s 204 s 199 s 8 206 s 205 s 202 s 198 s 201 s 195 s 9 212 s 204 s 202 s 198 s 196 s 203 s 10 223 s 205 s 217 s 217 s 213 s 200 s The results show that when the percentage of vulnerable populations is certain, setting designated evacuation areas can improve the evacuation efficiency in most cases. Since the evacuation time is long when there is a large number of vulnerable populations, it is more important to consider evacuation strategies for large numbers of vulnerable populations in the face of emergencies. When vulnerable populations make up 40% of the population, evacuation time is shortest when the evacuation area is 16 m long and 7 m wide. At this time, when the vulnerable population accounts for 20%, the evacuation time is 155 s; when the vulnerable population accounts for 30%, the evacuation time is 173 s.
When the length of the evacuation area is 16 m and the width is 7 m, the evacuation time for different numbers of evacuees is shown in Fig. 8. When the number of evacuees is 600, the optimized evacuation strategy always helps evacuation, and compared with the evacuation speed when only dedicated exits are set up, the evacuation efficiency is improved by 18.2%, 14.2%, 10.6%, 14.2%, and 2.5% for different vulnerable population shares, respectively. In the case of 200 evacuees, when the percentage of vulnerable people is more than 30%, the evacuation time with the optimized evacuation strategy increases compared to the evacuation time with only dedicated exits, but it is still shorter than the evacuation time without dedicated exits; the evacuation time using the optimized evacuation strategy is shortest when the percentage of vulnerable populations is less than 30%. When the total number of evacuees are 400, the optimized evacuation strategy always helps evacuation, and the evacuation efficiency increases by 11.8%, 6.4%, 5.7%, 3.3%, and 4.6% for different percentages of vulnerable groups. Taken together, the effectiveness of using this optimization strategy with a total of 200 and 400 people is not as good as using it with 600 people, which reveals that this optimization strategy is more effective with a high density of people.
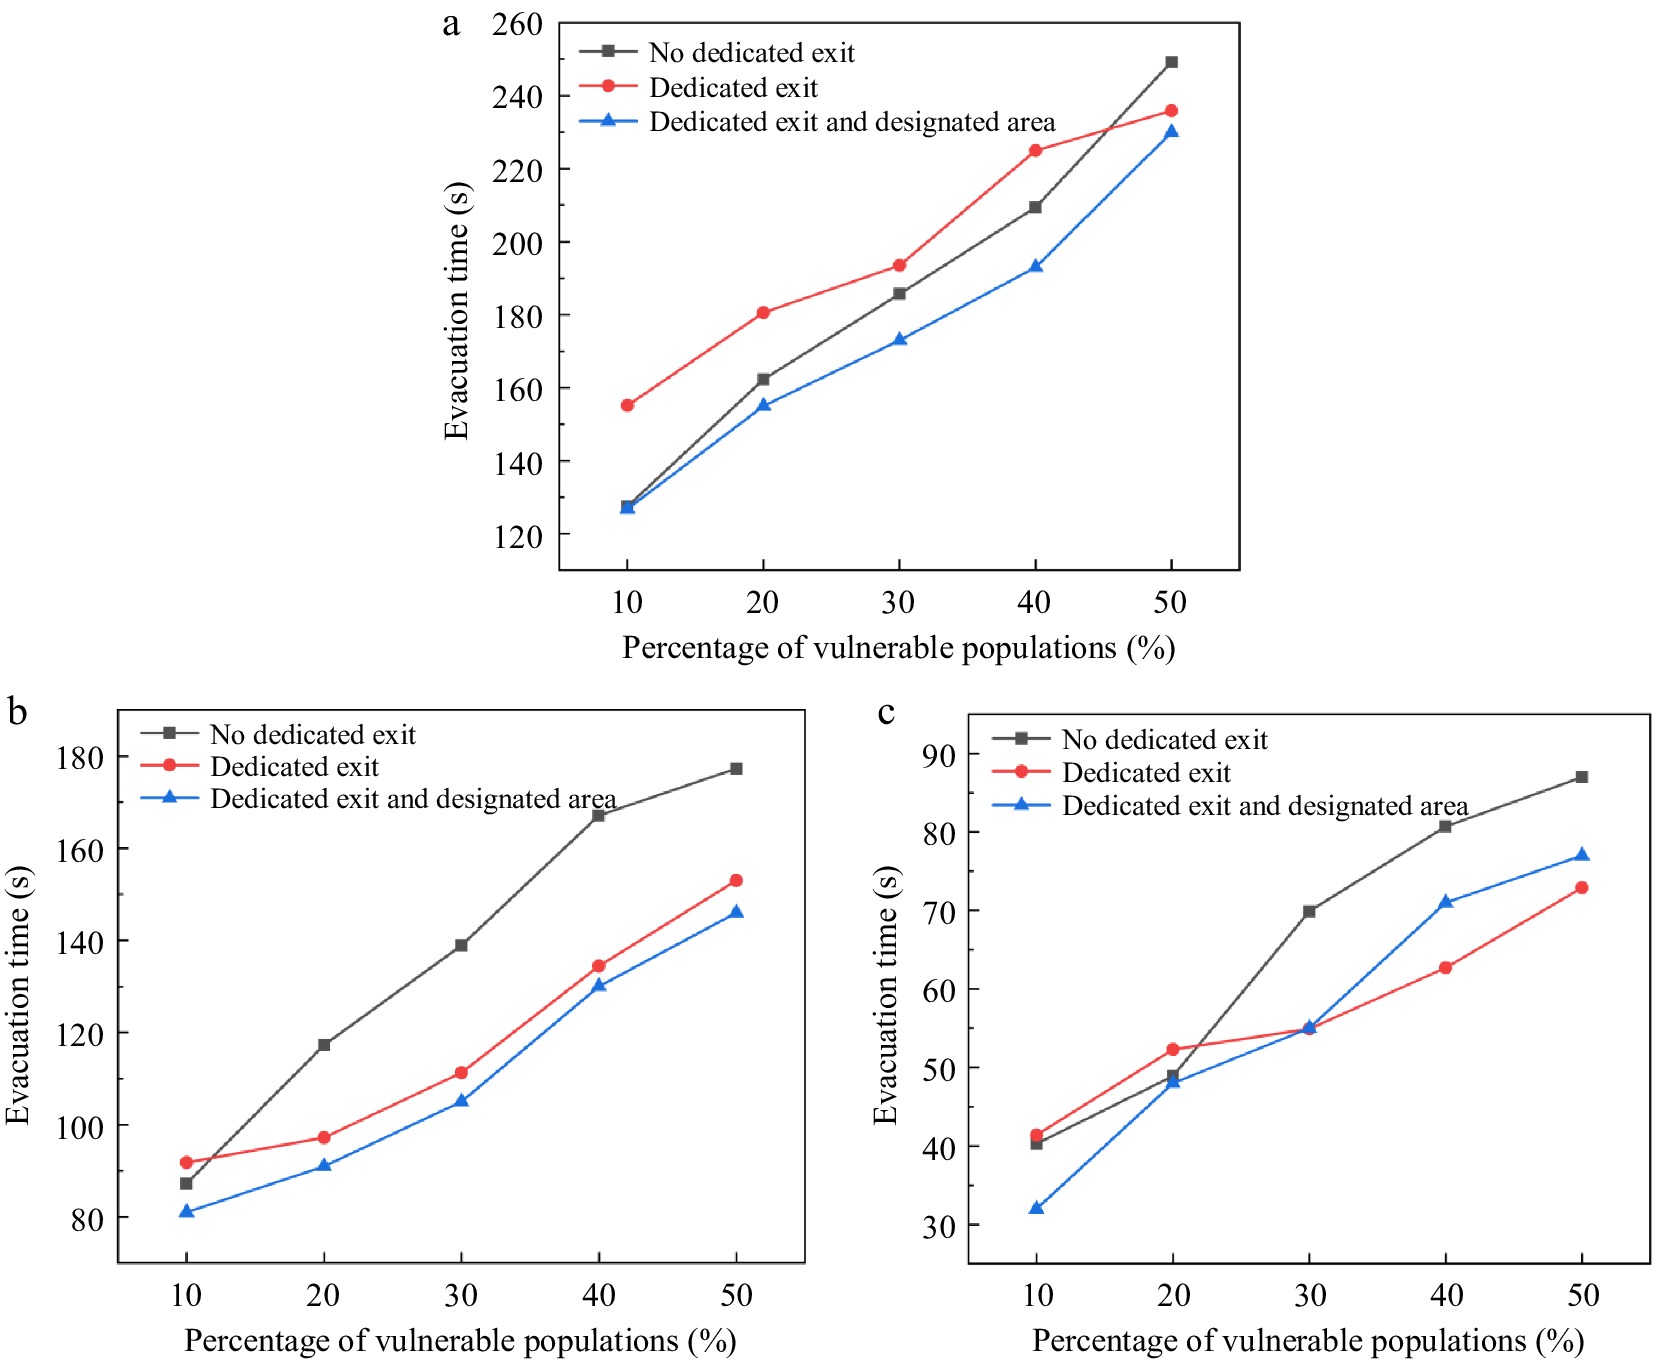
Figure 8.
Evacuation time: (a) 600 people, (b) 400 people, (c) 200 people.
It can be shown that when the density of people is high, the establishment of a designated evacuation area of the appropriate size can compensate for the disadvantages of installing a dedicated exit and improve the overall evacuation efficiency.
-
In this research, the impact of dedicated exits on the evacuation dynamics of normal and vulnerable populations is investigated through the construction of a basic room model with three exits using AnyLogic. Through simulation, the effect of dedicated exits on the evacuation of vulnerable populations is investigated. The following is a summary of the primary simulation results:
(1) Designating side exits for evacuation lengthens the maximum evacuation time and considerably slows down evacuation in rectangular rooms. In many situations, designating the middle exit for evacuation makes sense, and the more vulnerable groups there are, the more situations warrant dedicated exits. However, designating dedicated exits is counterproductive when there are too many evacuees and the building is packed. When the density of people is high, a designated evacuation area is set up in front of the dedicated exit so that the normal population in the area can be evacuated through the dedicated exit, and this method improves the overall evacuation efficiency.
(2) Vulnerable populations are in a completely disadvantageous position during evacuation when there are comparatively few evacuees overall. By creating dedicated exits, the difference in evacuation speed between vulnerable and normal populations can be significantly reduced. When the total number of evacuees is large, the gap between the evacuation speed of vulnerable populations and that of normal populations is small, and the installation of dedicated exits can further reduce the gap between the two. However, by calculating the rate of change of the average evacuation time, it is found that the larger the number of evacuees, the greater the negative impact of installing dedicated exits on the evacuation of normal people.
(3) The main benefit of installing dedicated exits is that it can improve the building's evacuation balance. This paper uses the OPS value to measure the building's evacuation balance, as well as the maximum evacuation time and the OPS value of a thorough comparison and analysis. It was found that the better the balance the shorter the evacuation time for the same number of evacuees and the same percentage of vulnerable populations. The simulation data supported this point of view, i.e., dedicated exits are beneficial to evacuation only if they improve the evacuation balance of the building.
Even though certain findings have been made, further study is still required in the future. First of all, it should be noted that the simulations in this study were only run in basic setups; more complicated configurations, including hallways, rooms with barriers, or irregular shapes, should be taken into account. Furthermore, vulnerable populations' psychological reactions to designated exits during an evacuation should be taken into account. Exits designated for this purpose may reduce anxiety among vulnerable people and improve evacuation conditions. How to combine guidance tactics with dedicated egress systems to obtain a more balanced utilization of dedicated exits, to increase the evacuation efficiency more notably, is a topic worthy of further investigation.
-
The authors confirm contribution to the paper as follows: study conception and design: Qiao Y, Wang J ; data collection: Qiao Y, Li Q; analysis and interpretation of results: Qiao Y, Liu Q; draft manuscript preparation: Qiao Y, Wang J. All authors reviewed the results and approved the final version of the manuscript.
-
All data generated or analyzed during this study are included in this published article.
This research was sponsored by the National Natural Science Foundations of China (No. 52374208), the Major Natural Science Research Projects in Colleges and Universities of Jiangsu Province (No. 23KJA620002), the Qinglan Project of Jiangsu Province and a project funded by the Priority Academic Program Development of Jiangsu Higher Education Institutions.
-
The authors declare that they have no conflict of interest. Jinghong Wang is the Editorial Board member of Emergency Management Science and Technology who was blinded from reviewing or making decisions on the manuscript. The article was subject to the journal's standard procedures, with peer-review handled independently of this Editorial Board member and the research groups.
- Copyright: © 2024 by the author(s). Published by Maximum Academic Press on behalf of Nanjing Tech University. This article is an open access article distributed under Creative Commons Attribution License (CC BY 4.0), visit https://creativecommons.org/licenses/by/4.0/.
-
About this article
Cite this article
Qiao Y, Li Q, Liu Q, Wang J. 2024. A simulation study of the influence of dedicated building exits on the evacuation patterns of vulnerable populations. Emergency Management Science and Technology 4: e013 doi: 10.48130/emst-0024-0013 

A simulation study of the influence of dedicated building exits on the evacuation patterns of vulnerable populations
- Received: 04 February 2024
- Revised: 06 May 2024
- Accepted: 15 May 2024
- Published online: 26 June 2024
Abstract: In recent years, vulnerable populations have become the main targets of casualties in many building fire accidents. It is of great significance to study the behavioral patterns of vulnerable populations during emergency evacuation and to design specialized strategies conducive to the evacuation of vulnerable populations to improve evacuation efficiency and reduce casualties. In this paper, simulations are carried out using AnyLogic based on a social force model to explore the impact of dedicated exits in public places on the evacuation of vulnerable populations. A model of a normal room with three exits was created in which pedestrians were divided into two categories: normal and vulnerable populations with different evacuation speeds and footprint sizes. Simulation results show that dedicating middle exits reduces evacuation time in most cases while dedicating side exits significantly increases evacuation time. Middle exits as dedicated exits can balance the evacuation speed of vulnerable and normal populations, and improve the overall evacuation efficiency of vulnerable populations. Calculating the balance analysis index OPS for building evacuation, the results show that the balance of exits is the key to the evacuation time, and the closer the OPS value is to 0 the better the evacuation balance, which leads to a shorter evacuation time. This paper illustrates the impact of dedicated exits on the evacuation of vulnerable populations. Also, it provides a basis for the need for dedicated exits in different situations by calculating OPS values.
-
Key words:
- Vulnerable crowd evacuation /
- Dedicated exits /
- Social force model /
- Balance of exits