-
Figure 1.
Visual changes in fruit color and wax of blue honeysuckle in the control (air) and after CA treated during 28 d of storage at −1 °C. Control represents air. CA1 represent 20% O2 and 20% CO2, CA2 represent 5% O2 and 20% CO2, CA3 represent 5% O2 and 10% CO2.
-

Figure 2.
Changes in (a) ΔL, (b) Δa, (c) Δb, and (d) ΔE values of blue honeysuckle in the control (air) and after CA treated during 28 d of storage at −1 °C. ΔL represents the difference in terms of lightness; Δa represents the red (+a) to green (−a); Δb represents the yellow (+b) to blue (−b); ΔE represents the total color difference. Control represents air. CA1 represent 20% O2 and 20% CO2, CA2 represent 5% O2 and 20% CO2, CA3 represent 5% O2 and 10% CO2. Each treatment was repeated in ten replicates and ten fruits of blue honeysuckle were used per replicate.
-
Figure 3.
Effect of CA treatment on (a) moisture content (%), (b) weight loss (%), (c) firmness (N), (d) TSS (%), (e) acidity (%), (f) pH, (g) ETH (pmol·kg−1), (h) MDA (nmol·g−1), (i) respiration rate (mg CO2 kg−1·h−1), (j) TPC (GAE g·kg−1), (k) TFC (CE mg·g−1), (l) TAC (C3GE mg·kg−1), (m) DPPH (TE g·kg−1), (n) ABTS (TE g·kg−1), and (o) FRAP (FeSO4·7H2O g·kg−1) of blue honeysuckle during 28 d of storage at −1 °C. The vertical bars represent the average with SD for three replicate samples (approximately 500 g fruit of blue honeysuckle were used per replicate sample), and different letters (a–o) above the line indicate significant differences between treatments using Duncan's multiple range test.
-
Figure 4.
Effect of CA treatment on ABA and ASA of blue honeysuckle during 28 d of storage at −1 °C. HPLC chromatograms of blue honeysuckle for (a-1) ABA and (d-1) ASA; enlarged views of HPLC chromatograms of blue honeysuckle for (a-2) ABA and (d-2) ASA; HPLC chromatograms of (a-3) ABA standard, (d-3) ASA standard; calibration curves for (c) ABA and (f) ASA; the content of (b) ABA in blue honeysuckle; and the content of (e) ASA in blue honeysuckle.
-
Figure 5.
Partial least squares discriminant analysis (PLS-DA) of the postharvest quality index of blue honeysuckle. Variable importance in (a) projection scores, (b) permutation test, and (c) model prediction evaluation chart.
-
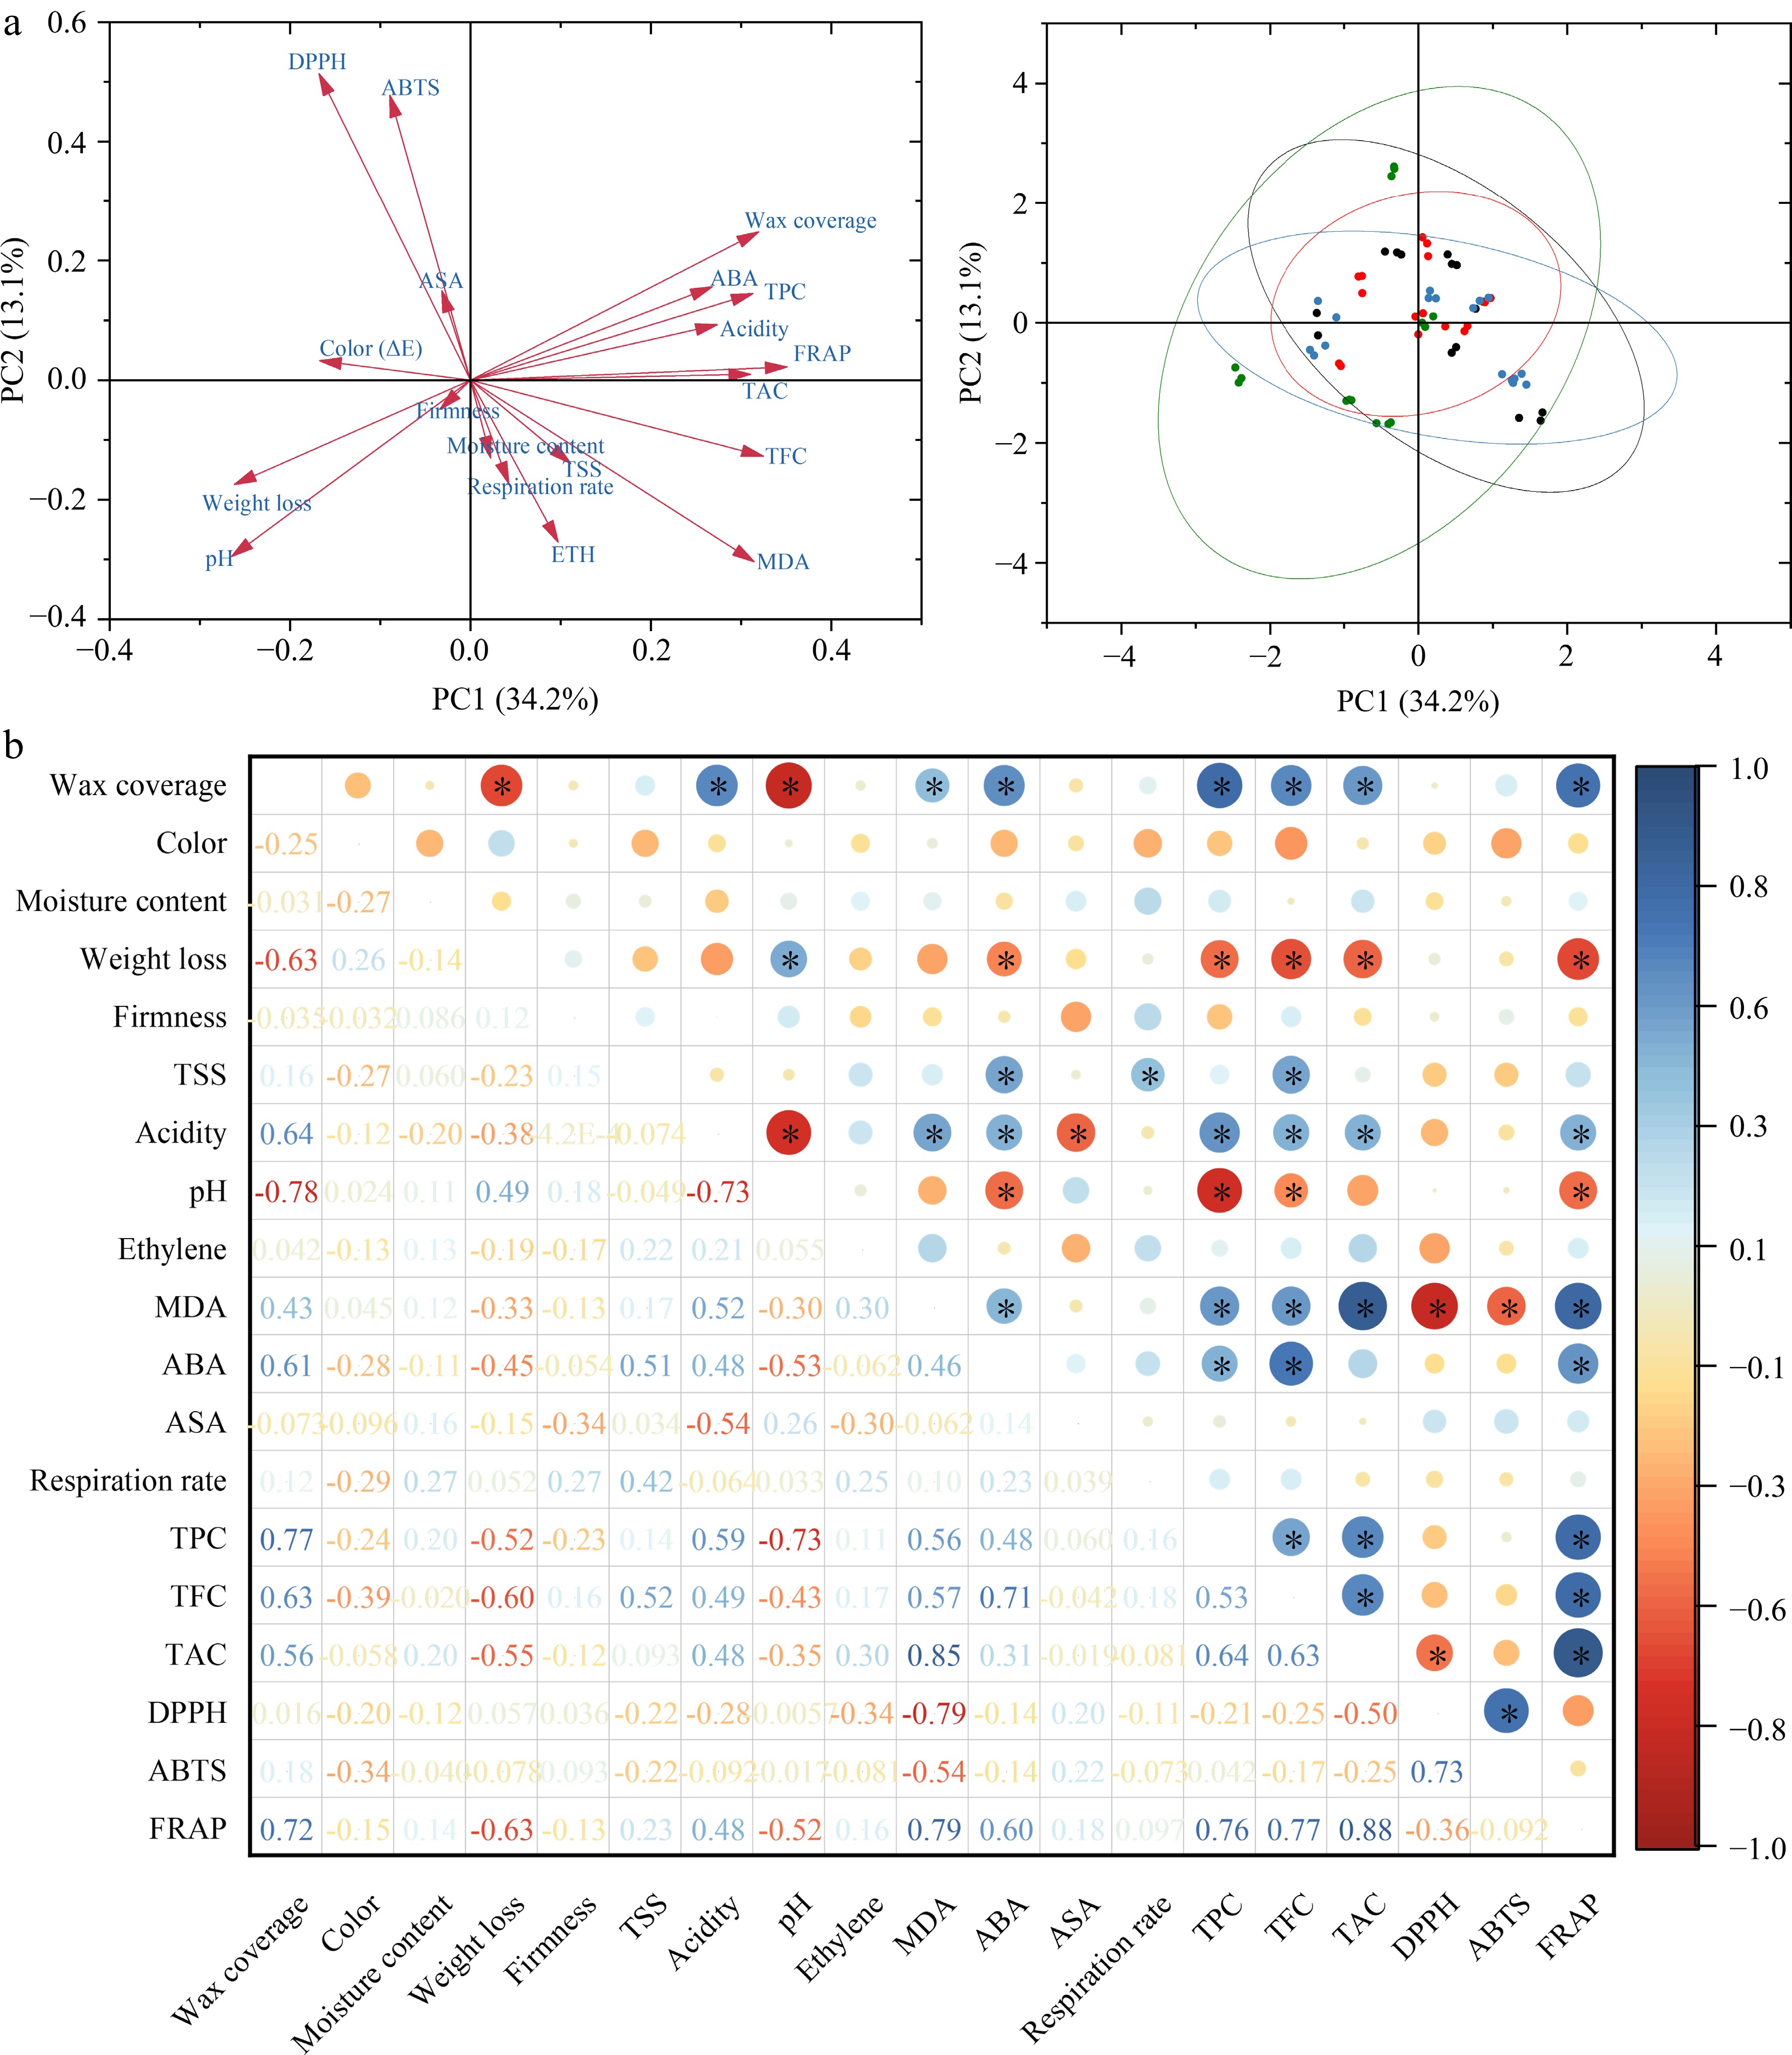
Figure 6.
(a) Principal component analysis and (b) correlation analysis between changes in wax coverage, color (ΔE), moisture content, weight loss, firmness, TSS, acidity, pH, ETH, MDA, ABA, ASA, respiration rate, TPC, TFC, TAC, DPPH, ABTS, and FRAP in fresh blue honeysuckle. (*) denote significant differences (p ≤ 0.05) between the control and CA-treated fresh blue honeysuckle fruit at each time point.
Figures
(6)
Tables
(0)