-
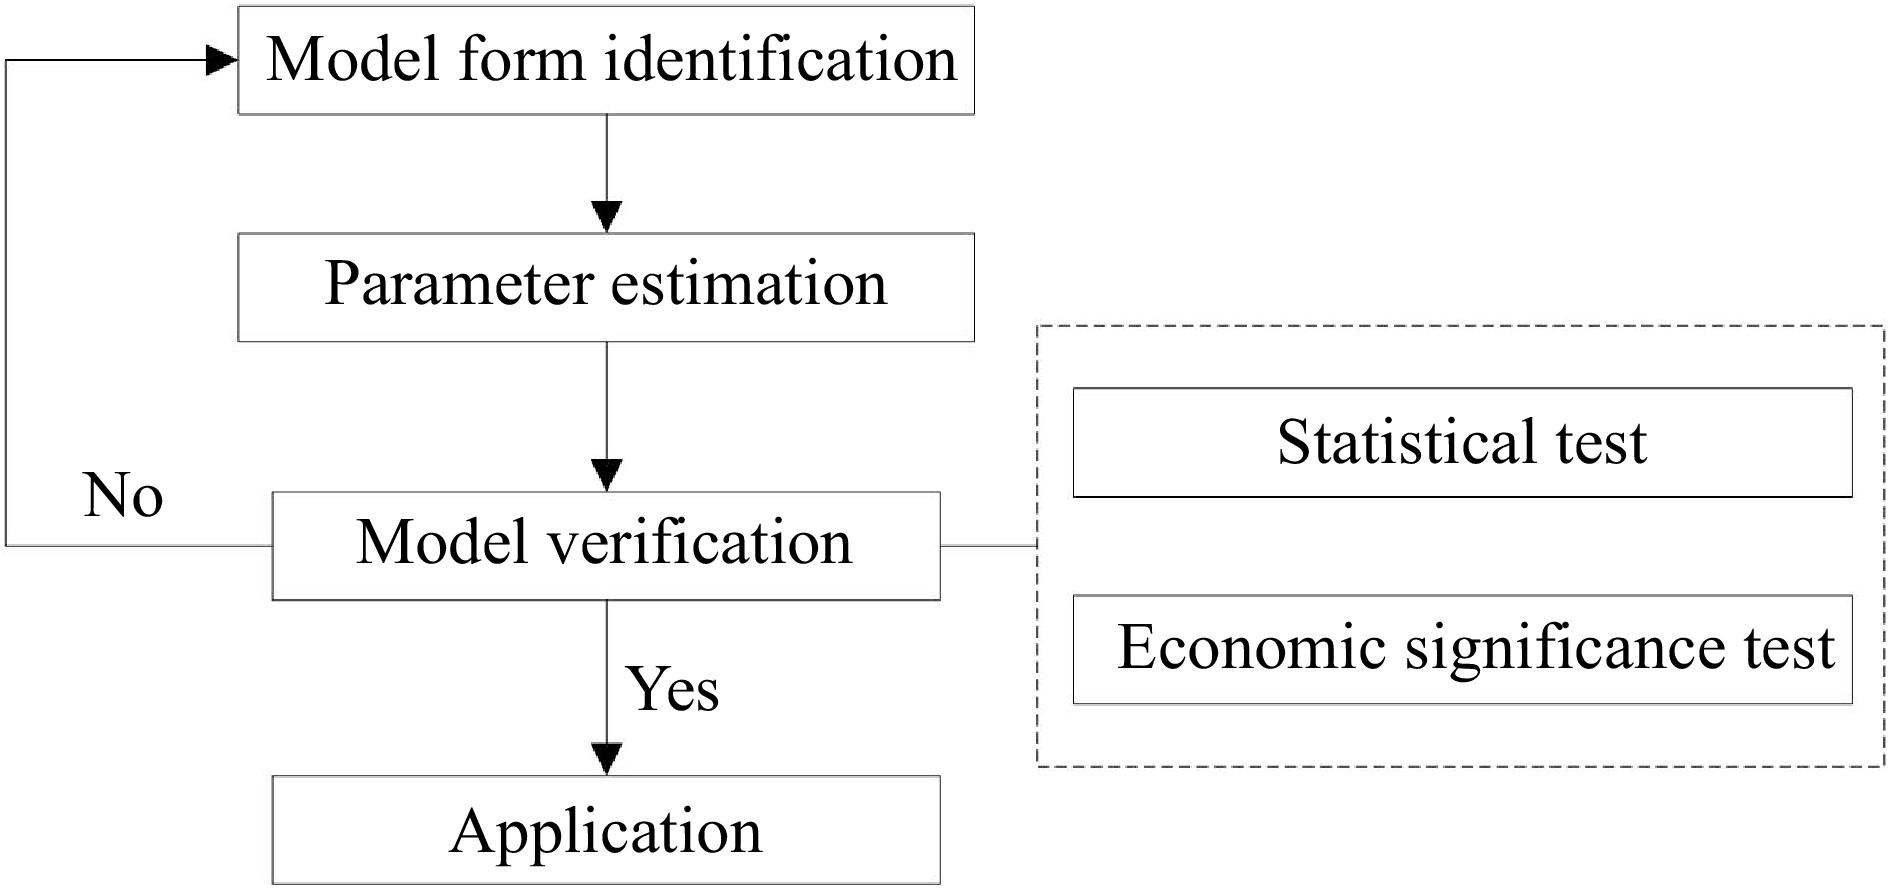
Figure 1.
Model construction process.
-
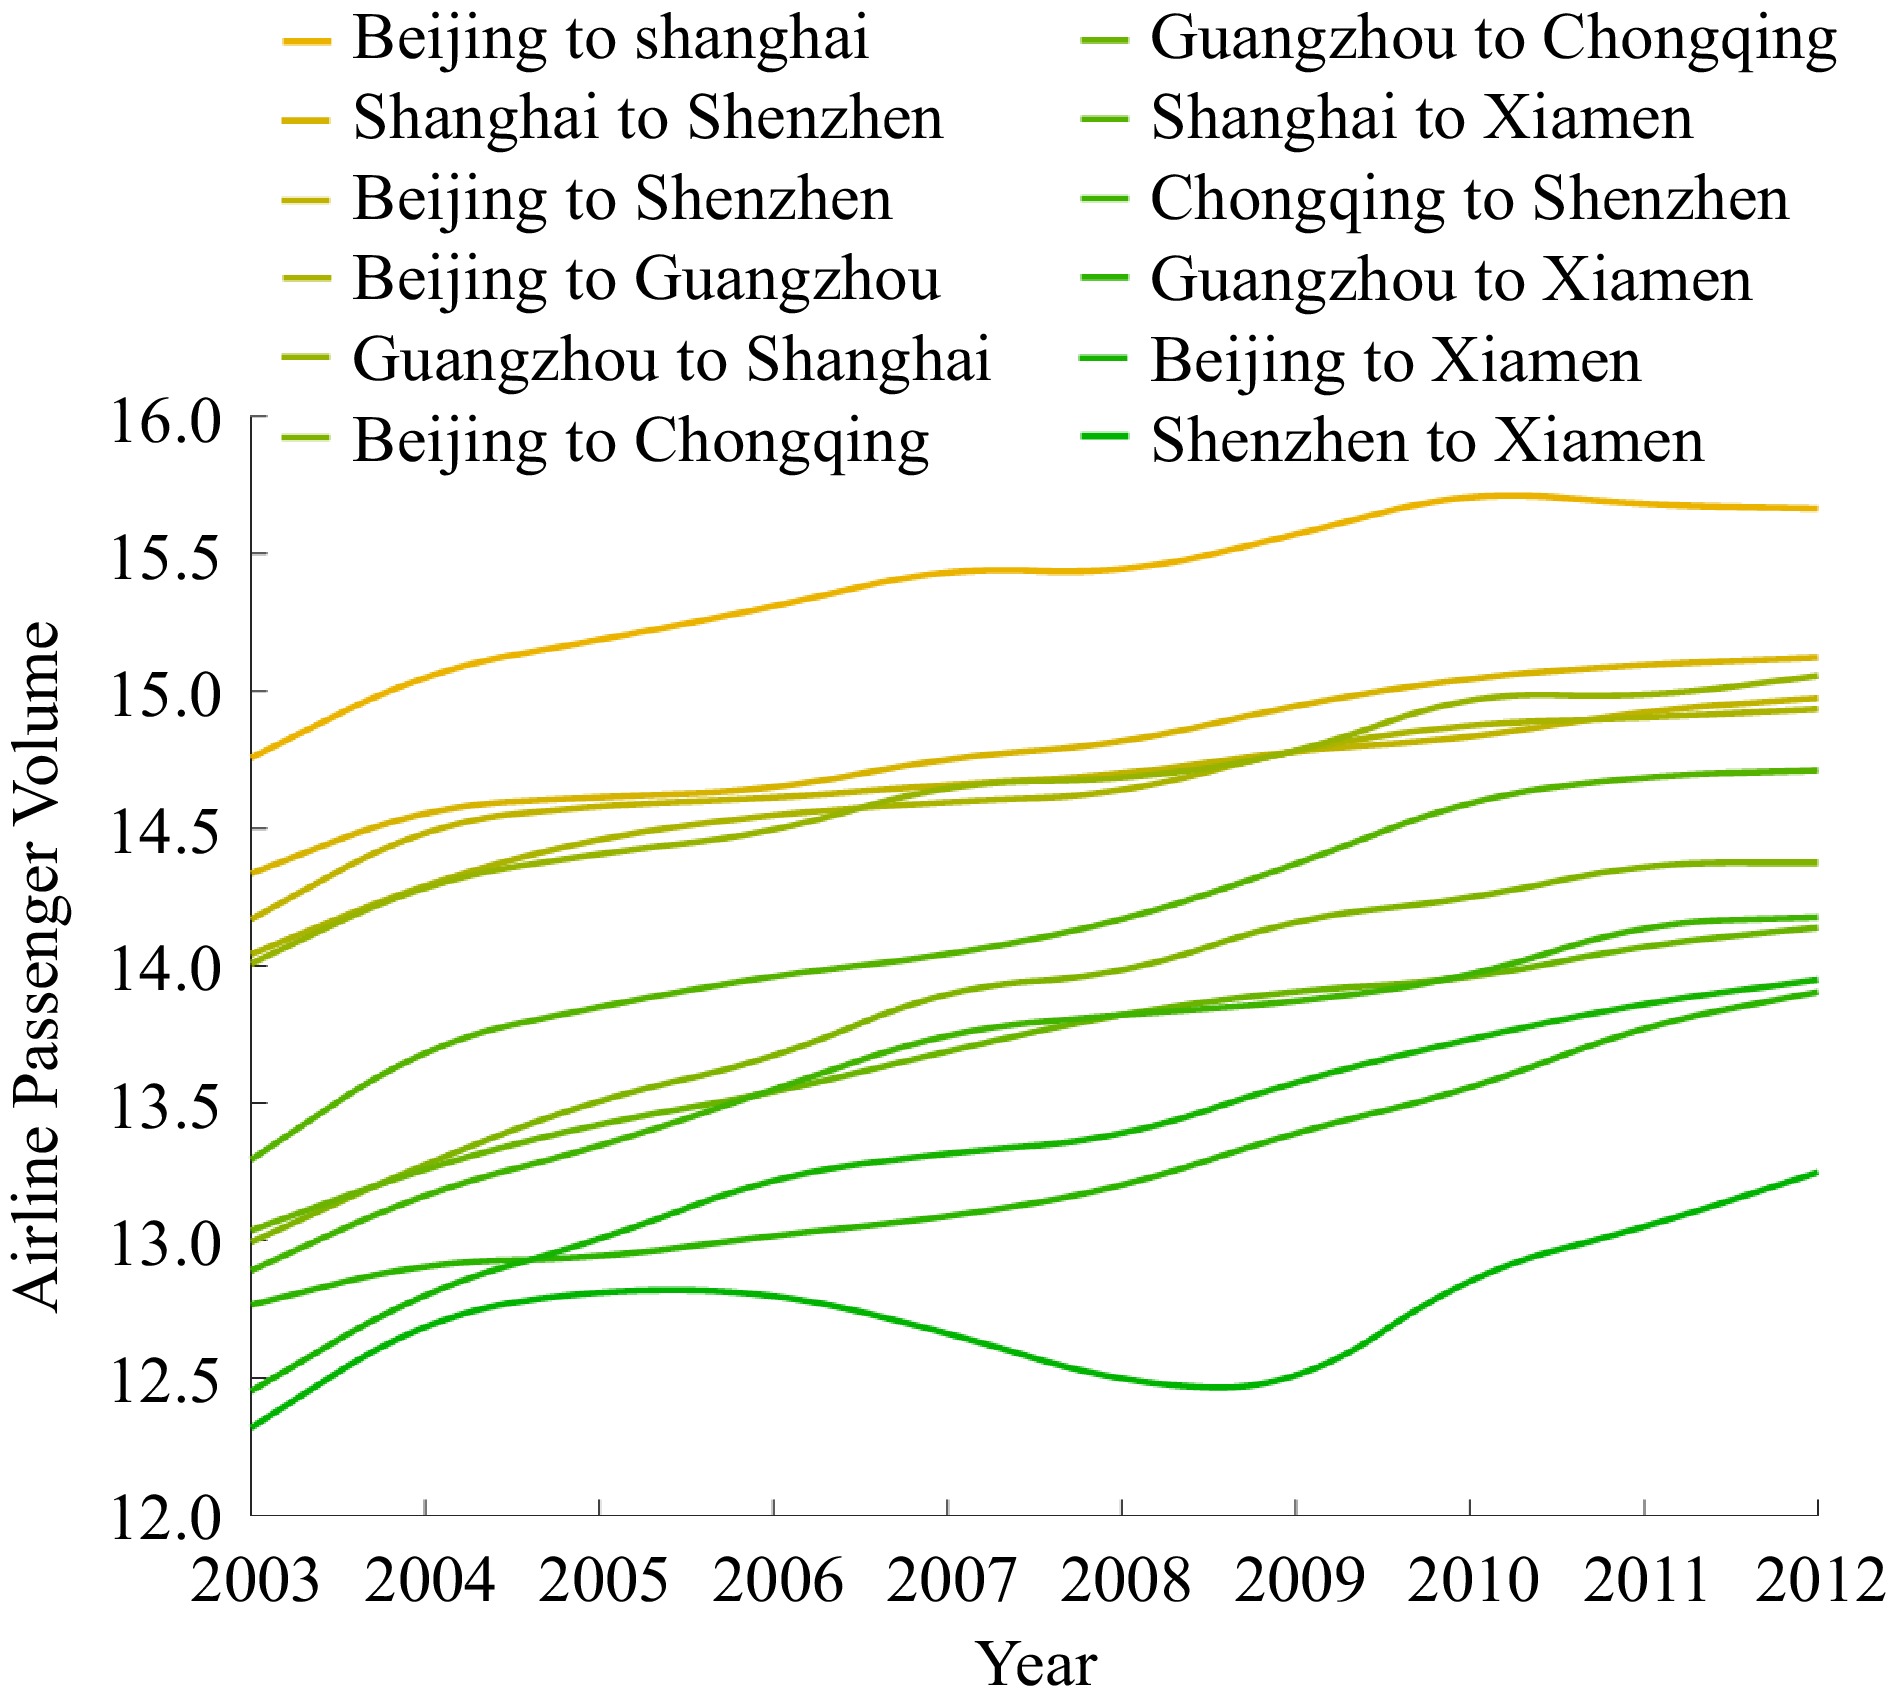
Figure 2.
Airline passenger volumes from 2003 to 2012.
-
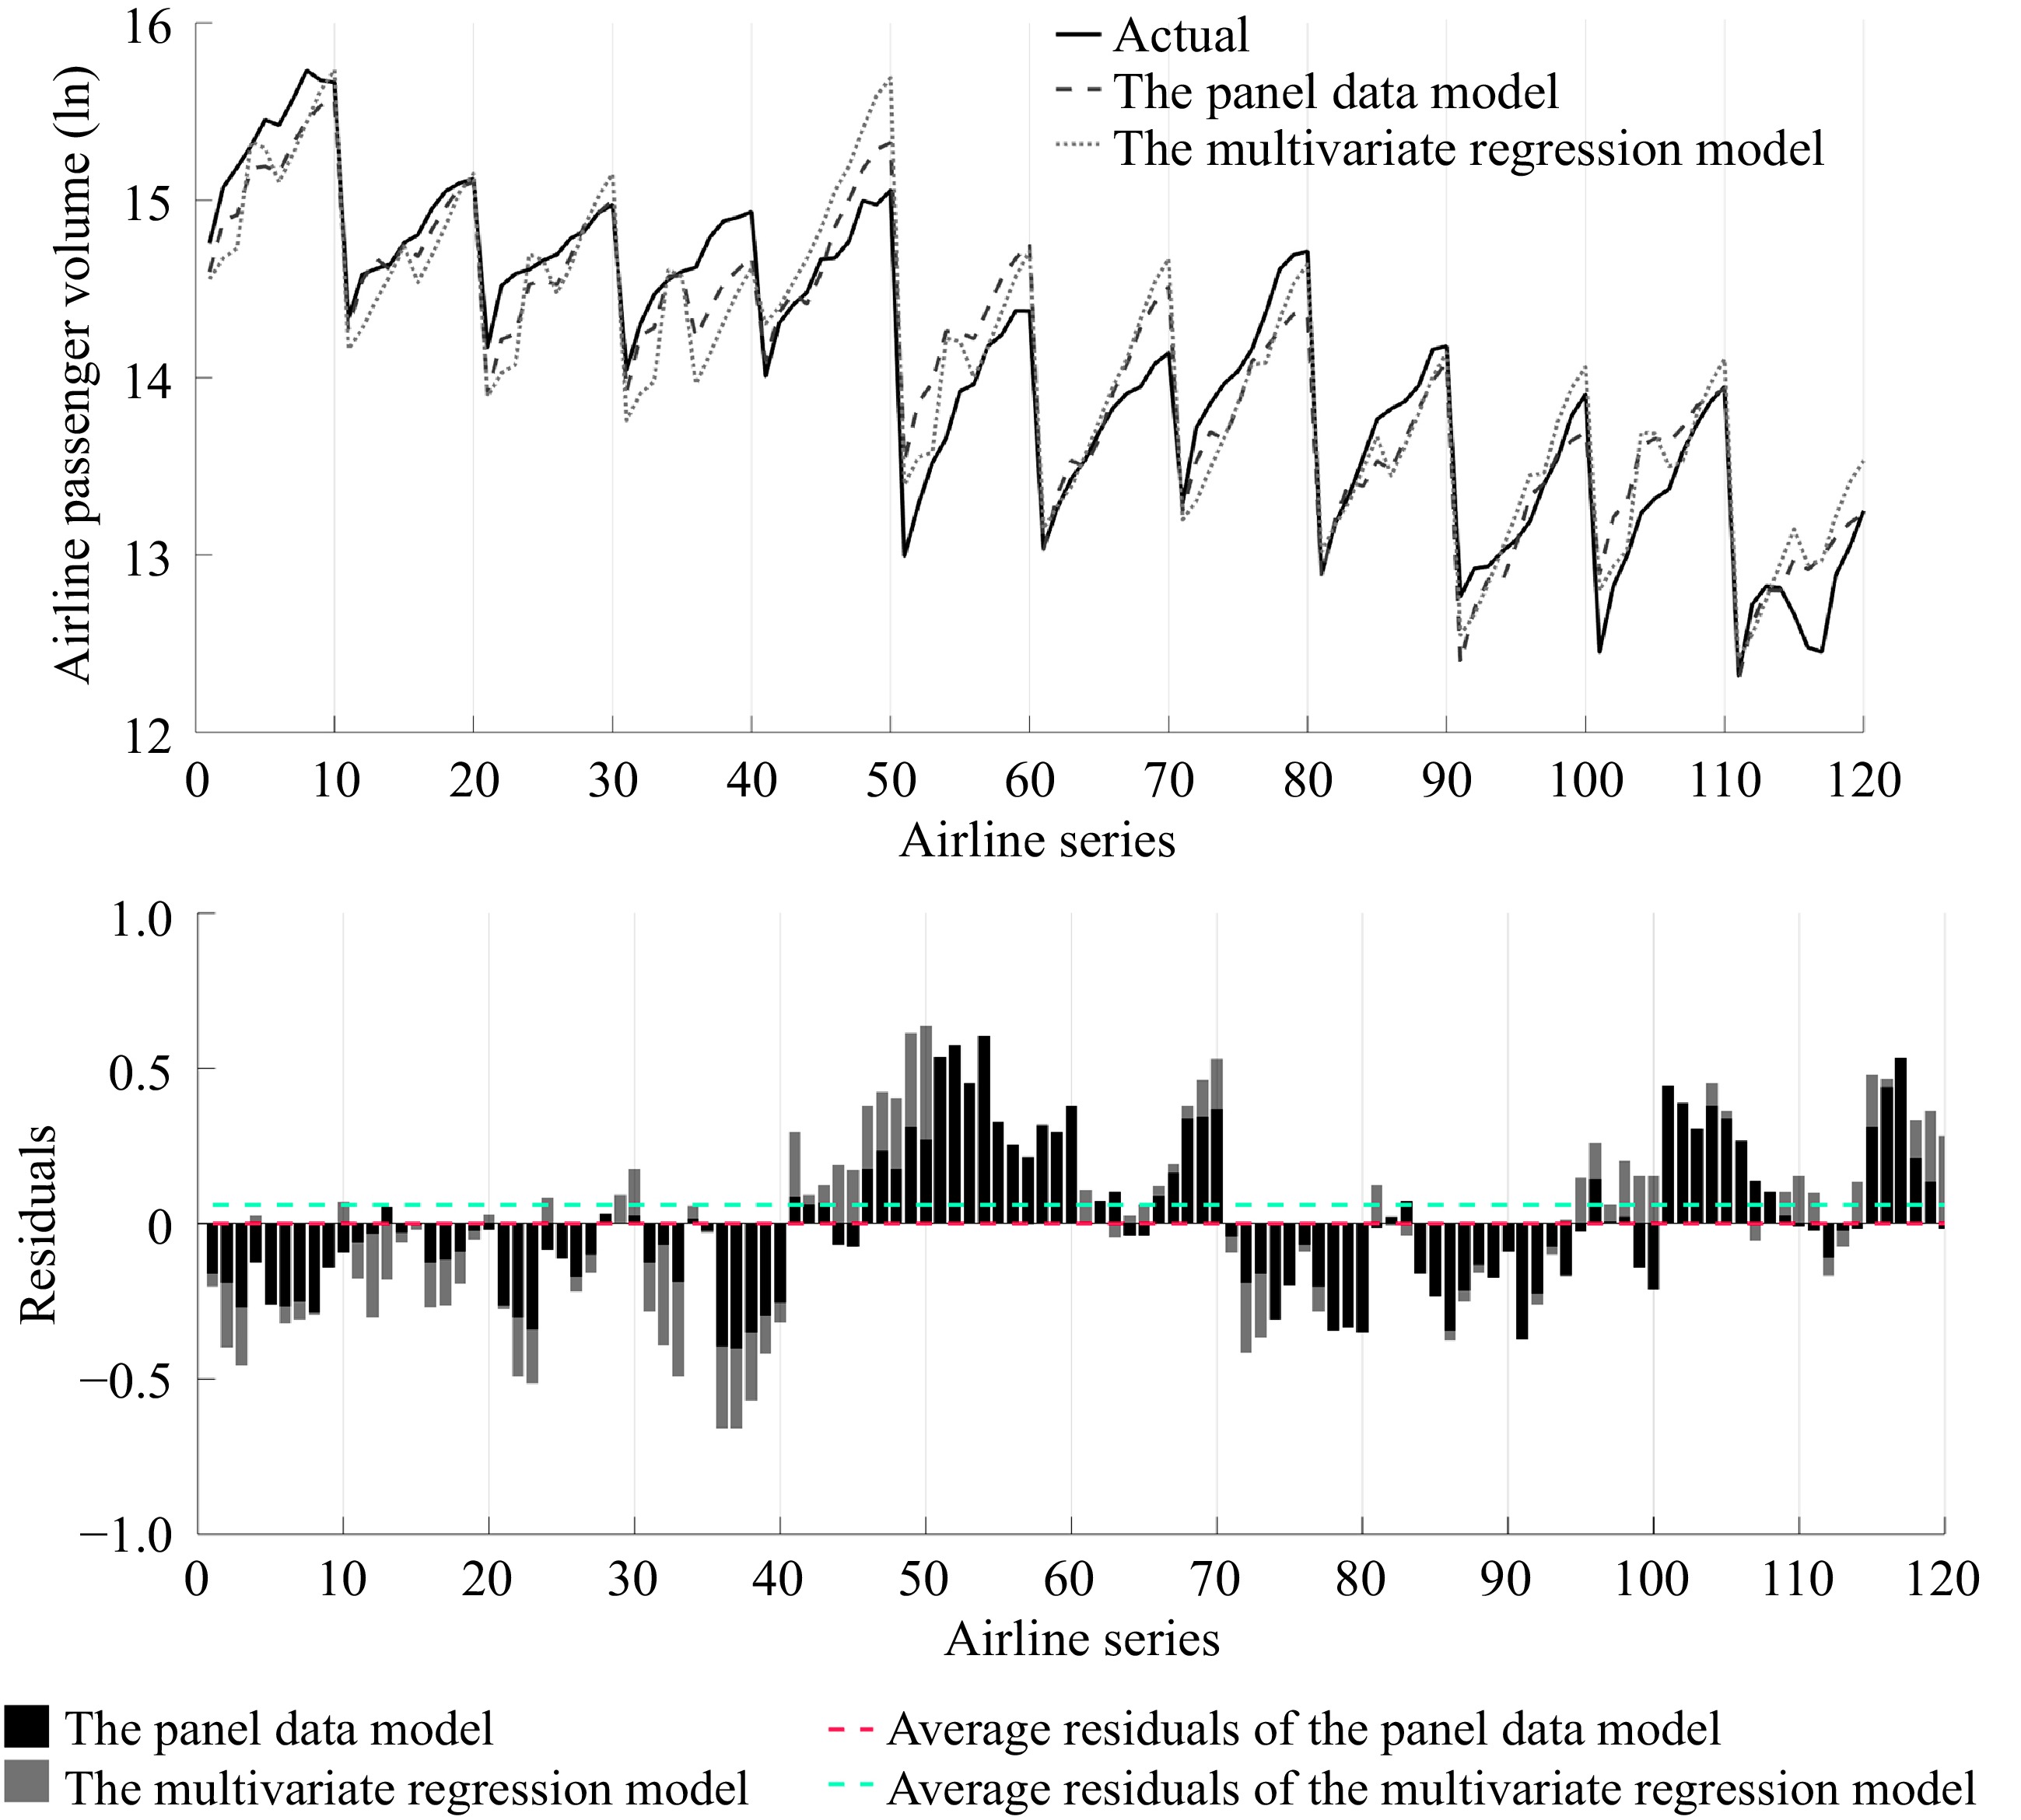
Figure 3.
The panel model and the multivariate regression model for the airline passenger volume projection (2003−2012).
-
Data name Symbol Airline passenger volume Vol Geo-economic factors Population Pop GDP GDP Per capita GDP PGDP Total retail sales of consumer goods of departure city DT Total retail sales of consumer goods of arrival city AT Proportion of tertiary industry PT Distance Dist Service-related factors Railway passenger traffic volume R Highway passenger traffic volume H Table 1.
Summary of data used.
-
Data symbol Units Mean Median Maximum Minimum Std. dev. Vol Ten thousand 1.749 × 10⁶ 1.341 × 10⁶ 6.800 × 10⁶ 2.239 × 10⁵ 1.390 × 10⁶ Pop Ten thousand 1,448.009 1,638.500 2,945.000 220.285 831.751 GDP Hundred million 9,938.198 9,192.937 20,181.720 2,555.720 466.054 PGDP One hundred million yuan per ten
thousand people12.620 6.742 51.212 0.912 13.120 DT Hundred million 3,902.157 3,335.250 8,123.500 934.671 1,939.569 AT Hundred million 2,145.732 1,680.000 7,840.400 207.472 1,805.989 PT % 49.871 49.400 63.580 40.500 5.465 Dist Kilometer 1,201.950 1,213.250 1,945.320 464.550 629.753 R Ten thousand × ten thousand 1.847 × 10⁷ 1.009 × 10⁷ 1.100 × 10⁸ 3.013 × 10⁵ 2.170 × 10⁷ H Ten thousand × ten thousand 3.194 × 10⁹ 4.521 × 10⁸ 2.731 × 10¹⁰ 6.824 × 10⁶ 6.184 × 10⁹ Table 2.
Descriptive statistics of data.
-
Principal component (PC) Eigenvalue Contribution rate Accumulative contribution rate PC 1 5.982 58.93% 58.93% PC 2 2.033 20.03% 78.96% PC 3 1.473 14.51% 93.47% PC 4 0.444 4.38% 97.85% PC 5 0.163 1.60% 99.45% PC 6 0.047 0.46% 99.92% PC 7 0.006 0.05% 99.97% PC 8 0.003 0.03% 100.00% PC 9 0.000 0.00% 100.00% Table 3.
Eigenvalue of variance and contribution rate.
-
Factors PC 1 PC 2 PC 3 PC 4 Pop 0.025 −0.223 0.683 0.261 GDP 0.076 0.093 0.088 0.606 PGDP 0.051 0.316 −0.595 0.345 DT 0.104 0.118 0.099 0.606 PT 0.017 0.035 0.030 0.018 AT 0.283 0.394 0.227 −0.242 R 0.365 0.679 0.197 −0.130 H 0.872 −0.453 −0.178 −0.016 Dist 0.075 0.074 0.197 −0.046 Table 4.
Load matrixes of factors.
-
Factors Importance coefficient H 0.397 R 0.374 AT 0.268 DT 0.126 GDP 0.103 Dist 0.085 Pop 0.081 PT 0.023 PGDP 0.022 Table 5.
The importance coefficient of factors
-
Variables H R AT DT VIF 1.339 5.623 5.391 1.480 Table 6.
Result of multicollinearity test.
-
Variables Panel data model
coefficientsMultivariate regression
model coefficientsC 3.256*** (3.274) 6.957*** (14.671) H −0.120*** (−10.981) −0.165*** (−12.109) R −0.081*** (4.010) 0.075 (1.622) AT 0.754*** (17.138) 0.606*** (9.769) DT 1.107*** (8.305) 0.588*** (9.567) R2 0.912 0.881 Adj-R2 0.902 0.877 F−statistic 84.991 212 Prob (F−statistic) 0.000 0.000 MAPE (%) 1.342 1.608 RMSE 0.235 0.288 *, **, and *** indicate that the explanatory variable is significant at the 0.10, 0.05, and 0.01 significance level, respectively. t-statistics are printed in parentheses. Table 7.
Estimation results and statistical test results of model
-
Time point Disturbance value 2003 −0.092 2004 0.083 2005 0.215 2006 0.330 2007 0.507 2008 0.713 2009 0.826 2010 1.011 2011 1.232 2012 1.354 Table 8.
Time point disturbance term.
-
Year H R AT DT 2003 18.554 15.704 7.785 6.840 2004 18.826 16.073 7.885 6.974 2005 18.772 15.479 8.000 7.113 2006 18.903 15.638 8.124 7.266 2007 19.165 16.158 8.262 7.445 2008 19.523 16.396 8.429 7.672 2009 19.614 16.413 8.559 7.830 2010 19.911 16.602 8.730 8.023 2011 19.975 16.716 8.880 8.238 2012 20.162 16.838 8.967 8.390 Table 9.
Variables values of airline from Chongqing to Shanghai.
-
Year Actual
valuePanel model Multivariate
regression modelPredicted value Precision Predicted value Precision 2003 12.811 13.552 94.21% 13.813 92.17% 2004 13.141 13.848 94.62% 13.935 93.96% 2005 13.47 14.045 95.73% 14.051 95.69% 2006 13.59 13.998 96.99% 14.207 95.46% 2007 13.605 14.141 96.05% 14.391 94.22% 2008 13.698 14.404 94.84% 14.584 93.53% 2009 14.026 14.576 96.08% 14.742 94.89% 2010 14.185 14.735 96.12% 14.925 94.78% 2011 14.281 14.907 95.62% 15.140 93.99% 2012 14.43 14.972 96.25% 15.260 94.25% Table 10.
Comparison of predicted value and actual value.
Figures
(3)
Tables
(10)