-
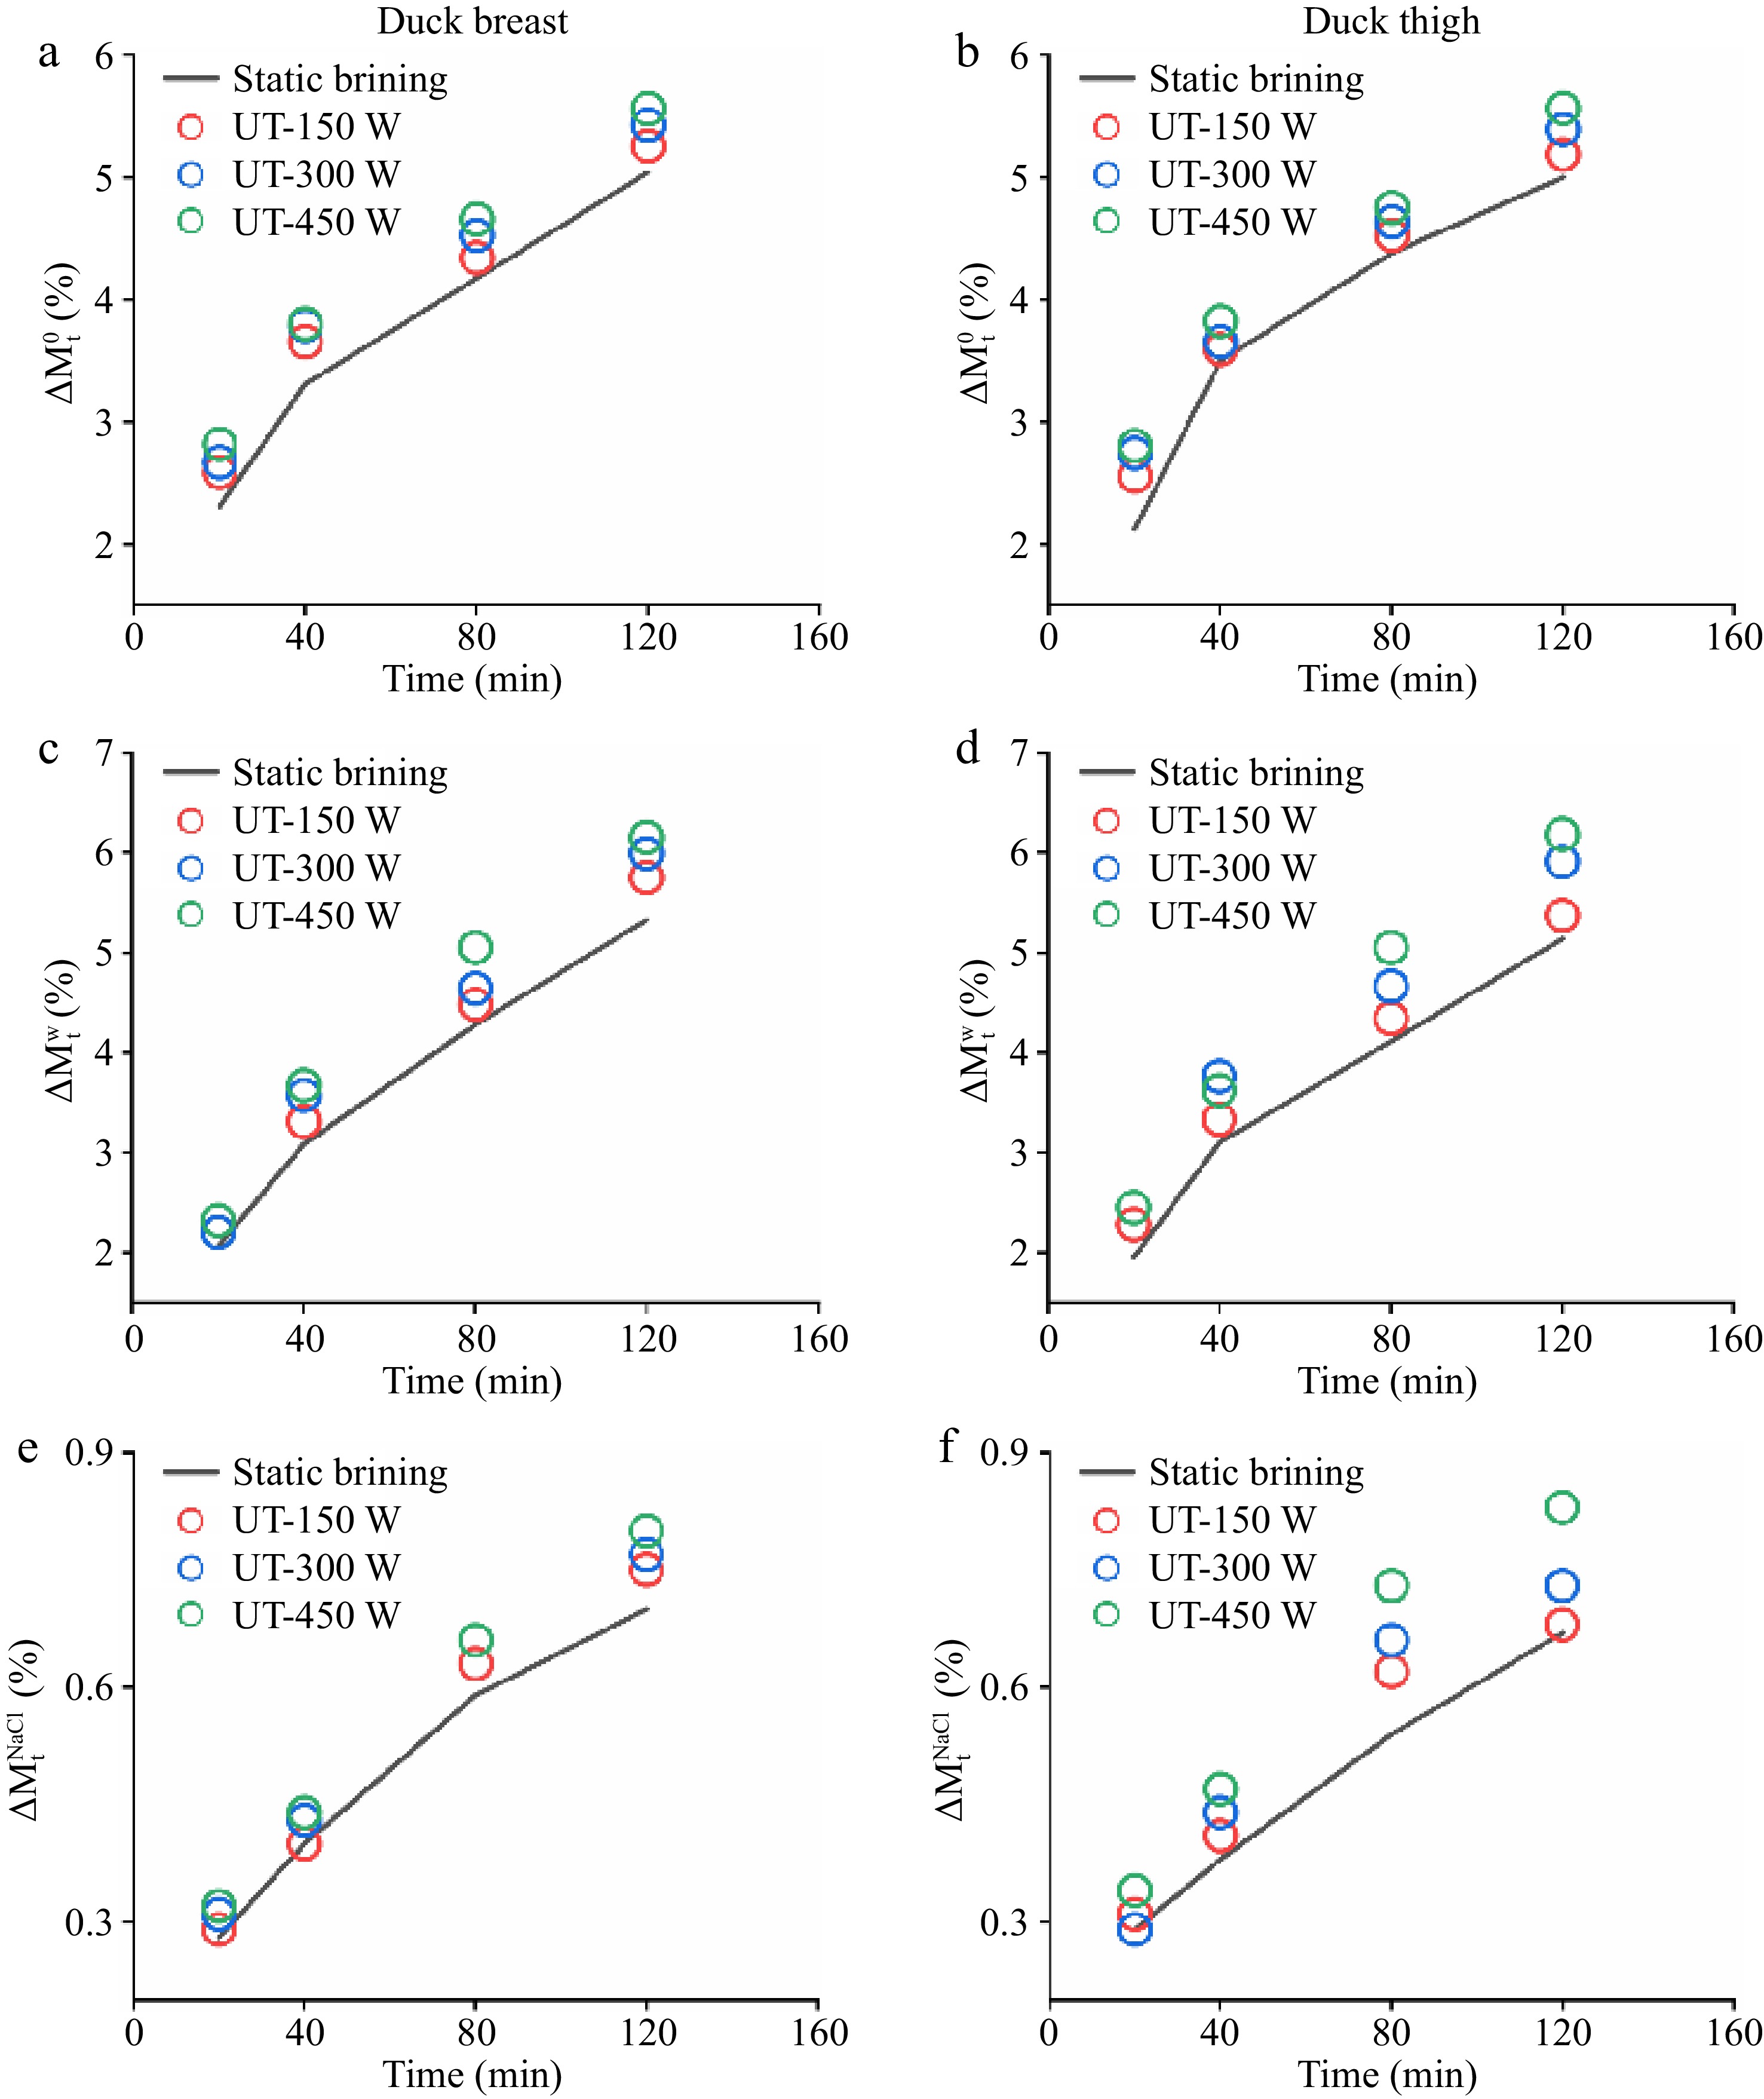
Figure 1.
(a), (b) Total weight changes (
$\Delta M_{\rm t}^0 $ $\Delta M_{\rm t}^{\rm w} $ $\Delta M_{\rm t}^{\rm{NaCl}} $ -
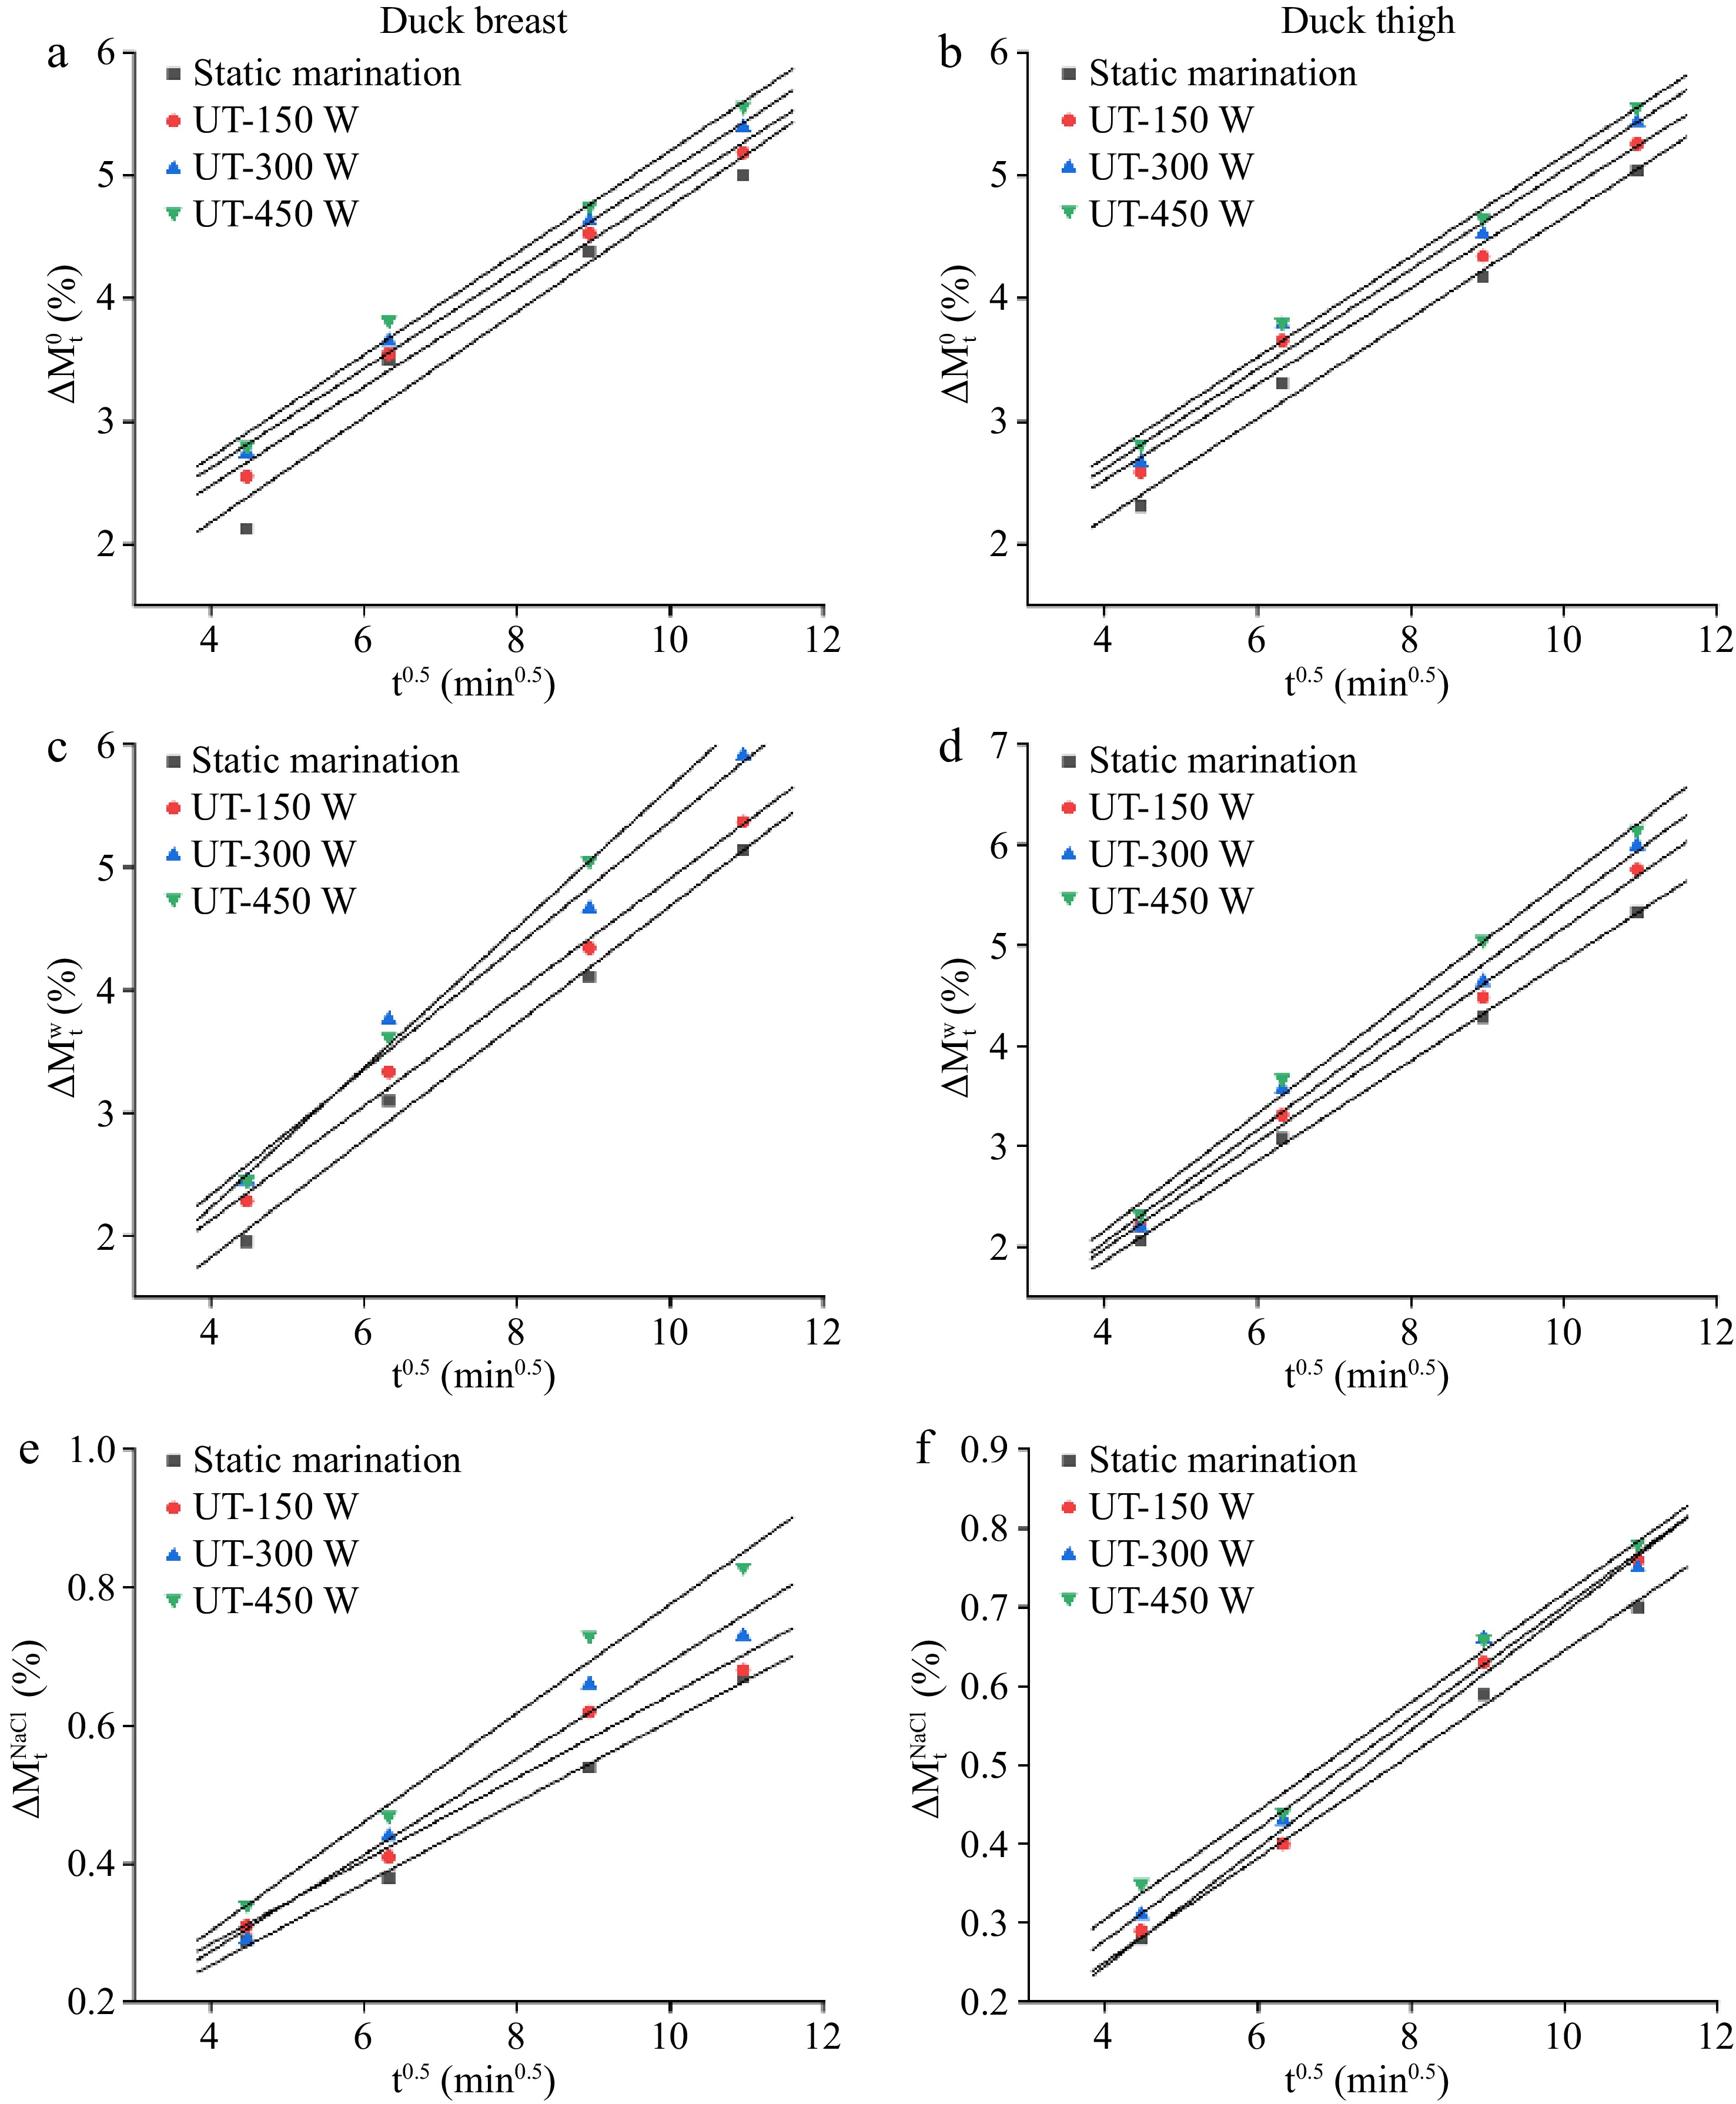
Figure 2.
Plot of (a), (b) total weight (
$\Delta M_{\rm t}^0 $ $\Delta M_{\rm t}^{\rm w} $ $\Delta M_{\rm t}^{\rm{NaCl}} $ -
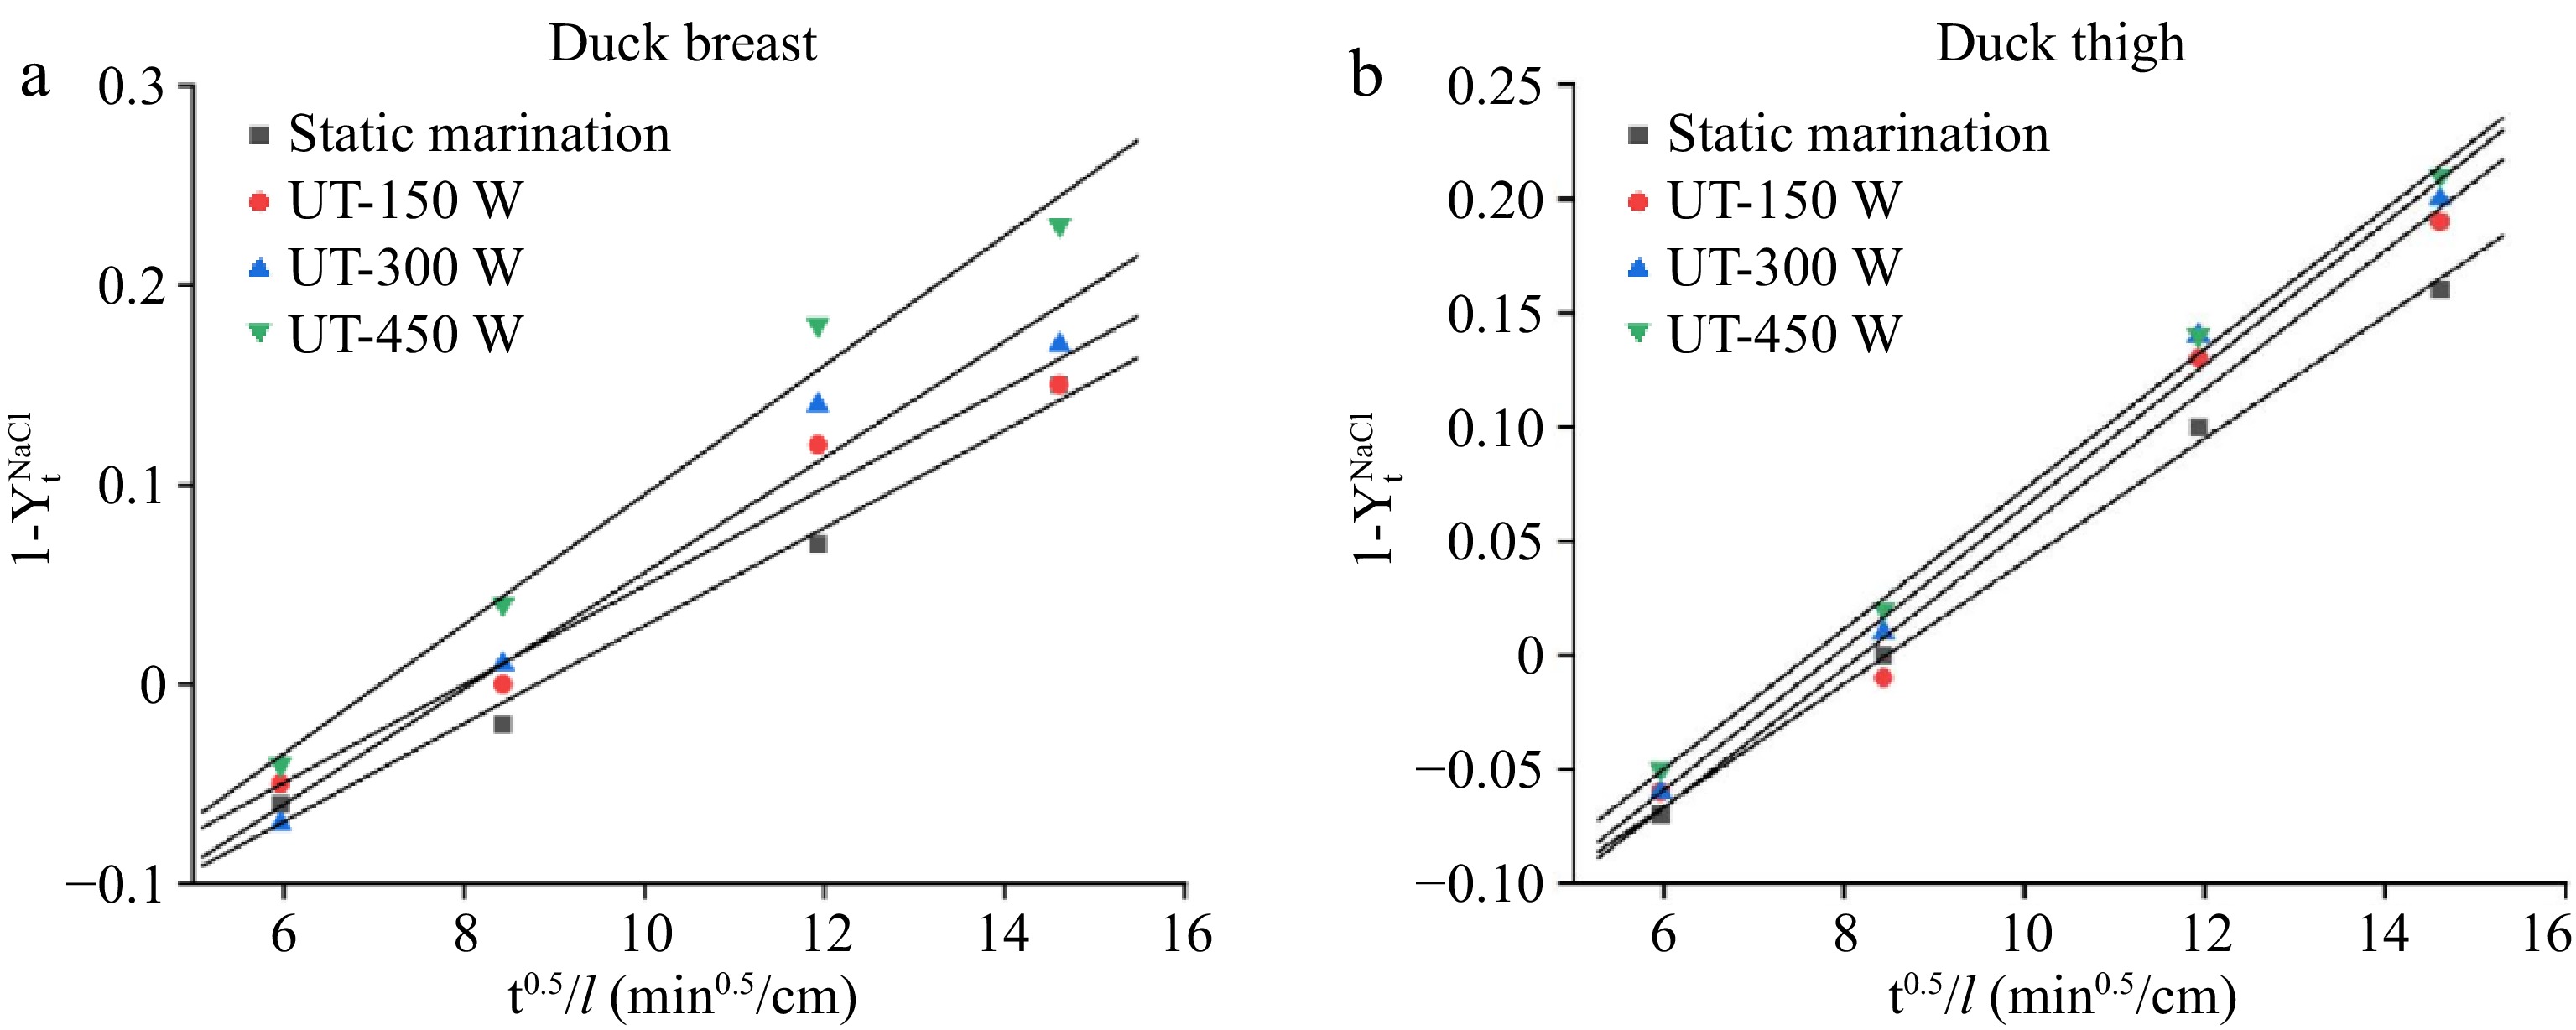
Figure 3.
Reduced driving force (
$1-Y_t^{NaCl} $ -
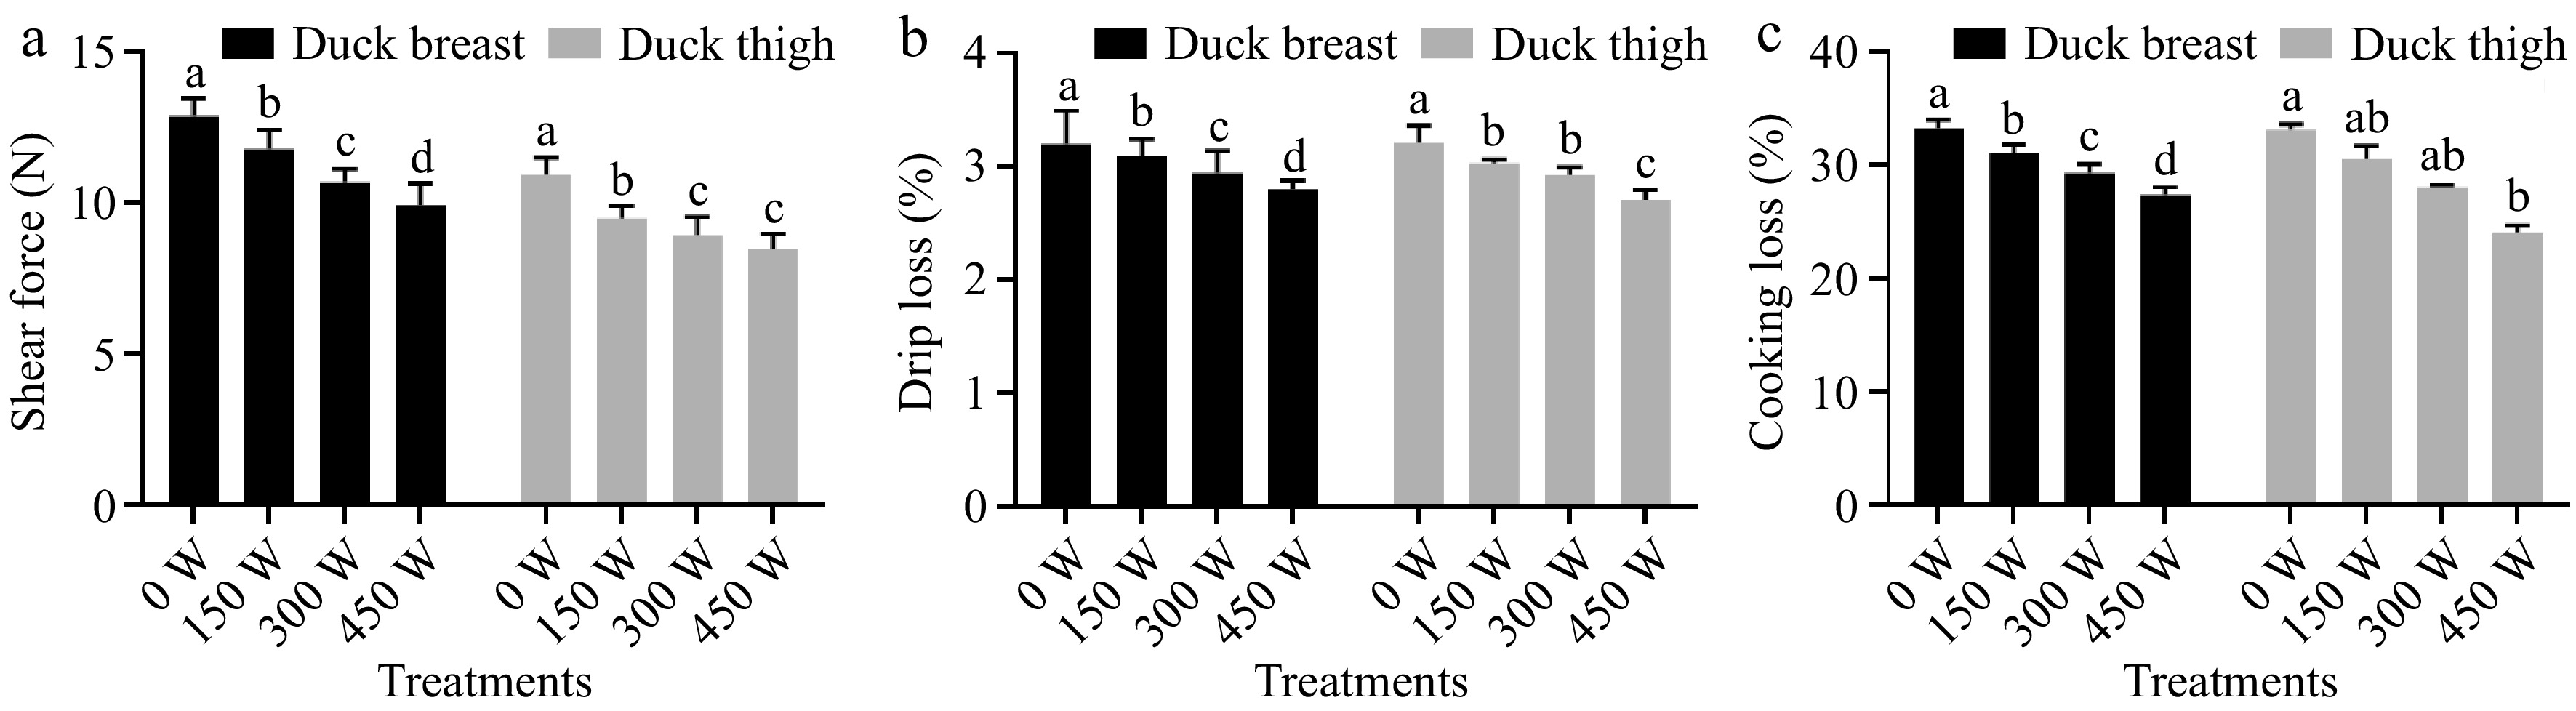
Figure 4.
Effects of different ultrasound treatments on (a) shear force, (b) drip loss and, (c) cooking loss of duck breast and thigh samples. Note: the letters a-d above the bars indicate the significant difference between samples within same muscle type (p < 0.05).
-
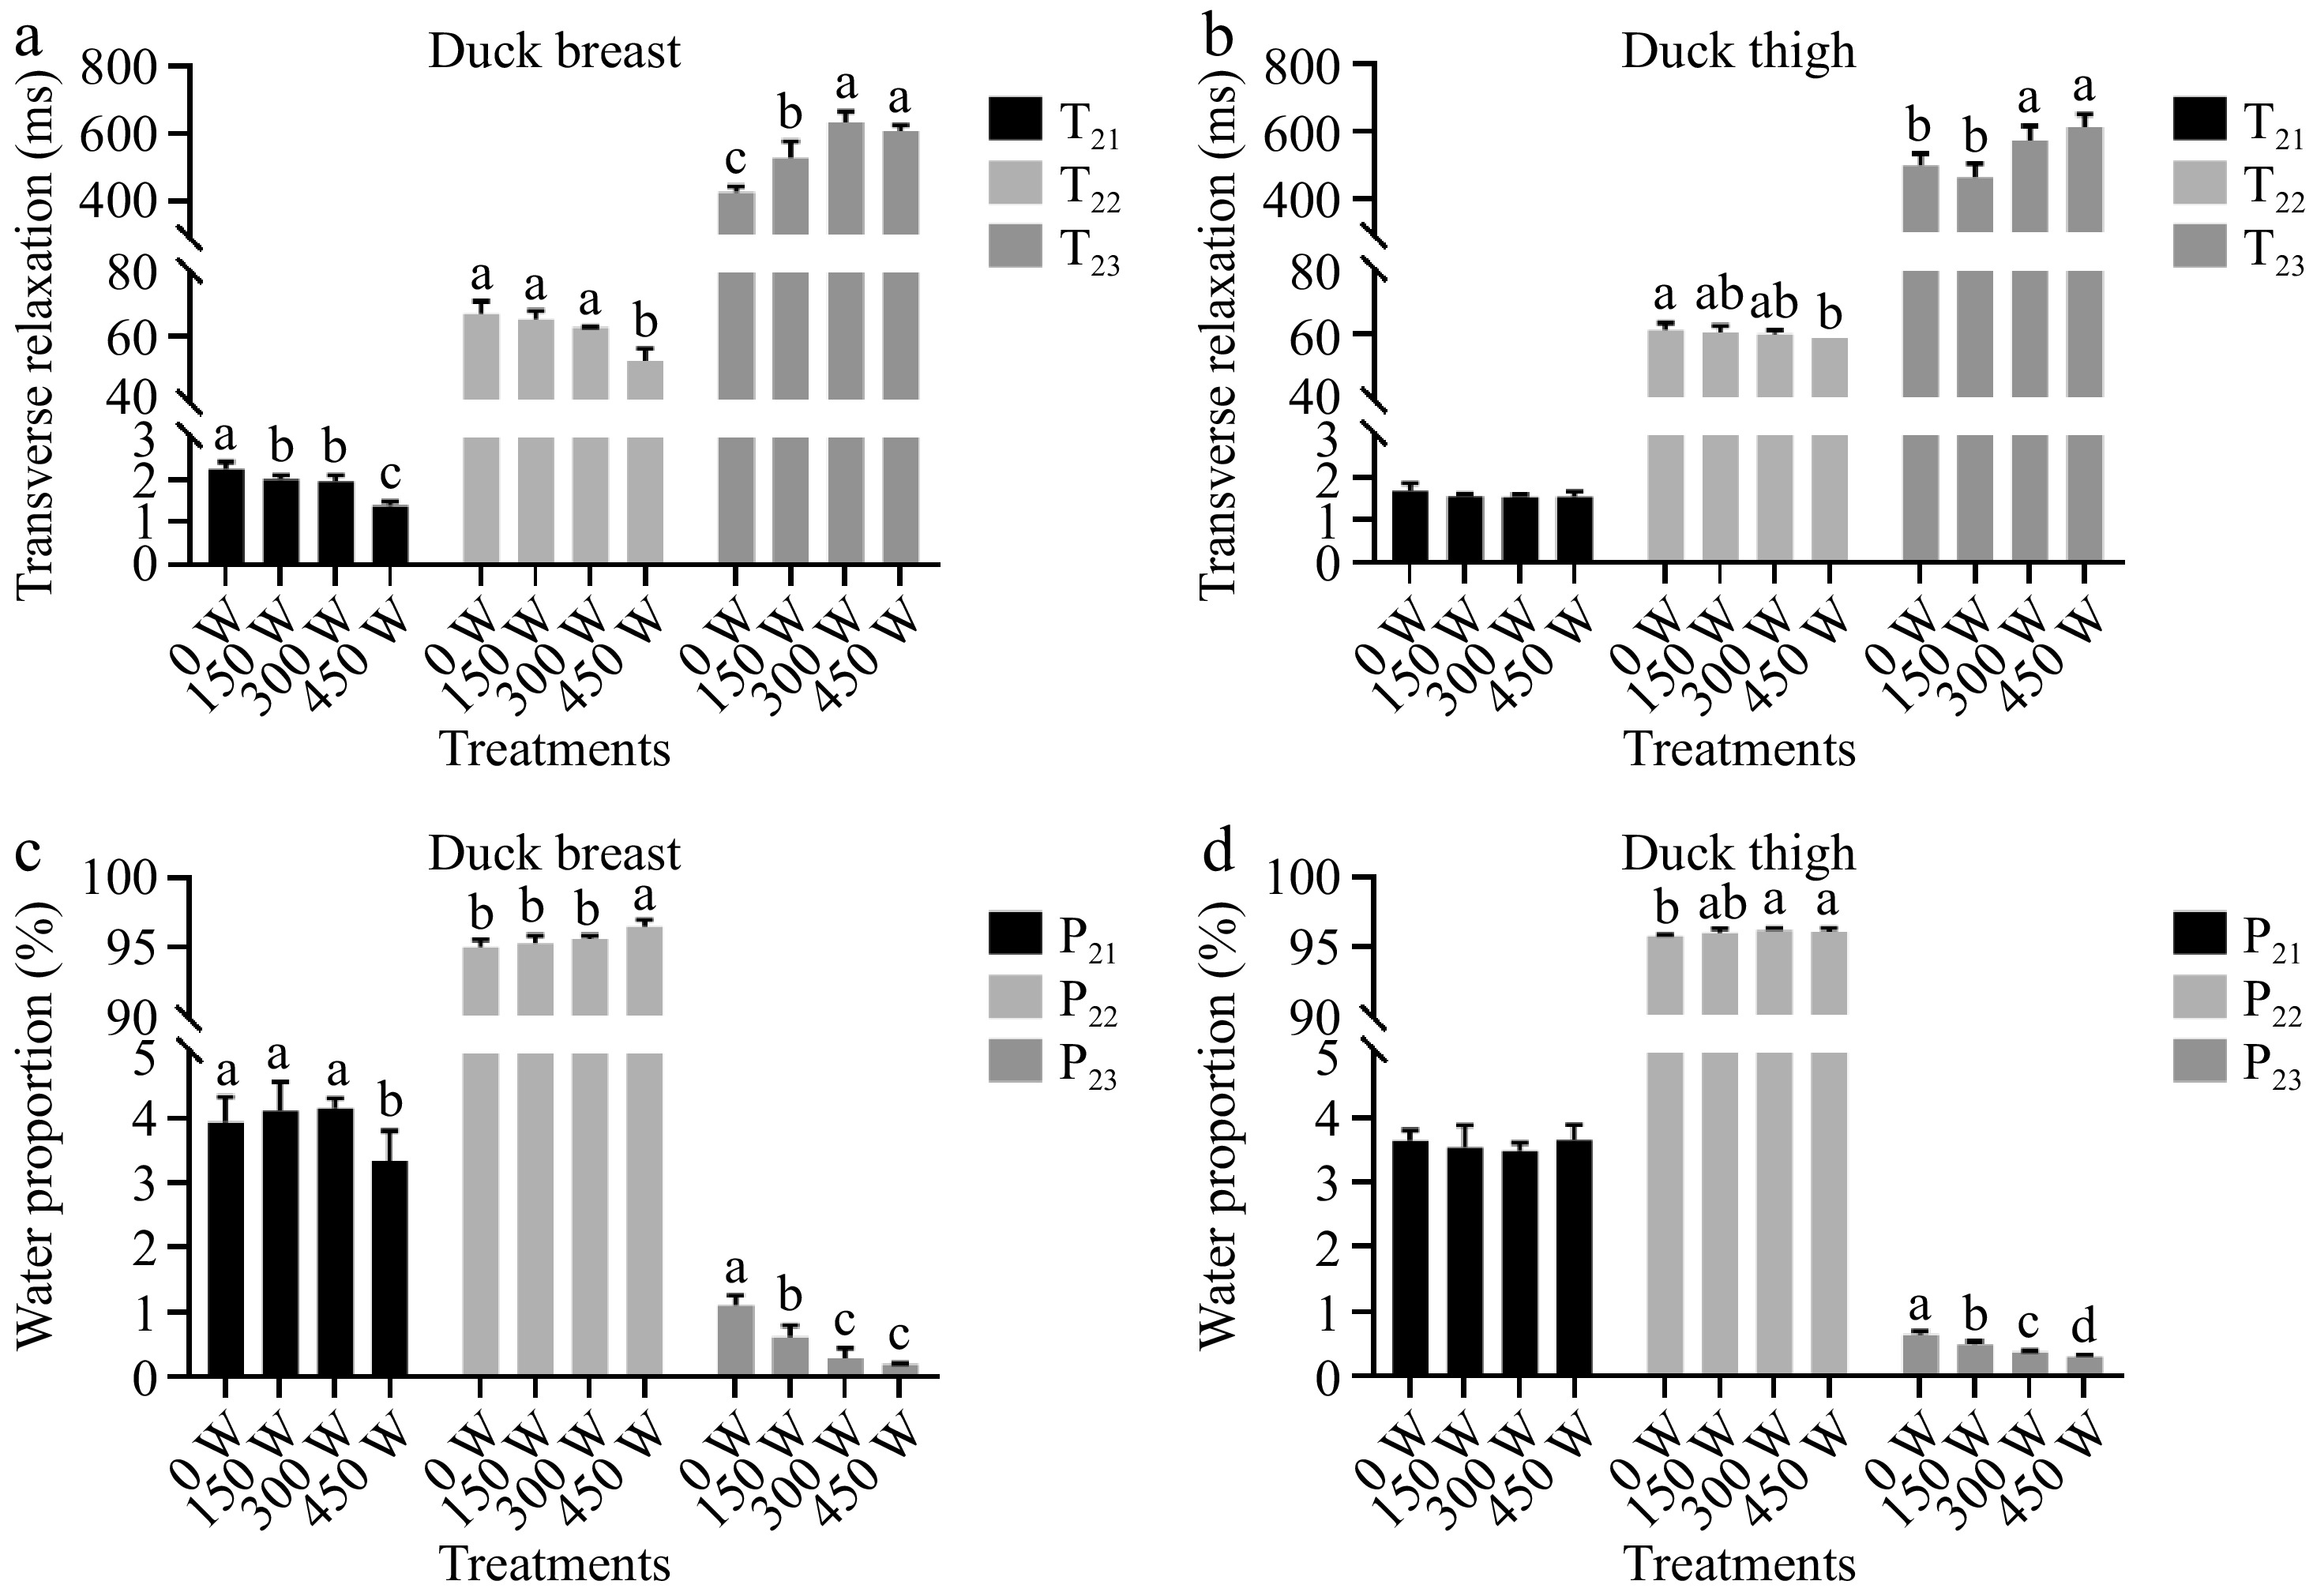
Figure 5.
(a), (b) Transverse relaxation time of water, and (c), (d) water proportion in three states of duck breast and thigh samples with different ultrasound treatments. Note: the letters a−d above the bars indicate the significant difference between samples within same muscle type (p < 0.05).
-
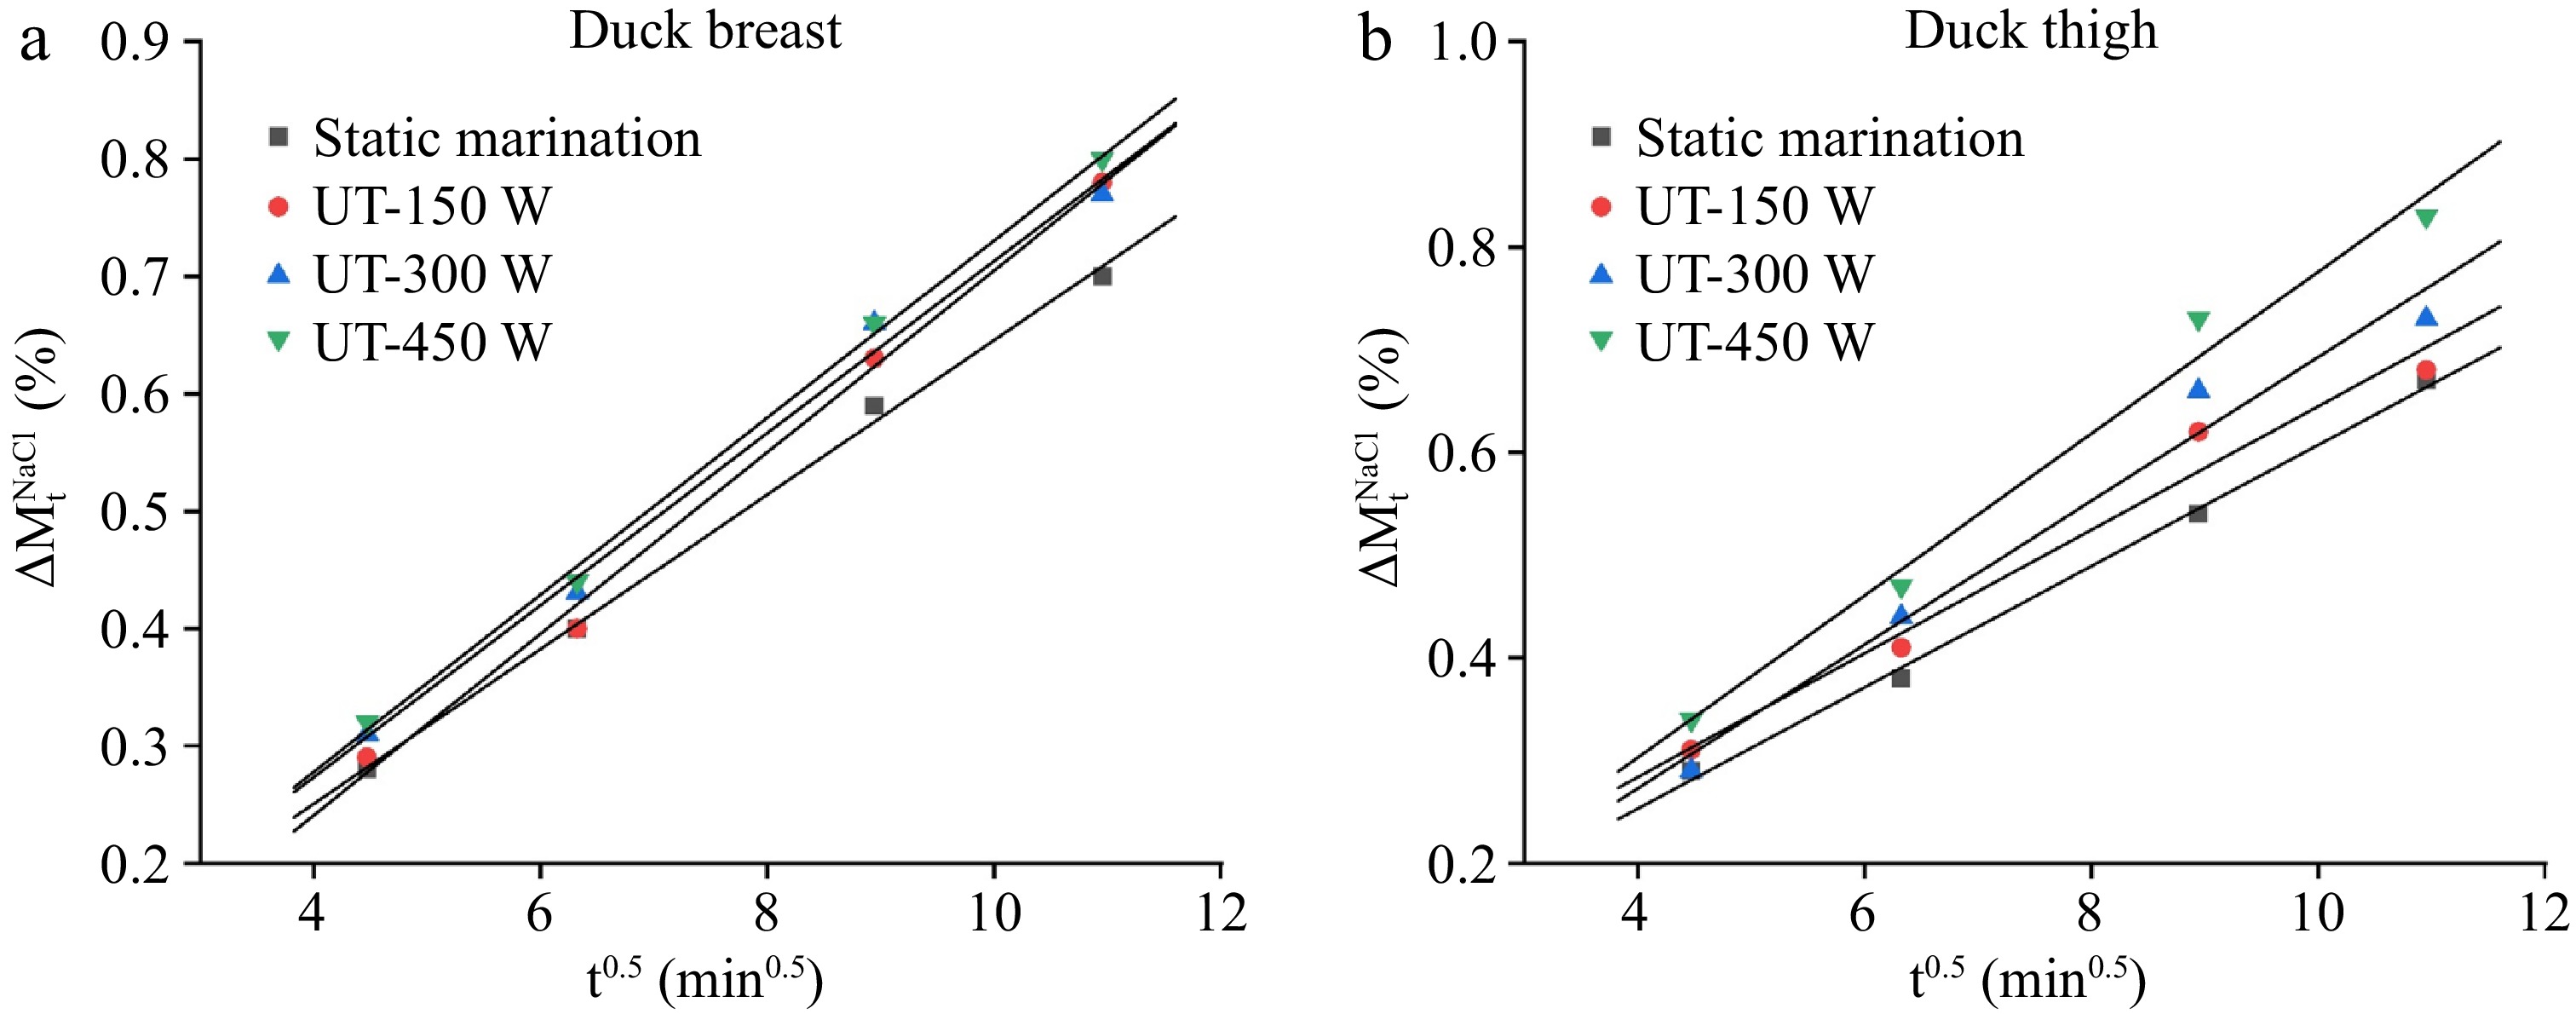
Figure 6.
The dynamic changes of transverse relaxation time (T2) of (a) duck breast, and (b) thigh samples with different ultrasound treatments.
-
Parameters Meat type Treatments Fitted equation k1 k2 R2 $\Delta M_{\rm t}^0 $ Duck breast Static marination y = 0.3912x + 0.5712 −0.4288 0.3912 0.987 150 W y = 0.3910x + 0.9575 −0.0425 0.3910 0.969 300 W y = 0.4054x + 0.9914 −0.0086 0.4054 0.971 450 W y = 0.4098x + 1.064 0.0640 0.4098 0.988 Duck thigh Static marination y = 0.3959x + 0.4646 −0.5354 0.3959 0.956 150 W y = 0.4014x + 0.8719 −0.1281 0.4014 0.984 300 W y = 0.4040x + 1.0041 0.0041 0.4040 0.994 450 W y = 0.4147x + 1.0449 0.0449 0.4157 0.988 $\Delta M_{\rm t}^{\rm w} $ Duck breast Static marination y = 0.4979x − 0.1329 −1.1329 0.4979 0.998 150 W y = 0.5336x − 0.1595 −1.1595 0.5336 0.993 300 W y = 0.5598x − 0.1953 −1.1953 0.5598 0.982 450 W y = 0.5813x − 0.1632 −1.1632 0.5813 0.993 Duck thigh Static marination y = 0.4620x − 0.0840 −1.0840 0.4620 0.988 150 W y = 0.4638x + 0.2714 −0.7286 0.4638 0.992 300 W y = 0.5068x + 0.3058 −0.6942 0.5068 0.974 450 W y = 0.5711x − 0.057 −1.0571 0.5711 0.999 $\Delta M_{\rm t}^{\rm{NaCl}} $ Duck breast Static marination y = 0.0659x − 0.0128 −1.0128 0.0659 0.996 150 W y = 0.0733x − 0.0450 −1.0530 0.0733 0.991 300 W y = 0.0733x − 0.0199 −1.0043 0.0733 0.989 450 W y = 0.0755x − 0.0240 −0.9708 0.0755 0.997 Duck thigh Static marination y = 0.0590x + 0.0171 −0.9829 0.0590 0.996 150 W y = 0.0602x + 0.0427 −0.9573 0.0602 0.964 300 W y = 0.0700x − 0.0071 −1.0071 0.0700 0.965 450 W y = 0.0789x − 0.0125 −1.0125 0.0789 0.979 Table 1.
Kinetic parameters for weight changes (
$\Delta M_{\rm t}^0 $ $\Delta M_{\rm t}^{\rm w} $ $\Delta M_{\rm t}^{\rm {NaCl}} $ -
Parameters Meat type Treatments De (×10−9 m2/s) K R2 Duck breast Static marination y = 0.0269x − 0.2275 0.9472 −0.2275 0.996 150 W y = 0.0305x − 0.2495 1.2177 −0.2495 0.976 300 W y = 0.0307x − 0.2454 1.2337 −0.2454 0.988 450 W y = 0.0311x − 0.2339 1.2661 −0.2339 0.996 Duck thigh Static marination y = 0.02455x − 0.2162 0.7889 −0.2162 0.982 150 W y = 0.02469x − 0.1976 0.7979 −0.1976 0.955 300 W y = 0.02903x − 0.2345 1.1031 −0.2345 0.950 450 W y = 0.03244x − 0.2294 1.3775 −0.2294 0.976 Table 2.
Modeling of NaCl transport in duck breast and thigh with different ultrasound treatments.
Figures
(6)
Tables
(2)