


-
Static wet marination and dry curing are conventional treatments for processing Chinese duck meat products, such as Nanjing salted duck, Nanjing pressed salted duck, sauced duck, cured duck, and so on. Traditional marination and curing processes are quite time-consuming, low efficiency and probably enzymatic softening, which also have a negative impact on the shelf-life of meat products[1]. To accelerate these processes, mechanical-assisted methods like tumbling and injecting are applied by many industries to produce traditional duck products. However, these fierce mechanical forces might cause muscle breakdown and deteriorate the appearance as well as the integrity of the final products[2]. Therefore, a more moderate but effective way is urgently needed to shorten the marination time.
In recent years, ultrasonic treatment (UT) has been widely noticed as a feasible and eco-friendly strategy to improve the quality and efficiency of the marination processing[3,4]. There are four major merits of ultrasonic treatment in terms of accelerating the marination process[5−7]: 1) acoustic cavitation: ultrasonic waves generate cavitation bubbles and then propagate in the liquid. These bubbles collapse rapidly and result in internal high acoustic pressure, which facilitates the brine penetration and mass migration; 2) mechanical effects: ultrasound waves also exert mechanical vibration around the meat-brine surface, contributing to muscle tissue rupture and thus muscle tenderness; 3) thermal effects: the acoustic cavitation bubbles vibrate and explode, which leads to obvious temperature rises and potentially protein structure modification; 4) reactive oxygen species generation: ultrasonic treatment could increase H2O2 and ROS production, including hydroxyl radicals (·OH), hydroperoxyl radicals (·HO2), and O2, promoting the moderate oxidation reaction, which might positively affect the functionality of meat protein.
Ultrasonic-assisted treatment is widely applied in poultry meat production, during which the frequency, intensity, treating time are all closely related to the efficiency of mass transfer. Inguglia et al.[8] and Tong et al.[9] have verified that ultrasonic treatment could promote sodium salt, phosphate salt, and water transfer towards chicken breast meat, and under the same amount of time, the ultrasonic marinated chicken breast with increased frequency showed significantly higher sodium uptake compared to low frequency and untreated groups. Combining UT during duck preservation not only inhibits the physicochemical quality deterioration of sauced duck, but also lowers the microbiology growth at 4 °C[10].
It is noticeable that the muscle merit of duck thigh is quite different from duck breast. As reported, the muscle fiber phenotype and composition of poultry thigh meat are distinctive from breast meat, leading to various meat tissue matrices and inter-/intra- muscular fat in muscles. The leg muscle of avians is mainly composed of slow fiber, while the breast muscle is mainly composed of fast fiber. Therefore, the physical properties, tenderness, and water-holding capacity of various duck muscle types are greatly different[11]. Gong et al.[12] have also found that the duck thigh showed a much higher pH value compared to breast meat. Hence, it is easy to predicted that the mass transfer kinetics and physicochemical properties of duck meat are affected by muscle type.
Therefore, the objective of this work is to: 1) investigate the effect of ultrasonic assistant with different powers on the mass transfer of both duck breast and thigh marination process and establish marinating kinetic models; 2) to compare the shear force, drip loss, cooking loss, and water distribution of ultrasonic-marinated duck with static-marinated sample. The results of this study will provide fundamental data for efficiently producing low-salt duck products.
-
Samples of duck breast and duck thigh muscle were acquired from Cherry Valley ducks from large meat producers. Samples were placed at −18 °C for less than a week and thawed at 4 °C overnight before using. Before marination, the visually obvious fat and connective tissues were removed, and both breast and thigh counterparts were cut into 4 cm × 2 cm × 1 cm (8 cm3) cubes. These meat samples were treated and analyzed immediately.
Ultrasonic assisted marination
-
The ultrasonic marination was performed in a non-contact ultrasonic multi-faceted dispersion instrument (LC-1500W, Ningbo, China). All the breast and thigh meat cubes were randomly separated into four groups and then ultrasonic-assisted-marinated under 0, 150, 300, and 400 W power for 20, 40, 80, and 120 min at a frequency of 20 kHz. To inhibit the excessive salt penetration, the meat samples were immersed in a marination brine with 2.5% NaCl, and the ratio between samples and salt solution was set as 1:2 as preliminary determined. The bath temperature was maintained constant at 4 °C during the ultrasonic application.
Mass transfer kinetics
Changes in total weight, salt, and water content during marination
-
The water content of duck meat samples during ultrasonic assisted marination was determined using direct drying methods as described in GB 5009.3-2016. The salt content was carried out according to Zhang et al.[13].
To evaluate the salt content in marinated samples, the meat was minced and ~5 g paste was then removed into 50 ml centrifuge tubes. Adding 3 times deionized water and vortexing for 24 h to let the salt fully extracted into water. The total salt content was then measured by a hand-held salinity meter (PAL-SALT, Atago Co., Ltd., Japan).
Changes in total weight, water weight, and salt weight at t times were calculated using the following Eqns (1−3):
$ \Delta {M}_{\text{t}}^{0}=\dfrac{{M}_{t}^{0}-{M}_{0}^{0}}{{M}_{0}^{0}}\times 100 $ (1) $ \Delta {M}_{\text{t}}^{W}=\dfrac{{M}_{t}^{0}\times {X}_{\text{t}}^{W}-{M}_{0}^{0}\times {X}_{0}^{W}}{{M}_{0}^{0}}\times 100 $ (2) $ \Delta {M}_{\text{t}}^{N\text{a}Cl}=\dfrac{{M}_{t}^{0}\times {X}_{\text{t}}^{NaCl}-{M}_{0}^{0}\times {X}_{0}^{NaCl}}{{M}_{0}^{0}}\times 100 $ (3) Where,
$M_0^0 $ $M_t^0 $ $X_0^{\rm W} $ $X_t^{\rm W} $ $X_0^{\rm{NaCl}} $ $X_t^{\rm{NaCl}} $ Mass transfer modeling and fitting evaluation
-
(1) To delineate the mass transfer behavior during ultrasonic-assisted marination, the following model (Eqn 4) as previously reported, was used to fit the changes in total weight, moisture content, and NaCl content[14]. Accordingly, the mass changes are linear related to the square root of marination time.
$ \Delta M_{\text{t}}^i = 1 + {k_1} + {k_2} \times {t^{0.5}} $ (4) Where,
$\Delta M_{\text{t}}^i$ $\Delta M_{\text{t}}^0$ $\Delta M_{\text{t}}^w$ $\Delta M_{\text{t}}^{NaCl}$ (2) The salt equilibrium equation (Eqn 5) was also applied to describe the mass transfer process[15]. The NaCl contents in the brine (
$y_{e}^{{NaCl}} $ $Z_{e}^{{NaCl}} $ $ Z_{\text{e}}^{NaCl} = y_e^{NaCl} = \dfrac{{\dfrac{{M_0^{SD}}}{{M_0^{SS}}} \times X_0^{NaCl} + y_0^{NaCl}}}{{\dfrac{{M_0^{SD}}}{{M_0^{SS}}} \times (X_0^w + X_0^{NaCl}) + (y_0^w + y_0^{NaCl})}} $ (5) Where,
$X_0^w $ $X_0^{NaCl} $ $y_0^w $ $y_0^{NaCl} $ $M_0^{SD} $ $M_0^{SS} $ (3) As reported by Gallart-Jornet et al.[14], to correct the effect of hydrodynamic mechanisms on the deviation of the adjusted equation from the coordinate’s origin and diminish mass transfer phenomena occurring at the very beginning of the marination, the integrated solution of Fick's equation for a semi-infinite slab was introduced with an independent term K. The changes in the
$Z^{NaCl} $ $y^{NaCl} $ $ 1-{Y}_{\text{t}}^{NaCl}=1-\left[\dfrac{{Z}_{t}^{NaCl}-{\text{y}}_{t}^{\text{NaCl}}}{{Z}_{0}^{NaCl}-{\text{y}}_{e}^{\text{NaCl}}}\right]=2\times {\left(\dfrac{De\times t}{\pi \times {l}^{2}}\right)}^{0.5}+K $ (6) Where,
$1-Y_t^{NaCl} $ $Z_0^{NaCl} $ $Z_t^{NaCl} $ $Z_e^{NaCl} $ Shear forces
-
After marination, the raw meat cubes were placed in a digital meat tenderness meter (C-LM3B, Northeast Agricultural University, Harbin, China) under room temperature. Each samples were shear at three locations and the averages were calculated as the shear forces.
Water loss
Drip loss
-
The pieces of marinated duck meat were weighed and the weight was recorded as m1. A hook was used under the lid to hang the meat slice, which was then put in a PVA plastic bag, tightly sealed, and stored at 4 °C for 24 h. After storage, the slice of meat was carefully dabbed and weighed (recorded as m2). The drip loss was calculated using the following equation:
$ Drip\;loss=\dfrac{{m}_{1}-{m}_{2}}{{m}_{1}}\times 100{\text{%}} $ Cooking loss
-
The marinated duck meat samples were placed in a plastic bag after carefully weighed (recorded as m3). The sealed samples were heated in a 80 °C water bath for 15 min until the core temperature of meat reached > 75 °C. The surface of these thermally treated meat was dabbed and weighed again (recorded as m4). The cooking loss was calculated using the following equation:
$ Cooking\;loss=\dfrac{{m}_{3}-{m}_{4}}{{m}_{3}}\times 100{\text{%}} $ Low-field nuclear magnetic resonance (LF-NMR)
-
The marinated duck meat sample was trimmed to 4 cm × 1 cm × 1 cm (4 cm3) cubes, wrapped with plastic film and then placed in a cylindrical glass tube (d = 15 mm) with a resonant frequency of 21.0 MHz by an LF-NMR analyzer (MesoMR23, Newsmy, Suzhou). The transverse relaxation time (T2) was measured using a Carr-Purcell-Meiboom-Gill (CPMG) with the following parameters: temeprature = 32 °C, testing time = 200 ms, interval time = 4,000 ms, and NECH = 4,000. The resulting attenuation curve was subjected to an inversion operation with MultiExp Inv Analysis software (Niumag Electric Corporation, Suzhou, China).
Statistical analysis
-
Statistical analysis were carried out using one-way ANOVA with SPSS software (version 26.0, IBM Co., USA). The significant difference between treatments was determined using Duncan’s multiple range test. The fitting process of mass transfer kinetics was performed using a simple linear regression (least square) using the Origin program. A statistical significance was defined as p < 0.05.
-
During the marination process, the mass transfer mainly occurred between meat samples and salt solution, and was manifested by the diffusion of small molecules (i.e. moisture, salt, etc.). The rate of total weight change, water change, and NaCl change with different ultrasound conditions is shown in Fig. 1. The changes in total weight (
$\Delta M_{\text{t}}^0$ $\Delta M_{\text{t}}^0$ $\Delta M_{\text{t}}^w$ $\Delta M_{\text{t}}^{NaCl}$ $\Delta M_{\text{t}}^w$ $\Delta M_{\text{t}}^{NaCl}$ 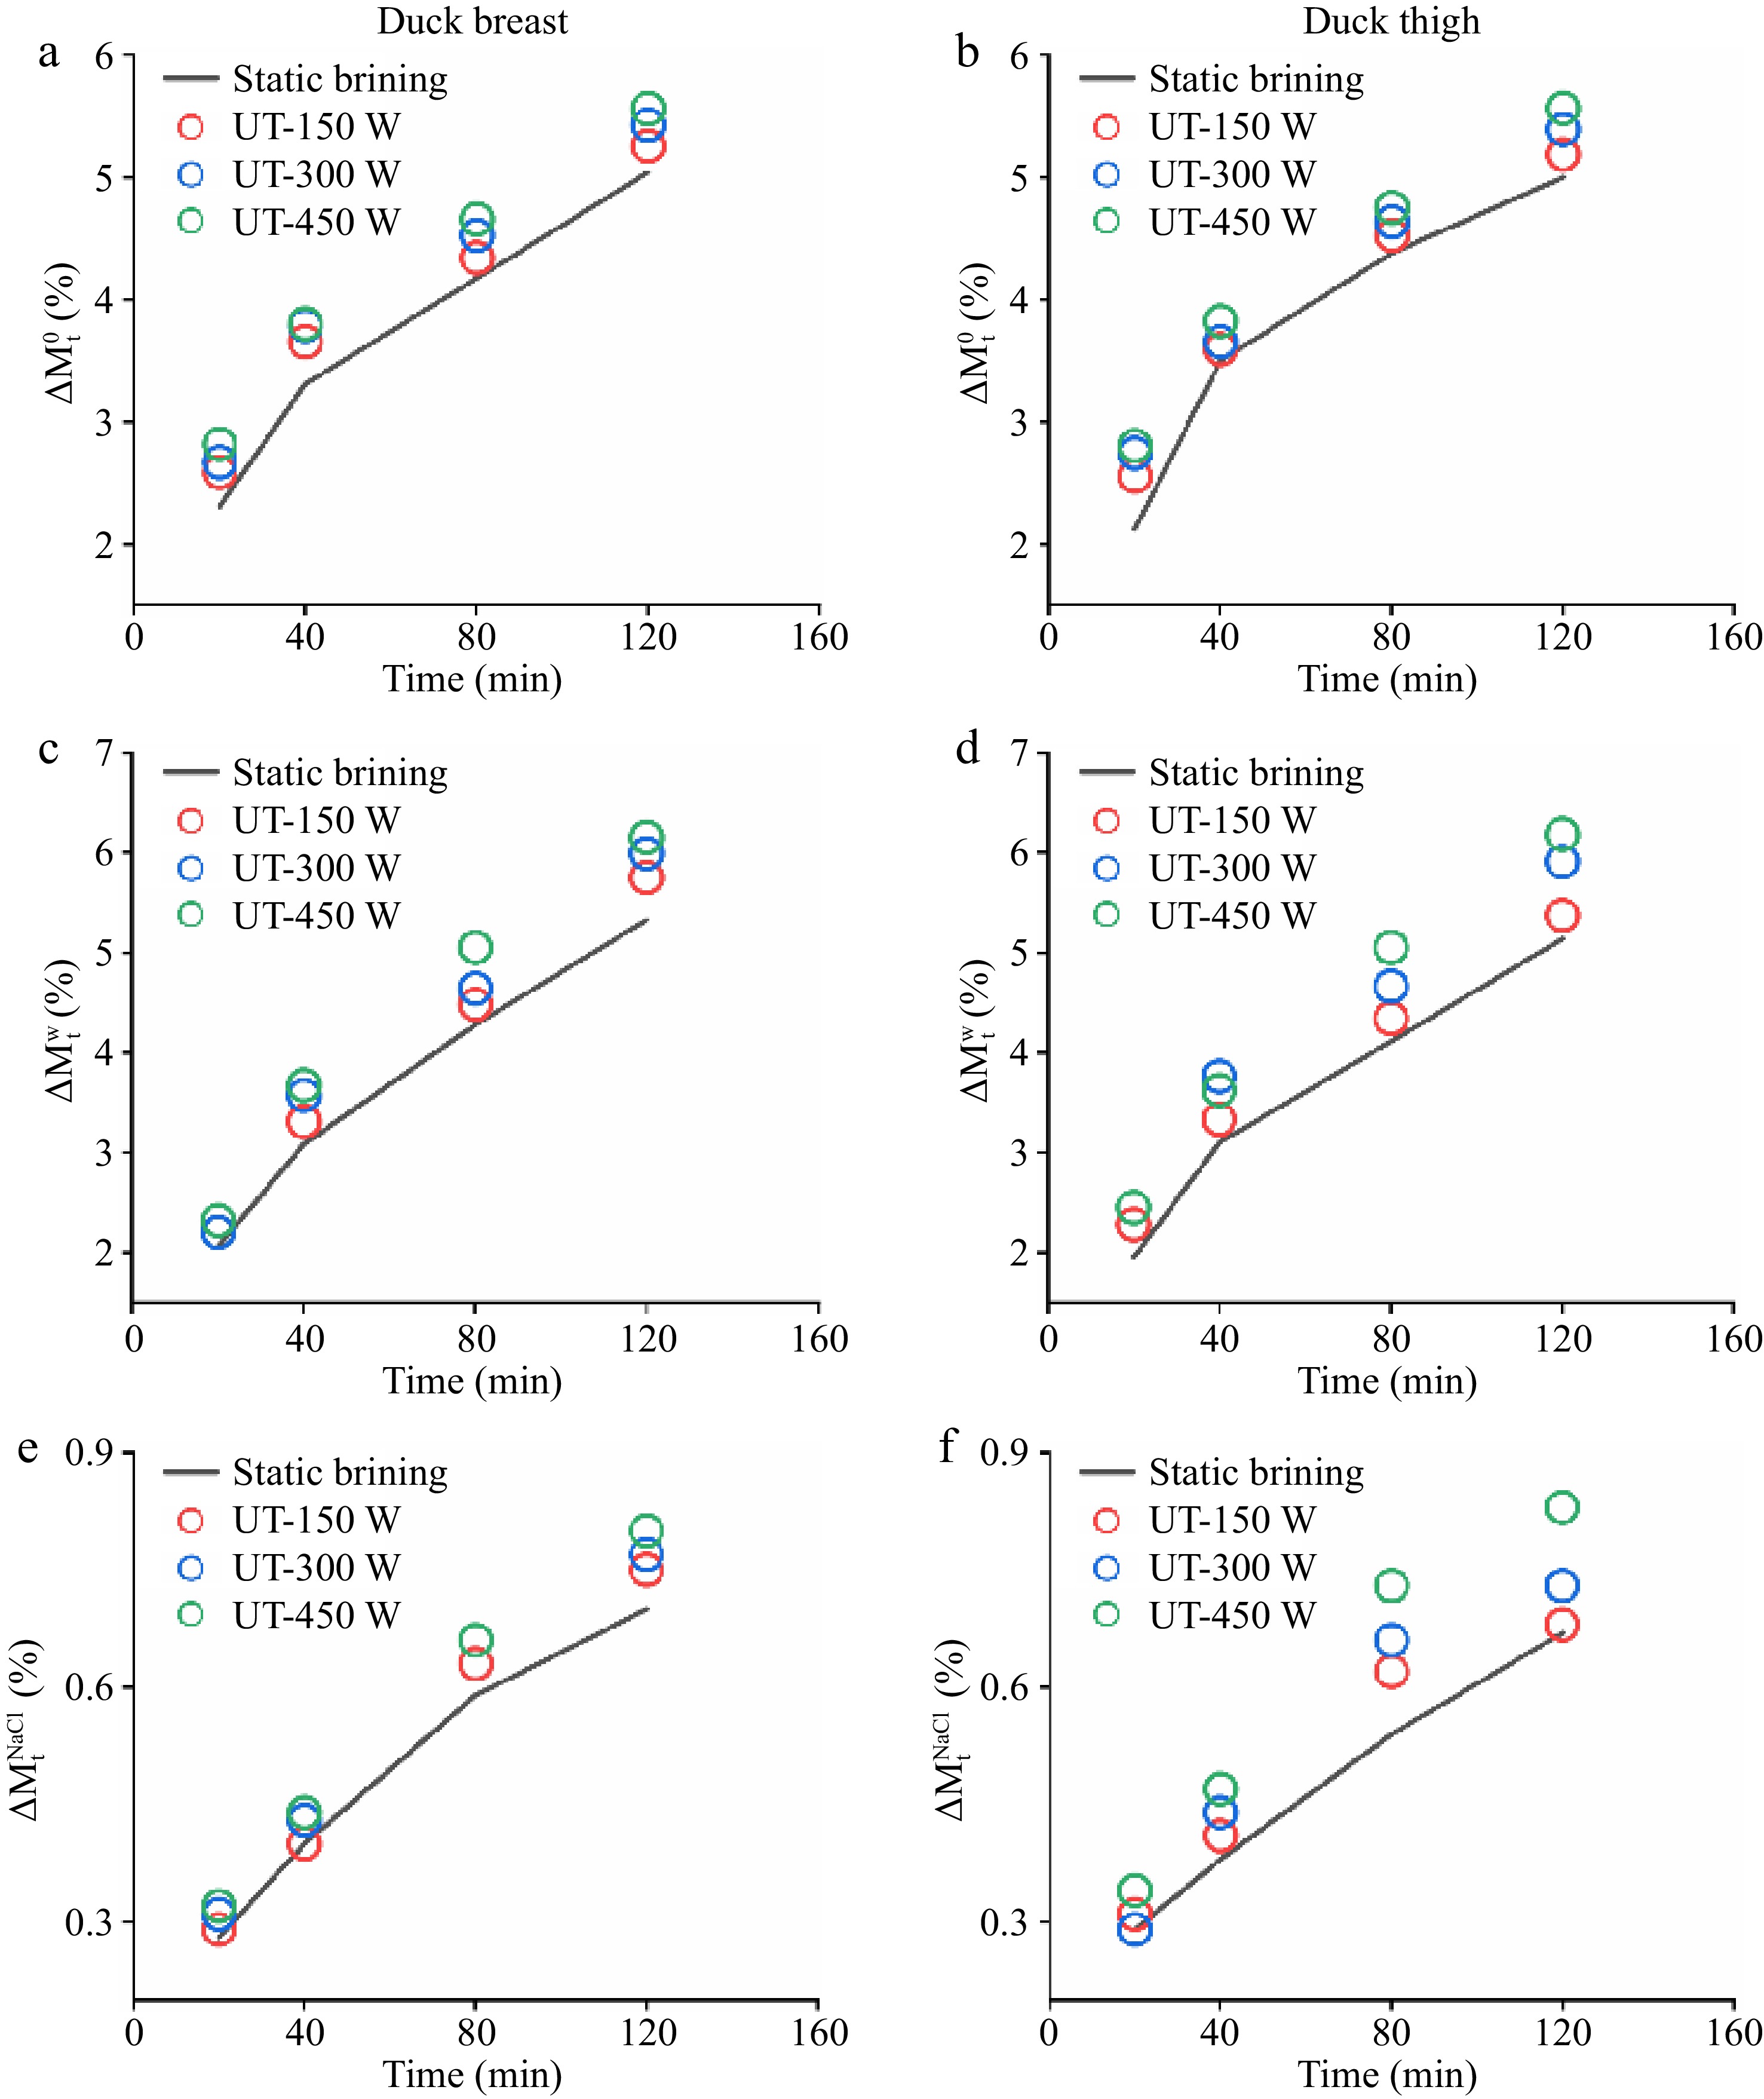
Figure 1.
(a), (b) Total weight changes ($\Delta M_{\rm t}^0 $), (c), (d) water weight changes ($\Delta M_{\rm t}^{\rm w} $), and (e), (f) NaCl weight changes ($\Delta M_{\rm t}^{\rm{NaCl}} $) in duck breast and thigh samples with different ultrasound treatments.
Mass transfer kinetics
-
The linear relationship between the weight changes and the square root of time (t0.5) of duck samples under different ultrasonic conditions is shown in Fig. 2. Table 1 displays the fitted equations obtained from the liner relationship (Fig. 2) and the values of mass transfer kinetics parameters (k1 and k2). The coefficient of determination (R2) of the experimental kinetic model achieved percentages of explained variance for the total, moisture, and NaCl weight changes, ranging from 95.6% to 99.8%. These results suggested that this model could be used to well fit the relationship of substances between the mass transfer process and marination time.
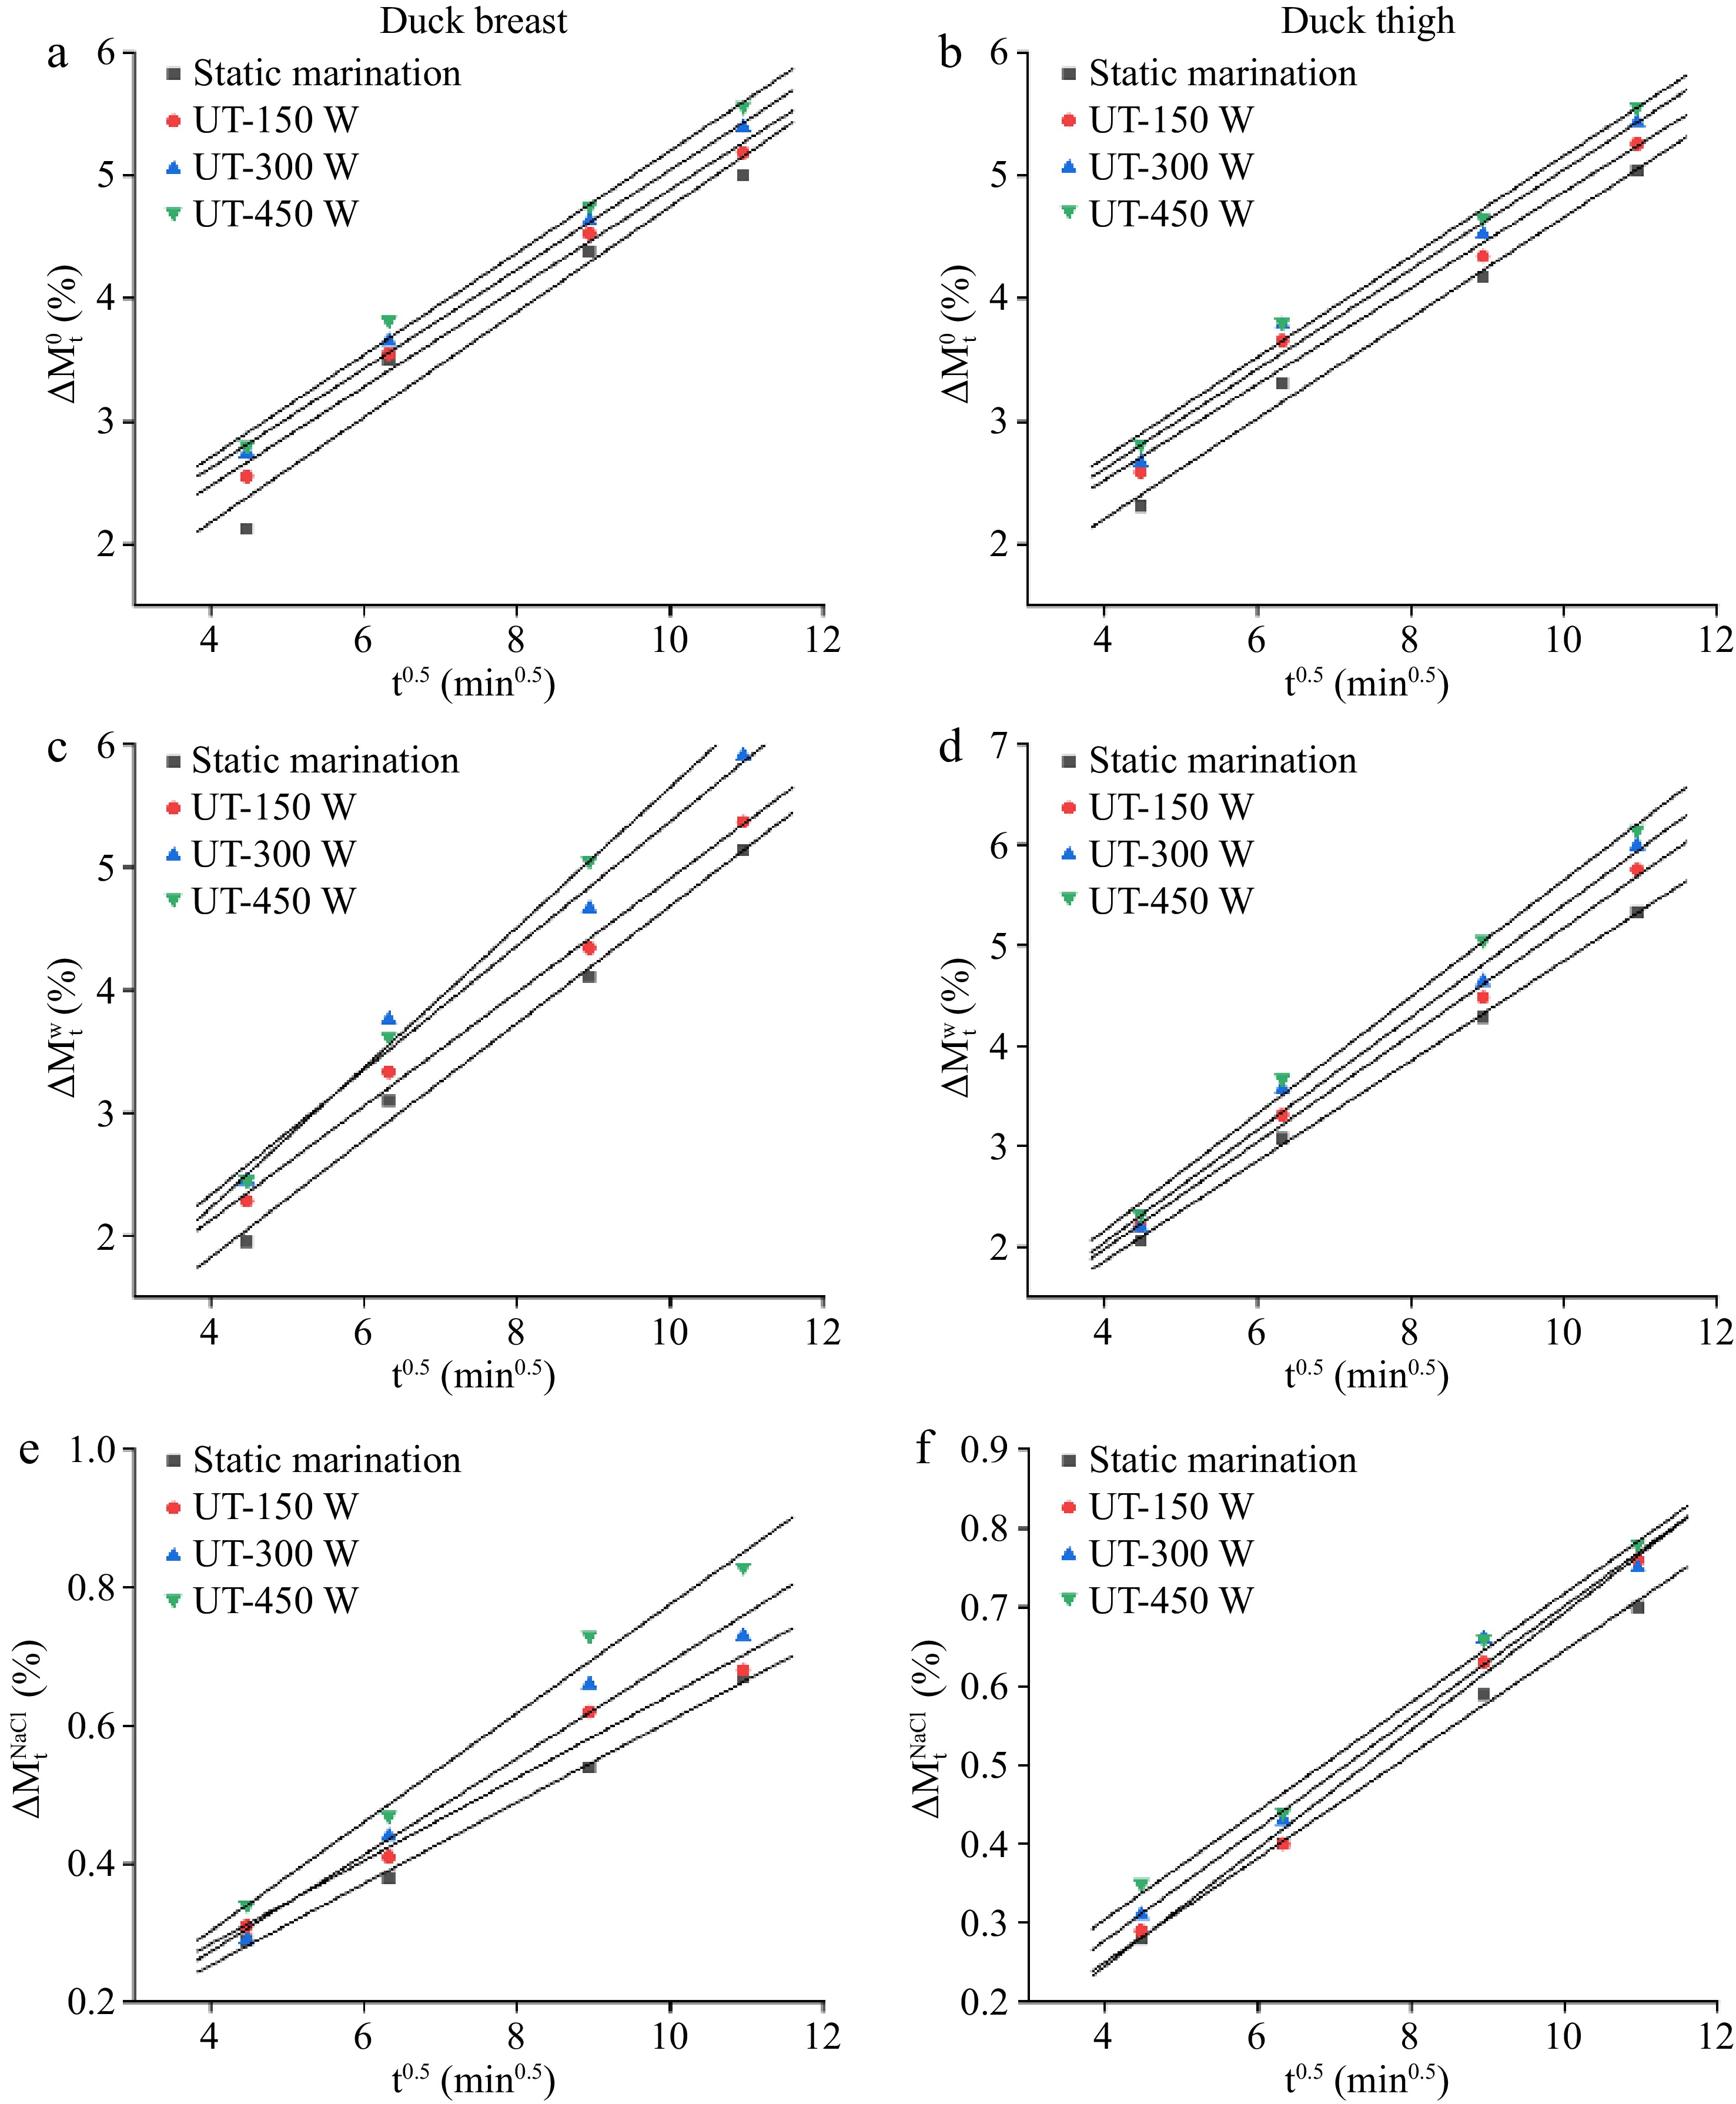
Figure 2.
Plot of (a), (b) total weight ($\Delta M_{\rm t}^0 $), (c), (d) water weight ($\Delta M_{\rm t}^{\rm w} $), and (e), (f) NaCl weight changes ($\Delta M_{\rm t}^{\rm{NaCl}} $) vs the square root of time (t0.5) in duck breast and thigh samples with different ultrasound treatments.
Table 1. Kinetic parameters for weight changes ($\Delta M_{\rm t}^0 $), water weight changes ($\Delta M_{\rm t}^{\rm w} $), and NaCl weight changes ($\Delta M_{\rm t}^{\rm {NaCl}} $) in duck samples with different ultrasound treatments.
Parameters Meat type Treatments Fitted equation k1 k2 R2 $\Delta M_{\rm t}^0 $ Duck breast Static marination y = 0.3912x + 0.5712 −0.4288 0.3912 0.987 150 W y = 0.3910x + 0.9575 −0.0425 0.3910 0.969 300 W y = 0.4054x + 0.9914 −0.0086 0.4054 0.971 450 W y = 0.4098x + 1.064 0.0640 0.4098 0.988 Duck thigh Static marination y = 0.3959x + 0.4646 −0.5354 0.3959 0.956 150 W y = 0.4014x + 0.8719 −0.1281 0.4014 0.984 300 W y = 0.4040x + 1.0041 0.0041 0.4040 0.994 450 W y = 0.4147x + 1.0449 0.0449 0.4157 0.988 $\Delta M_{\rm t}^{\rm w} $ Duck breast Static marination y = 0.4979x − 0.1329 −1.1329 0.4979 0.998 150 W y = 0.5336x − 0.1595 −1.1595 0.5336 0.993 300 W y = 0.5598x − 0.1953 −1.1953 0.5598 0.982 450 W y = 0.5813x − 0.1632 −1.1632 0.5813 0.993 Duck thigh Static marination y = 0.4620x − 0.0840 −1.0840 0.4620 0.988 150 W y = 0.4638x + 0.2714 −0.7286 0.4638 0.992 300 W y = 0.5068x + 0.3058 −0.6942 0.5068 0.974 450 W y = 0.5711x − 0.057 −1.0571 0.5711 0.999 $\Delta M_{\rm t}^{\rm{NaCl}} $ Duck breast Static marination y = 0.0659x − 0.0128 −1.0128 0.0659 0.996 150 W y = 0.0733x − 0.0450 −1.0530 0.0733 0.991 300 W y = 0.0733x − 0.0199 −1.0043 0.0733 0.989 450 W y = 0.0755x − 0.0240 −0.9708 0.0755 0.997 Duck thigh Static marination y = 0.0590x + 0.0171 −0.9829 0.0590 0.996 150 W y = 0.0602x + 0.0427 −0.9573 0.0602 0.964 300 W y = 0.0700x − 0.0071 −1.0071 0.0700 0.965 450 W y = 0.0789x − 0.0125 −1.0125 0.0789 0.979 The k1 value describes the behavior at the beginning of the mass transfer, which is related to the salt concentration and hydrodynamic mechanism[14]. The k2 value is associated with the kinetics of the diffusion mechanism and the product yield and reflects the increase of total, water and NaCl weight and mass transfer diffusion efficiency[20]. As shown in Table 1, the k1 values of
$\Delta M_{\text{t}}^0$ $\Delta M_{\text{t}}^w$ $\Delta M_{\text{t}}^{NaCl}$ $\Delta M_{\text{t}}^w$ $\Delta M_{\text{t}}^{NaCl}$ $\Delta M_{\text{t}}^0$ $\Delta M_{\text{t}}^w$ $\Delta M_{\text{t}}^{NaCl}$ $\Delta M_{\text{t}}^0$ $\Delta M_{\text{t}}^{NaCl}$ Salt diffusion coefficients (De) and calculation of other kinetic parameters
-
The NaCl content of duck breast and thigh meat at the equilibrium of marination could be calculated by the above-mentioned Eqn (5) as 2.633% and 2.629%, respectively. According to Fick’s second law equation, the
$1-Y_t^{NaCl} $ 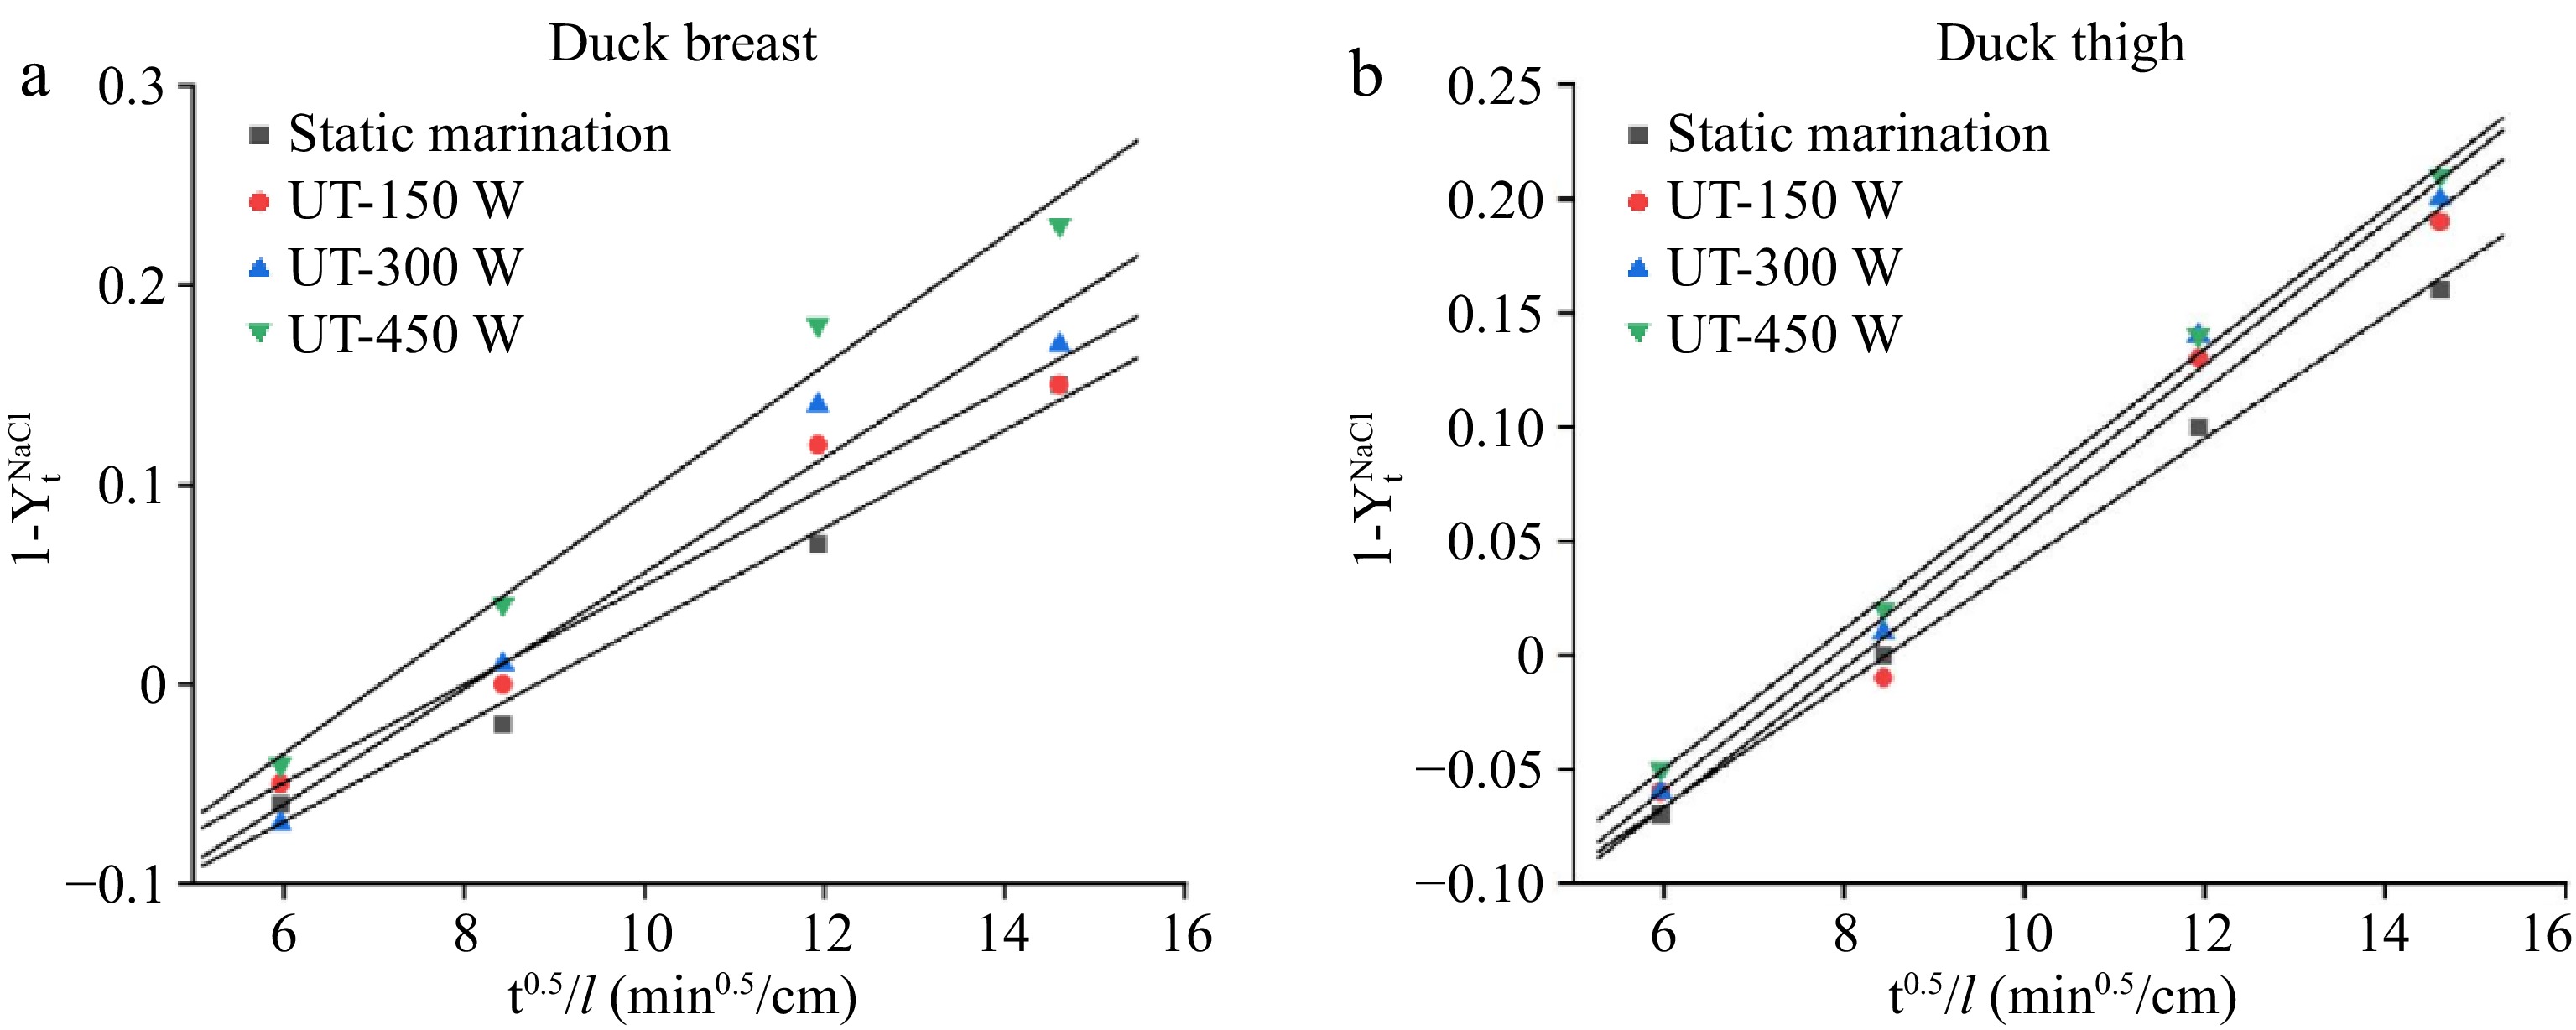
Figure 3.
Reduced driving force ($1-Y_t^{NaCl} $) vs t0.5/l in (a) duck breast, and (b) thigh samples with different ultrasound treatments.
Table 2. Modeling of NaCl transport in duck breast and thigh with different ultrasound treatments.
Parameters Meat type Treatments De (×10−9 m2/s) K R2 Duck breast Static marination y = 0.0269x − 0.2275 0.9472 −0.2275 0.996 150 W y = 0.0305x − 0.2495 1.2177 −0.2495 0.976 300 W y = 0.0307x − 0.2454 1.2337 −0.2454 0.988 450 W y = 0.0311x − 0.2339 1.2661 −0.2339 0.996 Duck thigh Static marination y = 0.02455x − 0.2162 0.7889 −0.2162 0.982 150 W y = 0.02469x − 0.1976 0.7979 −0.1976 0.955 300 W y = 0.02903x − 0.2345 1.1031 −0.2345 0.950 450 W y = 0.03244x − 0.2294 1.3775 −0.2294 0.976 Shear forces changes
-
Compared to duck breast meat, duck thigh meat had lower shear stress, indicating a tender meat structure (Fig. 4). Hudaet al.[24] found the same results in that the texture of the breast part was tougher than the thigh in both Peking and Muscovy duck. The shear stress of duck breast meat was significantly decreased (p < 0.05) from 12.90 to 10.03 N along with ultrasonic power increasing from 0 to 450 W. While for duck thigh meat, the 300 W and 450 W ultrasonic-treated samples exhibited similar (p > 0.05) shear stress (8.93 and 8.49 N, respectively), indicating a similar tenderness. It is also observed that the 300 W (10.71 N) and higher power ultrasonic-treated breast samples exhibit even lower shear stress than static marinated thigh meat (10.96 N). This suggested that the ultrasonic-treatment could not only accelerate the marination rate but also show a tenderization effect, which is in accordance with Zou et al.[7]. Previous studies have pointed out that the meat tenderness increased with power enhancement due to two main reasons: 1) helping to release tenderizing enzymes by disrupting lysosomes, and thus undermining aligned muscle structure; 2) expanding spaces between myofibrils and accelerating brine solution permeation[25,26].
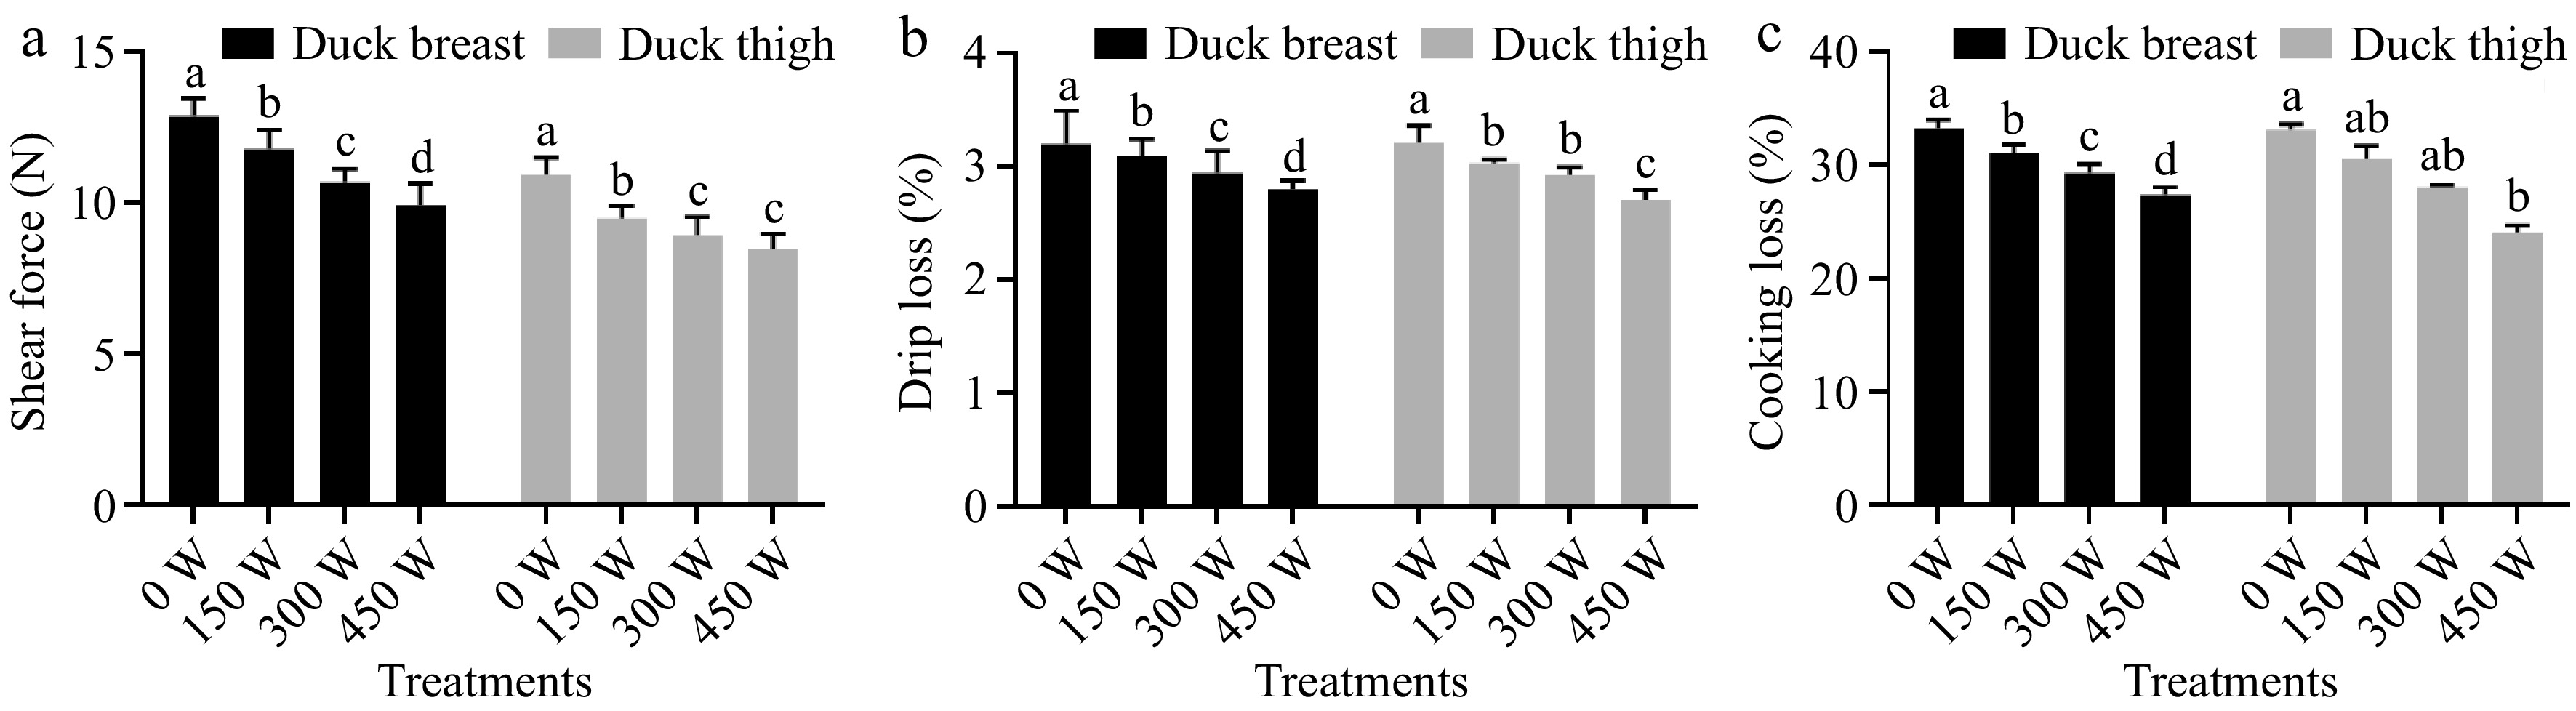
Figure 4.
Effects of different ultrasound treatments on (a) shear force, (b) drip loss and, (c) cooking loss of duck breast and thigh samples. Note: the letters a-d above the bars indicate the significant difference between samples within same muscle type (p < 0.05).
Water loss changes
Drip loss
-
Drip loss, as one of the most important factors, is closely related to poultry texture and storage quality. The effect of ultrasonic power on the drip loss of marinated duck breast and thigh is shown in Fig. 4. It is suggested that for the breast meat, the drip loss gradually decreased along with the power increasing. The lowest drip loss (2.79%) is in the 450 W sonicated samples. This is because the ultrasound could enhance NaCl to transfer into the muscle bundle (as shown in the salt mass transfer results), thus leading more salt-soluble protein to dissolve into extracellular space, trapping more free water in the system. Pan et al.[27] also found the reduced drip loss of porcine muscle was attributed to protein hydration generated by ultrasonic-induced mild oxidation.
For the thigh meat, although the drip loss decreased from 3.21% to 2.70% when the power increases from 0 to 450 W, the 150 W and 300 W treated samples exhibited similar values (p > 0.05), suggesting a comparable water holding capacity during storage. A previous study has mentioned that the ultrasonic treatment could promote the salt-soluble protein to be released from muscle fiber[26] . The drip loss presented in this work is higher (~3%) than other studies reported in ultrasonic marinated pork and chicken meat (~1% to 2%)[26,27], which is probably induced by different meat species and brine solution composition.
Cooking loss
-
The cooking loss of meat can reflect the yield of final meat product, which is generally considered to decide their economic values. In addition, the meat samples exhibited greater water holding capacity during heating often showed better juiciness, higher tenderness, and improved acceptance for consumers[28]. The results of the cooking loss of duck breast and thigh meat are shown in Fig. 4. As shown, the trends of cooking loss affected by ultrasonic power are pretty similar to drip loss. For duck breast meat, the cooking loss greatly reduced from 33.21% to 27.37% under 120 min marination time while increasing ultrasonic power from 0 to 450 W, indicating a much higher production yield (raising 5.84%). This is possibly because the ultrasonic wave destroyed the muscle structure of the breast meat, promoting the dissolution of salt-soluble protein which enriched on the surface and prevented water extrusion from the system[29].
For duck thigh meat, the 0, 150, and 300 W sonicated meat samples exhibited cooking loss with no significant difference (p > 0.05). The 450 W treated duck thigh meat showed lowest cooking loss (24.01%) compared to all other groups. As reported previously, the breast meat of poultry obtained thicker muscle fiber and larger cross-sectional area compared to leg meat[30]. Therefore, it is assumed that the ultrasonic wave would show a more significant effect on breast meat, while the salt-soluble protein could more easily be dissolved from thigh meat fiber, thus less affected by ultrasonic treatment.
LF-NMR
Transverse relaxation time (T2)
-
The insights of ultrasonic-assisted marination on the water distribution of duck breast and thigh meat were analyzed by using LF-NMR. Through observing the exchange behavior between water proteins and protein-contained protons, the mobility of water within poultry meat muscle could be evaluated[6,31]. The proton transverse relaxation time T2 can be normalized into three populations: 1) T21: ranging from 1.4 to 2.2 ms in this study, representing the bound water, which is closely restrained by proteins though hydrogen bonds or other molecular forces; 2) T22: ranging from 52.2 to 67.1 ms, which refers to immobilized water that existed around epimysium, perimysium, and endomysium; and 3) T23: referring to free water ranging from 428.4 to 635.2 ms, which is freely expelled from muscle cell and distributed around the meat surface.
According to Figs 5 & 6, the T2 of duck breast was more significantly affected by ultrasonic marination compared to duck thigh, which is consistent with the results of drip loss and cooking loss. For duck breast, the T21 and T22 were shortened by ultrasonic treatment, especially 450 W treated samples. It indicated that the mobility of bound water in muscle was lowered by higher ultrasonic power. A study in pork tenderloin has shown a similar reduction trend of T21 when cured under ultrasound and glycerol mediation[32]. The T23 was prolonged in 300 W and 450 W sonicated samples, which indicated the freedom and flow ability of the free water was enhanced. This could partially be due to more salt penetration leading to osmotic pressure.
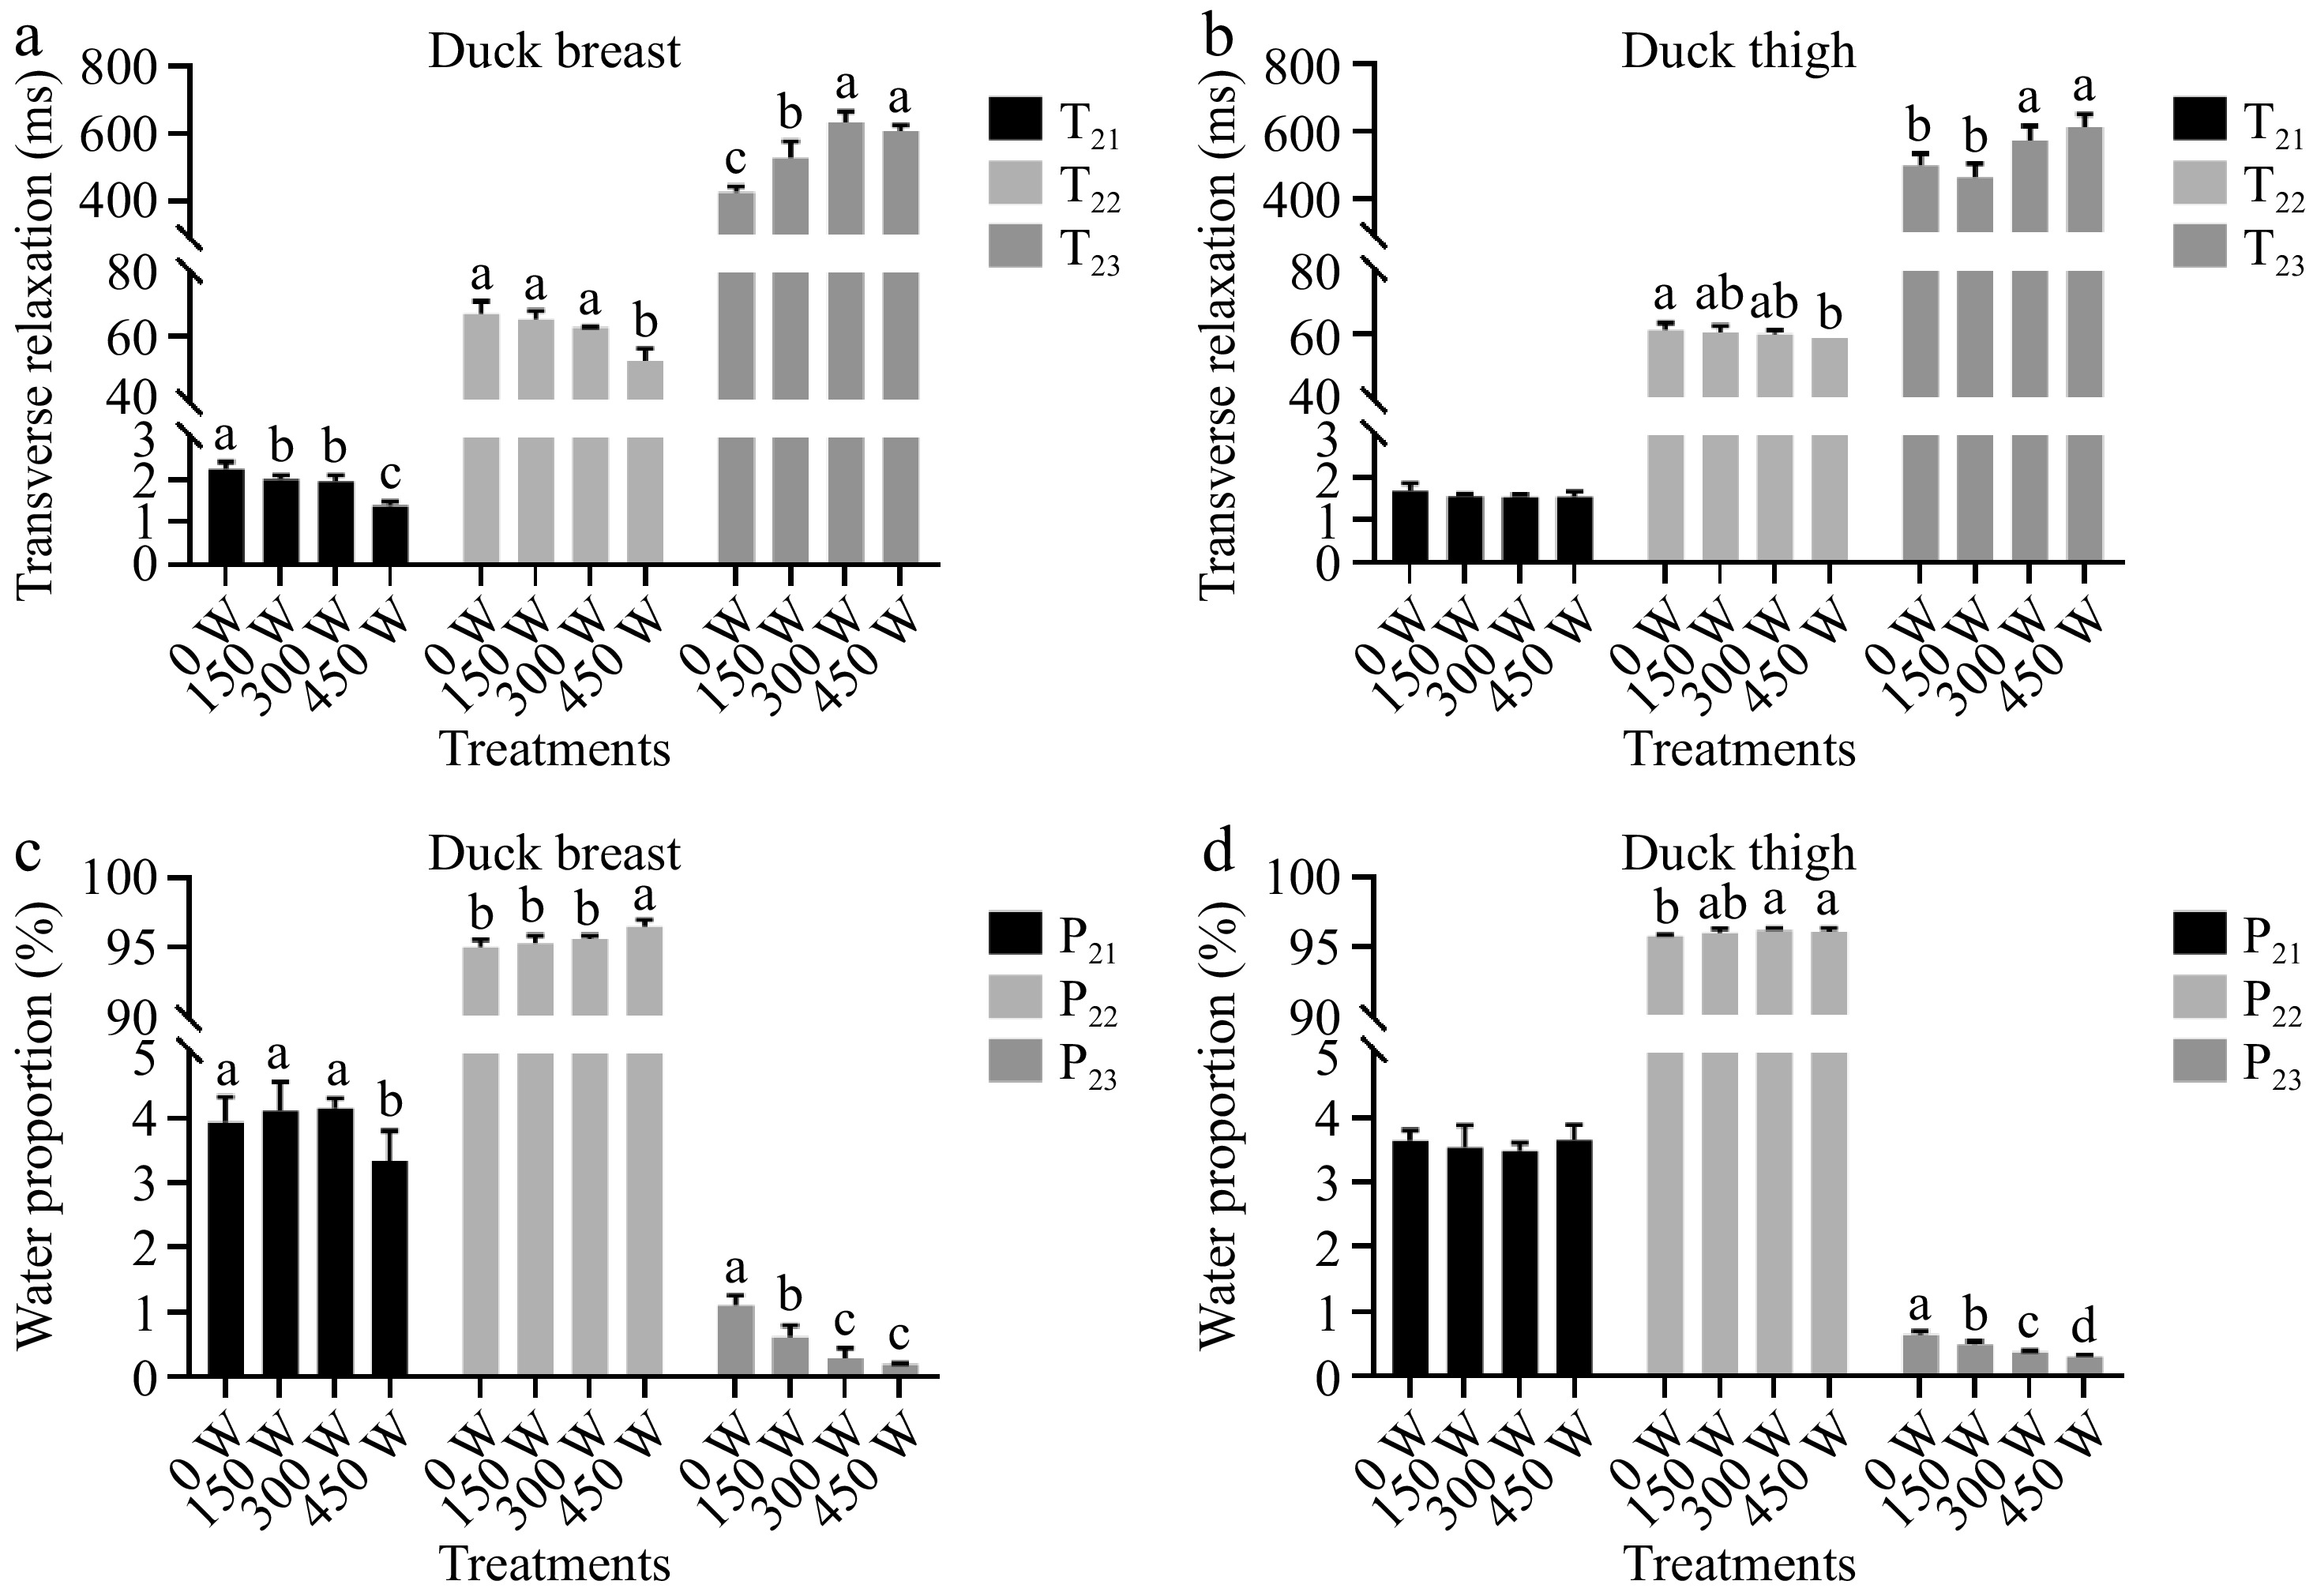
Figure 5.
(a), (b) Transverse relaxation time of water, and (c), (d) water proportion in three states of duck breast and thigh samples with different ultrasound treatments. Note: the letters a−d above the bars indicate the significant difference between samples within same muscle type (p < 0.05).
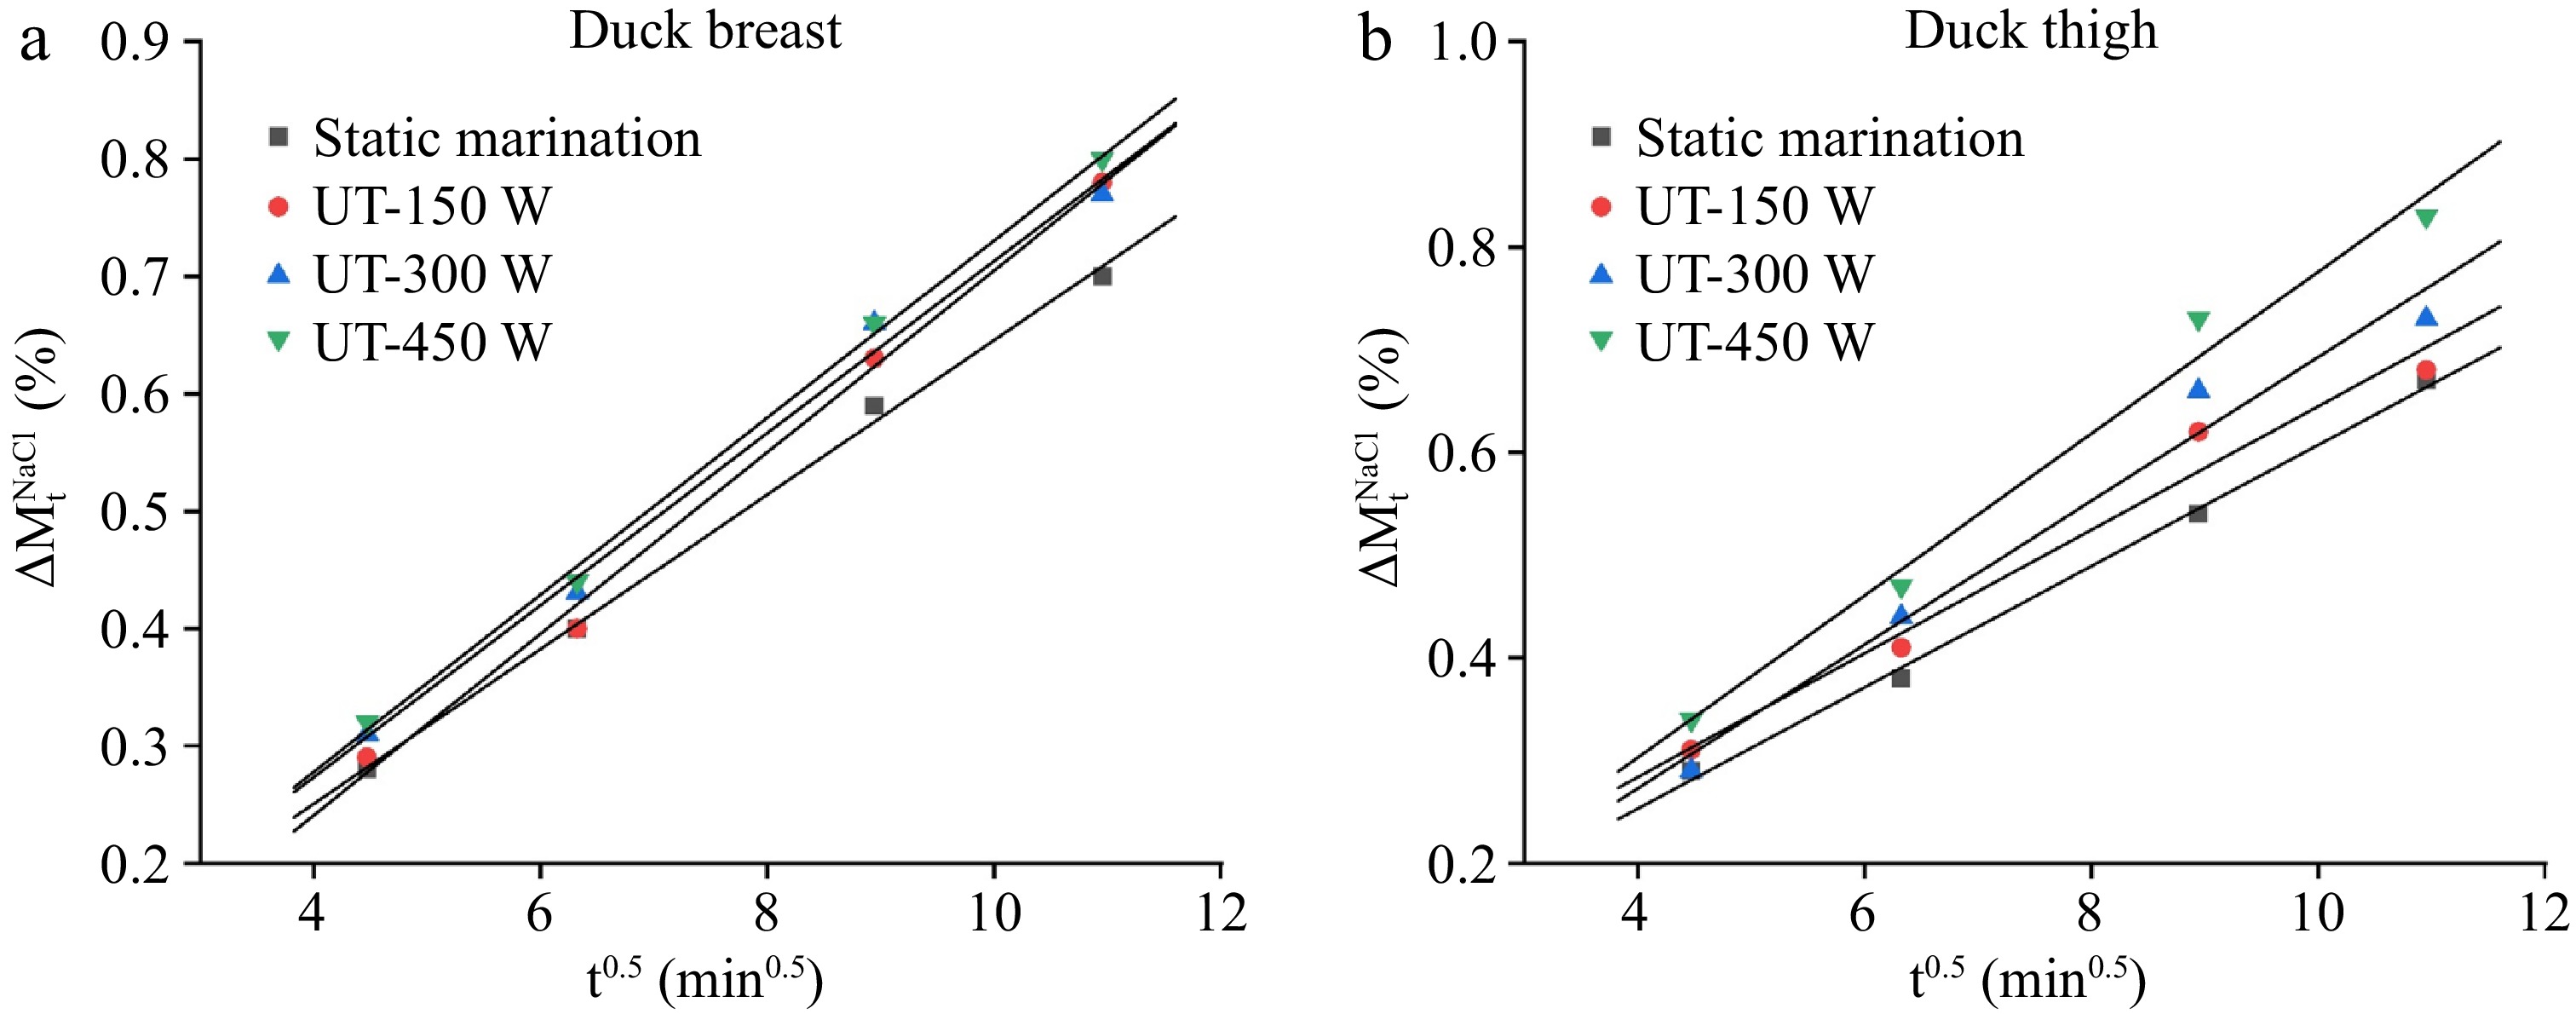
Figure 6.
The dynamic changes of transverse relaxation time (T2) of (a) duck breast, and (b) thigh samples with different ultrasound treatments.
It could be seen that the static marinated thigh meat obtained shorter T22 than breast meat, indicating the immobilized water could be more tightly bound by the muscle system in the duck leg. This could be attributed to the wider distance between muscle fibers in breast meat. The T21 of duck thigh was not affected by ultrasonic treatment. Compared to 0 W and 150 W treatment samples, the 300 W and 450 W sonicated duck thigh exhibited significantly (p < 0.05) longer T22, which is consistent with the change trends of duck breast. Guo et al.[33] have also verified that the free water relaxation time T22 of pork would significantly increase during marination, which was attributed to the infiltration of marinade into the surface layer of muscle cells.
Population of water (P2)
-
The content of different kinds of water proportion is shown in Fig. 5 as P21 (bound water), P22 (immobilized water) and P23 (free water). After marination, the major component of water in the muscle system is immobilized water. For duck breast meat, it is seen that only 450 W ultrasonic treatment would lead to significant lower P21 and higher P22 (p > 0.05), and other groups exhibited similar values (p < 0.05).
Combined with T2 changes trends, it is indicated that the bound water in chicken breast meat could be transferred to immobilized water with great binding ability by ultrasound, which is then well distributed in extra-myofibril space and potentially restrained by capillary force. The 450 W treated group also exhibited the lowest P22, indicating a reduction of free water and thus a better water retention capacity. A previous study in pork meatball reached a similar conclusion, that the 450 W assisted cooking could significantly lower the proportion of free water[34]. The ultrasonic treatment could lower the content of free water, which indicated a better water holding capacity. This result is consistent with changes in drip loss and cooking loss.
-
The present study revealed how ultrasonic-assisted marination affects the quality of duck breast and thigh meat. The results showed that ultrasonic treatment significantly influenced the mass transfer kinetics during the marination process. With the increase of ultrasonic power, the changes of total weight, moisture content, and NaCl content continuously increased. The maximum effective diffusion coefficient (De) of duck breast and thigh meat was both obtained with the power of 450 W. Compared with static marination, UT could accelerate the marination process and shorten the marination time from 120 min (0 W) to 80 min (450 W) for achieving similar salt content. The ultrasonic treatment could not only accelerate marination rate, but also showed a tenderizing effect. The reduction of drip loss and cooking loss represented the improvement of water holding capacity of duck samples and corresponded with the weight changes of NaCl. The distribution of water analysis confirmed the reduction of water loss with ultrasonic treatment, indicated by the decrease in relaxation times T22. Overall, ultrasonic-assisted marination is a potential alternative for accelerating the efficiency of brining and improving meat quality.
-
The authors confirm contribution to the paper as follows: methodology, data curation: Shao J, Ding R, Zhao X; formal analysis, writing - original draft: Shao J; supervision, validation: Sheng C; funding acquisition: Sheng C, Zhao X; conceptualization, supervision: Xu X; project administration, writing - review & editing: Zhao X. All authors reviewed the results and approved the final version of the manuscript.
-
The datasets generated during and/or analyzed during the current study are available from the corresponding author on reasonable request.
This work was supported by the Fundamental Research Funds for the Central Universities (ZJ22195010), and the Priority Academic Program Development of Jiangsu Higher Education Institution (PAPD).
-
The authors declare that they have no conflict of interest.
-
# Authors contributed equally: Jiaqi Shao, Rui Ding
- Copyright: © 2024 by the author(s). Published by Maximum Academic Press on behalf of Nanjing Agricultural University. This article is an open access article distributed under Creative Commons Attribution License (CC BY 4.0), visit https://creativecommons.org/licenses/by/4.0/.
-
About this article
Cite this article
Shao J, Ding R, Sheng C, Xu X, Zhao X. 2024. Effects of ultrasonic assisted marination on the mass transfer kinetics and quality of low-salt duck breast and thigh meat. Food Materials Research 4: e019 doi: 10.48130/fmr-0024-0010 

Effects of ultrasonic assisted marination on the mass transfer kinetics and quality of low-salt duck breast and thigh meat
- Received: 11 April 2024
- Revised: 14 May 2024
- Accepted: 28 May 2024
- Published online: 16 July 2024
Abstract: The objective of this study was to investigate the effect of ultrasonic-assisted marination on the mass transfer kinetics and quality of duck breast meat and thigh meat. Results showed that the increase of ultrasonic power greatly accelerated the transfer of moisture and NaCl, and the highest yield was obtained by ultrasonic power of 450 W. The values of the mass transfer kinetics parameter (k2) for weight changes improved as the ultrasonic power increased. The application of ultrasound treatment enhanced the NaCl effective diffusion coefficients (De) of duck breast and thigh meat from 0.7889−0.9472 × 10⁻⁹ m2/s to 1.2661−1.3775 × 10⁻⁹ m2/s and the highest De was found with 450 W. The treatment of ultrasound can reduce shear force and water loss of duck samples. According to the analysis of water distribution, ultrasound could decrease the T22 values which indicated a decrease in water mobility. Thus, ultrasonic-assisted marination could be employed as an emerging technology for various meat-curing processes.
-
Key words:
- Duck breast /
- Duck thigh /
- Ultrasound /
- Mass transfer /
- Meat quality