ARTICLE   Open Access    

Antimalarial potential of ethanol extract, and anti-inflammatory properties of flavonoid-, terpenoid-, and alkaloid-rich fractions of Sida linifolia L.

More Information
  • Sida linifolia L. has been employed ethnomedicinally in the treatment of inflammatory diseases such as whitlow and malaria but is yet to be scientifically validated for use in the management of ailments. This investigation sought to assess the antimalarial potential of ethanol leaf extract as well as the in vitro anti-inflammatory qualities of flavonoid-, terpenoid- and alkaloid-rich leaf fractions of Sida linifolia L. The acute toxicity (LD50) study and the effect of the extract on parasitemia and hematological parameters were determined. In vitro, anti-inflammatory parameters were also determined. It was demonstrated that S. linifolia leaf extract was safe and significantly (p < 0.05) reduced parasitemia in malaria-infected mice. The extract also improved blood counts in mice infected with malaria. The activity of the alkaloid-rich fraction against hypotonicity-induced hemolysis was significantly (p < 0.05) higher than those of the terpenoid-rich and flavonoid-rich fractions. On protein denaturation, the activity of the flavonoid-rich fraction had significant (p < 0.05) improvement compared to those of the terpenoid-rich and alkaloid-rich fractions. The fraction with the best anti-proteinase activity was the flavonoid-rich which was better by a significant (p < 0.05) margin than those of alkaloid-rich and terpenoid-rich fractions. The terpenoid-rich fraction showed the highest inhibitory activity against PLA2 activity, followed by the flavonoid-rich and then the alkaloid-rich fractions. Crude leaf extract of S. linifolia proved potent against malaria, and the flavonoid-, terpenoid- and alkaloids-rich fractions exerted anti-inflammatory properties, justifying its use in traditional medicine in the treatment of malaria and other inflammatory diseases.
  • In a recent report on Latin America's next petroleum boom, The Economist refers to the current and future situation in oil producing countries in the region. In the case of Argentina, the increase in oil and gas output 'have led to an increase in production in Vaca Muerta, a mammoth field in Argentina's far west. It holds the world's second-largest shale gas deposits and its fourth-largest shale oil reserves… Rystad Energy expects shell-oil production in Argentina will more than double by the end of the decade, to over a million barrels per day'[1].

    Oil production in Argentina is currently dominated by three Patagonian areas: Neuquén, San Jorge, and Austral. Based on 2021 information, 49% of oil reserves of Argentina are located in Neuquén, whereas San Jorge has 46%. Neuquén is also the largest source of oil (57%) and gas (37%) in the country. According to 2018 data, conventional oil produced in Argentina amounts to 87%, whereas non-conventional, shale production represents 13%; however, non-conventional oil is increasing due to Vaca Muerta shale oil exploitation.

    This increase of production in the Patagonian fields requires the use of a large fluid storage capacity by means of vertical oil storage tanks having different sizes and configurations. Tanks are required to store not just oil but also water. The exploitation of nonconventional reservoirs, such as Vaca Muerta, involves massive water storage to carry out hydraulic stimulation in low-permeability fields, and for managing the return fluid and production water at different stages of the process (storage, treatment, and final disposal).

    Storage tanks in the oil industry are large steel structures; they may have different sizes, and also different shell configurations, such as vertical cylinders with a fixed roof or with a floating roof and opened at the top[2]. It is now clear that such oil infrastructure is vulnerable to accidents caused by extreme weather events[35].

    Data from emergencies occurring in oil fields shows that accidents due to regional winds, with wind speed between 150 and 240 km/h, may cause severe tank damage. Seismic activity in the region, on the other hand, is of less concern to tank designers in Patagonia.

    Damage and failure mechanisms of these tanks largely depend on tank size and configuration, and their structural response should be considered from the perspective of shell mechanics and their consequences. In a report on damage observed in tanks following hurricanes Katrina and Rita in 2005[6,7], several types of damage were identified. The most common damage initiation process is due to shell buckling[811], which may progress into plasticity at higher wind speeds. In open-top tanks, a floating roof does not properly slide on a buckled cylindrical shell, and this situation may lead to different failure mechanisms. Further, damage and loss of integrity have the potential to induce oil spills, with direct consequences of soil contamination and also of fire initiation.

    Concern about an emergency caused by such wind-induced hazards involves several stakeholders, because the consequences may affect the operation of oil plants, the local and regional economies, the safety of the population living in the area of a refinery or storage farm, and the environment[6]. In view of the importance of preserving the shell integrity and avoiding tank damage, there is a need to evaluate risk of existing tanks at a regional level, such as in the Neuquén and San Jorge areas. This information may help decision makers in adopting strategies (such as structural reinforcement of tanks to withstand expected wind loads) or post-event actions (like damaged infrastructure repair or replacement).

    The studies leading to the evaluation of risk in the oil infrastructure are known as vulnerability studies, and the most common techniques currently used are fragility curves[12]. These curves evaluate the probability of reaching or exceeding a given damage level as a function of a load parameter (such as wind speed in this case).

    Early studies in the field of fragility of tanks were published[13] from post-event earthquake damage observations. Studies based on computational simulation of tank behavior under seismic loads were reported[14]. The Federal Emergency Management Administration in the US developed fragility curves for tanks under seismic loads for regions in the United States, and more recently, this has been extended to hurricane and flood events in coastal areas[15]. Seismic fragility in Europe has been reviewed by Pitilakis et al.[16], in which general concepts of fragility are discussed. Bernier & Padgett[17] evaluated the failure of tanks due to hurricane Harvey using data from aerial images and government databases. Fragility curves were developed based on finite element analyses and damage of the tank population was identified in the Houston Ship Channel. Flood and wind due to hurricane Harvey were also considered[18] to develop fragility curves.

    Because fragility curves for tanks under wind depend on the wind source (either hurricane or regional winds), and the type and size of tanks identified in a region, fragility curves developed for one area are not possible to be directly used in other areas under very different inventory and wind conditions.

    This paper addresses problems of shell buckling and loss of integrity of open top tanks, with wind-girders and floating roof and it focuses on the development of fragility curves as a way to estimate damage states under a given wind pressure. The region of interest in this work covers the oil producing areas in Patagonia, Argentina. Damage of tanks under several wind pressures are evaluated by finite element analyses together with methodologies to evaluate the structural stability.

    The construction of fragility curves requires information from the following areas: First, an inventory of tanks to be included in the analysis; second, data about the loads in the region considered; third, data about structural damage, either observed or computed via modeling; and fourth, a statistical model that links damage and load/structure data. This section describes the main features of the tank population considered in the study.

    The construction of an inventory at a regional level is a very complex task, which is largely due to a lack of cooperation from oil companies to share information about their infrastructure. Thus, to understand the type of tanks in an oil producing region, one is left collecting a limited number of structural drawings and aerial photography. A detailed inventory of the Houston Ship Channel was carried out by Bernier et al.[19], who identified 390 floating roof tanks. An inventory for Puerto Rico[20] identified 82 floating roof tanks. Although both inventories used different methodologies and addressed very different tank populations, some common features were found in both cases.

    An alternative strategy to carry out fragility studies is to develop a database using a small number of tanks, for which a detailed structural behavior is investigated using finite element analysis. This is a time-consuming task, but it allows identification of buckling pressures, buckling modes, and shell plasticity. This information serves to build approximate fragility curves, and it can also be used to develop what are known as meta-models, which predict structural damage based on tank/load characteristics. Such meta-models take the form of equations that include the tank geometry and wind speed to estimate damage. Meta-models were used, for example, in the work of Kameshwar & Padgett[18].

    This work employs a simplified strategy, and addresses the first part of the procedure described above. The use of a limited number of tanks in a database, for which a finite element structural analysis is carried out. This leads to fragility curves based on a simplified tank population (reported in this work) and the development of a meta-model together with enhanced fragility results will be reported and compared in a future work.

    Partial information of tanks in the Patagonian region was obtained from government sources, and this was supplemented by aerial photography showing details of tank farms in the region. As a result of that, it was possible to establish ranges of tank dimensions from which an artificial database was constructed.

    The present study is restricted to open-top tanks with a wind girder at the top. They are assumed to have floating roofs, which are designed and fabricated to allow the normal operation of the roof without the need of human intervention. The main characteristics of tanks investigated in this paper, are illustrated in Fig. 1.

    Figure 1.  Geometric characteristics of open-topped oil storage considered in this paper.

    The range of interest in terms of tank diameter D was established between 35 m < D < 60 m. Based on observation of tanks in the region, the ratios D/H were found to be in the range 0.20 < D/H < 0.60, leading to cylinder height H in the range 12 m < H < 20 m. These tanks were next designed using API 650[21] regulations to compute their shell thickness and wind girder dimensions. A variable thickness was adopted in elevation, assuming 3 m height shell courses. The geometries considered are listed in Table 1, with a total of 30 tanks having combinations of five values of H and six values of D. The volume of these tanks range between 55,640 and 272,520 m3.

    Table 1.  Geometry and course thickness of 30 tanks considered in this work.
    H
    (m)
    CoursesThickness t (m)
    D = 35 mD = 40 mD = 45 mD = 50 mD = 55 mD = 60 m
    12V10.0140.0160.0180.0180.0200.022
    V20.0120.0120.0140.0160.0160.018
    V30.0080.0100.0100.0100.0120.012
    V40.0060.0080.0080.0080.0080.008
    14V10.0160.0180.0200.0220.0250.025
    V20.0140.0140.0160.0180.0200.020
    V30.0100.0120.0120.0140.0140.016
    V40.0080.0080.0080.0100.0100.010
    V50.0060.0080.0080.0080.0080.008
    16V10.0180.0200.0220.0250.0280.028
    V20.0160.0180.0180.0200.0220.025
    V30.0120.0140.0160.0160.0180.020
    V40.0100.0100.0120.0120.0140.014
    V50.0060.0080.0080.0080.0080.010
    V60.0060.0080.0080.0080.0080.010
    18V10.0200.0220.0250.0280.0300.032
    V20.0180.0200.0220.0250.0250.028
    V30.0140.0160.0180.0200.0200.022
    V40.0120.0120.0140.0160.0160.018
    V50.0080.0100.0100.0100.0120.012
    V60.0080.0100.0100.0100.0120.012
    20V10.0220.0250.0280.0300.0320.035
    V20.0200.0220.0250.0280.0280.032
    V30.0160.0180.0200.0220.0250.028
    V40.0140.0140.0160.0180.0200.020
    V50.0100.0120.0120.0140.0140.016
    V60.0100.0120.0120.0140.0140.016
    V70.0100.0120.0120.0140.0140.016
     | Show Table
    DownLoad: CSV

    The material assumed in the computations was A36 steel, with modulus of elasticity E = 201 GPa and Poisson's ratio ν = 0.3.

    For each tank, a ring stiffener was designed as established by API 650[21], in order to prevent buckling modes at the top of the tank. The minimum modulus Z to avoid ovalization at the top of the tank is given by

    Z=D2H17(V190)2 (1)

    where V is the wind speed, in this case taken as V = 172.8 km/h for the Patagonian region. Intermediate ring stiffeners were not observed in oil tanks in Patagonia, so they were not included in the present inventory.

    Because a large number of tanks need to be investigated in fragility studies, it is customary to accept some simplifications in modeling the structure to reduce the computational effort. The geometry of a typical ring stiffener at the top is shown in Fig. 2a, as designed by API 650. A simplified version was included in this research in the finite element model, in which the ring stiffener is replaced by an equivalent thickness at the top, as suggested in API Standard 650[21]. This approach has been followed by most researchers in the field. The equivalent model is shown in Fig. 2b.

    Figure 2.  Ring stiffener, (a) design according to API 650, (b) equivalent section[22].

    The pressure distribution due to wind around a short cylindrical shell has been investigated in the past using wind tunnels and computational fluid dynamics, and a summary of results has been included in design regulations.

    There is a vast number of investigations on the pressures in storage tanks due to wind, even if one is limited to isolated tanks, as in the present paper. For a summary of results, see, for example, Godoy[11], and only a couple of studies are mentioned here to illustrate the type of research carried out in various countries. Wind tunnel tests were performed in Australia[23], which have been the basis of most subsequent studies. Recent tests in Japan on small scale open top tanks were reported[24,25]. In China, Lin & Zhao[26] reported tests on fixed roof tanks. CFD models, on the other hand, were computed[27] for open top tanks with an internal floating roof under wind flow. Although there are differences between pressures obtained in different wind tunnels, the results show an overall agreement.

    The largest positive pressures occur in the windward meridian covering an angle between 30° and 45° from windward. Negative pressures (suction), on the other hand, reach a maximum at meridians located between 80° and 90° from windward. An evaluation of US and European design recommendations has been reported[28,29], who also considered the influence of fuel stored in the tank.

    The circumferential variation of pressures is usually written in terms of a cosine Fourier series. The present authors adopted the series coefficients proposed by ASCE regulations[30], following the analytical expression:

    q=λinCicos(iφ) (2)

    in which λ is the amplification factor; the angle φ is measured from the windward meridian; and coefficients Ci represent the contribution of each term in the series. The following coefficients were adopted in this work (ASCE): C0 = −0.2765, C1 = 0.3419, C2 = 0.5418, C3 = 0.3872, C4 = 0.0525, C5 = 0.0771, C6 = −0.0039 and C7 = 0.0341. For short tanks, such as those considered in this paper, previous research reported[31] that for D/H = 0.5 the variation of the pressure coefficients in elevation is small and may be neglected to simplify computations. Thus, the present work assumes a uniform pressure distribution in elevation at each shell meridian.

    In fragility studies, wind speed, rather than wind pressures, are considered, so that the following relation from ASCE is adopted in this work:

    qz=0.613KztKdV2IV=qz0.613KztKdI (3)

    in which I is the importance factor; Kd is the directionality factor; and Kzt is the topographic factor. Values of I = 1.15, Kd = 0.95 and Kzt = 1, were adopted for the computations reported in this paper.

    Because shell buckling was primarily investigated in this work using a bifurcation analysis, the scalar λ was increased in the analysis until the finite element analysis detected a singularity.

    Fragility curves are functions that describe the probability of failure of a structural system (oil tanks in the present case) for a range of loads (wind pressures) to which the system could be exposed. In cases with low uncertainty in the structural capacity and acting loads, fragility curves take the form of a step-function showing a sudden jump (see Fig. 3a). Zero probability occurs before the jump and probability equals to one is assumed after the jump. But in most cases, in which there is uncertainty about the structural capacity to withstand the load, fragility curves form an 'S' shape, as shown in Fig. 3a and b probabilistic study is required to evaluate fragility.

    Figure 3.  Examples of fragility curves, (a) step-function, (b) 'S' shape function.

    The construction of fragility curves is often achieved by use of a log-normal distribution. In this case, the probability of reaching a certain damage level is obtained by use of an exponential function applied to a variable having a normal distribution with mean value μ and standard deviation σ. If a variable x follows a log-normal distribution, then the variable log(x) has a normal distribution, with the following properties:

    • For x < 0, a probability equal to 0 is assigned. Thus, the probability of failure for this range is zero.

    • It can be used for variables that are computed by means of a number of random variables.

    • The expected value in a log-normal distribution is higher than its mean value, thus assigning more importance to large values of failure rates than would be obtained in a normal distribution.

    The probability density function for a log-normal distribution may be written in the form[32]:

    f(xi)=12πσ21xexp[(lnxµ)2/(2σ2)] (4)

    in which f(xi) depends on the load level considered, and is evaluated for a range of interest of variable x; and μ* is the mean value of the logarithm of variable x associated with each damage level. Damage levels xi are given by Eqn (5).

    µ(xi)=1NNn=1ln(xin) (5)

    where the mean value is computed for a damage level xi, corresponding to I = DSi; summation in n extends to the number of tanks considered in the computation of the mean value. Damage levels in this work are evaluated using computational modeling and are defined in the next section. Variance is the discrete variable xi 2), computed from:

    σ2(xi,µ)=1NNn=1(ln(xin)µ)2=1NNn=1ln(xin)2µ2 (6)

    The probability of reaching or exceeding a damage level DSi is computed by the integral of the density function using Eqn (7), for a load level considered (the wind speed in this case):

    P[DS/x]=x=V0x=0f(x)dx (7)

    where V0 is the wind speed at which computations are carried out, and x is represented by wind speed V.

    Various forms of structural damage may occur as a consequence of wind loads, including elastic or plastic deflections, causing deviations from the initial perfect geometry; crack initiation or crack extension; localized or extended plastic material behavior; and structural collapse under extreme conditions. For the tanks considered in this work, there are also operational consequences of structural damage, such as blocking of a floating roof due to buckling under wind loads that are much lower than the collapse load. For this reason, a damage study is interested in several structural consequences but also in questions of normal operation of the infrastructure. Several authors pointed out that there is no direct relation between structural damage and economic losses caused by an interruption of normal operation of the infrastructure.

    Types of damage are usually identified through reconnaissance post-event missions, for example following Hurricanes Katrina and Rita[6,7]. Damage states reported in Godoy[7] include shell buckling, roof buckling, loss of thermal insulation, tank displacement as a rigid body, and failure of tank/pipe connections. These are qualitative studies, in which damage states previously reported in other events are identified and new damage mechanisms are of great interest in order to understand damage and failure modes not taken into account by current design codes.

    In this work, in which interest is restricted to open top tanks having a wind girder at the top, four damage states were explored, as shown in Table 2. Regarding the loss of functionality of a tank, several conditions may occur: (1) No consequences for the normal operation of a tank; (2) Partial loss of operation capacity; (3) Complete loss of operation.

    Table 2.  Damage states under wind for open-top tanks with a wind girder.
    Damage states (DS)Description
    DS0No damage
    DS1Large deflections on the cylindrical shell
    DS2Buckling of the cylindrical shell
    DS3Large deflections on the stiffening ring
     | Show Table
    DownLoad: CSV

    DS1 involves displacements in some area of the cylindrical body of the tank, and this may block the free vertical displacement of the floating roof. Notice that this part of the tank operation is vital to prevent the accumulation of inflammable gases on top of the fluid stored. Blocking of the floating roof may cause a separation between the fuel and the floating roof, which in turn may be the initial cause of fire or explosion.

    DS2 is associated with large shell deflections, which may cause failure of pipe/tank connections. High local stresses may also arise in the support of helicoidal ladders or inspection doors, with the possibility of having oil spills.

    DS3 is identified for a loss of circularity of the wind girder. The consequences include new deflections being transferred to the cylindrical shell in the form of geometrical imperfections.

    In summary, DS1 and DS3 may affect the normal operation of a floating roof due to large shell or wind-girder deflections caused by buckling.

    Tank modeling was carried out in this work using a finite element discretization within the ABAQUS environment[33] using rectangular elements with quadratic interpolation functions and reduced integration (S8R5 in the ABAQUS nomenclature). Two types of shell analysis were performed: Linear Bifurcation Analysis (LBA), and Geometrically Nonlinear Analysis with Imperfections (GNIA). The tank perimeter was divided into equal 0.35 m segments, leading to between 315 and 550 elements around the circumference, depending on tank size. Convergence studies were performed and errors in LBA eigenvalues were found to be lower than 0.1%.

    The aim of an LBA study is to identify a first critical buckling state and buckling mode by means of an eigenvalue problem. The following expression is employed:

    (K0+λCKG)ΦC=0 (8)

    where K0 is the linear stiffness matrix of the system; KG is the load-geometry matrix, which includes the non-linear terms of the kinematic relations; λC is the eigenvalue (buckling load); and ΦC is the critical mode (eigenvector). For a reference wind state, λ is a scalar parameter. One of the consequences of shell buckling is that geometric deviations from a perfect geometry are introduced in the shell, so that, due to imperfection sensitivity, there is a reduced shell capacity for any future events.

    The aim of the GNIA study is to follow a static (non-linear) equilibrium path for increasing load levels. The GNIA study is implemented in this work using the Riks method[34,35], which can follow paths in which the load or the displacement decrease. The geometric imperfection was assumed with the shape of the first eigenvector at the critical state in the LBA study, and the amplitude of the imperfection was defined by means of a scalar ξ [10]. To illustrate this amplitude, for a tank with D = 45 m and H = 12 m, the amplitude of imperfection is equal to half the minimum shell thickness (ξ = 4 mm in this case).

    It was assumed that a damage level DS1 is reached when the displacement amplitudes do not allow the free vertical displacement of the floating roof. Based on information from tanks in the Patagonian region, the limit displacement was taken as 10 mm. This state was detected by GNIA, and the associated load level is identified as λ = λDS1.

    The load at which damage state DS2 occurs was obtained by LBA, leading to a critical load factor λC and a buckling mode. An example of damage levels is shown in Fig. 4.

    Figure 4.  Damage computed for a tank with D = 45 m and H = 12 m. (a) Deflected shape for damage DS1; (b) Equilibrium path for node A (DS1); (c) Deflected shape for damage DS2 (critical mode).

    An LBA study does not account for geometric imperfections. It is well known that the elastic buckling of shells is sensitive to imperfections, so that a reduction in the order of 20% should be expected for cylindrical shells under lateral pressure. This consideration allows to estimate DS0 (a state without damage) as a lower bound of the LBA study. An approach to establish lower bounds for steel storage tanks is the Reduced Stiffness Method (RSM)[3640]. Results for tanks using the RSM to estimate safe loads show that λDS0 = 0.5λDS2 provides a conservative estimate for present purposes.

    DS3 was computed using a linear elastic analysis to evaluate the wind pressure at which a 10 mm displacement of the wind girder is obtained.

    In a similar study for tanks with a fixed conical roof, Muñoz et al.[41] estimated a collapse load based on plastic behavior. However, in the present case the top ring has a significant stiffness, and this leads to extremely high wind speeds before reaching collapse (higher than 500 km/h). For this reason, the most severe damage level considered here was that of excessive out-of-plane displacements of the wind girder, and not shell collapse.

    The methodology to construct fragility curves has been presented by several authors[42,43]. The following procedure was adapted here[44]: (1) Establish qualitative damage categories (Table 2). (2) Compute a data base for different tanks, using LBA and GNIA. In each case, the damage category based on step (1) was identified (Table 3). (3) Approximate data obtained from step (2) using a log-normal distribution. (4) Plot the probabilities computed in step (3) with respect to wind speed x.

    Table 3.  Wind speed for each tank considered reaching a damage level.
    HDIDDS0DS1DS2DS3
    H12D351137.76162.06194.82336.02
    D402160.62181.31227.16360.73
    D453153.32174.19216.82374.04
    D504145.23165.27205.39373.76
    D555152.76180.83216.03374.75
    D606145.11170.75205.22370.98
    H14D357145.57162.05205.87295.03
    D408148.55166.20210.08311.24
    D459136.42153.72192.92334.54
    D5010155.36177.51219.71339.86
    D5511145.24165.34205.39343,17
    D6012141.89167.26200.67338.77
    H16D3513131.32161.94185.71262.20
    D4014146.95163.99207.82277.08
    D4515150.58170.90212.95293.37
    D5016138.97161.05196.54303.62
    D5517138.51174.17195.88313.97
    D6018156.34182.78221.10326.83
    H18D3519146.80160.79207.60223.18
    D4020159.01177.71224.87243.63
    D4521157.10179.51222.17265.32
    D5022152.54172.17215.72293.32
    D5523164.93188.10233.25305.94
    D6024163.69180.32231.49315.63
    H20D3525163.64199.59231.42195.03
    D4026171.24195.14242.18216.47
    D4527171.58203.68242.64293.32
    D5028182.46209.43258.03259.41
    D5529178.95208.23253.07272.48
    D6030174.47196.11246.74290.86
     | Show Table
    DownLoad: CSV

    Wind speeds for each tank, obtained via Eqn (3), are shown in Table 3 for the pressure level associated with each damage level DSi. A scalar ID was included in the table to identify each tank of the population in the random selection process. Wind speed was also taken as a random variable, so that wind speed in the range between 130 and 350 km/h have been considered at 5 km/h increase, with intervals of −2.5 and +2.5 km/h.

    Out of the 30-tank population considered, a sample of 15 tanks were chosen at random and were subjected to random wind forces. The random algorithm allowed for the same tank geometry to be chosen more than once as part of the sample.

    The type of damage obtained in each case for wind speed lower or equal to the upper bound of the interval were identified. Table 4 shows a random selection of tanks, together with the wind speed required to reach each damage level. For example, for a wind speed of 165 km/h, the wind interval is [162.5 km/h, 167.5 km/h]. This allows computation of a damage matrix (shown in Table 5). A value 1 indicates that a damage level was reached, whereas a value 0 shows that a damage level was not reached. In this example, 13 tanks reached DS0; six tanks reached DS1; and there were no tanks reaching DS2 or DS3. The ratio between the number of tanks with a given damage DSi and the total number of tanks selected is h, the relative accumulated frequency. The process was repeated for each wind speed and tank selection considered.

    Table 4.  Random tank selection for V = 165 km/h, assuming wind interval [162.5 km/h, 167.5 km/h].
    IDDS0DS1DS2DS3
    11145.2165.3205.4343.2
    6145.1170.7205.2371.0
    3153.3174.2216.8374.0
    9136.4153.7192.9334.5
    28182.5209.4258.0259.4
    22152.5172.2215.7293.3
    13131.3161.9185.7262.2
    19146.8160.8207.6223.2
    3153.3174.2216.8374.0
    12141.9167.3200.7338.8
    30174.5196.1246.7290.9
    23164.9188.1233.2305.9
    2160.6181.3227.2360.7
    17138.5174.2195.9314.0
    11145.2165.3205.4343.2
     | Show Table
    DownLoad: CSV
    Table 5.  Damage matrix for random tank selection (V = 165 km/h), assuming wind interval [162.5 km/h, 167.5 km/h].
    DS0DS1DS2DS3
    1100
    1000
    1000
    1100
    0000
    1000
    1100
    1100
    1000
    1100
    0000
    1000
    1000
    1000
    1100
    Total13600
    hi0.870.400
     | Show Table
    DownLoad: CSV

    Table 6 shows the evaluation of the fragility curve for damage level DS0. This requires obtaining the number of tanks for each wind speed (fi), the cumulative number as wind speed is increased (Fi), and the frequency with respect to the total number of the sample of 15 tanks is written on the right-hand side of Table 6, for relative frequency (hi) and accumulated frequency (Hi).

    Table 6.  Damage DS0: Wind speed intervals [km/h] shown on the left; logarithm of wind speed; and relative and absolute frequencies (shown on the right).
    V inf
    (km/h)
    V m
    (km/h)
    V sup
    (km/h)
    Ln
    (Vm)
    fiFihiHi
    127.5130132.54.87000.0000
    132.5135137.54.91220.1330.133
    137.5140142.54.94130.0670.200
    142.5145147.54.98360.2000.400
    147.5150152.55.01170.0670.467
    152.5155157.55.044110.2670.733
    157.5160162.55.080110.0000.733
    162.5165167.55.112130.1330.867
    167.5170172.55.140130.0000.867
    172.5175177.55.160130.0000.867
    177.5180182.55.192150.1331.000
     | Show Table
    DownLoad: CSV

    With the values of mean and deviation computed with Eqns (5) & (6), it is possible to establish the log normal distribution of variable V for damage level DS0, usually denoted as P[DS0/V]. Values obtained in discrete form and the log-normal distribution are shown in Fig. 5a for DS0. For the selection shown in Table 6, the media is μ* = 5.03 and the deviation is σ = 0.09.

    Figure 5.  Probability of reaching a damage level P[DSi/V], (a) DS0, (b) DS0, DS1, DS2 and DS3.

    The process is repeated for each damage level to obtain fragility curves for DS1, DS2, and DS3 (Fig. 5b). Notice that the wind speeds required to reach DS3 are much higher than those obtained for the other damage levels. Such values should be compared with the regional wind speeds in Patagonia, and this is done in the next section.

    The oil producing regions in Argentina having the largest oil reserves are the Neuquén and the San Jorge regions, both located in Patagonia. This needs to be placed side by side with wind loads to understand the risk associated with such oil production.

    Figure 6 shows the geographical location of these regions. The Neuquén region includes large areas of four provinces in Argentina (Neuquén, south of Mendoza, west of La Pampa, and Río Negro). The San Jorge region is in the central Patagonia area, including two provinces (south of Chubut, north of Santa Cruz). Another area is the Austral region covering part of a Patagonian province (Santa Cruz).

    Figure 6.  Oil producing regions in Argentina. (Adapted from IAPG[47]).

    A map of basic wind speed for Argentina is available in the Argentinian code CIRSOC 102[45], which is shown in Fig. 7. Notice that the highest wind speeds are found in Patagonia, and affect the oil-producing regions mentioned in this work. For the Neuquén region, wind speeds range from 42 to 48 m/s (151.2 to 172.8 km/h), whereas for San Jorge Gulf region they range between 52 and 66 m/s (187.2 and 237.6 km/h).

    Figure 7.  Wind speed map of Argentina. (Adapted from CIRSOC 102[45]).

    The wind values provided by CIRSOC 102[45] were next used to estimate potential shell damage due to wind. Considering the fragility curves presented in Fig. 4, for damage levels DS0, DS1, DS2 and DS3 based on a log-normal distribution, it may be seen that it would be possible to have some form of damage in tanks located in almost any region of Argentina because CIRSOC specifies wind speeds higher than 36 m/s (129.6 km/h). The fragility curve DS0 represents the onset of damage for wind speeds higher than 130 km/h, so that only winds lower than that would not cause tank damage.

    Based on the fragility curves shown in Fig. 8, it is possible to estimate probable damage levels for the wind speed defined by CIRSOC. Because design winds in Patagonia are higher than 165.6 km/h (46 m/s), it is possible to conclude that there is 81% probability to reach DS0 and 25% to reach DS1.

    Figure 8.  Probability P[DSi/V] to reach damage levels DS1, DS2 and DS3 in tanks located in the Patagonia region of Argentina.

    For the geographical area of the Neuquén region in Fig. 6, together with the wind map of Fig. 7, the expected winds range from 150 to 172.8 km/h (42 to 48 m/s). Such wind range is associated with a DS0 probability between 41% and 92%, whereas the DS1 probability is in the order of 48%.

    A similar analysis was carried out for the San Jorge region, in which winds between 187.2 and 237 km/h (52 and 66 m/s). The probability of reaching DS1 is 87%, and the probability of DS2 is 88%. Wind girder damage DS3 could only occur in this region, with a lower probability of 18%.

    This work focuses on open top tanks having a floating roof, and explores the probability of reaching damage levels for wind loads, using the methodology of fragility curves. A population of 30 tanks was defined with H/D ratios between 0.2 and 0.6; such aspect ratios were found to be the most common in the oil producing regions of Patagonia. The data employed assumed diameters D between 35 and 60 m, together with height between 12 and 20 m. The tanks were designed using current API 650 regulations which are used in the region, in order to define the shell thickness and wind girder. All tanks were assumed to be empty, which is the worst condition for shell stability because a fluid stored in a tank has a stabilizing effect and causes the buckling load to be higher.

    Both structural damage (shell buckling) and operational damage (blocking of the floating roof due to deflections of the cylindrical shell) were considered in the analysis. The qualitative definition of damage levels in this work was as follows: The condition of no damage was obtained from a lower bound of buckling loads. This accounts for geometric imperfections and mode coupling of the shell. Shell buckling was evaluated using linear bifurcation analysis to identify damage level DS2. A geometrically non-linear analysis with imperfections was used to identify deflection levels that would block a floating roof, a damage level identified as DS1. Finally, deflections in the wind girder were investigated using a linear elastic analysis to define damage DS3.

    The present results were compared with the wind conditions of Patagonia, to show that several damage levels may occur as a consequence of wind speeds higher than 130 km/h, which is the expected base value identified for the region. The most frequent expected damage is due to the loss of vertical displacements of the floating roof due to large displacements in the cylindrical shell of the tank, and this may occur for wind speed up to 200 km/h. Damage caused by shell buckling may occur for wind speeds higher than 190 km/h, and for that wind speed, further damage due to displacements in the wind girder may also occur, but with a lower probability. This latter damage form requires much higher wind speed to reach a probability of 20%, and would be more representative of regions subjected to hurricanes.

    The number of tanks considered in the present analysis was relatively low, mainly because the aim of this work was to collect data to build a meta-model, i.e. a simple model that may estimate damage based on shell and load characteristics[46]. In future work, the authors expect to develop and apply such meta-models to a larger number of tank/wind configurations, in order to obtain more reliable fragility curves.

    Fragility studies for an oil producing region, like those reported in this work, may be important to several stakeholders in this problem. The fragility information links wind speed levels to expected infrastructure damage, and may be of great use to government agencies, engineering companies, and society at large, regarding the risk associated with regional oil facilities. At a government level, this helps decision makers in allocating funding to address potential oil-related emergencies cause by wind. This can also serve as a guide to develop further modifications of design codes relevant to the oil infrastructure. The engineering consequences may emphasize the need to strengthen the present regional infrastructure to reduce risk of structural damage and its consequences. The impact of damage in the oil infrastructure on society was illustrated in the case of Hurricane Katrina in 2005, in which a large number of residents had to be relocated due to the conditions created by the consequences of infrastructure failure.

    The authors confirm contribution to the paper as follows: study conception and design: Jaca RC, Godoy LA; data collection: Grill J, Pareti N; analysis and interpretation of results: Jaca RC, Bramardi S, Godoy LA; draft manuscript preparation: Jaca RC, Godoy LA. All authors reviewed the results and approved the final version of the manuscript.

    All data generated or analyzed during this study are included in this published article.

    The authors are thankful for the support of a grant received from the National Agency for the Promotion of Research, Technological Development and Innovation of Argentina and the YPF Foundation. Luis A. Godoy thanks Prof. Ali Saffar (University of Puerto Rico at Mayaguez) for introducing him to the field of fragility studies.

  • The authors declare that they have no conflict of interest.

  • [1]

    Hamoudi M, Amroun D, Badhiani A, Khennouf S, Dahamna S, et al. 2016. In vitro antioxidant anti-inflammatory (in vitro and in vivo), and analgesic activities of hydroalcoholic extracts of Ephedra nebrodensis from Eastern Algeria. Journal of Japanese Botany 91(5):295−97

    Google Scholar

    [2]

    Ezeako EC, Nworah FN, Osuji DO. 2023. Phytocompounds, antioxidant potential, and inhibitory actions of ethanolic leaf fraction of Sida linifolia Linn. (Malvaceae) on enzymes linked to inflammation, diabetes, and neurological disorders. Future Journal of Pharmaceutical Sciences 9:73

    doi: 10.1186/s43094-023-00527-8

    CrossRef   Google Scholar

    [3]

    Palaksha MN, Ravishankar K. 2012. Phytochemical screening and evaluation of in vitro antibacterial and antihelminthic activities of Sida acuta leaf extracts. Journal of Chemical and Pharmaceutical Research 4(11):4757−61

    Google Scholar

    [4]

    Sahu BP, Gouda P, Patnaik C. 2016. Studies on the phytochemistry spectroscopic characterization, and antibacterial efficacy of Sida cordifolia. International Journal of Science and Research 5(8):146−55

    Google Scholar

    [5]

    Anooj ES, Amrutha TM, Charumathy M, Gangadhar L. 2019. Quantitative and qualitative identification of phytochemical constituents of Sida rhombifolia leaves extract. International Journal of Recent Technology and Engineering 8:403−8

    doi: 10.35940/ijrte.b1078.0782s419

    CrossRef   Google Scholar

    [6]

    Nwankwo NE, Ezeako EC, Nworah FN, Ogara AL, Oka SA, et al. 2023. Bioactive compounds, anti-inflammatory, anti-nociceptive, and antioxidant potentials of ethanolic leaf fraction of Sida linifolia L. (Malvaceae). Arabian Journal of Chemistry 16(1):104398

    doi: 10.1016/j.arabjc.2022.104398

    CrossRef   Google Scholar

    [7]

    Nwankwo, NE, Okeke ES, Nworah FN, Ezeako EC. 2023. Phytochemical composition and potential anti-inflammatory and antioxidant mechanisms of leaf extracts of Sida linifolia L. (Malvaceae). Journal of Herbal Medicine 38:100630

    doi: 10.1016/j.hermed.2023.100630

    CrossRef   Google Scholar

    [8]

    Ribeiro GdJG, Rei Yan SL, Palmisano G, Wrenger C. 2023. Plant extracts as a source of natural products with potential antimalarial effects: An update from 2018 to 2022. Pharmaceutics 15:1638

    doi: 10.3390/pharmaceutics15061638

    CrossRef   Google Scholar

    [9]

    Chaniad P, Techarang T, Phuwajaroanpong A, Plirat W, Viriyavejakul P et al. 2023. Antimalarial efficacy and toxicological assessment of medicinal plant ingredients of Prabchompoothaweep remedy as a candidate for antimalarial drug development. BMC Complementary Medicine and Therapies 23:12

    doi: 10.1186/s12906-023-03835-x

    CrossRef   Google Scholar

    [10]

    Ahmed AU. 2011. An overview of inflammation: mechanism and consequences. Frontiers in Biology 6(4):274−81

    doi: 10.1007/s11515-011-1123-9

    CrossRef   Google Scholar

    [11]

    Soliman AM, Barreda DR. 2023. Acute inflammation in tissue healing. International Journal of Molecular Sciences 24:641

    doi: 10.3390/ijms24010641

    CrossRef   Google Scholar

    [12]

    Al-Mansoori L, Al-Jaber H, Prince MS, Elrayess MA. 2022. Role of inflammatory cytokines, growth factors and adipokines in adipogenesis and insulin resistance. Inflammation 45:31−44

    doi: 10.1007/s10753-021-01559-z

    CrossRef   Google Scholar

    [13]

    Santangelo C, Varì R, Scazzocchio B, Di Benedetto R, Filesi C et al. 2007. Polyphenols. intracellular signalling and inflammation. Annali dell'instituto Superiore di Sanità 43(4):394−405

    Google Scholar

    [14]

    Prakash VED. 2017. Terpenoids as source of anti-inflammatory compounds. Asian Journal of Pharmaceutical and Clinical Research 10(3):68−76

    doi: 10.22159/ajpcr.2017.v10i3.16435

    CrossRef   Google Scholar

    [15]

    Kim T, Song B, Cho KS, Lee IS. 2020. Therapeutic potential of volatile terpenes and terpenoids from forests for inflammatory diseases. International Journal of Molecular Sciences 21(6):2187

    doi: 10.3390/ijms21062187

    CrossRef   Google Scholar

    [16]

    Rodanant P, Surarit R, Laphookhieo S, Kuvatanasuchati J. 2015. In vitro evaluation of the antibacterial and anti-inflammation activities of Clausena lansium (Lour.) Skeels. Songklanakarin Journal of Science and Technology 37(1):43−48

    Google Scholar

    [17]

    Farooq S, Shaheen G, Asif HM, Aslam MR, Zahid R et al. 2022. Preliminary phytochemical analysis: In-vitro comparative evaluation of anti-arthritic and anti-inflammatory potential of some traditionally used medicinal plants. Dose-Response 20(1):15593258211069720

    doi: 10.1177/15593258211069720

    CrossRef   Google Scholar

    [18]

    Emeka Nwankwo N, Aham EC, Ezenabor EH, Chidozie DMG. 2023. Anti-inflammatory and antioxidant activities of ethylacetate fraction of Sida linifolia L. (Malvaceae). International Journal of Plant-Based Pharmaceuticals 3(2):200

    doi: 10.29228/ijpbp.33

    CrossRef   Google Scholar

    [19]

    Lorke D. 1983. A new approach to practical acute toxicity testing. Archives of Toxicology 54:275−87

    doi: 10.1007/BF01234480

    CrossRef   Google Scholar

    [20]

    Dacie JV, Lewis SM. 2000. Practical Hematology. 9th Edition. New York: Churchill Livingstone.

    [21]

    Oyedapo OO, Famurewa AJ. 1995. Antiprotease and membrane stabilizing activities of extracts of Fagara zanthoxyloides, Olax subscorpioides, and Tetrapleura tetraptera. International Journal of Pharmacology 33(1):65−69

    doi: 10.3109/13880209509088150

    CrossRef   Google Scholar

    [22]

    Mizushima Y, Kobayashi M. 1968. Interaction of anti-inflammatory drugs with serum proteins. especially with some biologically active proteins. Journal of Pharmacy and Pharmacology 20(3):169−73

    doi: 10.1111/j.2042-7158.1968.tb09718.x

    CrossRef   Google Scholar

    [23]

    Sakat SS, Juvekar AR, Gambhire MN. 2010. In-vitro antioxidant and anti-inflammatory activity of methanol extract of Oxalis corniculata Linn. International Journal of Pharmacy and Pharmaceutical Sciences 2:146−55

    Google Scholar

    [24]

    Vane JR. 1971. Inhibition of prostaglandin synthesis as a mechanism of action for aspirin-like drugs. Nature New Biology 231:232−35

    doi: 10.1038/newbio231232a0

    CrossRef   Google Scholar

    [25]

    Enechi OC, Amah CC, Okagu IU, Ononiwu PC, Nweke AC et al. 2021. Sida acuta Burm.f. leaves ethanol extract ameliorates haematological and biochemical alterations induced by Plasmodium berghei ANKA-65 in mice. Clinical Phytoscience 7:78

    doi: 10.1186/s40816-021-00317-w

    CrossRef   Google Scholar

    [26]

    Barde IJ, Ishaku LE, Ibrahim EA, Abubakar SA, Kabantiyo D et al. 2023. Mucuna pruriens (Karara) leaf extracts enhance certain haematological parameters in Albino rats. Acta Scientific Veterinary Sciences 5(9):8−14

    doi: 10.31080/ASVS.2023.05.0726

    CrossRef   Google Scholar

    [27]

    Ajayi AM, Tanayen JK, Ezeonwumelu JOC, Dare S, Okwanachi A et al. 2014. Anti-inflammatory anti-nociceptive, and total polyphenolic content of hydroethanolic extract of Ocimum gratissimum L. leaves. African Journal of Medicine and Medical Sciences 43(1):215−24

    Google Scholar

    [28]

    Enechi OC, Amah CC, Okagu IU, Ononiwu CP, Azidiegwu VC et al. 2019. Methanol extracts of Fagara zanthoxyloides leaves possess antimalarial effects and normalizes haematological and biochemical status of Plasmodium berghei-passaged mice. Pharmaceutical Biology 57(1):577−85

    doi: 10.1080/13880209.2019.1656753

    CrossRef   Google Scholar

    [29]

    Yesmin S, Paul A, Naz T, Rahman ABMA, Akhter SF et al. 2020. Membrane stabilization as a mechanism of the anti-inflammatory activity of ethanolic root extract of Choi (Piper chaba). Clinical Phytoscience 6:59

    doi: 10.1186/s40816-020-00207-7

    CrossRef   Google Scholar

    [30]

    Agarwal SS, Paridhavi M. 2007. Herbal Drug Technology. Hyderabad: Universities Press. pp. 104−20.

    [31]

    Sen S, Chakraborty R, Maramsa N, Basak M, Deka S, et al. 2015. In vitro anti-inflammatory activity of Amaranthus caudatus L. leaves. Indian Journal of Natural Products and Resources 6:326−29

    Google Scholar

    [32]

    Sangeetha G, Vidhya R. 2016. In vitro anti-inflammatory activity of different parts of Pedalium murex (L.). International Journal of Herbal Medicine 4(3):31−36

    Google Scholar

    [33]

    Dharmadeva S, Galgamuwa LS, Prasadinie C, Kumarasinghe N. 2018. In vitro anti-inflammatory activity of Ficus racemosa L. bark using albumin denaturation method. AYU (An international quarterly journal of research in Ayurveda) 39(4):239−42

    doi: 10.4103/ayu.AYU_27_18

    CrossRef   Google Scholar

    [34]

    Bermúdez-Humarán LG, Motta JP, Aubry C, Kharrat P, Rous-Martin L, et al. 2015. Serine protease inhibitors protect better than IL-10 and TGF-β anti-inflammatory cytokines against mouse colitis when delivered by recombinant lactococci. Microbial Cell Factories 14:26

    doi: 10.1186/s12934-015-0198-4

    CrossRef   Google Scholar

    [35]

    Coppini R, Ferrantini C, Pioner JM, Santini L, Wang ZJ et al. 2019. Electrophysiological and contractile effects of disopyramide in patients with obstructive hypertrophic cardiomyopathy: A Translational Study. JACC: Basic to Translational Science 4(7):795−813

    doi: 10.1016/j.jacbts.2019.06.004

    CrossRef   Google Scholar

    [36]

    Olufunmilayo O, Mary O, Idris O, Rufus A, Bola A, et al. 2018. Anti-inflammatory potential membrane stabilizing and xanthine oxidase inhibitory activities of Clerodendrum volibule ethanol leaf extract on Carrageenan induced inflammation in rats. International Journal of Pharmacology and Toxicology 6(1):7−11

    doi: 10.14419/ijpt.v6i1.8410

    CrossRef   Google Scholar

  • Cite this article

    Nwankwo NE, Ashiakpa PN. 2024. Antimalarial potential of ethanol extract, and anti-inflammatory properties of flavonoid-, terpenoid-, and alkaloid-rich fractions of Sida linifolia L. Food Materials Research 4: e018 doi: 10.48130/fmr-0024-0009
    Nwankwo NE, Ashiakpa PN. 2024. Antimalarial potential of ethanol extract, and anti-inflammatory properties of flavonoid-, terpenoid-, and alkaloid-rich fractions of Sida linifolia L. Food Materials Research 4: e018 doi: 10.48130/fmr-0024-0009

Figures(4)  /  Tables(4)

Article Metrics

Article views(2464) PDF downloads(354)

ARTICLE   Open Access    

Antimalarial potential of ethanol extract, and anti-inflammatory properties of flavonoid-, terpenoid-, and alkaloid-rich fractions of Sida linifolia L.

Food Materials Research  4 Article number: e018  (2024)  |  Cite this article

Abstract: Sida linifolia L. has been employed ethnomedicinally in the treatment of inflammatory diseases such as whitlow and malaria but is yet to be scientifically validated for use in the management of ailments. This investigation sought to assess the antimalarial potential of ethanol leaf extract as well as the in vitro anti-inflammatory qualities of flavonoid-, terpenoid- and alkaloid-rich leaf fractions of Sida linifolia L. The acute toxicity (LD50) study and the effect of the extract on parasitemia and hematological parameters were determined. In vitro, anti-inflammatory parameters were also determined. It was demonstrated that S. linifolia leaf extract was safe and significantly (p < 0.05) reduced parasitemia in malaria-infected mice. The extract also improved blood counts in mice infected with malaria. The activity of the alkaloid-rich fraction against hypotonicity-induced hemolysis was significantly (p < 0.05) higher than those of the terpenoid-rich and flavonoid-rich fractions. On protein denaturation, the activity of the flavonoid-rich fraction had significant (p < 0.05) improvement compared to those of the terpenoid-rich and alkaloid-rich fractions. The fraction with the best anti-proteinase activity was the flavonoid-rich which was better by a significant (p < 0.05) margin than those of alkaloid-rich and terpenoid-rich fractions. The terpenoid-rich fraction showed the highest inhibitory activity against PLA2 activity, followed by the flavonoid-rich and then the alkaloid-rich fractions. Crude leaf extract of S. linifolia proved potent against malaria, and the flavonoid-, terpenoid- and alkaloids-rich fractions exerted anti-inflammatory properties, justifying its use in traditional medicine in the treatment of malaria and other inflammatory diseases.

    • Certain medicinal plants have demonstrated potency in managing and treating various ailments, and the pharmaceutical industry has made extensive use of their secondary metabolites, which are a repertoire of physiologically potent compounds[1]. Sida linifolia L. is a species of plant in the Malvaceae family; it is also commonly known as flaxleaf sida or narrowleaf fanpetals. Sida linifolia is native to regions such as North America, South America, and the dry forest areas of West Africa, particularly Nigeria[2]. The genus Sida has been employed in ethnomedicine to address a variety of illnesses, such as liver problems, urinary tract infections, asthma, headaches, and snake bites. It has also been used to treat digestive ailments and antifertility and used as a diuretic[3]. This is because of its hepatoprotective, antioxidant, analgesic, antibacterial, anti-arthritic, antispasmodic, hypoglycemic, and anti-inflammatory pharmacological properties[4,5]. As a result, phytocompounds with potential for therapeutic use can be found in abundance in Sida linifolia. Previous studies both in vitro and in vivo have discovered that the ethyl acetate fraction, crude ethanol extract, crude aqueous extract, and ethanolic fraction of S. linifolia possess anti-inflammatory properties[6,7].

      Malaria as a life-threatening disease still causes several deaths in many regions of the globe despite the efforts at controlling and eliminating the causative parasite and vectors. It caused about 619,000 deaths and 247 million cases worldwide in 2022[8]. Among the factors that contribute to this high rate of mortality due to malaria is the issue of drug resistance[9]. Due to the high rate of resistance to the existing antimalarials, efforts are being made to identify and possibly isolate new compounds from plants such as Piper nigrum, Zingiber officinale, Nigella sativa, Myristica fragrans, Terminalia arjuna, etc., to serve as lead compounds in the development of a fresh class of antimalarials with little or no resistance. From T. arjuna, compounds such as 3-carboxyphenol, gallic acid, pyrane, ethyl oleate and furfural were identified.

      Inflammation is an intricate biological reaction of bodily tissues to detrimental stimuli, including microbial infection, cellular damage, tissue damage, and irritability from chemicals, it is a defense mechanism that involves blood vessels, molecular mediators, and immune cells[10]. At the location of tissue damage, chemical mediators are released, and immune cells migrate out of blood vessels to start this process[11]. The inflammatory process can be stimulated or inhibited by the inflammatory cytokines produced during inflammation. Several inflammatory-promoting cytokines and chemokines, such as monocyte-chemoattractant protein-1, tumor necrotic factor-α (TNF-α), interleukin 1beta (IL-1β), IL-6, and IL-8 have been shown to have decreased expression in various cell types by several flavonoids[12].

      Flavonoids are a class of secondary metabolites found in a large variety of plants that build up in plant organs such as leaves, fruits, roots, and stems. Flavonoids are thought to be health-promoting and disease-preventing dietary supplements. They have a wide range of health-promoting properties and are used in a wide range of nutraceutical, pharmaceutical, medical, and cosmetic products. This is because of their capacity to modify the activities of cellular enzymes as well as their antioxidant, anti-inflammatory, anti-mutagenic, antibacterial, and other therapeutic qualities[11]. The synthesis and functions of several pro-inflammatory mediators, including adhesion molecules, cytokines, eicosanoids, and C-reactive protein, are inhibited by flavonoids as part of their anti-inflammatory properties[12]. The anti-inflammatory properties of flavonoids may be attributed to various molecular mechanisms, such as the inhibition of pro-inflammatory enzymes like activating protein-1 (AP-1), the activation of phase II antioxidant detoxification enzymes such protein kinase C, mitogen-activated protein kinase (MAPK), and nuclear factor-erythroid 2-related factor 2; and cyclooxygenase-2, lipoxygenase, and inducible nitric oxide (iNO) synthase. Based on scientific evidence, flavonoids may be able to suppress the activation of nuclear factor kappa B (NF-kB), AP-1, and MAPK, which in turn may inhibit the expression of enzymes and proteins related to inflammation[13,12].

      Terpenoids are among the most abundant and diverse classes of secondary metabolites identified in plants[14]. The major role of terpenoids is to protect plants from pathogenic microbes and herbivores by being directly toxic to them, deterring herbivores, or attracting enemies of herbivores[15]. It has been demonstrated that terpenoids have a variety of therapeutic applications, including anti-inflammatory properties. Research has shown that terpenoids ameliorate a range of inflammatory symptoms by inhibiting different stages of the inflammatory process[14]. Most terpenoids' anti-inflammatory effects have been demonstrated to be mediated by a reduction in pro-inflammatory mediator levels, including NO, interleukins, TNF, and prostaglandin E2 (PGE2)[15].

      The alkaloid 3-formyl-6-methoxycarbazole, which was isolated from the root of Clausena lansium showed impressive anti-inflammatory potency, according to an in vitro study conducted by Rodanant et al.[16]. The anti-inflammatory property of 3-formyl-6-methoxycarbazole was demonstrated by its remarkable ability to suppress the release of TNF-a, from monocytes stimulated by lipopolysaccharide (LPS).

      Ethnomedicinally, S. linifolia is employed in the treatment of malaria but there is little or no scientific proof to this claim. The therapeutic properties of certain medicinal plants are due to their contents of secondary metabolites[17]. Nwankwo et al.[18] had previously reported that ethyl acetate leaf fraction of S. linifolia which was rich in phytochemicals, such as phenols, flavonoids, terpenoids, tannins, steroids, and alkaloids exerted anti-inflammatory properties but did not narrow it down to the specific phytochemicals involved. Therefore, it is of interest to investigate the antimalarial properties and in vitro anti-inflammatory properties of the flavonoid-, terpenoid-, and alkaloid-rich fractions of Sida linifolia leaves.

    • In this study, the plant materials used were leaves of Sida linifolia. Mr. Alfred Ozioko, a taxonomist at the Bioresources Development and Conservation Programme (BDCP) Research Center Nsukka, Enugu State, Nigeria, identified and confirmed the leaves. The leaves came from Nsukka, Nsukka Local Government of Enugu State. A sample of the specimen was deposited at the herbarium (voucher no: BDCP20210724).

    • The analytical grade chemicals employed in this investigation were all products of Sigma Aldrich, USA; May and Baker, England; and Burgoyne, India. The assays employed commercial kits and products from Teco (TC), USA and Randox, USA as reagents.

    • The instruments and equipment utilized in this investigation were acquired from Divine Chemicals and the Analytical Laboratory in Nsukka (Nigeria), as well as the laboratory unit of the Department of Biochemistry, University of Nigeria, Nsukka (Nigeria). Others were bought from Nsukka, Enugu State, (Nigeria) commercial vendors.

    • Fresh leaves of Sida linifolia were washed to remove dirt. After being chopped into tiny bits, the leaves were shade-dried for two weeks at room temperature. A known mass (2,000 g) of the pulverized leaves was blended with an electric blender (High-Speed Grinder, China). The pulverized leaves were macerated using 3.2 L of absolute ethanol for 48 h in a tightly corked conical flask. Thereafter, it was filtered using Whatman paper. The ethanol content of the filtrate was further evaporated until constant mass using a soxhlet extraction set-up to obtain a dark green viscous mass of ethanolic leaf extract of Sida linifolia (ELES). The resultant crude extract was stored in a well-labeled sterile screw-capped vessel at 4 °C in a refrigerator until when needed for the study.

    • After re-dissolving the ethanol extract, ethyl acetate was used to isolate flavonoids. This was done 3−5 times. All fractions were concentrated as flavonoid-rich.

      One % hydrochloric acid (HCl) was added to the extracting solvent to break the glycosidic linkage of flavonoids which led to obtaining a high yield of flavonoids.

    • A quantity (1 g) of the crude ethanol extract of S. linifolia was measured out and added to a glass container as plastic containers will leach into the organic solvent. The extraction solvent (85:15, v/v) of ethyl acetate was added. The mixture was then transferred to a flask and was shaken for about 3−4 h overnight. It was separated and purified in column chromatography. Afterward, the eluent (terpenoid-rich fraction) was dried using nitrogen steam.

    • Using n-hexane, ethyl acetate, and ethanol as solvents, column chromatography was used to separate the dried ethanol extract (40 g). A laboratory mortar was used to homogenize the 500 g of silica gel with the dried ethanol extract before being placed within a column for column chromatography. An exact amount (1.3 L) each of ethanol, ethyl acetate, and n-hexane were used to elute the column in turn. To prevent the inactivation of the active components, the fraction was concentrated and dried with a rotary evaporator set at the proper temperature. The samples were kept chilled in preparation for further research.

    • Animals were consigned into six groups (n = 3/group 6), and different treatments were meted on the mice in the various groups. Induction of malaria was performed by inoculation using Plasmodium berghei parasite on mice. The extract (ELES) was administered orally in doses of 100, 200, and 400 mg/kg b.w (per oral), for 3 d. The experimental design was as follows:

      Group 1: No malaria parasite inoculation and received regular saline treatment (vehicle) (Normal control);

      Group 2: Inoculated with the malaria parasite without treatment (Positive control);

      Group 3: Inoculated with malaria and administered with 80 mg/kg body weight of artesunate (Standard control);

      Group 4: Administered with 100 mg/kg body weight of ELES after receiving a malaria parasite inoculation;

      Group 5: Administered with 200 mg/kg body weight of ELES after receiving a malaria parasite inoculation;

      Group 6: Administered with 400 mg/kg body weight of ELES after receiving a malaria parasite inoculation.

    • The animals were administered various treatments in their respective group via oral intubation for 3 d. Twenty-four hours after the last treatment, all the animals were euthanized using a diethylether inhalation jar. Afterward, they were dislocated from their cervical vertebrae, and blood samples were taken by venipuncture into lithium-heparinized specimen bottles for evaluation of biochemical status. The liver of the animals were also harvested and used for liver enzyme analysis.

    • The plant fraction's acute toxicity (LD50) investigation was carried out using Lorke's[19] method. Before the trial began, six groups of mice- three animals in each group- were starved of food for 12 h. Oral dosages of the fraction or aspirin were given to the animals in each group by gastric gavage at different rates (10, 100, 1,000, 1,600, 2,900, and 5,000 mg/kg bw). Animals were examined for behavioral changes (such as incoordination, dullness, and anxiety) or death for 24 h after the treatment.

    • The malaria parasite (Plasmodium berghei) was procured from a malaria-infected mouse at the Department of Veterinary Parasitology and Entomology, Faculty of Veterinary Medicine, University of Nigeria (Nsukka, Nigeria). The blood sample was obtained using a capillary tube from the ocular region of the mice. Ten drops of the parasitized blood, were diluted with 1 mL of normal saline. An aliquot, of 0.2 mL of the mixture was used for each of the mice.

    • The technique of Dacie & Lewis was used to determine the malaria parasitemia (Mp+)[20].

    • The method of Dacie & Lewis was utilized to determine the total red blood cell (RBC) count[20].

    • The method of Dacie & Lewis was utilized to determine the total white blood cell (WBC) count[20].

    • The PCV of the RBC was determined using the technique of Dacie & Lewis[20].

    • Hemoglobin (Hb) concentration was determined using the hemoglobin cyanide (HCN) technique outlined by Dacie & Lewis[20].

    • This was determined using the method of Oyedepo & Famurewa[21] with slight modifications.

      Principle:

      Lysosomal enzymes, released during inflammation, cause various disorders. Anti-inflammatory drugs inhibit these lysosomal enzymes or stabilize the lysosomal membrane. This study was conducted to assess the stability of the Human RBC membrane using the extracts to estimate the anti-inflammatory activity in vitro since the Human RBC membrane is like the lysosomal membrane.

      Procedure:

      Three milliliters of blood were drawn from healthy volunteers, put into an ethylenediaminetetraacetic acid (EDTA) bottle, centrifuged for 10 min at 3000 rpm, and then rinsed three times with an equivalent volume of normal saline. Following measurement, the blood volume was reconstituted as a 40% (v/v) solution using normal saline.

      The hypotonic solution consisted of distilled water dissolved in samples of the fraction and diclofenac sodium. One milliliter of the fraction at different concentrations (0.1, 0.2, 0.4, 0.6, and 0.8 mg/mL) was placed in each of the five test tubes. One milliliter each of 0.2, 0.4, 0.6, and 0.8 mg/mL of diclofenac sodium was put into three more tubes. The vehicle (distilled water) was added to fill each tube to a capacity of 4.9 mL. For this test, two control tubes were employed. The vehicle was placed in a control tube, and 4.9 mL of normal saline (isotonic solution) was placed in another tube. Each tube was filled with 0.1 mL of the suspension of human red blood cells. The mixtures were then gently mixed and allowed to sit at room temperature (37 °C) for 1 h. Following incubation, each tube's reaction mixture was centrifuged for 10 min at 3000 rpm to determine the supernatant's absorbance at 418 nm. There were three duplicates of each test run. For each test, reaction media with 1 mL of various fractions of diclofenac sodium concentrations created up to 5.0 mL in normal saline without human red blood cell (HRBC) suspension were utilized as the corresponding blank. The control tube blank was made of normal saline and did not include any suspension of red blood cells. The following relationship was used to calculate the % inhibition of hemolysis:

      %Inhibitionofhaemolysis=[1{O.D2O.D1O.D3O.D1}]×100

      Where, optical density 1 (OD1) is the absorbance of control I; OD2 is the absorbance test sample; OD3 is the absorbance of control II.

    • The Mizushima & Kobayashi technique[22] was followed to investigate the anti-inflammatory efficacy through the prevention of protein denaturation.

      The reaction mixture was made up of 1% aqueous solution of bovine albumin fraction and test fractions at various concentrations. One N HCl solution in small amounts was used to modify the pH of the reaction mixture. The typical medication used was diclofenac sodium. After 20 min of incubation at 37 °C, the sample fractions were heated for 30 min at 57 °C. After cooling the samples, the turbidity was measured at 660 nm. Three copies of the experiment were run. To calculate the percentage of protein denaturation inhibition, the following formula was used:

      Percentageinhibition(%)=[(O.DofcontrolO.Dofsample)O.Dofcontrol]×100
    • This test was conducted, with a few minor modifications, as described by Sakat et al.[23]. An exact quantity 0.06 mg trypsin, 20 nM Tris HCl buffer pH 7.4, and 1-mL test sample with varying concentrations (0.1, 0.2, 0.4, 0.6, and 0.8 mg/mL) were included in the reaction mixture (2 mL). The mixture was then incubated for 20 min. Two milliliters of 70% perchloric acid was added to halt the reaction. The absorbance of the supernatant was measured at 210 nm using buffer as a blank after centrifuging the hazy suspension. The experiment was performed three times. The following formula was used to determine the percentage inhibition of the anti-protease activity:

      Percentageinhibition(%)=[(O.DofcontrolO.Dofsample)O.Dofcontrol]×100
    • Using a modified Vane's[24] approach, the fraction's inhibitory effect on phospholipase A2 activity was ascertained.

      Principle:

      The erythrocyte membrane is the site of phospholipase A2 activity measurement. Its action results in the release of free fatty acids and leakage, which permits hemoglobin to enter the medium. The concentration of hemoglobin in the medium, which absorbs at its maximum at 418 nm, is directly correlated with this enzyme activity.

      Enzyme preparation:

      A preparation of fungal enzymes was obtained using a culture of Aspergillus niger. Once 15 g of Sabouraud dextrose agar had been dissolved in 1,000 mL of distilled water, homogenizing the mixture for 10 min in a water bath, and then pouring the mixture into 250 mL conical flasks, and the nutritional broth was created. Cotton wool and foil paper were used to seal the conical flasks. After that, the broth was autoclaved for 15 min at 121 °C. After allowing the broth to reach room temperature, the organisms in the Petri dishes were aseptically injected into it and left to incubate for a full 72 h at room temperature. Afterward, the culture was moved into test tubes each with 3 mL of phosphate-buffered saline, the tubes were centrifuged for 10 min at 3,000 rpm. The test tube's supernatant was utilized to prepare crude enzymes, while the fungal cells sank to the bottom.

      Substrate preparation:

      New blood samples were centrifuged for 10 min at 3,000 rpm, and the blood plasma supernatant was disposed of. After three equal washes in normal saline, the red blood cells were quantified and reconstituted as a 40% (v/v) suspension in saline buffered with phosphate. This was going to be phospholipase A2's substrate.

      Assay procedure:

      Test tubes were incubated for 1 h with calcium chloride (2 mM) (0.2 mL), human red blood cells (0.2 mL), the crude enzyme preparation, and different quantities of normal saline, the fraction, and the reference medication. CaCl2, a free enzyme, and a suspension of human red blood cells were present in the control. Separately, 0.2 mL of boiling enzyme was applied to the blanks. The reaction mixtures used for incubation were centrifuged for 10 min at a speed of 3,000 rpm. The absorbance of the solutions was measured at 418 nm after 1.5 mL of the supernatant sample was diluted with 10 mL of normal saline. The comparison medication was diclofenac, a well-known phospholipase A2 inhibitor. The following relationship was used to compute the percentage of maximum enzyme activity and the percentage of inhibition:

      %maximumenzymeactivity={O.DoftestO.Dofcontrol}×100

      % inhibition = 100 − % maximum enzyme activity.

    • Version 20.0 of the Statistical Package for Social Science (SPSS) was used to analyze the data, and the findings were reported as mean ± standard error of the mean. One-way and two-way ANOVA was used to determine whether there was a significant difference in the results, and p < 0.05 was the acceptance threshold for significance for all results.

    • The acute toxicity study's results are displayed in Table 1. The administration of ELES did not show any toxicity up to 5,000 mg/kg bw (p.o.) during the observation period, according to the results.

      Table 1.  Acute toxicity study.

      Treatments
      (mg/kg bw, po, ELES)
      No. of animals usedNo. of deaths recorded
      1030
      10030
      1,00030
      1,70030
      3,00030
      5,00030
      n = 3; po = per oral treatment; bw = body weight.
    • The effect of ELES on the level of parasitemia in Plasmodium berghei-inoculated mice are shown in Table 2. From the result, mice challenged with the malaria parasite and left untreated showed high parasitemia load after inoculation. However, mice administered with various doses (80−400 mg/kg bw) of ELES for 3 d after malaria induction, showed a significant (p < 0.05) decrease in the parasitemia load, and was comparable with the group administered 80 mg/kg b.w. Artesunate. In addition, the peak anti-malaria effect (16.67 ± 5.56) of ELES was observed at the highest dose (400 mg/kg bw ELES), moreover, the extract exerted a significantly (p < 0.05) higher effect at a similar dose.

      Table 2.  Effect of ELES on malaria-infected mice parasitemia.

      GroupsBefore treatment3 d post-treatment
      Normal control0.00 ± 0.00a0.00 ± 0.00a
      Positive control80.00 ± 5.77b70.00 ± 5.77e
      80 mg/kg bw Arthesunate73.33 ± 13.33b30.00 ± 3.33c
      100 mg/kg bw ELES63.33 ± 8.82b46.67 ± 3.33d
      200 mg/kg bw ELES63.33 ± 12.02b26.67 ± 3.33bc
      400 mg/kg bw ELES56.67 ± 2.02b16.67 ± 5.56b
      n = 3. Results are presented as Means ± SEM. Mean values that differ in superscripted alphabets down the columns are deemed significant (p < 0.05).
    • The effect of treatment with the ELES on the hematological parameters of malaria-infected mice is presented in Figs 14.

      From Fig. 2, the highest white blood cell (WBC) count was noticed in the normal control group which is 6.93 ± 0.48 109/L, while the lowest count was in group 3 (4.13 ± 0.46 109/L). The WBC counts of all extract-treated groups on 3 d post-treatment were non-significantly (p > 0.05) higher when compared to the standard control.
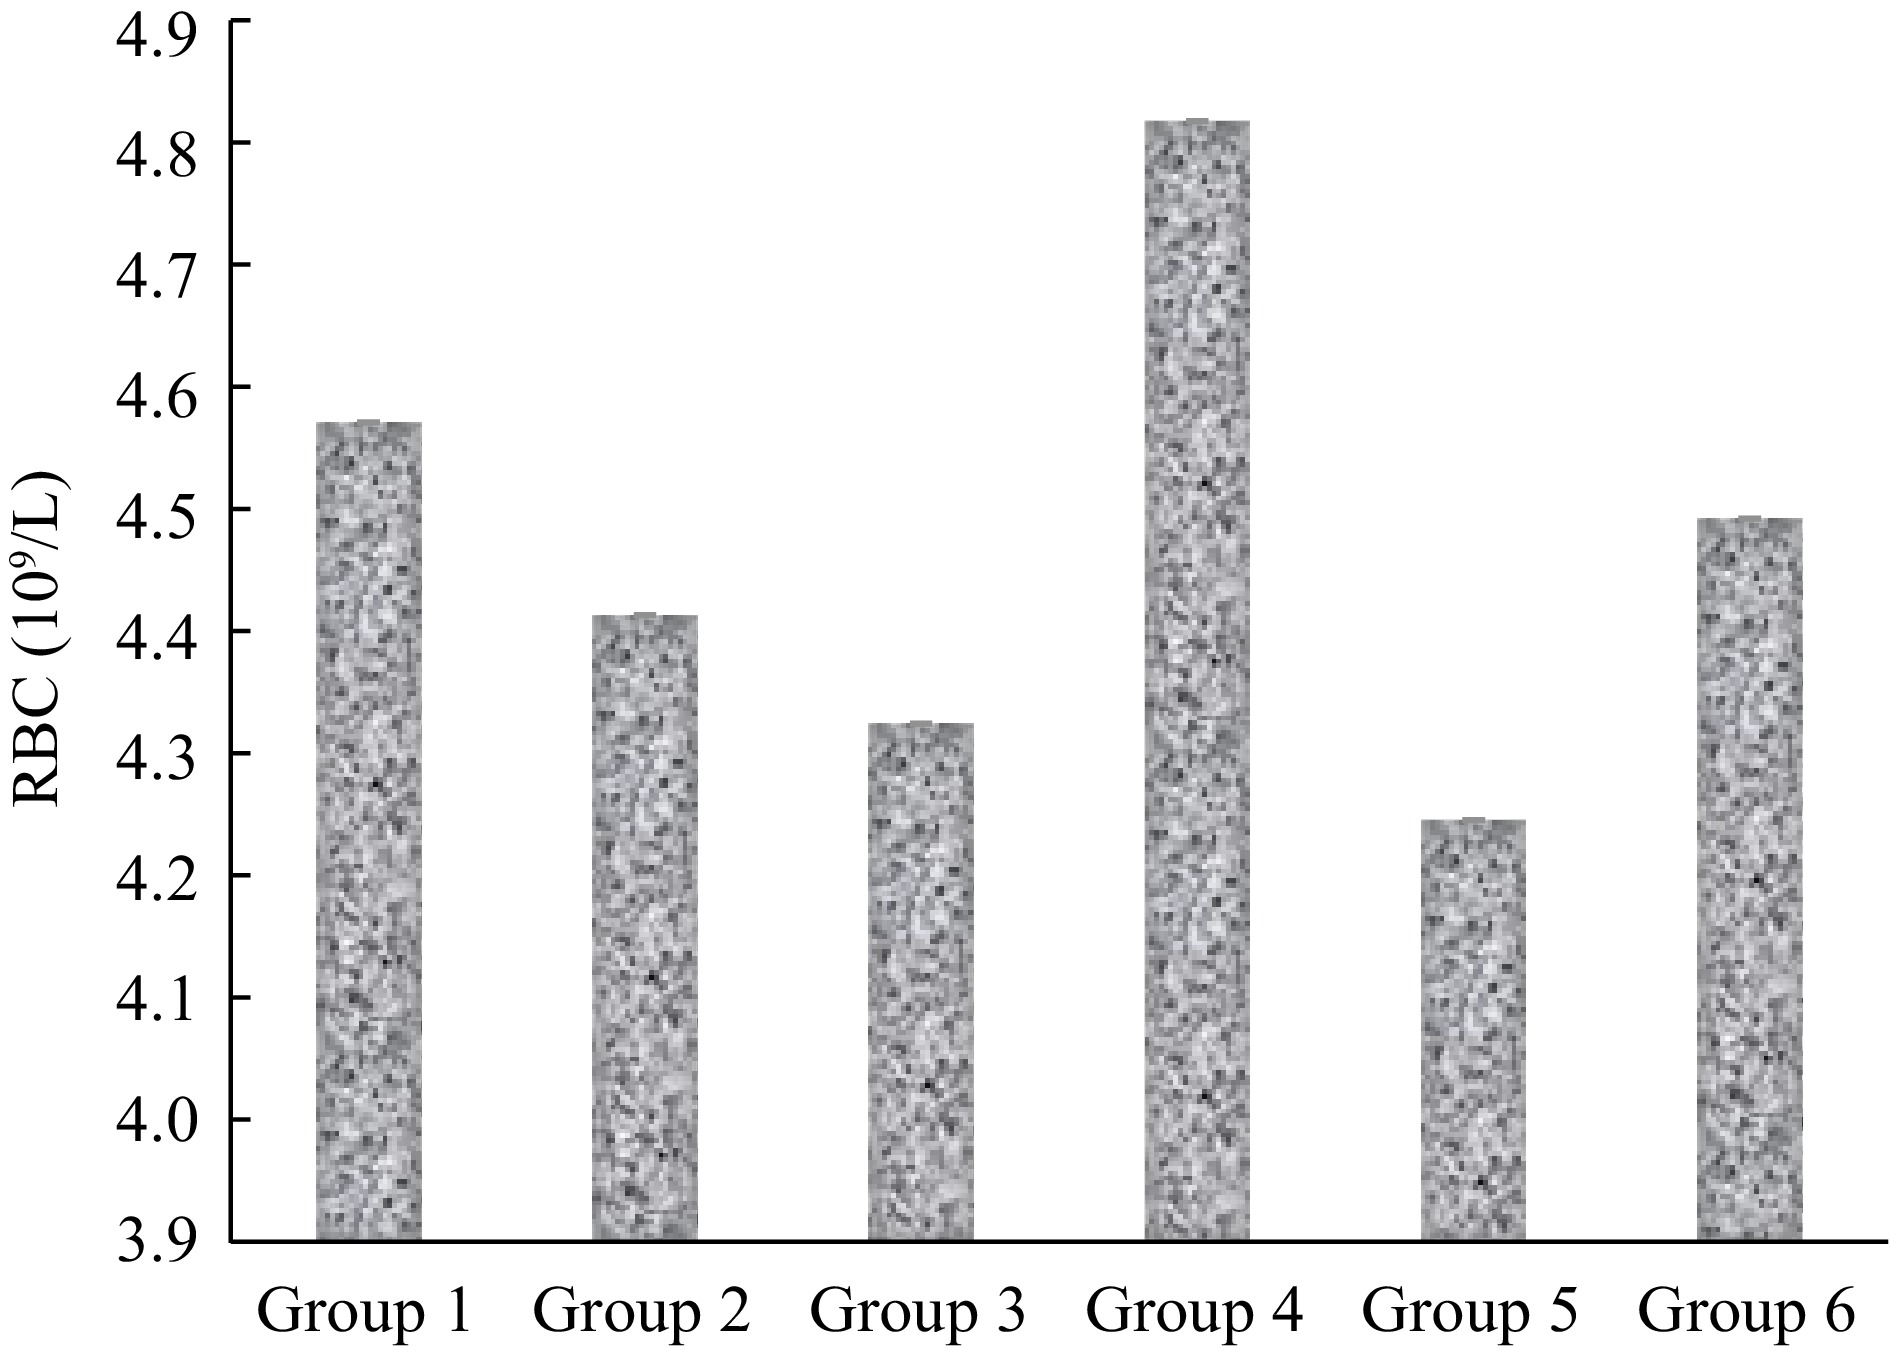
      Figure 1. 

      RBC count of mice infected with malaria and treated with extract of S. linifolia.
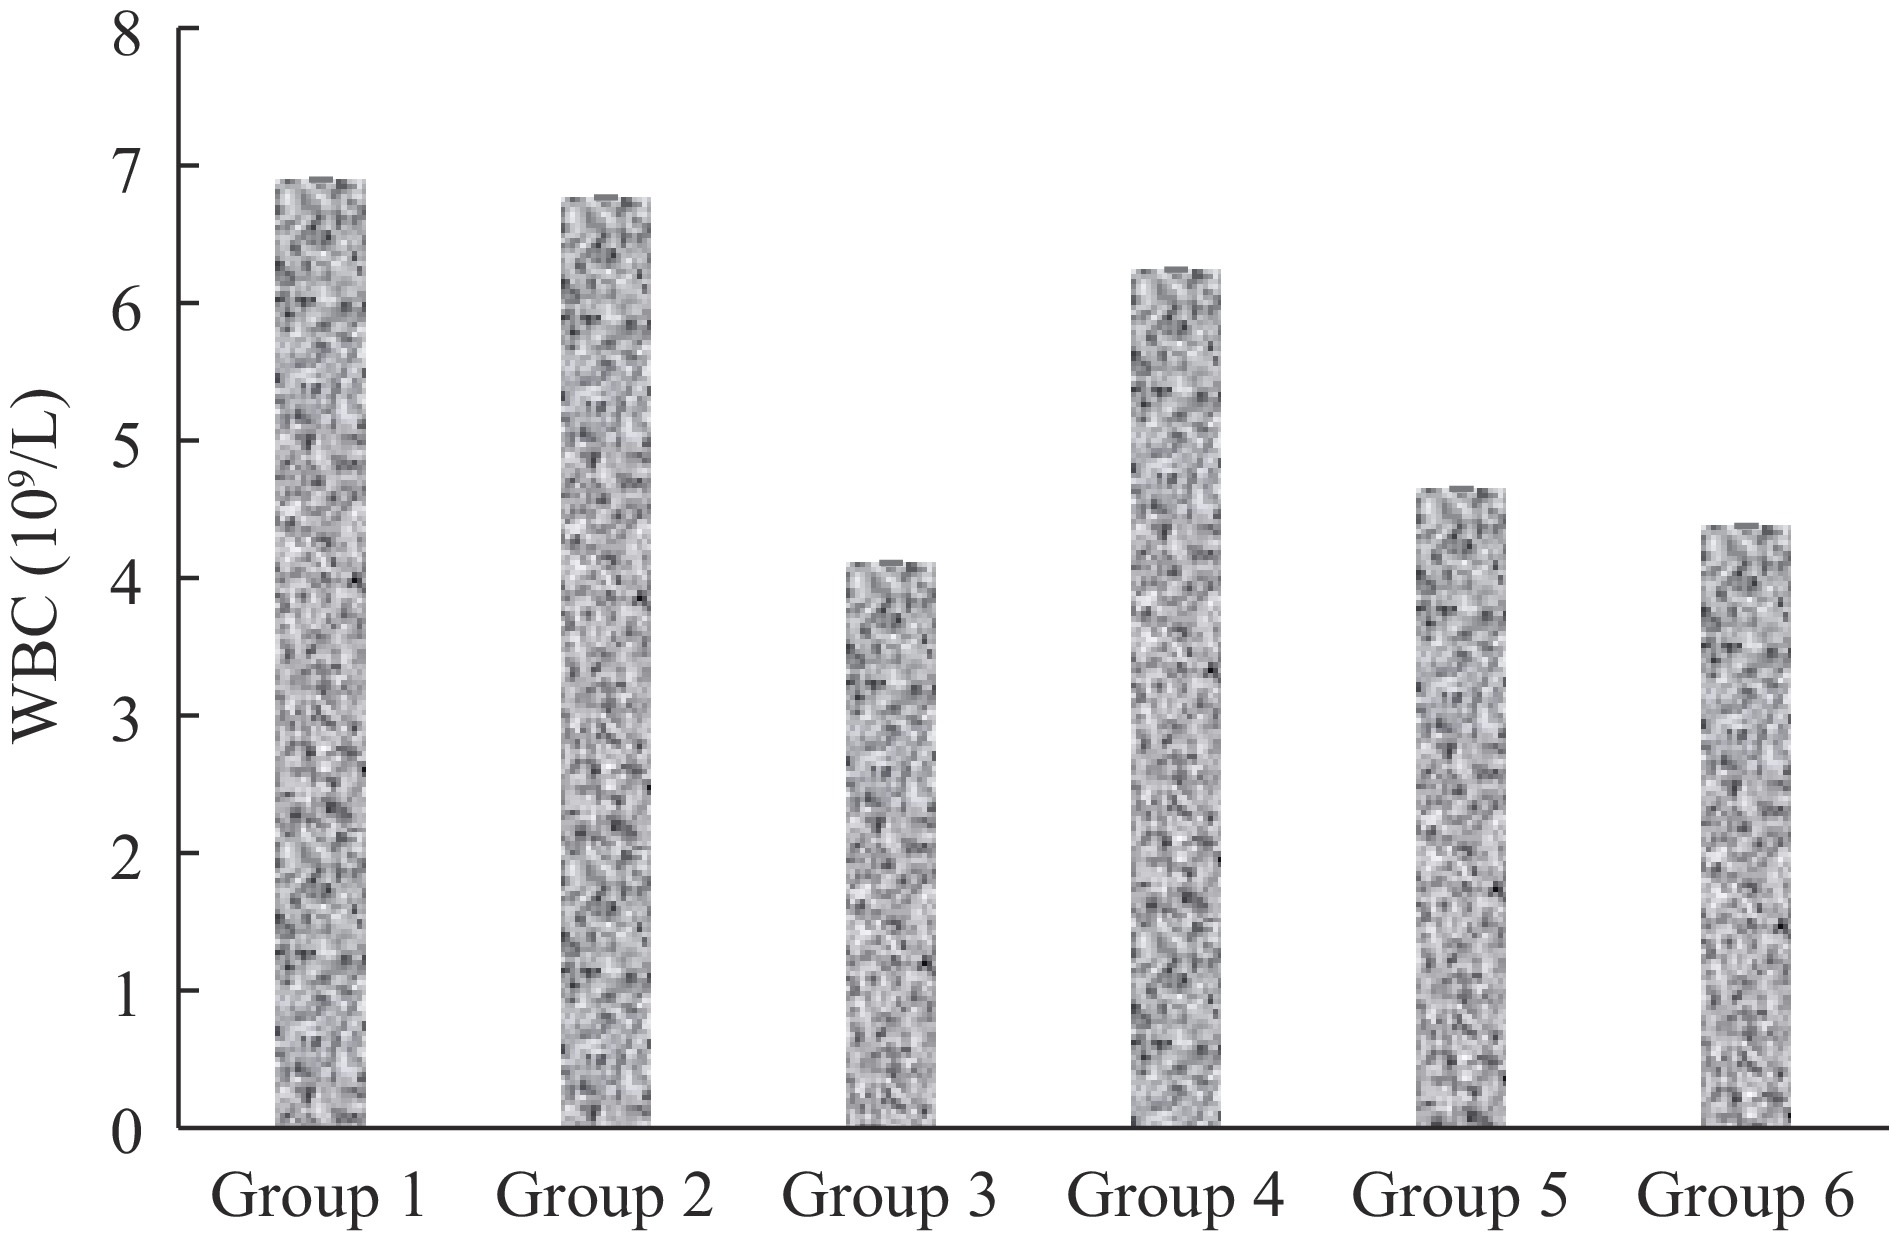
      Figure 2. 

      WBC count of mice infected with malaria and treated with extract of S. linifolia.
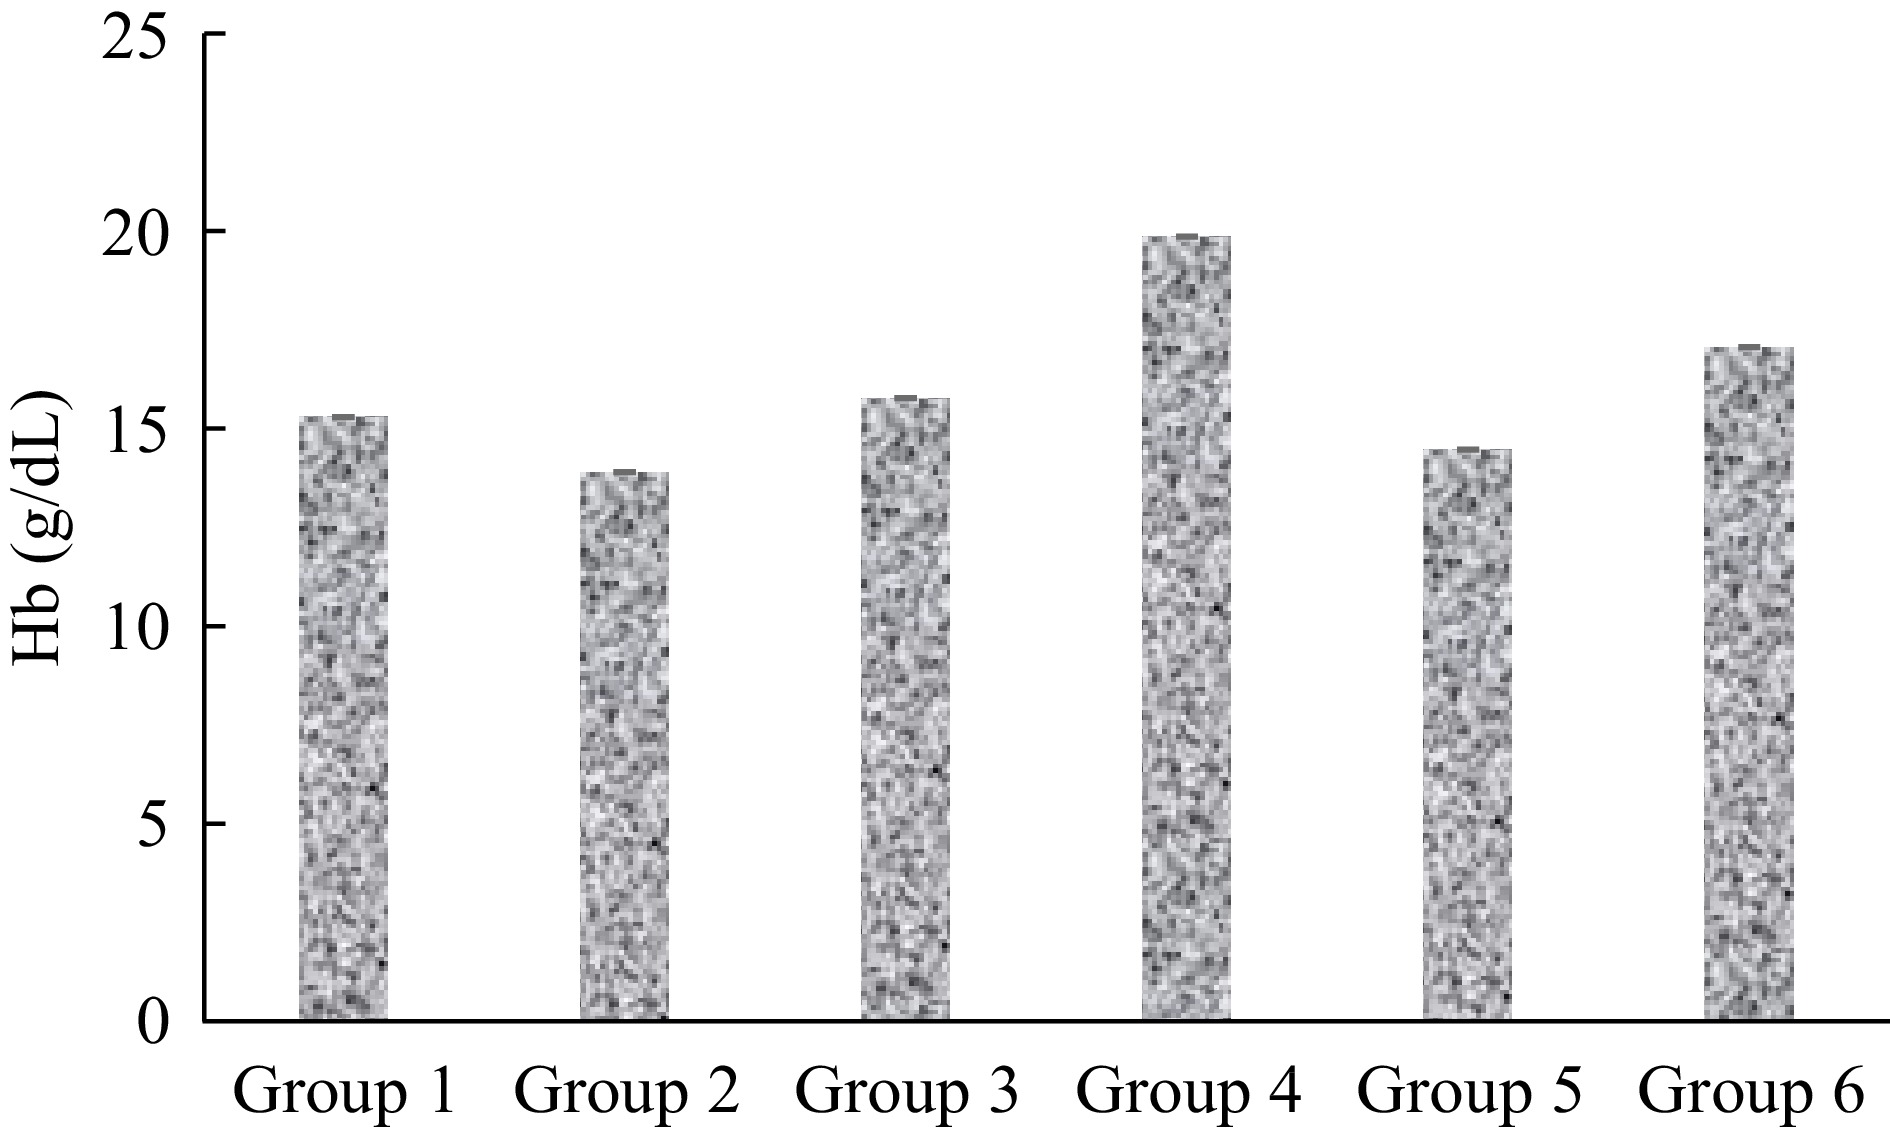
      Figure 4. 

      Hb concentration of mice infected with malaria and treated with extract of S. linifolia.

      The highest packed cell volume (PCV) percentage was observed in group 6 which is 42.00% ± 4.163%, while the lowest percentage was in group 5 (38.67 ± 1.856) (Fig. 3). The PCV percentage of groups 4 and 6, 3 d post-treatment was non-significantly (p > 0.05) higher when compared to the standard control.

      The highest red blood cell (RBC) count was observed in group 4 which is 4.83 ± 0.22 109/L, while the lowest count was in group 5 (4.25 ± 0.38 109/L) (Fig. 1). The RBC counts of groups 5 and 6, 3 d post-treatment were non-significantly (p > 0.05) higher when compared to the standard control.
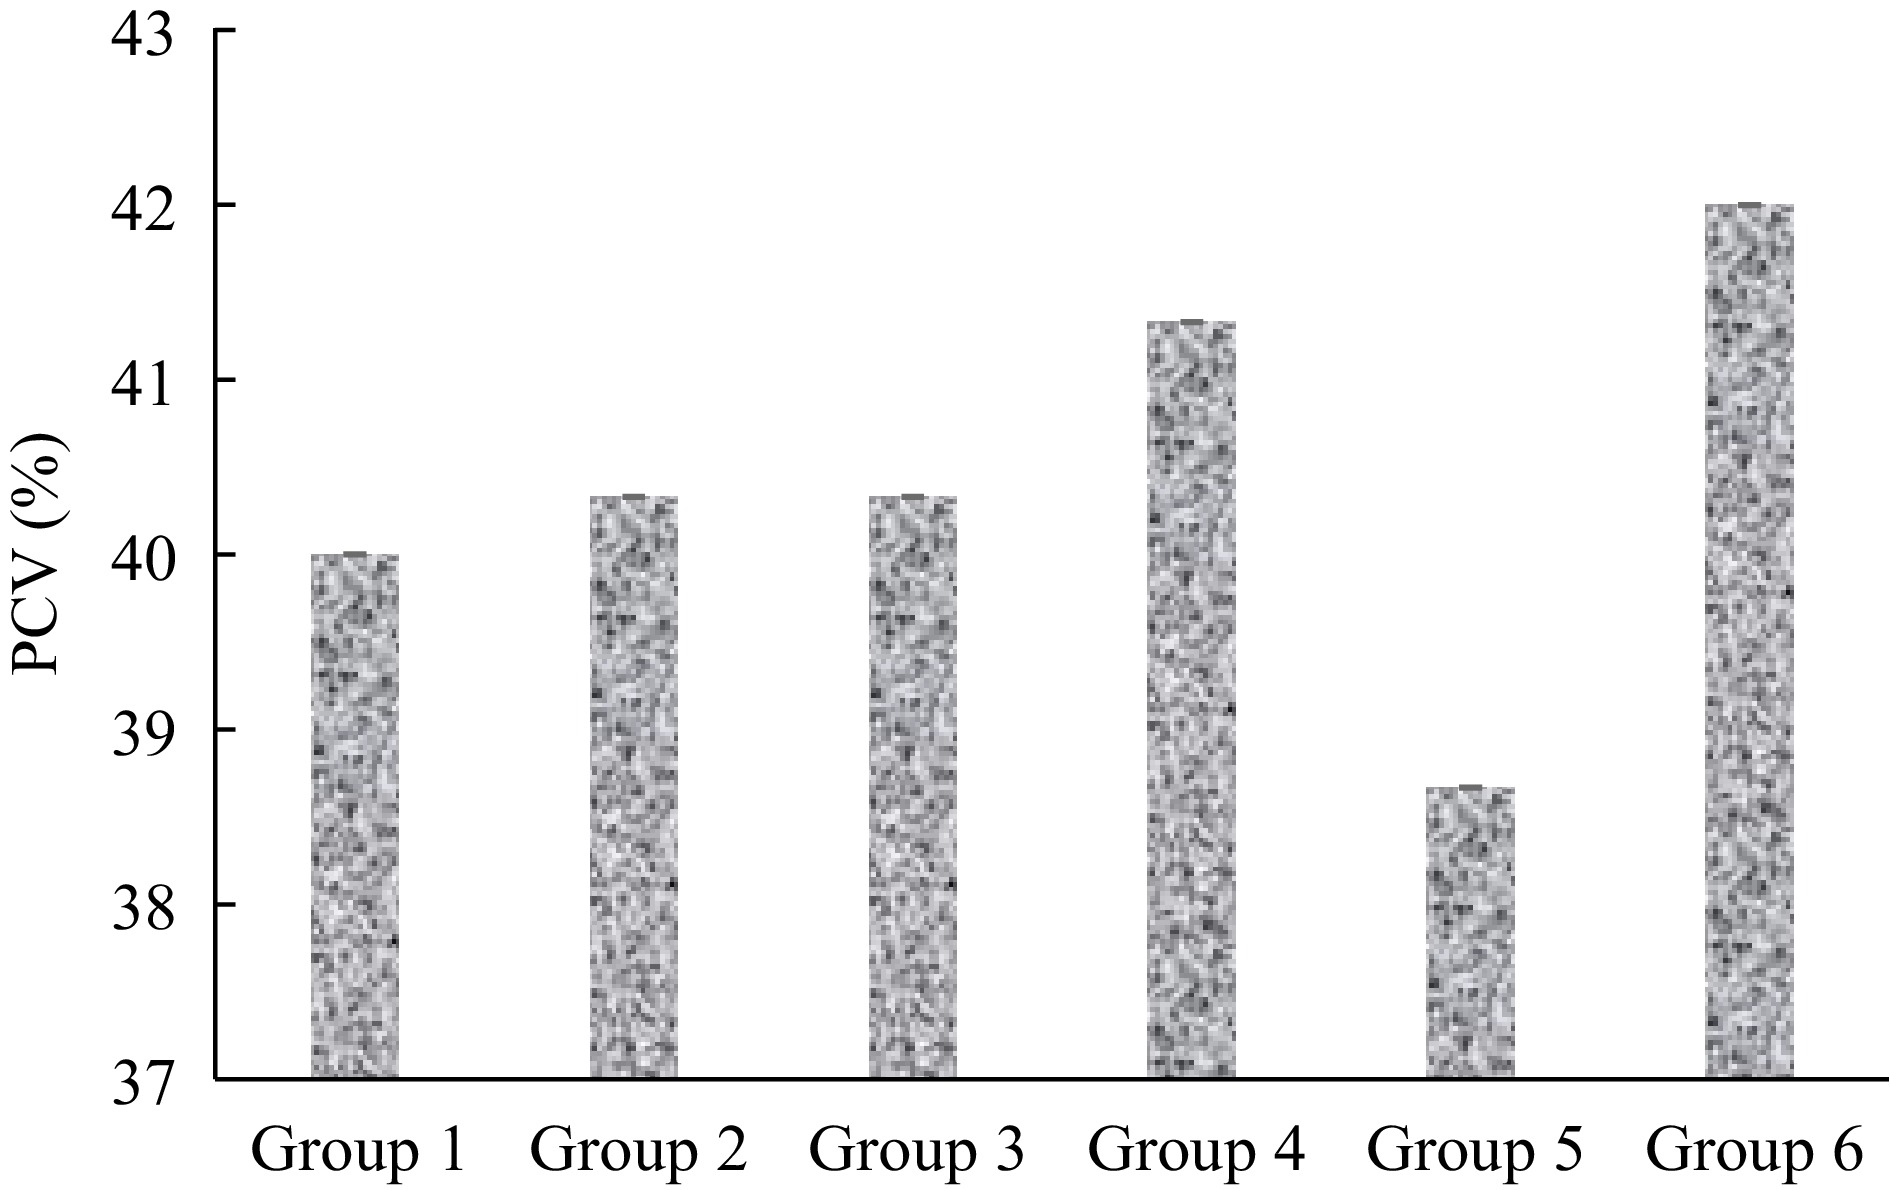
      Figure 3. 

      PCV of mice infected with malaria and treated with extract of S. linifolia.

      As shown in Fig. 4, the highest hemoglobin (Hb) concentration was observed in group 4 which is 19.90 ± 0.800 g/dL, while the lowest concentration was in the positive control group (13.93 ± 0.811 g/dL). The Hb concentration of groups 4 and 6, 3 d post-treatment was significantly (p < 0.05) higher when compared to the standard control.

    • The % inhibitions of hypotonicity-induced hemolysis exhibited by FRF, TRF, and ARF of S. linifolia leaves are presented in Table 3. The result revealed that the highest % inhibition was exhibited by 200 µg/mL while the lowest % inhibition was exhibited by 800 µg/mL of the FRF. Compared to the standard (50 µg/mL), there was a significant (p < 0.05) increase in hypotonicity-induced hemolysis inhibition of the fraction at 50 µg/mL.

      Table 3.  Membrane stabilization capacity of FRF, TRF, and ARF of S. linifolia on hypotonicity-induced hemolysis and protein denaturation.

      Concentrations
      (µg/mL)
      FRFTRFARF
      Hypotonicity-induced hemolysis (% inhibition)
      5043.15 ± 2.45a51.50 ± 399.40a61.20 ± 1.20b
      10078.45 ± 8.15b89.734 ± 194.04b88.50 ± 201.50a
      20080.65 ± 3.45c64.10 ± 5.40c75.30 ± 12.30c
      40067.45 ± 6.45d69.70 ± 124.88d73.45 ± 26.75d
      80070.10 ± 174.10e53.80 ± 260.80e68.15 ± 2.15e
      Aspirin (50 µg/mL)79.76 ± 8.72b79.76 ± 8.72f79.76 ± 8.72f
      Protein denaturation (% inhibition)
      5032.44 ± 41.10a35.12 ± 52.40a22.99 ± 3.66a
      10094.64 ± 1.86b77.02 ± 10.57b80.95 ± 4.04a
      20085.12 ± 1.81c53.27 ± 8.87c84.00 ± 18.09c
      40062.50 ± 2.73d66.07 ± 2.73d71.73 ± 23.90d
      80079.82 ± 7.80e76.84±21.60b88.02 ± 18.04e
      Aspirin (50 µg/mL)79.76 ± 8.72e79.76 ± 8.72e79.76 ± 8.72f
      Values are presented as mean ± standard error of the mean (SEM). Values with different letter superscripts are significantly (p < 0.05) different.

      The % inhibition of hypotonicity-induced hemolysis exhibited by TRF of S. linifolia revealed that the highest % inhibition was exhibited at 100 µg/mL, while the lowest % inhibition was exhibited at 800 µg/mL. Compared to the standard (50 µg/mL) there was a significant (p ˂ 0.05) decrease in hypotonicity-induced hemolysis inhibition by the fraction at 50 µg/mL. There was also a significant (p ˂ 0.05) decrease in hemolysis inhibition by the TRF with an increase in concentrations (200, 400, 800 µg/mL).

      The percentage inhibition of hypotonicity-induced hemolysis exhibited by the ARF of S. linifolia revealed that the highest percentage inhibition was exhibited at 50 µg/mL, while the lowest percentage inhibition was exhibited at a concentration of 800 µg/mL of the alkaloid-rich fraction.

    • The % inhibition of protein denaturation exhibited by the FRF, TRF, and ARF of S. linifolia leaves are presented in Table 3. The results revealed that the highest % inhibition was exhibited by 100 µg/mL while the lowest % inhibition was exhibited by 800 µg/mL of the FRF. Compared to the standard (50 µg/mL), there was a significant (p < 0.05) decrease in protein denaturation inhibition of the fraction at 50 µg/mL. There was a significant (p < 0.05) increase in the protein denaturation inhibition of the fraction at 100 µg/mL compared to that of the standard (50 µg/mL).

      The result of the % inhibition of protein denaturation exhibited by the TRF of S. linifolia revealed that the highest % inhibition was exhibited at 100 µg/mL, while the lowest % inhibition was exhibited at 800 µg/mL. Compared to the standard (50 µg/mL) there was a significant (p ˂ 0.05) decrease in protein denaturation inhibition by the fraction at the same concentration. There was a significant (p < 0.05) decrease in protein denaturation inhibition with increasing concentrations.

      The percentage inhibition of protein denaturation exhibited by the ARF of S. linifolia leaves revealed that the highest percentage inhibition was exhibited at 50 µg/mL, while the lowest percentage inhibition was exhibited at a concentration of 800 µg/mL of the alkaloid-rich fraction. However, there was a significant (p < 0.05) difference down the column with increasing concentration of the alkaloid-rich fraction and there was no significant (p > 0.05) difference in the standard.

    • The % inhibition on anti-proteinase activity exhibited by the FRF, TRF, and ARF of S. linifolia leaves are presented in Table 4. The result revealed that the highest % inhibition was exhibited by 50 µg/mL while the lowest % inhibition was exhibited by 800 µg/mL of the FRF. Compared to the standard (50 µg/mL) there was a significant (p < 0.05) increase in anti-proteinase activity inhibition of the fraction at 50 µg/mL.

      Table 4.  Effect of FRF, TRF, and ARF of S. linifolia on proteinase and phospholipase A2 activities.

      Concentrations
      (µg/mL)
      FRFTRFARF
      Proteinase (% inhibition)
      5020.80 ± 0.42c14.40 ± 0.29b15.84 ± 2.30b
      10023.71 ± 0.79b18.75 ± 1.56a18.13 ± 2.20a
      20030.46 ± 8.34a20.78 ± 3.14c20.92 ± 1.81c
      40033.27 ± 6.25d27.09 ± 8.00d33.44 ± 3.09d
      80039.96 ± 9.37e32.04 ± 5.63e39.85 ± 2.93e
      Aspirin (50 µg/mL)62.64 ± 3.84f62.64 ± 3.84f62.64 ± 3.84f
      Phospholipase A2 (% inhibition)
      5059.85 ± 24.63b41.00 ± 3.12a42.25 ± 5.69b
      10082.57 ± 5.89c58.87 ± 2.41b61.78 ± 0.72a
      20084.61 ± 2.51a69.69 ± 4.767c62.00 ± 6.86c
      40073.77 ± 8.96d70.63 ± 4.03d62.47 ± 10.47c
      80085.90 ± 2.67a60.08 ± 6.44e69.82 ± 7.14d
      Prednisolone (50 µg/mL)76.01 ± 1.52e76.01 ± 1.52f76.01 ± 1.52e
      Values are presented as mean ± standard error of the mean (SEM). Values with different letter superscripts are significantly (p < 0.05) different.

      The result of the % inhibition of proteinase activity exhibited by the TRF of S. linifolia revealed that the leaf extract was effective in inhibiting protease activity in a dose-dependent manner. The highest % inhibition was exhibited at 50 µg/mL, while the lowest % inhibition was exhibited at 800 µg/mL. At a lower concentration of 50 µg/mL, there was a significant (p ˂ 0.05) increase in the proteinase activity inhibition compared to the standard at the same concentration.

      The percentage inhibition of anti-proteinase activity exhibited by the ARF of S. linifolia leaves revealed that the highest percentage inhibition was exhibited by 800 µg/mL while the lowest percentage inhibition was exhibited by 50 µg/mL of the ARF. Although there was a significant (p < 0.05) difference in the alkaloid-rich fraction at different concentrations, lower activities were observed with increasing concentrations. However, the standard showed no activity and no significant (p > 0.05) difference with increasing concentration.

    • The % inhibition of phospholipase A2 (PLA2) activity exhibited by the FRF, TRF, and ARF of S. linifolia leaves are presented in Table 4. The result revealed that the highest % inhibition was exhibited by 800 µg/mL while the lowest % inhibition was exhibited by 50 µg/mL of the FRF. Compared to the standard (50 µg/mL) there was a significant (p < 0.05) decrease in PLA2 activity inhibition of the fraction at 50 µg/mL. There was a significant (p < 0.05) increase in the PLA2 activity inhibition of the fraction at 800 µg/mL compared to that of the standard (50 µg/mL).

      The % inhibition of PLA2 activity exhibited by the TRF of S. linifolia revealed that the TRF of S. linifolia was effective in inhibiting PLA2 activity in a dose-dependent manner. The highest % inhibition was exhibited at 400 µg/mL, while the lowest % inhibition was exhibited at a concentration of 100 µg/mL. At a lower concentration of 50 µg/mL, there was a significant (p ˂ 0.05) decrease in PLA2 activity inhibition compared to the standard at the same concentration.

      The percentage inhibition of PLA2 activity exhibited by the ARF of S. linifolia leaves revealed that the highest percentage inhibition was exhibited at 400 µg/mL while the lowest percentage inhibition was exhibited at a concentration of 800 µg/mL of the ARF.

    • There was no sign of toxicity, including mortality observed in any of the treated animal groups during the LD50 study even at the dose level of 5,000 mg/kg of ethanol extract of S. linifolia leaf, thus an indication that the extract is safe for consumption and could cause very minimal damage to the organ even at high dosages. The extract was able to significantly reduce the number of malarial parasites in the blood, thus validating the antiplasmodial capacity of the plant extract. In a study conducted by Enechi et al.[25], the ethanol leaf extract of Sida acuta, when administered to Plasmodium berghei ANKA-65, significantly decreased parasitemia and suppressed the malaria parasite. Hematological parameters such as RBC count, WBC count, PCV and hemoglobin were improved upon administration of the ethanol leaf extract of S. linifolia. Leaf extracts of some medicinal plants such as those of Mucuna pruriens have been observed to boost hematological parameters (RBC, WBC, PCV, and Hb) in Albino rats[26].

      The result of the present study revealed that the FRF of Sida linifolia leaves inhibited hypotonicity-induced hemolysis at all the concentrations but was most effective at 200 µg/mL. Compared to the standard (Aspirin) at 50 µg/mL, there was a significant increase in the fraction of inhibiting hypotonicity-induced hemolysis at 200 µg/mL. The results indicate that S. linifolia TRF significantly inhibited hypotonicity-induced hemolysis at a lower dose (100 µg/mL) than the FRF. At 100 µg/mL, ARF exhibited better activity compared to the FRF. The highest percentage inhibition of hypotonicity-induced hemolysis was by TRF (89.734%) which was comparable to that of the standard (79.76 %) at 50 µg/mL. Since it was found that several chemicals that can release hydrolytic enzymes from lysosomes can also damage erythrocytes, Ajayi et al.[27] suggested that the membrane of an erythrocyte serves as a model for the membrane of a lysosome. So, since the above fractions were able to inhibit the activities of the hydrolytic enzymes against erythrocytic membranes, they can serve as a good source of anti-inflammatory drugs.

      The FRF of Sida linifolia leaves showed the highest % inhibition (94.64%) on protein denaturation at 100 µg/mL. Compared to the standard (Aspirin) at 50 µg/mL, there was a significant increase in the fraction's capacity of inhibiting protein denaturation at this concentration. The TRF significantly inhibited protein denaturation with the highest % inhibition (77.02%) at 100 µg/mL, and this was comparable to that of the standard (79.76) at 50 µg/mL. The ARF at 800 µg/mL exhibited the highest (88.02%) inhibition against protein denaturation. Against protein denaturation, the activity of the FRF was the best, followed by the TRF and then the ARF. This is consistent with a study by Enechi et al.[28], which showed that compounds that may prevent protein denaturation are a potential target for the development of anti-inflammatory drugs, as this process is a well-established source of inflammation. Also, Yesmin et al.[29] elucidated the membrane-stabilizing mechanism of anti-inflammatory agents. According to a study by Agrawal & Paridhavi[30], albumin proteins that have been denatured produce antigens, which set off a type III hypersensitivity reaction that causes inflammation. Sen et al.'s research[31] supported the idea that the mechanism underlying protein denaturation is unpredictable and involves changes to hydrophobic, disulfide, and electrostatic hydrogen bonds. This is in line with earlier research conducted by Sangeetha & Vidhya[32], which explained how protein denaturation causes the creation of autoantigens in inflammatory illnesses such as rheumatoid arthritis, diabetes, and cancer. Dharmadeva et al.[33] suggested that inhibition of protein denaturation can attenuate inflammatory activities.

      The FRF of Sida linifolia leaves had an anti-proteinase activity with the highest % inhibition (39.96%) at 800 µg/mL. The TRF of S. linifolia effectively inhibited proteinase activity significantly with the highest % inhibition (32.04%) at a level of 800 µg/mL. Also, at 800 µg/mL, the ARF had the highest anti-proteinase activity (39.85%). The fraction with the best anti-proteinase activity was FRF, followed by ARF and then TRF. The result revealed that the FRF, TRF, and ARF of Sida linifolia leaves were effective in inhibiting proteinase activities with increasing concentrations. This corresponds with a study by Enechi et al.[28] which also demonstrated that a plant extract exhibits significant anti-proteinase activity at different concentrations. According to research by Bermúdez-Humarán et al.[34], proteinases are involved in several immune system arms, participate in a variety of physiological and pathologic states, and are crucial in inflammation. Proteinase inhibition has been reviewed by Coppini et al.[35] as a therapeutic target in the management of many inflammatory disorders.

      The FRF of Sida linifolia leaves was most effective (85.90%) at inhibiting PLA2 activity at the highest level of 800 µg/mL which could be compared to that of the standard (Prednisolone) at 50 µg/mL. The inhibitory effect of TRF against PLA2 activity was highest (70.63%) at 400 µg/mL. The ARF showed the highest (69.82%) inhibitory effect against PLA2 activity at 800 µg/mL. The TRF showed the highest inhibitory activity against PLA2 activity, followed by the FRF and then the ARF. The findings of this investigation is consistent with a study conducted by Olarenwaju et al.[36], which clarified the mechanism by which anti-inflammatory agents stabilize their membranes by blocking PLA2 activities, thereby impeding the synthesis and eicosanoids' release, which are implicated in the mechanisms of inflammation.

    • The ethanol leaf extract of Sida linifolia exhibited antimalarial potential by reducing the amount of the malarial parasite Plasmodium berghei in the blood and again it improved the blood cell counts and other related parameters in malaria-infected mice. The flavonoid-, terpenoid-, and alkaloid-rich fractions of S. linifolia exhibited characteristics that reduced inflammation by membrane stabilization, protecting protein denaturation, inhibiting proteinase and phospholipase A2 activities. The anti-inflammatory properties of S. linifolia leaf lie both in the polar (flavonoids and alkaloids), and non-polar (terpenoids) constituents of the plant. The extract and fractions have proven to be good sources of antimalarial and anti-inflammatory agents as advocated by traditional healers. The next step in the development of new drugs from these fractions, for synthetic chemists, is to isolate the active principles responsible for the said activities and possibly synthesize a new line of pharmaceuticals from them.

    • The authors confirm contribution to the paper as follows: study conception and design, supervision of the experiments: Nwankwo NE; experiments, draft manuscript preparation, statistical analysis and data interpretation: Ashiakpa NP. Both authors reviewed and approved the final version.

    • All data generated or analyzed during this study are included in this article.

    • The University of Nigeria, Nsukka staff provided support and solidarity during the experiment, which the authors appreciate. We greatly value the contributions made by the staff members at the other universities we visited for the study.

      • The authors declare that they have no conflict of interest.

      • Copyright: © 2024 by the author(s). Published by Maximum Academic Press on behalf of Nanjing Agricultural University. This article is an open access article distributed under Creative Commons Attribution License (CC BY 4.0), visit https://creativecommons.org/licenses/by/4.0/.
    Figure (4)  Table (4) References (36)
  • About this article
    Cite this article
    Nwankwo NE, Ashiakpa PN. 2024. Antimalarial potential of ethanol extract, and anti-inflammatory properties of flavonoid-, terpenoid-, and alkaloid-rich fractions of Sida linifolia L. Food Materials Research 4: e018 doi: 10.48130/fmr-0024-0009
    Nwankwo NE, Ashiakpa PN. 2024. Antimalarial potential of ethanol extract, and anti-inflammatory properties of flavonoid-, terpenoid-, and alkaloid-rich fractions of Sida linifolia L. Food Materials Research 4: e018 doi: 10.48130/fmr-0024-0009

Catalog

  • About this article

/

DownLoad:  Full-Size Img  PowerPoint
Return
Return