-
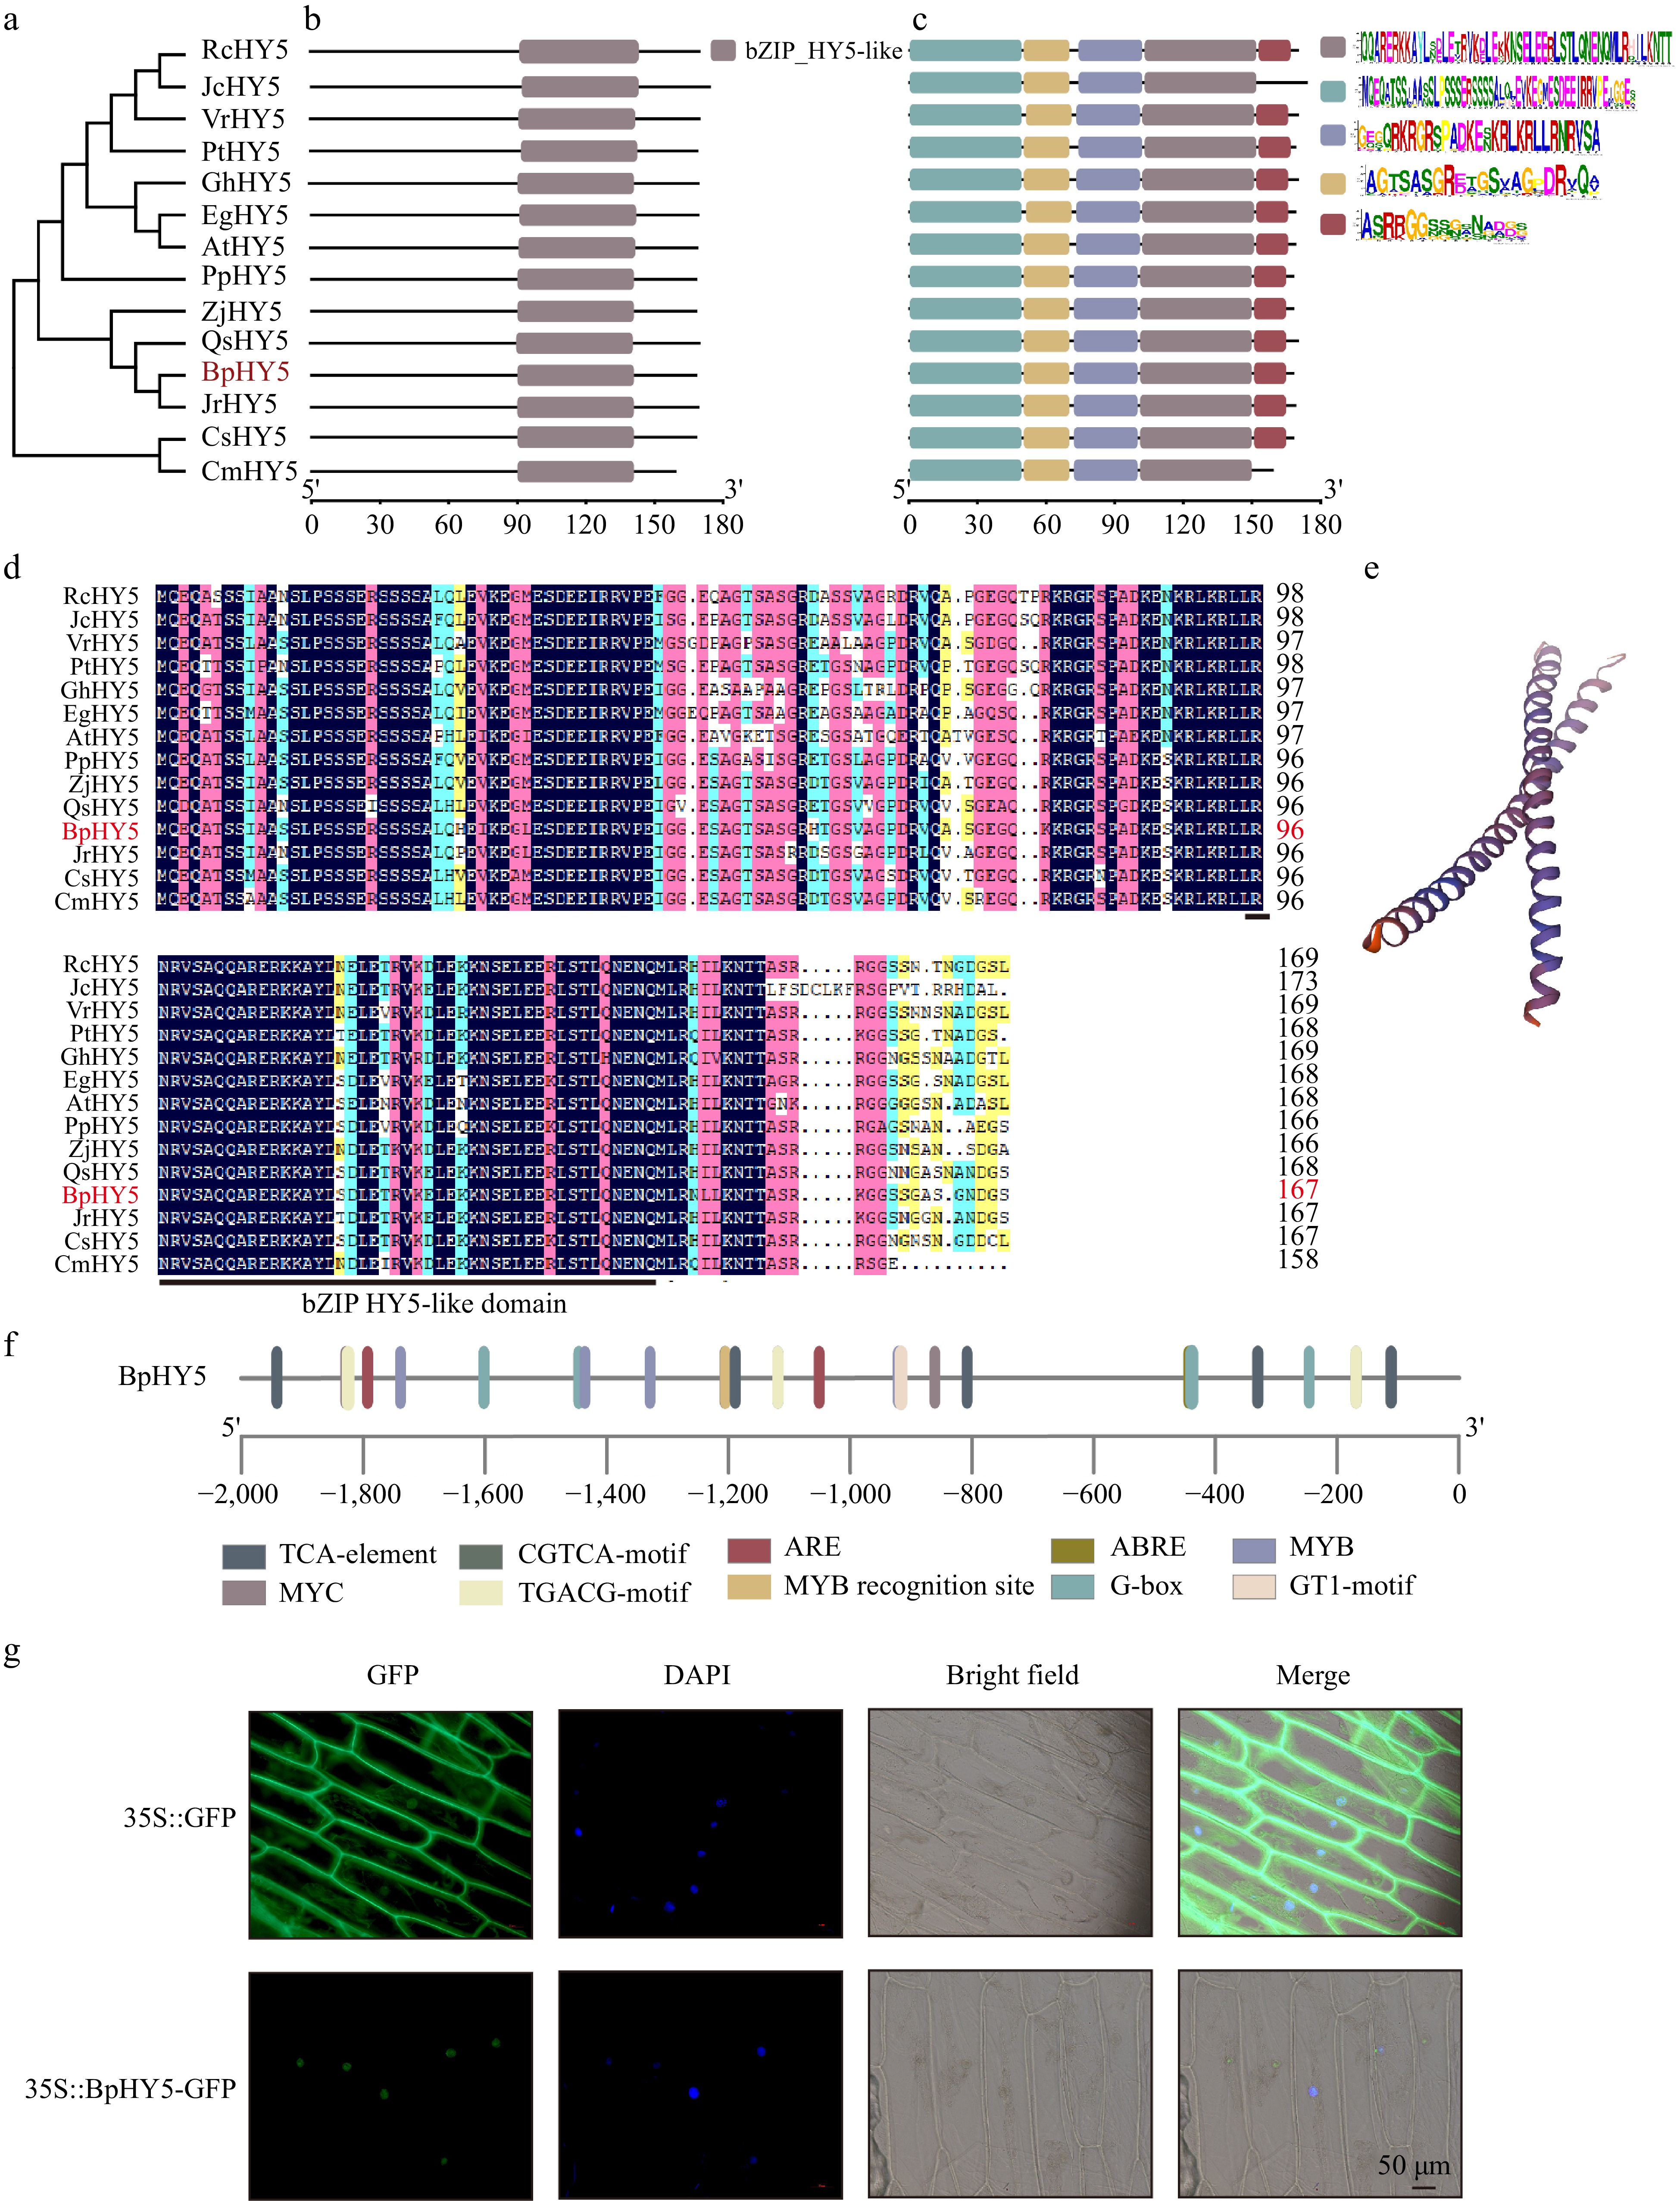
Figure 1.
Phylogenetic, sequence analysis, and subcellular localization of BpHY5. (a) Phylogenetic tree of HY5. Predicted conserved (b) domain and (c) motifs of HY5 proteins, with five colored boxes representing five motifs. (d) Multiple sequence alignment. (e) The predicting 3D structure of BpHY5. (f) Cis-acting element analysis of the promoter sequence of BpHY5. (g) Subcellular localization of 35S::GFP and 35S::BpHY5-GFP. Images represent GFP, DAPI, bright field, and their merged, respectively. The scale bar represents 50 μm.
-
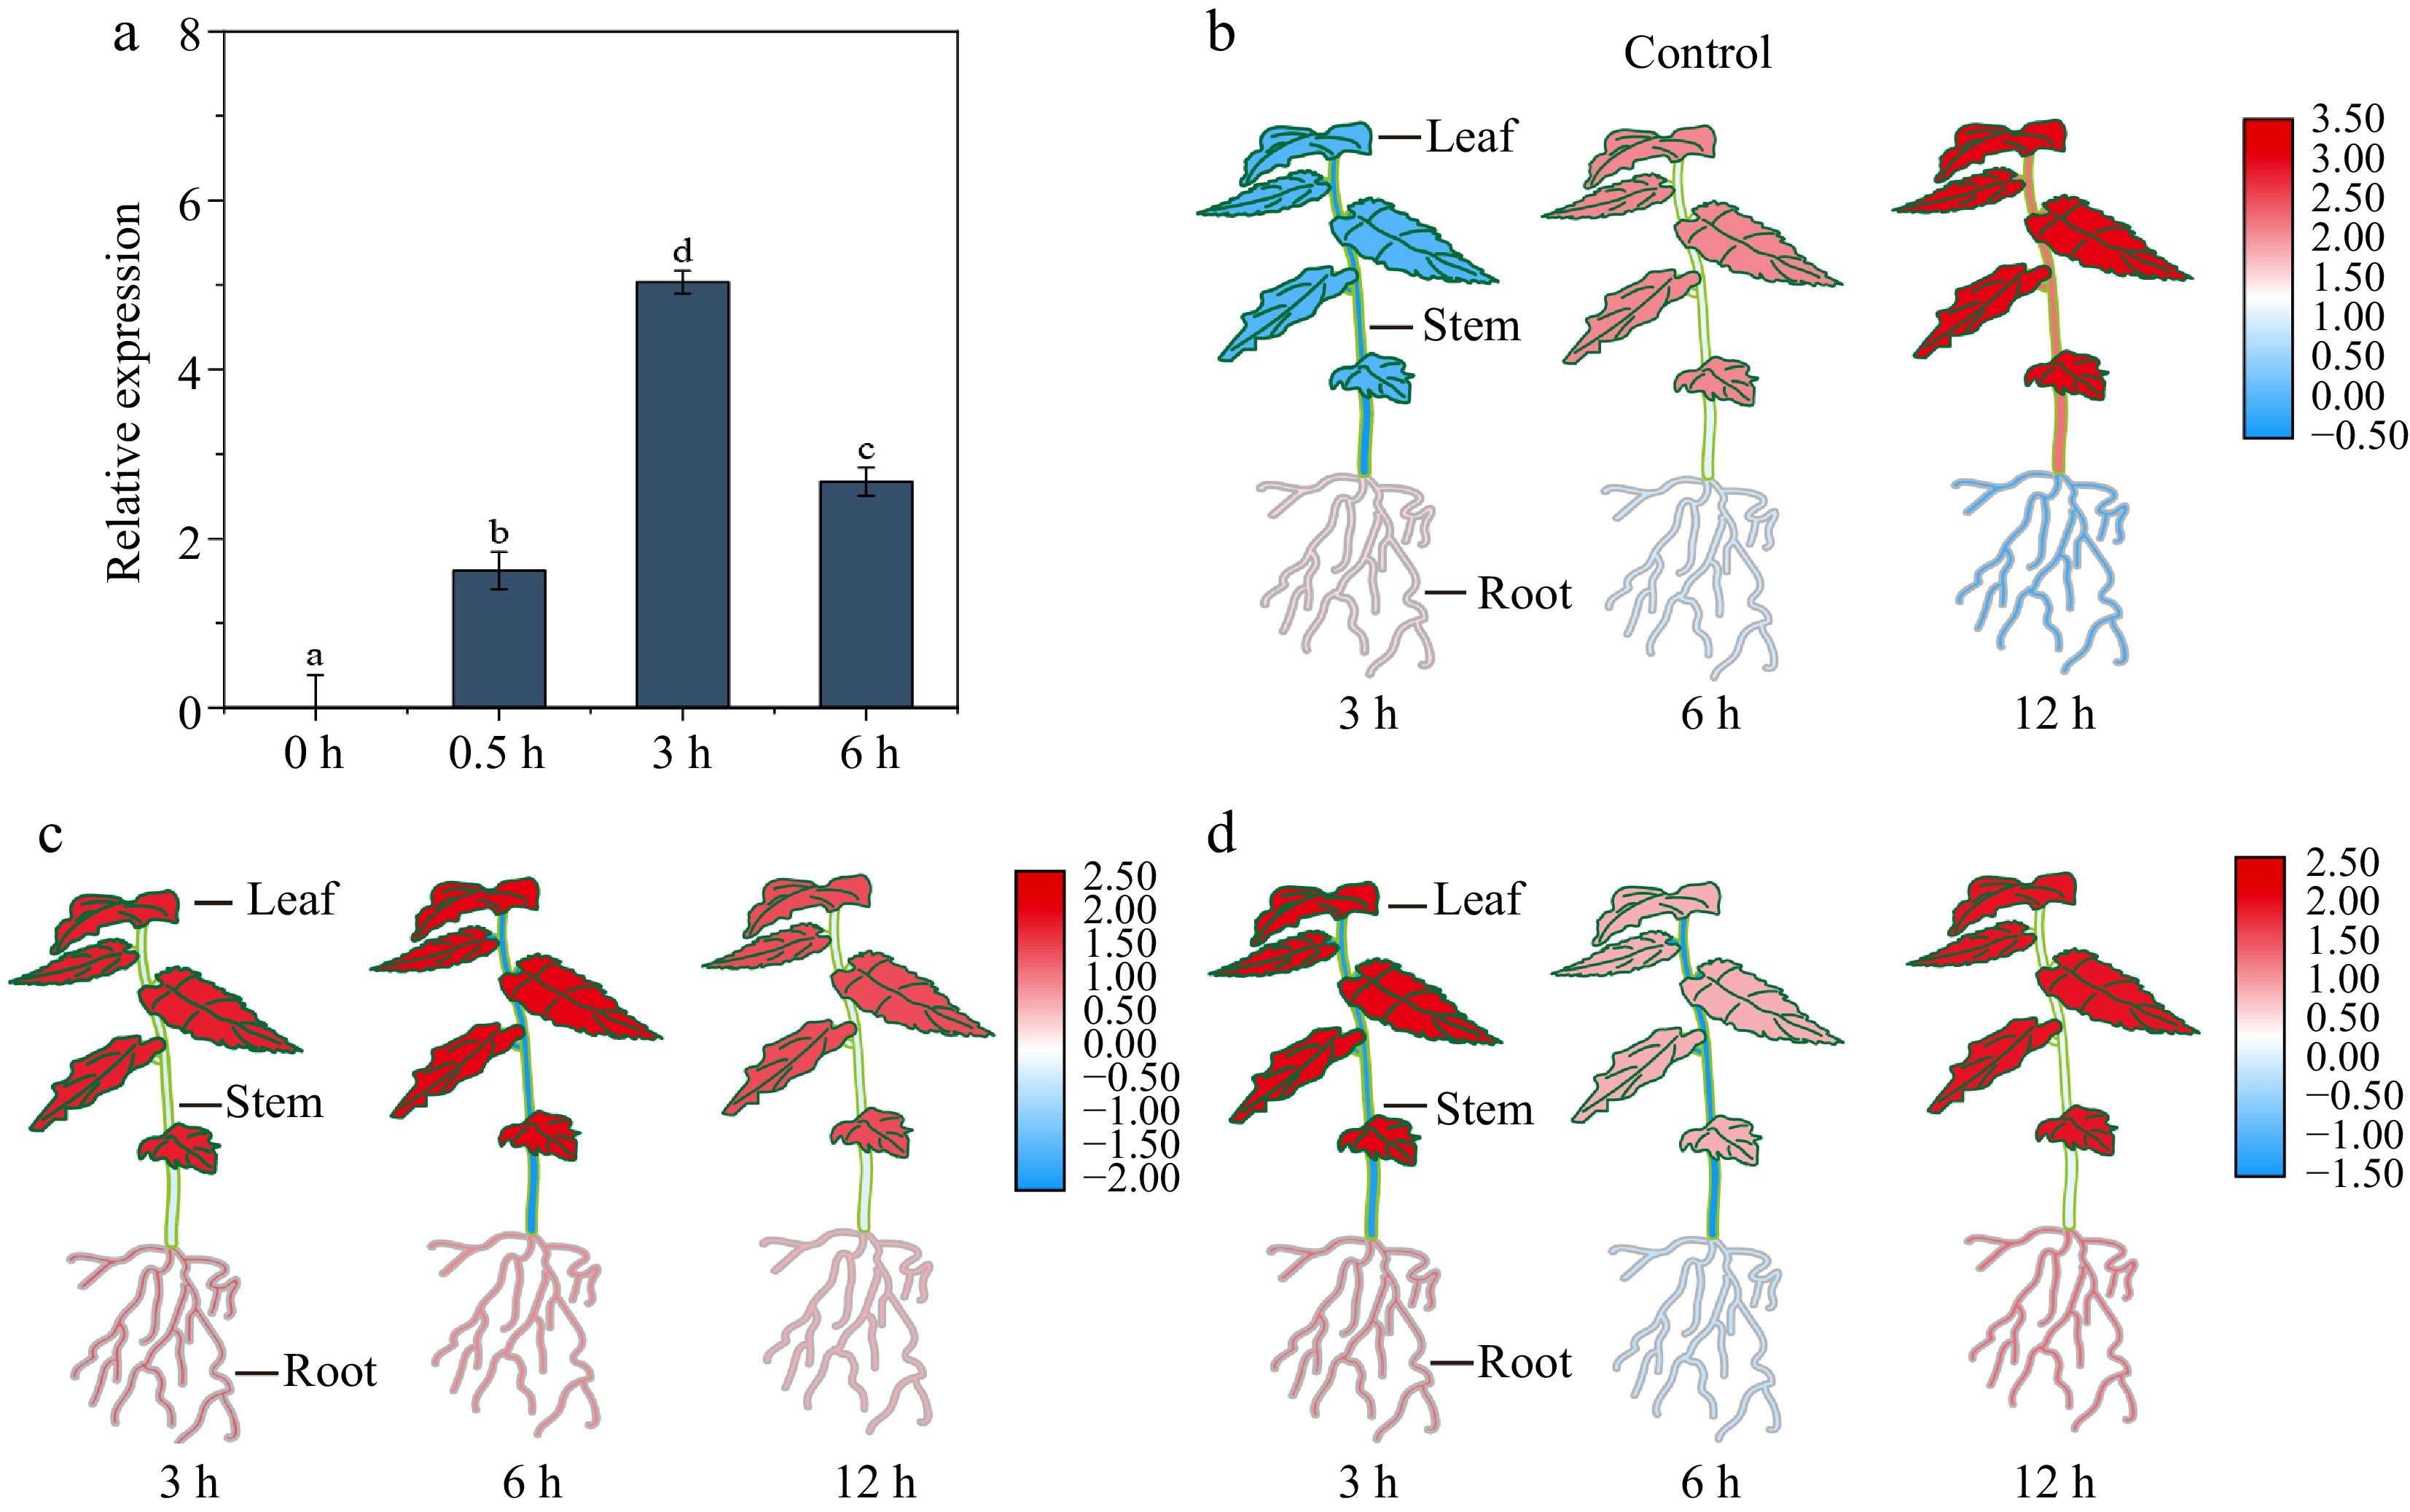
Figure 2.
The expression profiles of BpHY5. (a) The expression level of BpHY5 after 0, 0.5, 3, and 6 h treatment of 0.3 W/m2 UV-B. Heatmap of BpHY5 expression under (b) control, (c) Mannitol, and (d) ABA treatments. Significance was determined by Student's t-test (p < 0.05).
-
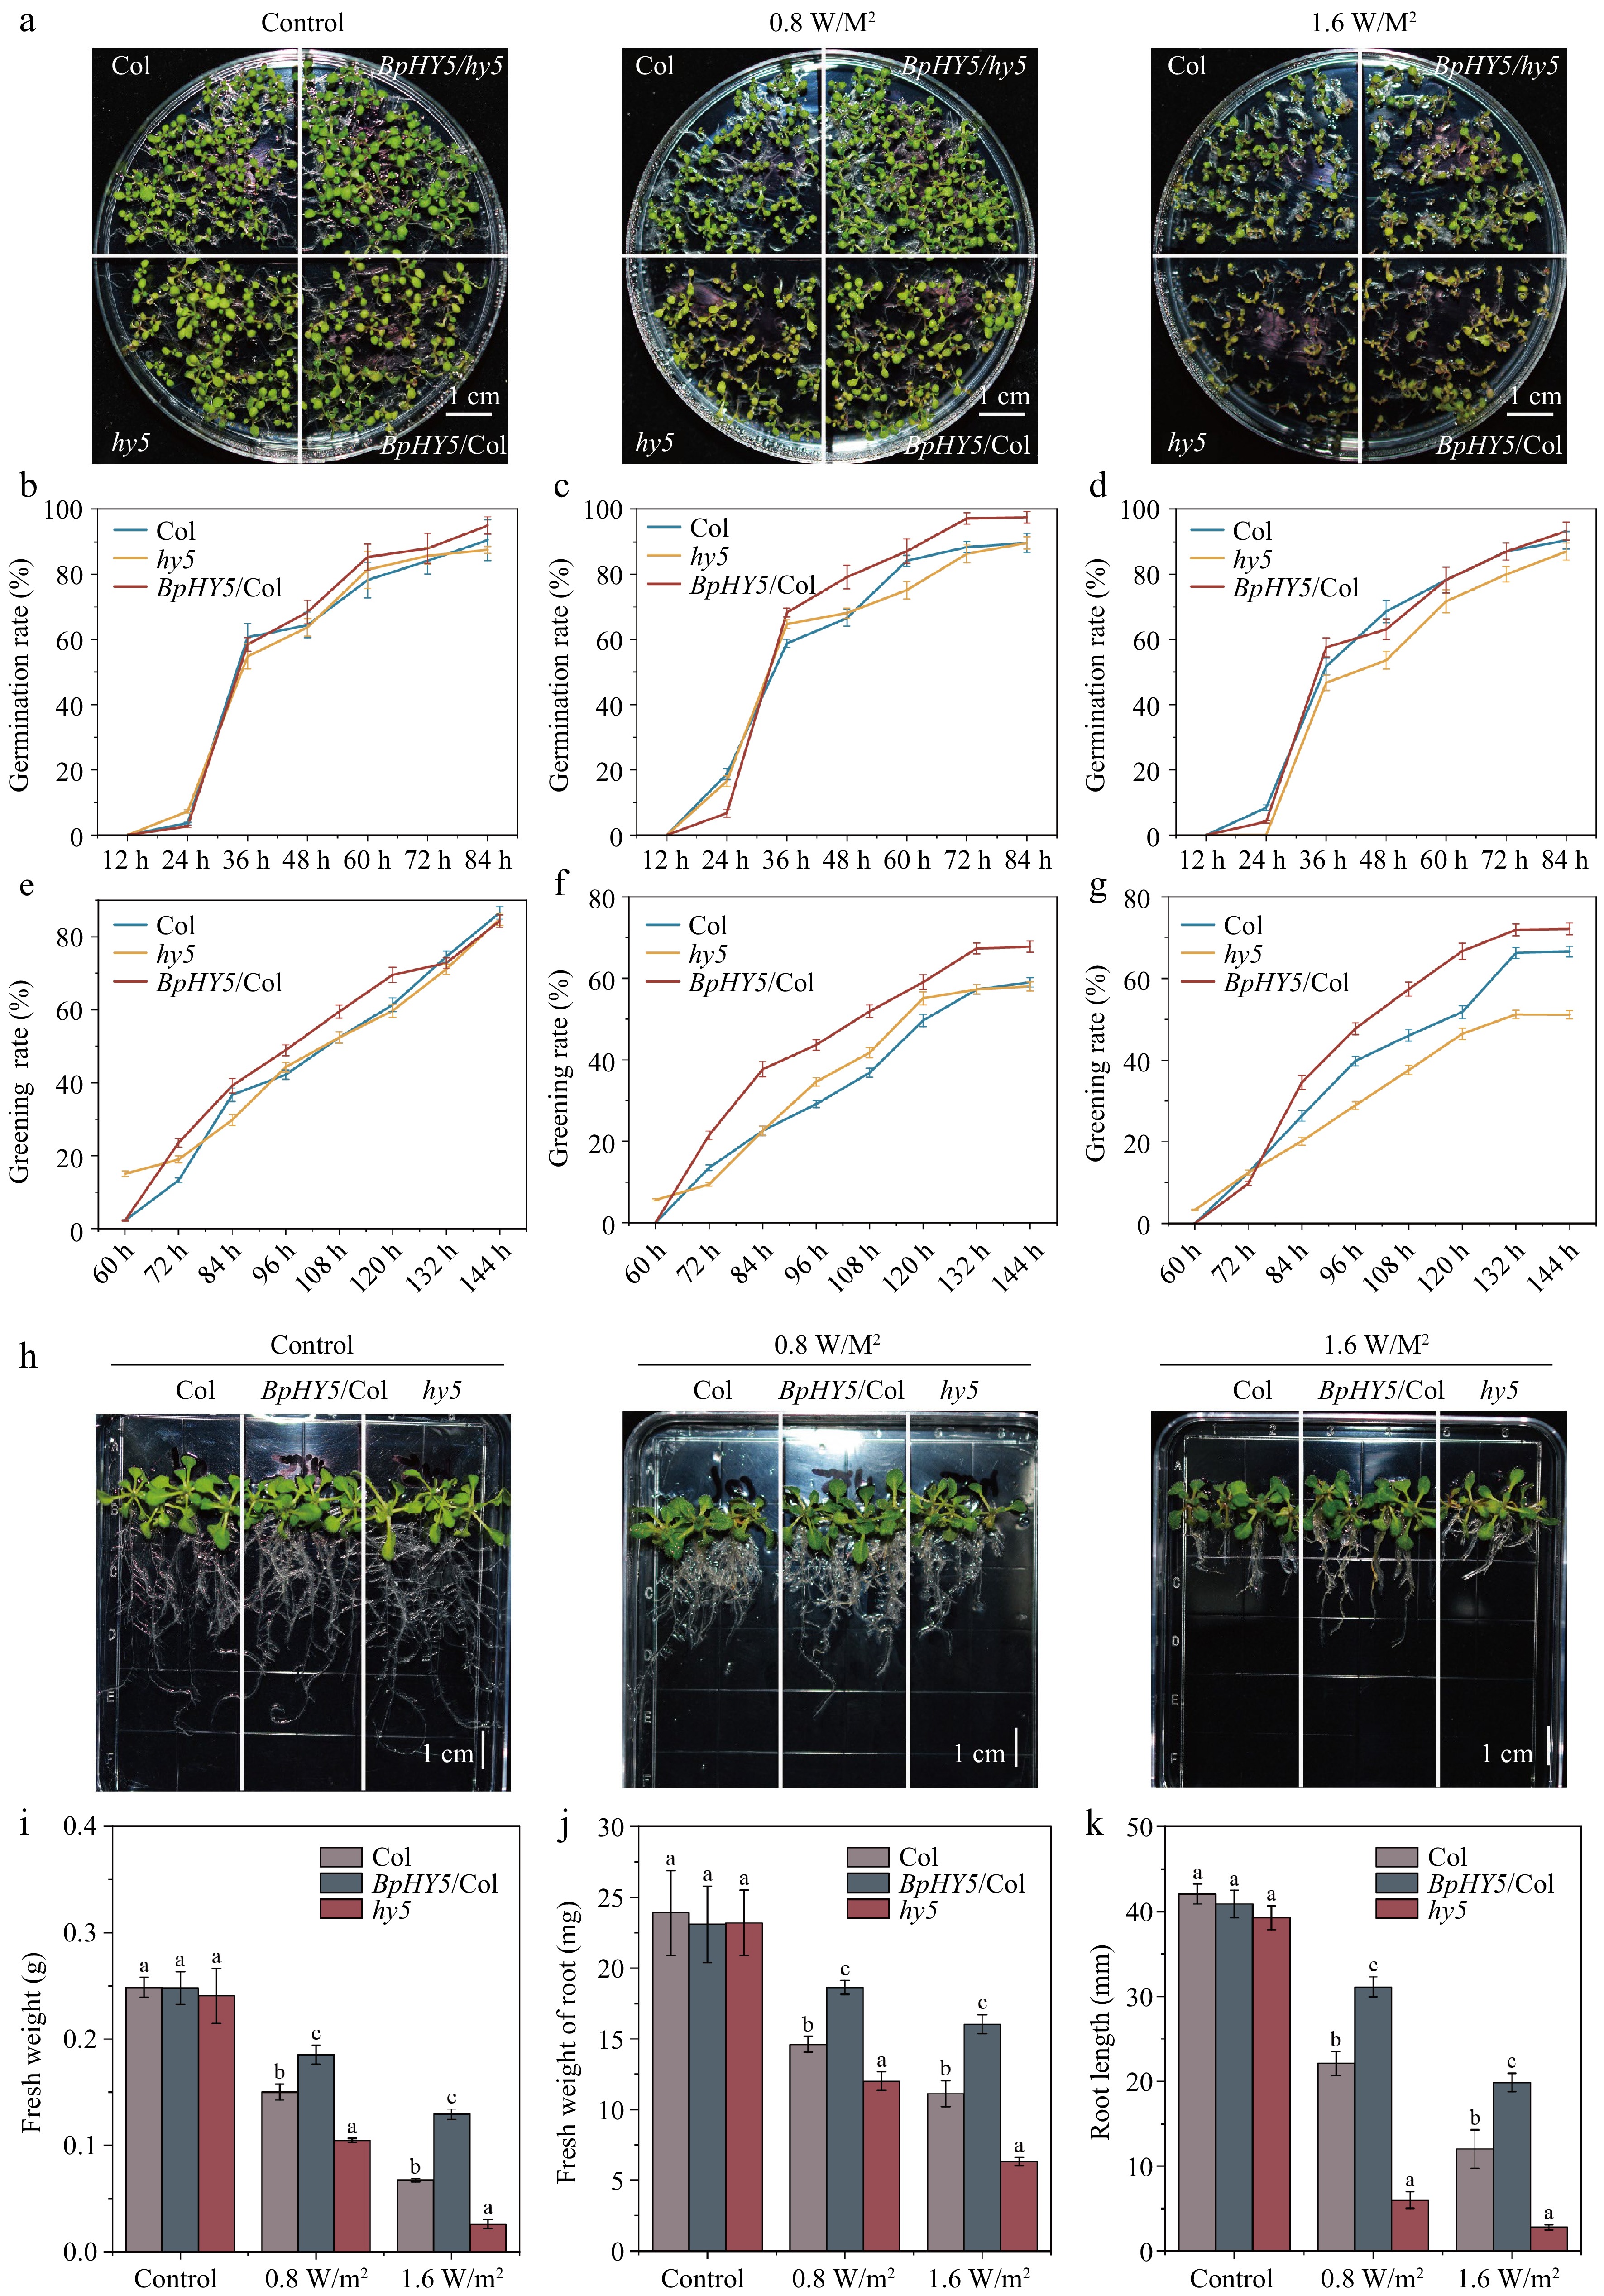
Figure 3.
Comparison of germination, greening rate, root length, and fresh weight between BpHY5/Col, hy5, and Col under UV-B treatment. (a) Physical phenotypes of Col, hy5, BpHY5/hy5, and BpHY5/Col lines under 0.8 and 1.6 W/m2 UV-B treatment after 6 d. The germination rate of Col, BpHY5/Col, and hy5 under (b) control, (c) 0.8, and (d) 1.6 W/m2 UV-B. The greening rate of Col, BpHY5/Col, and hy5 under (e) control, (f) 0.8, and (g) 1.6 W/m2 UV-B. (h) The phenotypes of Col, BpHY5/Col, and hy5 seedlings exposed to UV-B at 14 d. The statistics of (i) fresh weight, (j) fresh weight of root, and (k) root length of Col, BpHY5/Col, and hy5 under 0.8 and 1.6 W/m2 UV-B at 14 d. The scale bar represents 1 cm. Statistical significance (p < 0.05) between Col, BpHY5/Col, and hy5 is indicated by a, b, and c.
-
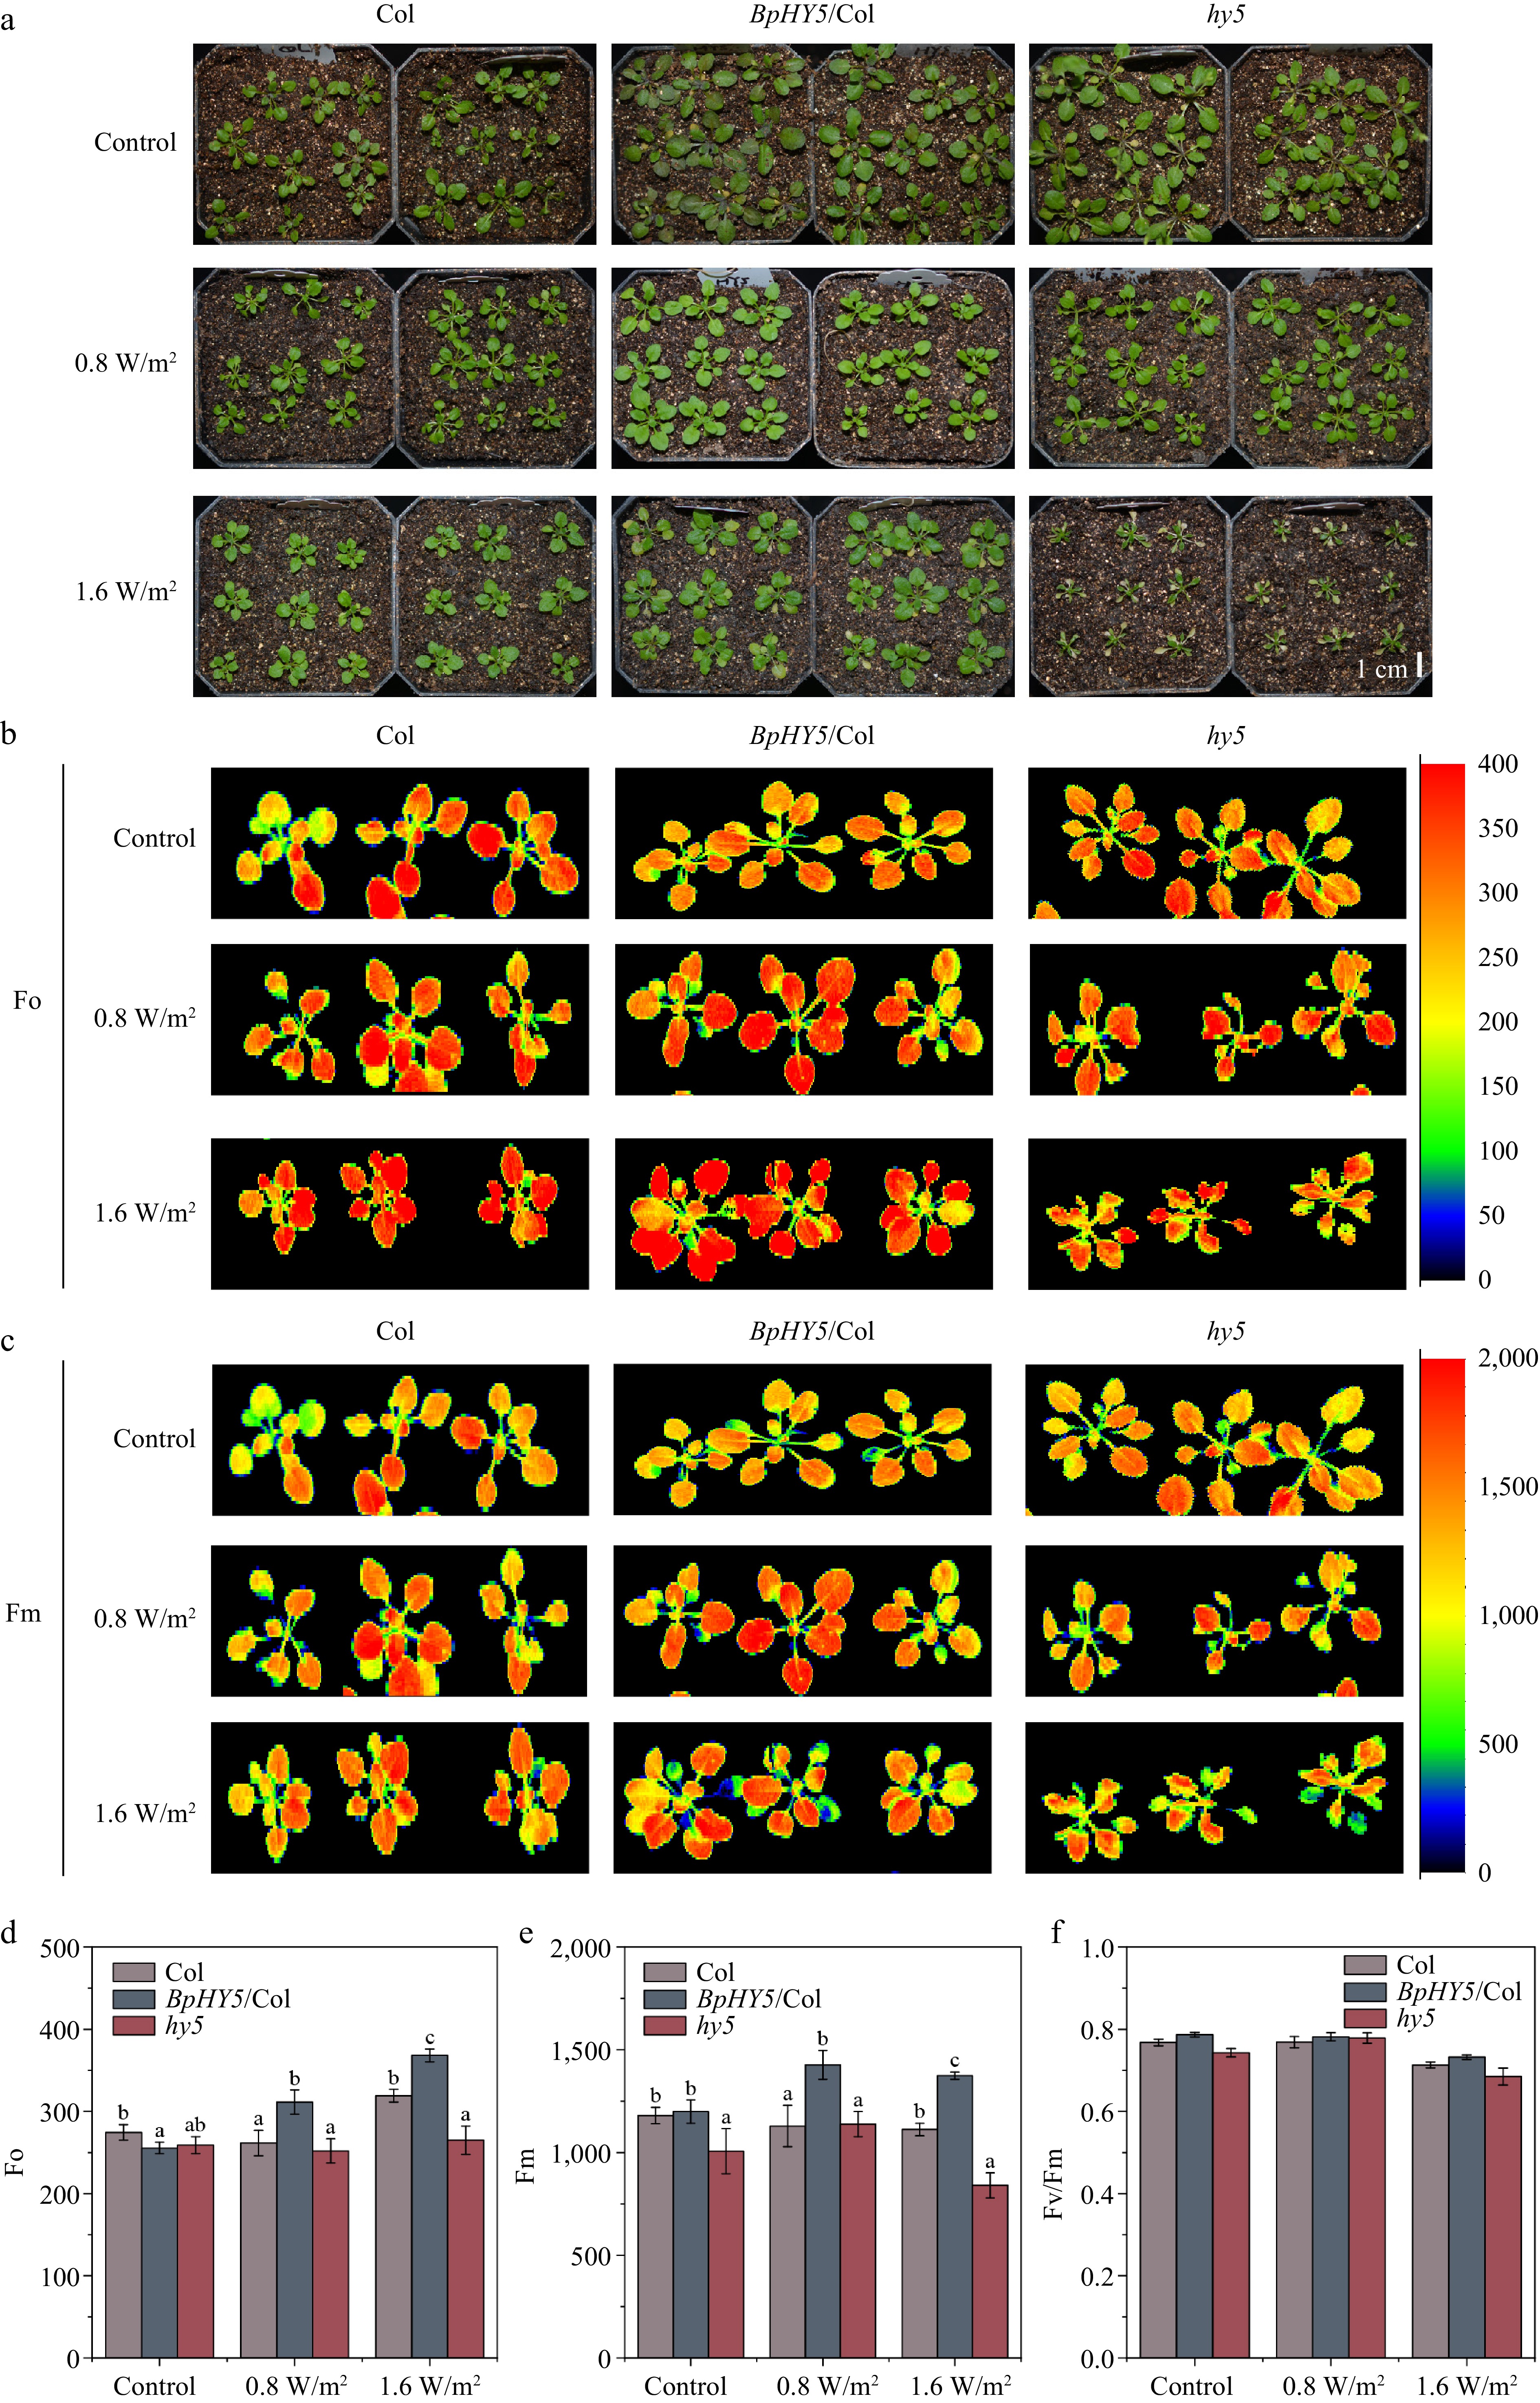
Figure 4.
Transgenic BpHY5 Arabidopsis showed higher UV-B tolerance. (a) Physical phenotypes of Col, BpHY5/Col, and hy5 seedlings in soil under UV-B treatment. The chlorophyll fluorescence of Col, BpHY5/Col, and hy5 seedlings after UV-B treatment for 10 d. Fo is (b) minimal fluorescence, and Fm is (c) maximal fluorescence. The statistics of (d) Fo, (e) Fm, and (f) Fv/Fm of Col, BpHY5/Col, and hy5 under 0.8 and 1.6 W/m2 UV-B treatment after 10 d. The scale bar represents 1 cm. Significance was determined by Student's t-test (p < 0.05).
-
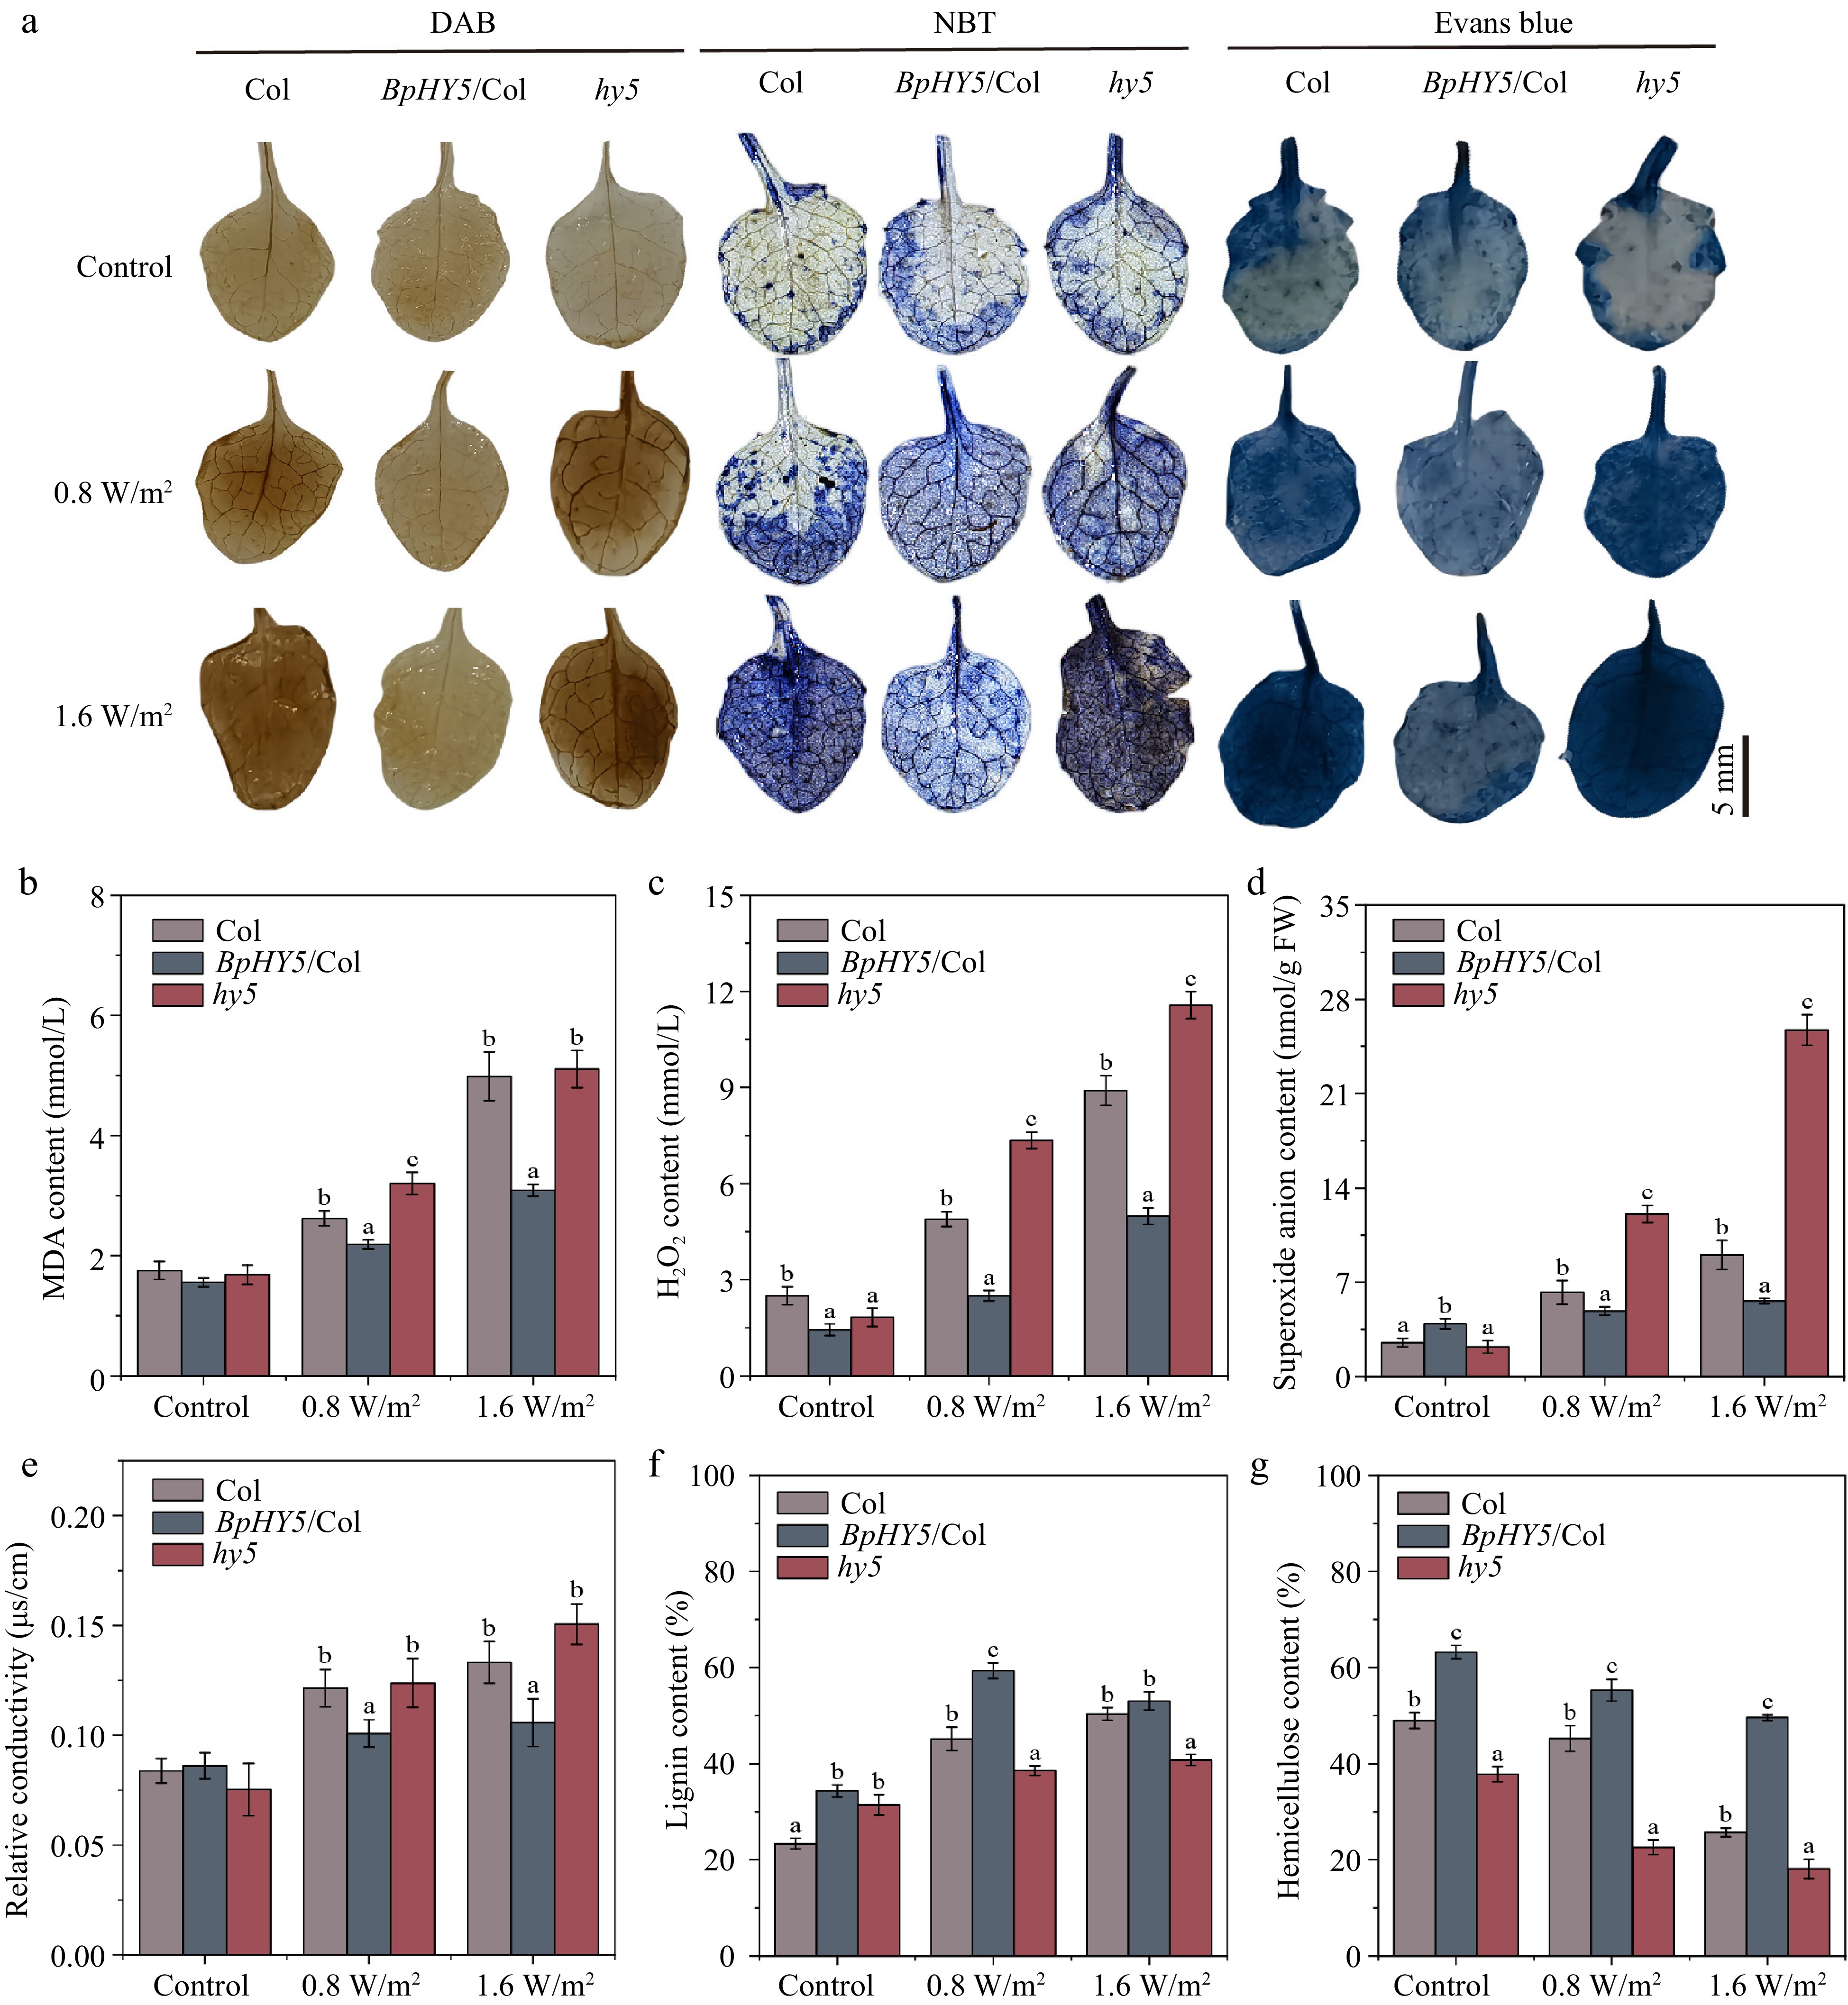
Figure 5.
BpHY5 affected the ROS accumulation and component content of stems under UV-B. (a) Determination of ROS content using DAB, NBT, and Evans blue staining. Scale bar represents 5 mm. The statistics of (b) MDA content, (c) hydrogen peroxide content, (d) superoxide anion content, and (e) relative conductivity. The statistics of component content of stems of Col, BpHY5/Col, and hy5 after 10 d of treatment of 0.8 and 1.6 W/m2 UV-B, including (f) lignin content and (g) hemicellulose content. Significance was determined by Student's t-test (p < 0.05).
-
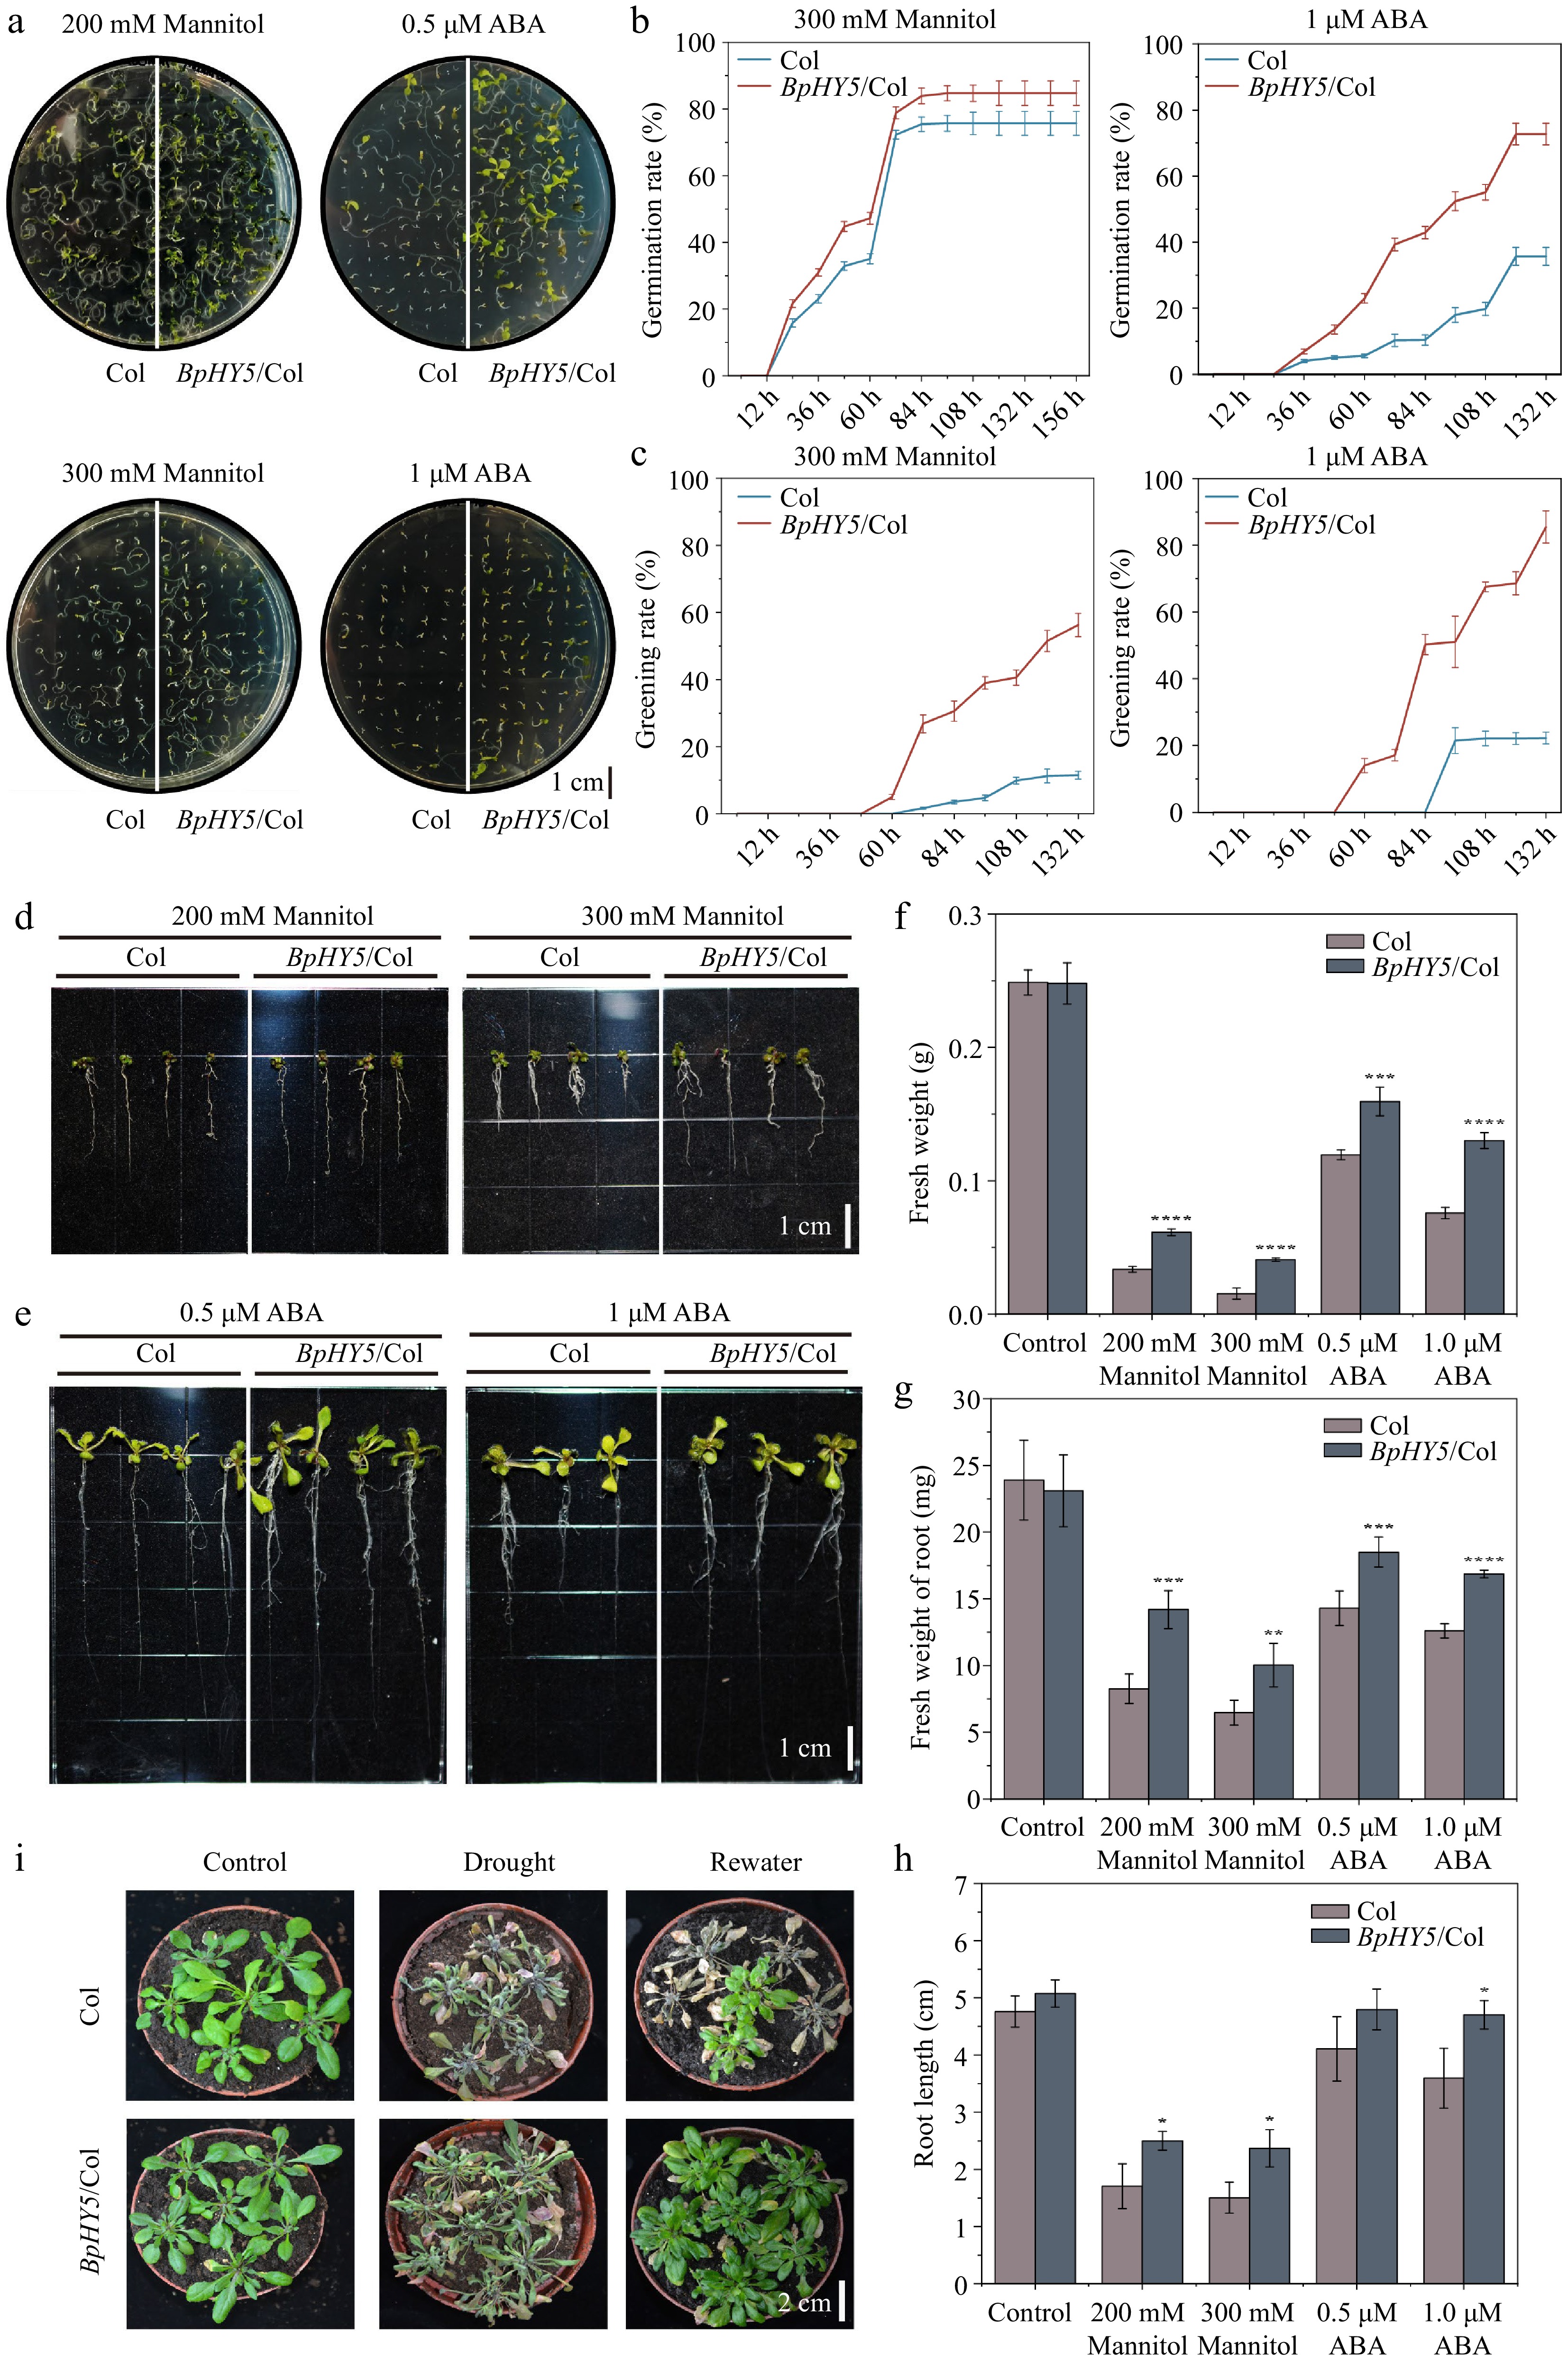
Figure 6.
BpHY5 decreased the sensitivity to drought and ABA in Arabidopsis. (a) Phenotypes of seed germination rate of Col and BpHY5/Col under 200, 300 mM mannitol and 0.5, 1.0 μM ABA at 7 d. Comparison of (b) germination rate and (c) greening rate of Col and BpHY5/Col under 300 mM mannitol and 1.0 μM ABA conditions. The root length phenotypes of Col and BpHY5/Col under (d) 200, 300 mM mannitol and (e) 0.5, 1.0 μM ABA treatments after 16 d. The statistics of the (f) fresh weight, (g) fresh weight of root, and (h) root length of Col and BpHY5/Col under mannitol (200, 300 mM) and ABA (0.5, 1.0 μM) treatment after 16 d. (i) Physical phenotypes of Col and BpHY5/Col subjected to drought stress without water for 7 d and re-watered for 3 d. Asterisks indicate levels of significance (t-test; *p < 0.05, **p < 0.01, ***p < 0.001, ****p < 0.0001). Scale bars: (a) = 1 cm; (d) = 1 cm; (e) = 1 cm; (i) = 2 cm.
-
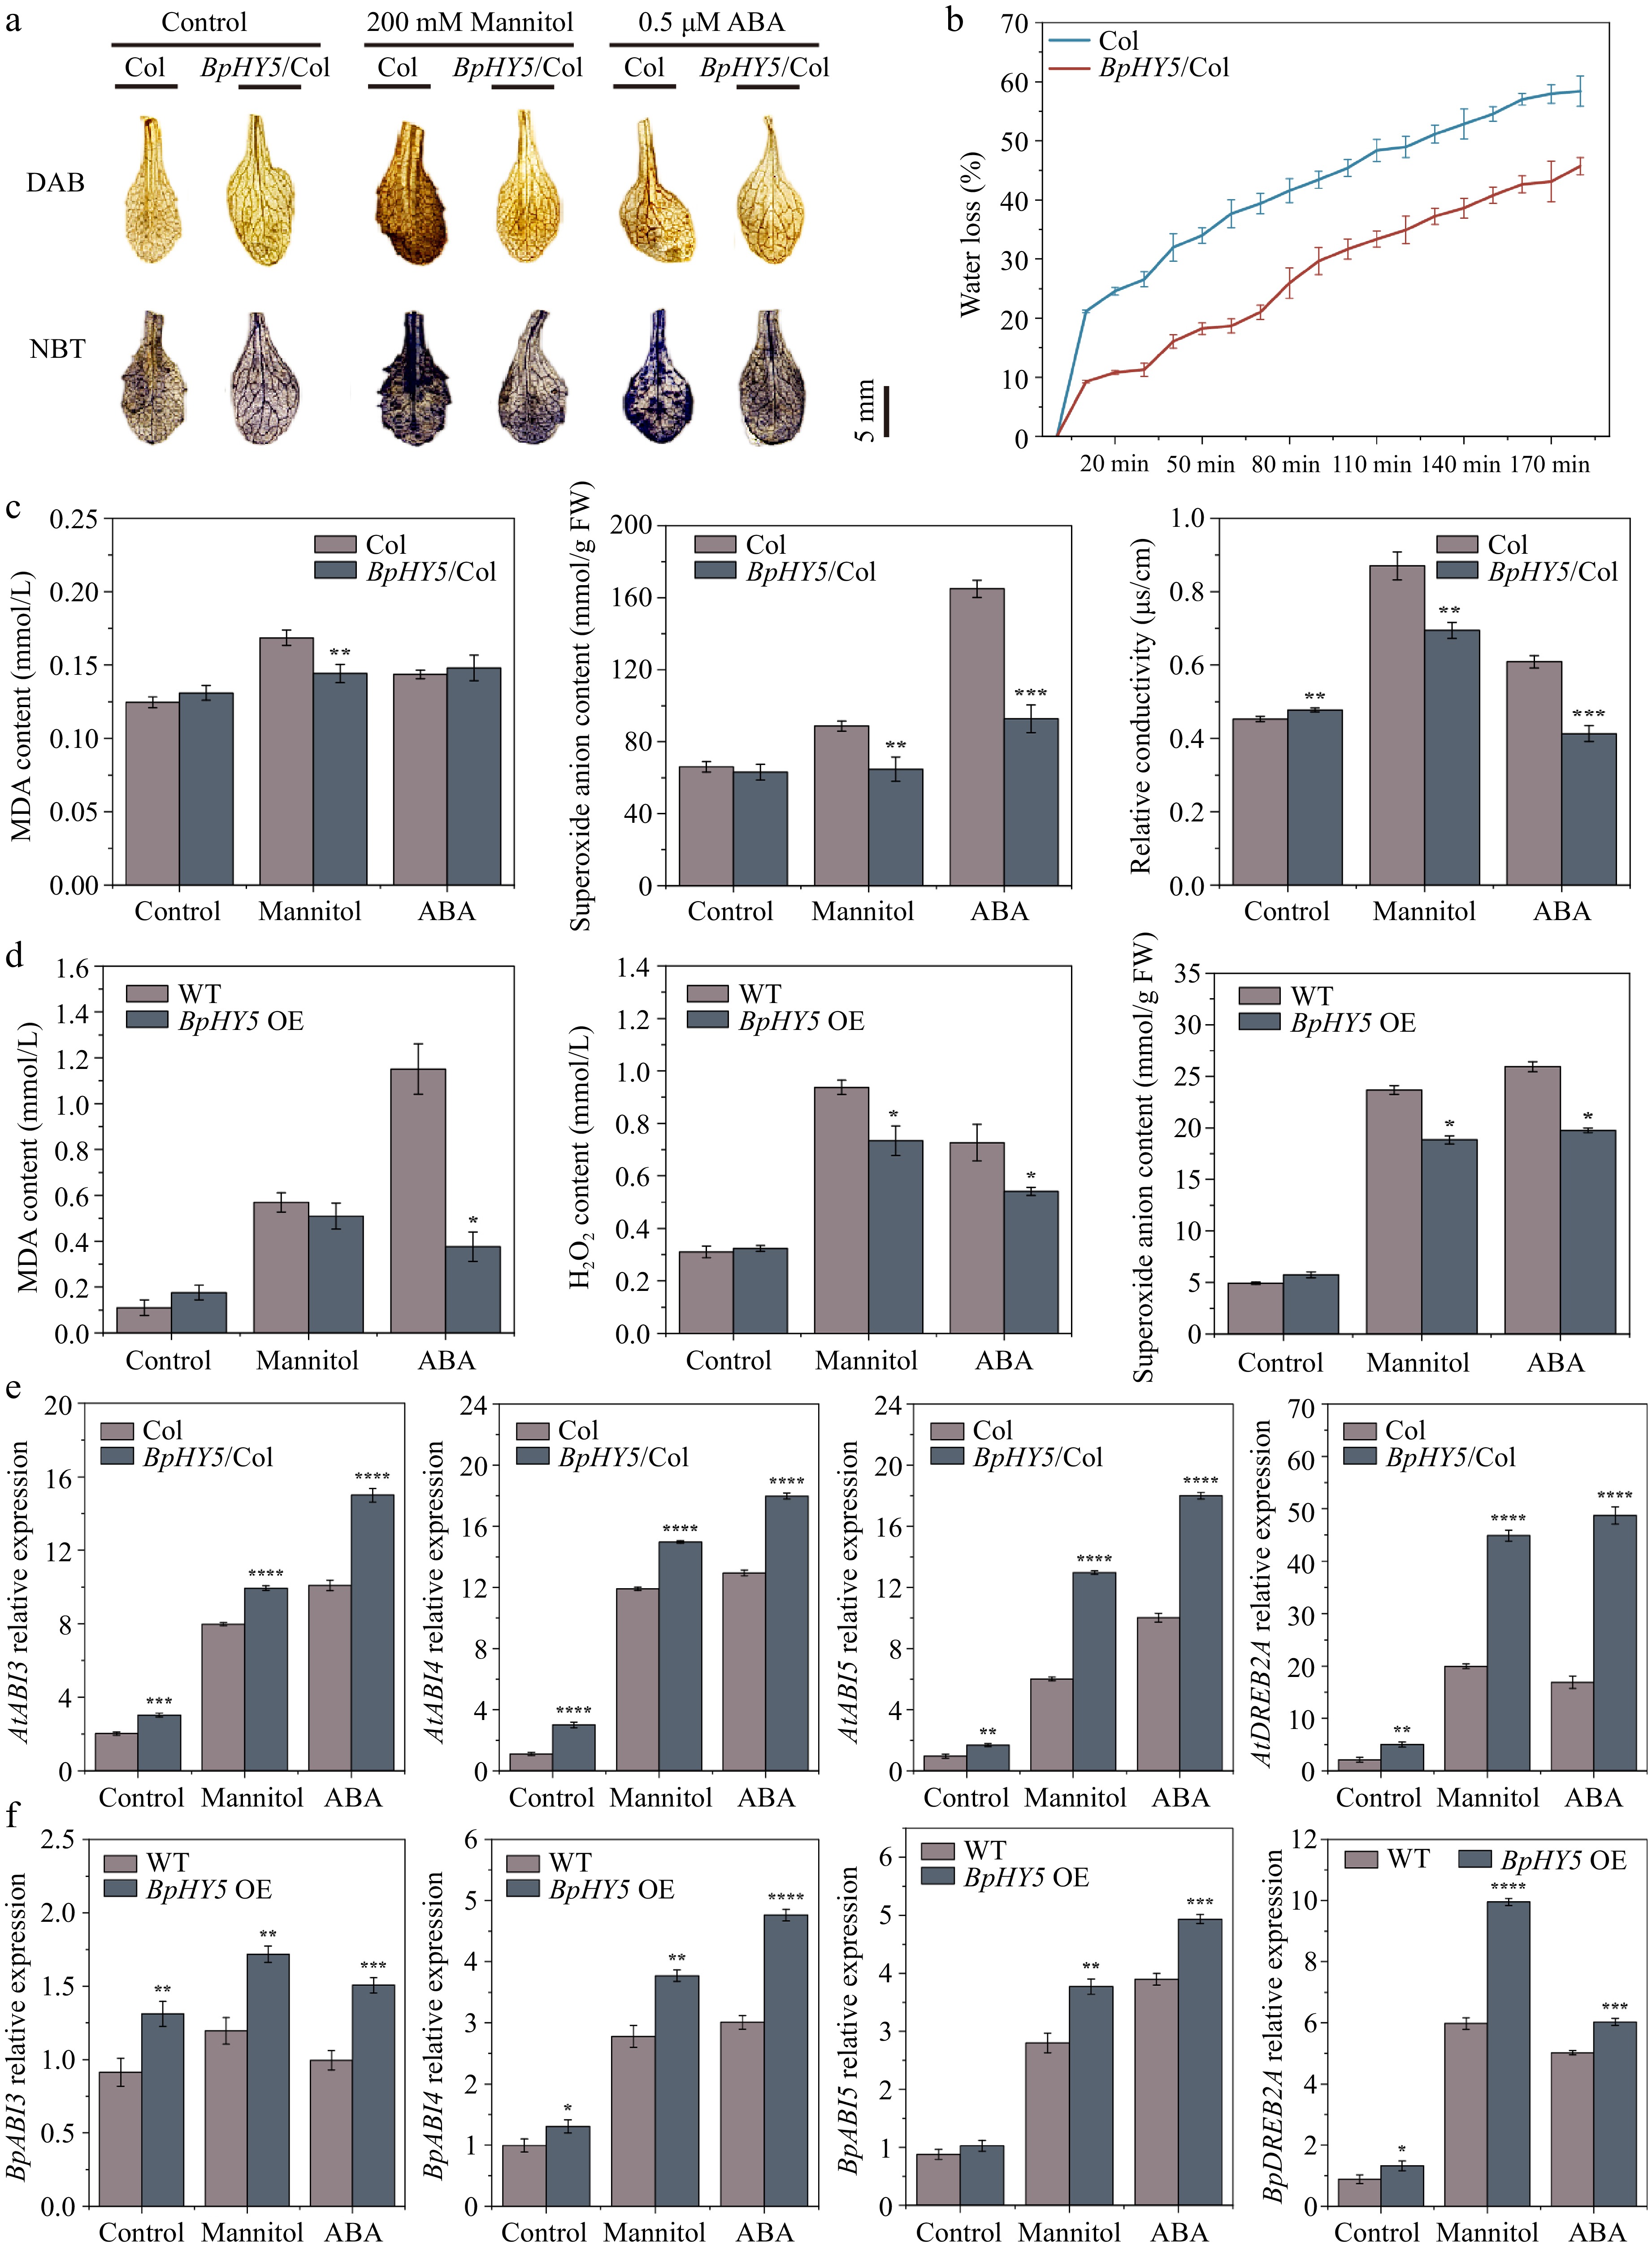
Figure 7.
Effect of BpHY5 overexpression on biochemical indicators and gene expression in Arabidopsis and birch under mannitol and ABA conditions. (a) DAB staining and NBT staining. Scale bar represents 5 mm. (b) Water loss rate of 16-day-old Col and BpHY5/Col seedlings. (c) The statistics of MDA content, superoxide anion content, and relative conductivity of 16-day-old Col and BpHY5/Col seedlings under mannitol and ABA conditions. (d) The statistics of MDA content, hydrogen peroxide content, and superoxide anion content of WT and transient transgenic birch under mannitol and ABA conditions. (e) The expression levels of AtABI3/4/5 and AtDEEB2A in Col and BpHY5/Col under mannitol and ABA conditions. (f) The expression levels of BpABI3/4/5 and BpDEEB2A in birch under mannitol and ABA conditions. Asterisks indicate levels of significance between Col and BpHY5/Col or WT and BpHY5 OE (t-test; *p < 0.05, **p < 0.01, ***p < 0.001, ****p < 0.0001).
-
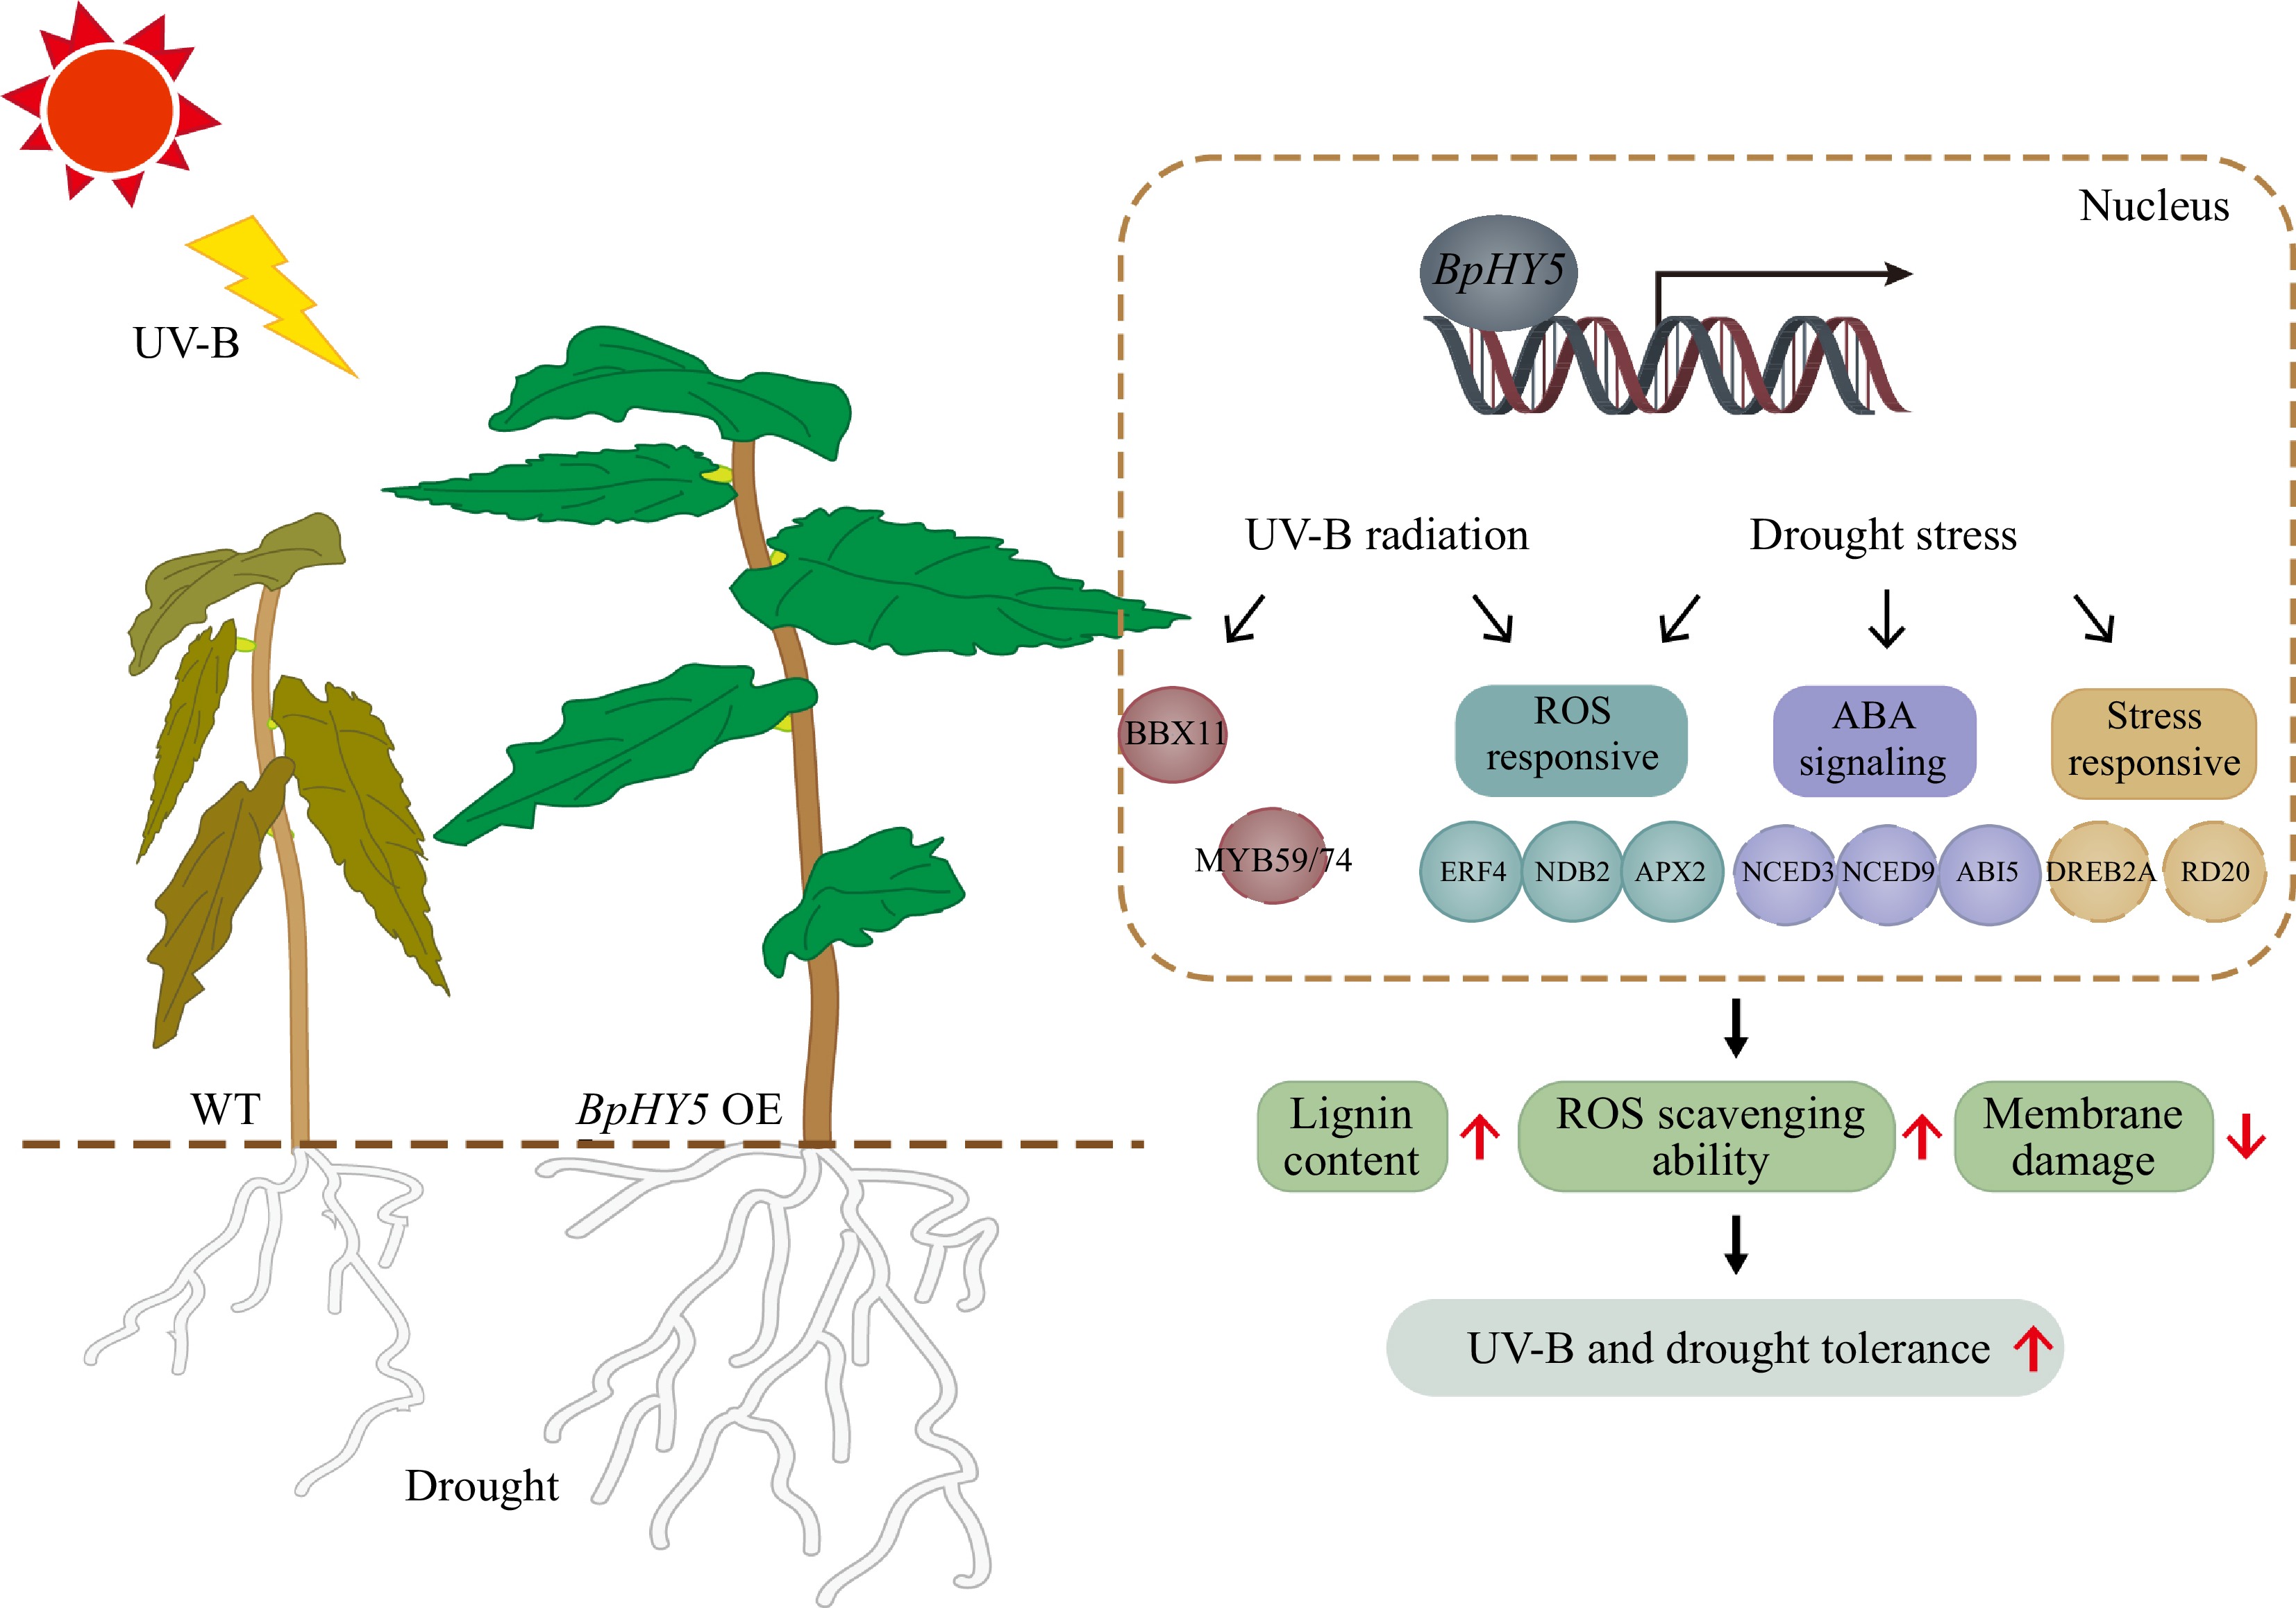
Figure 8.
Schematic model of UV-B and drought stress response of BpHY5. Overexpression of BpHY5 promotes the expression of BBX TFs, ABA-related genes (such as NCED3/6/9 and ABI3/4/5), increases the expression of stress-response genes (such as DREB2A, MYB59/74, ERD10 and RD20) and ROS-response genes (such as ERF4, NDB2 and APX2) to enhance the plant tolerance to UV-B and drought stresses with higher lignin content, greater ROS scavenging ability and lower membrane damage. It has been demonstrated that HY5 binds the promoter of TFs in the solid line through previous studies; however, the TFs represented by dotted lines have not been explicitly demonstrated.
Figures
(8)
Tables
(0)