-
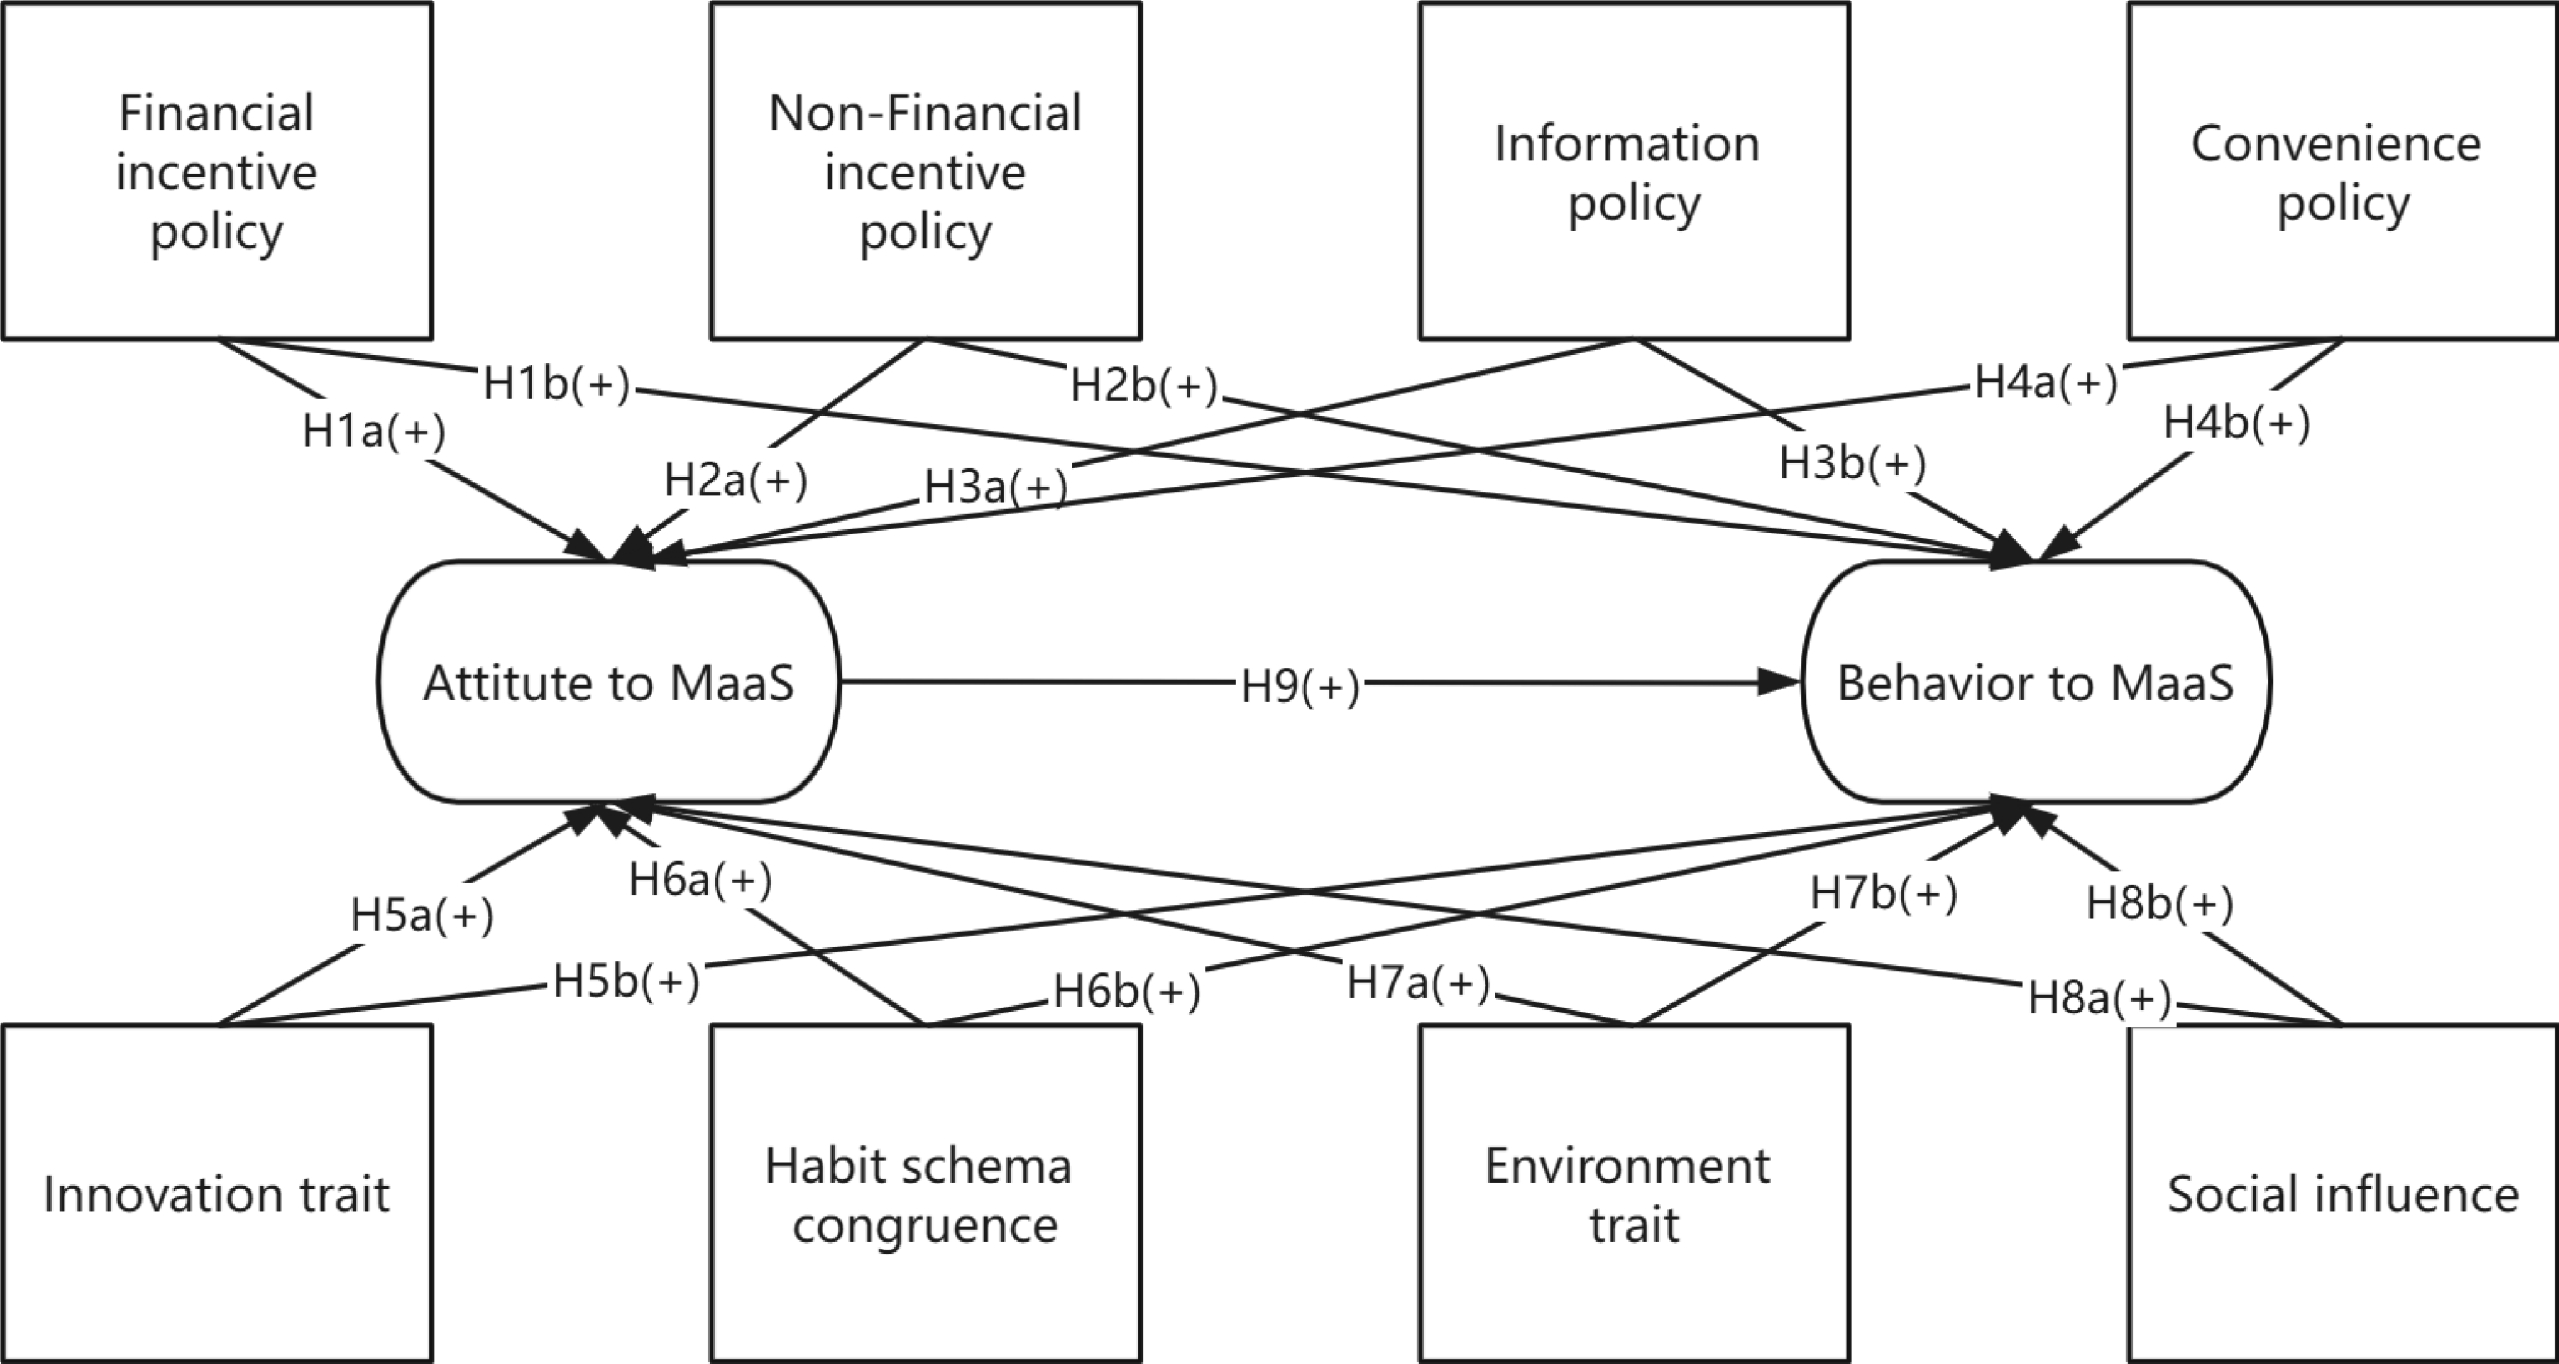
Figure 1.
Research framework.
-
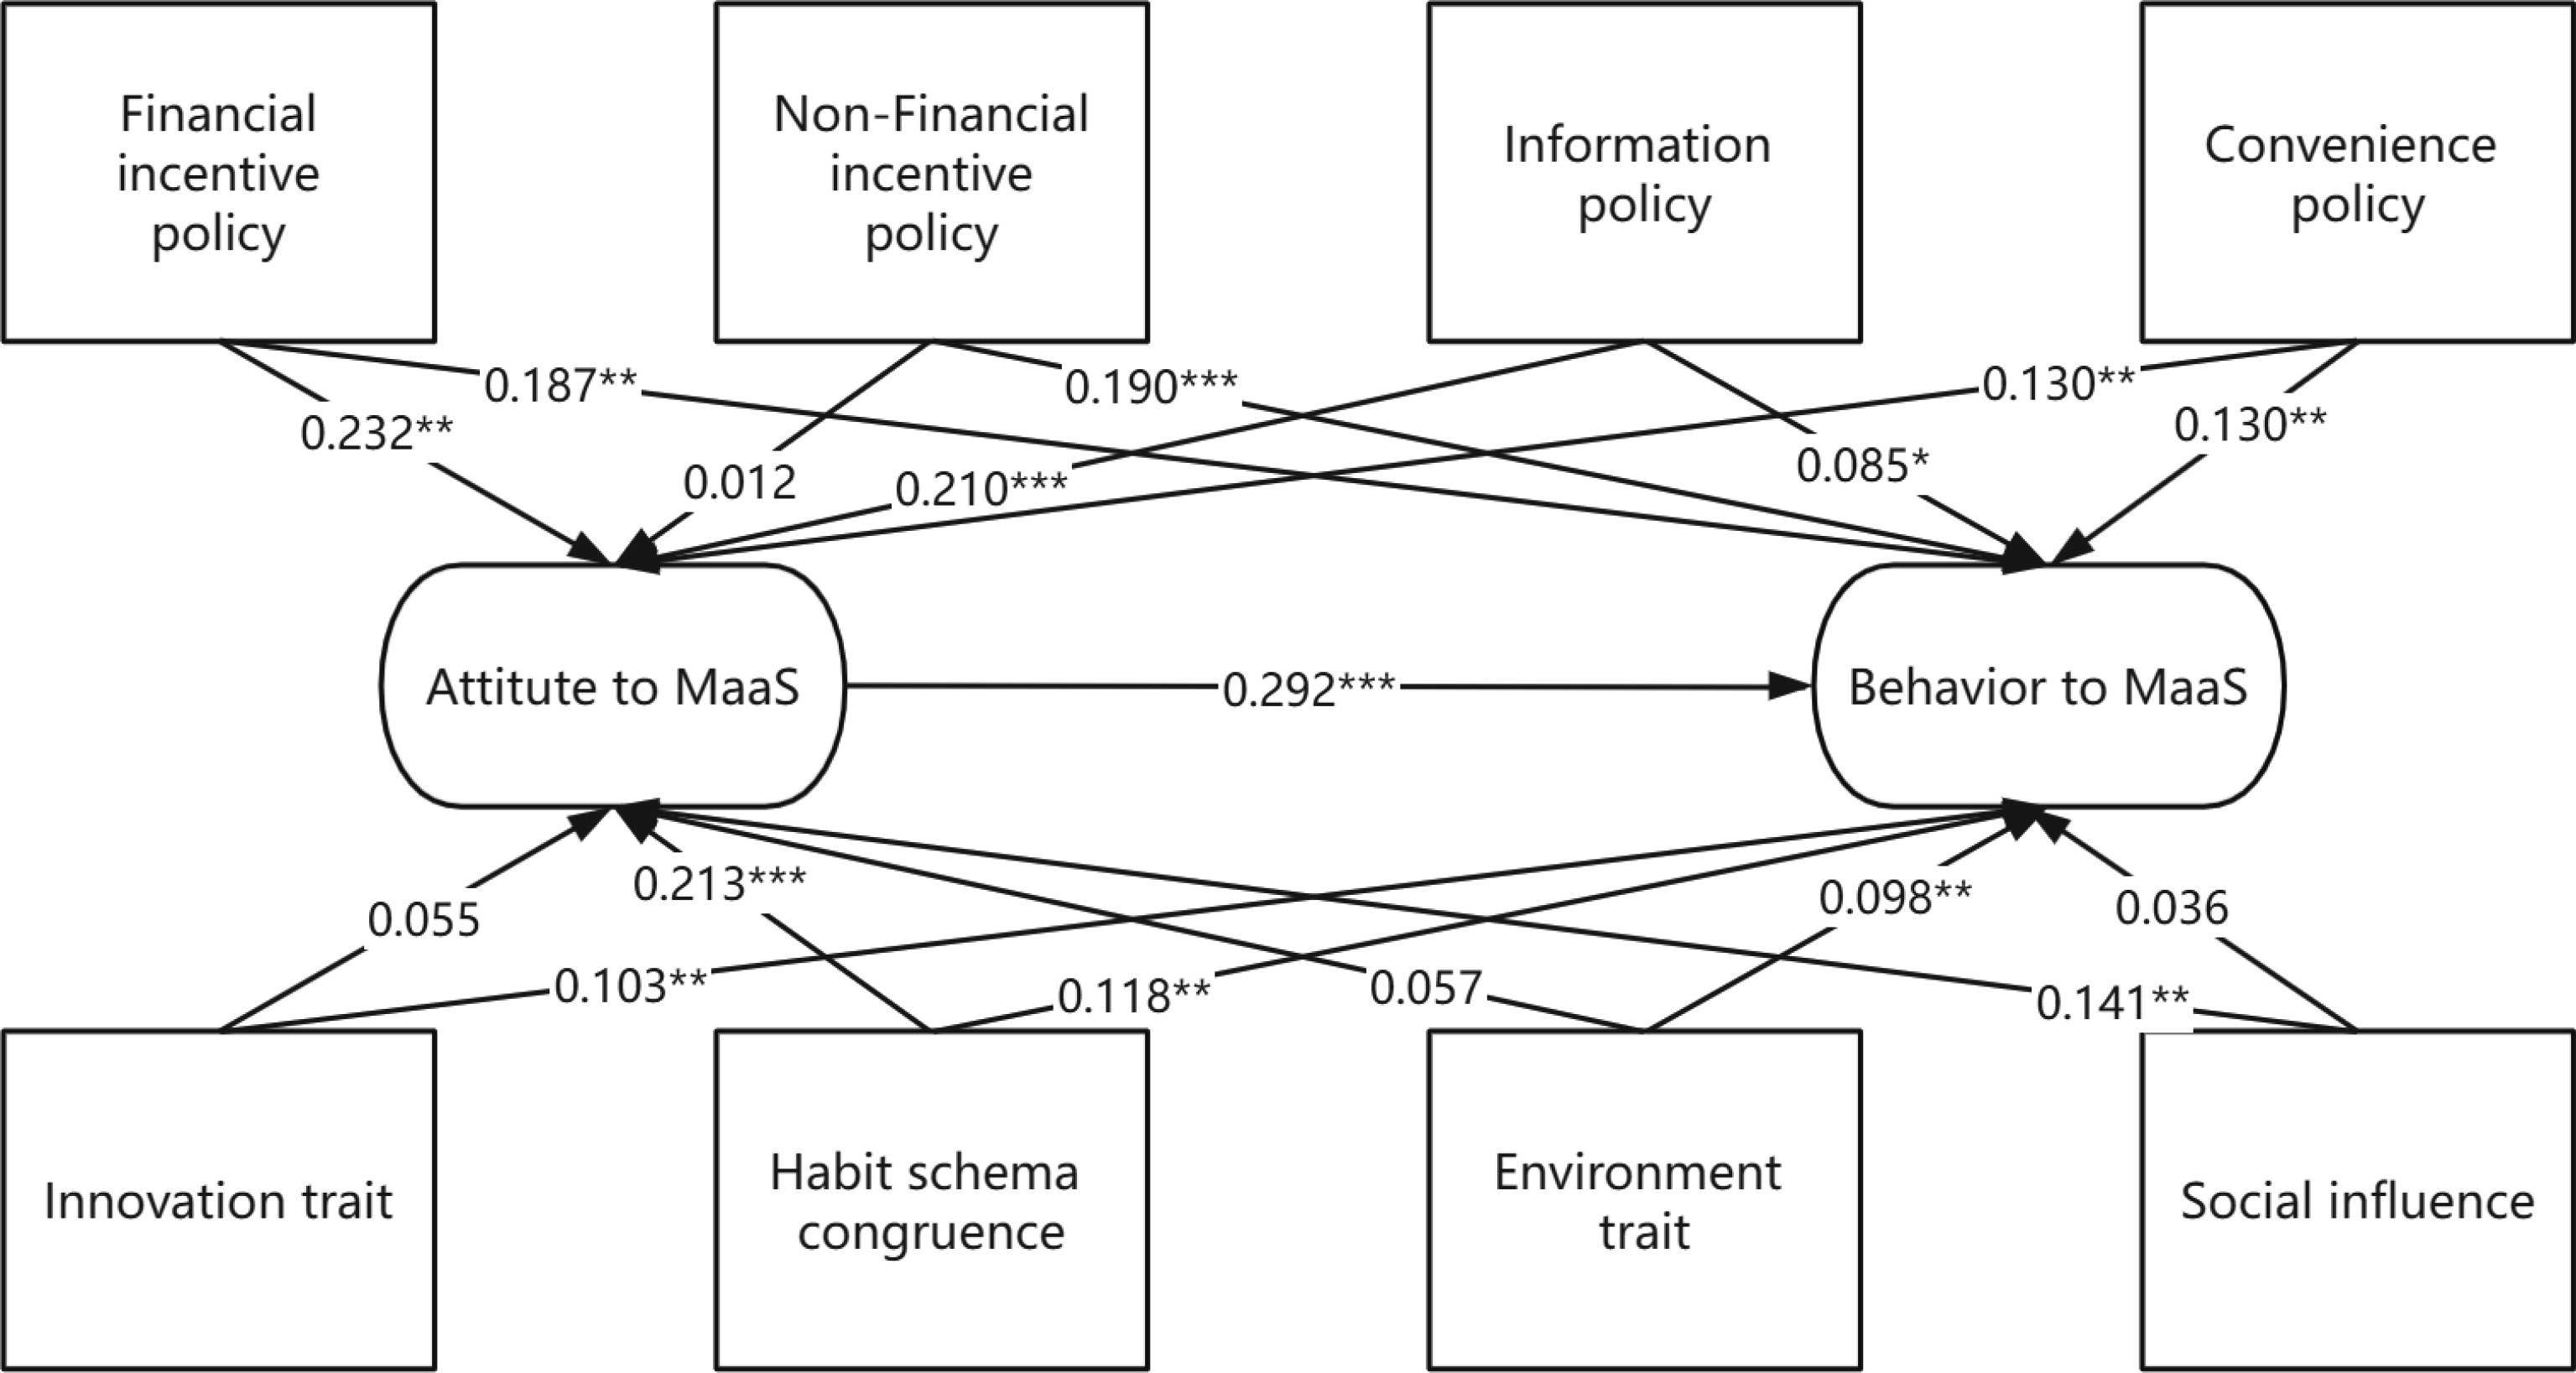
Figure 2.
Results of the hypotheses.
-
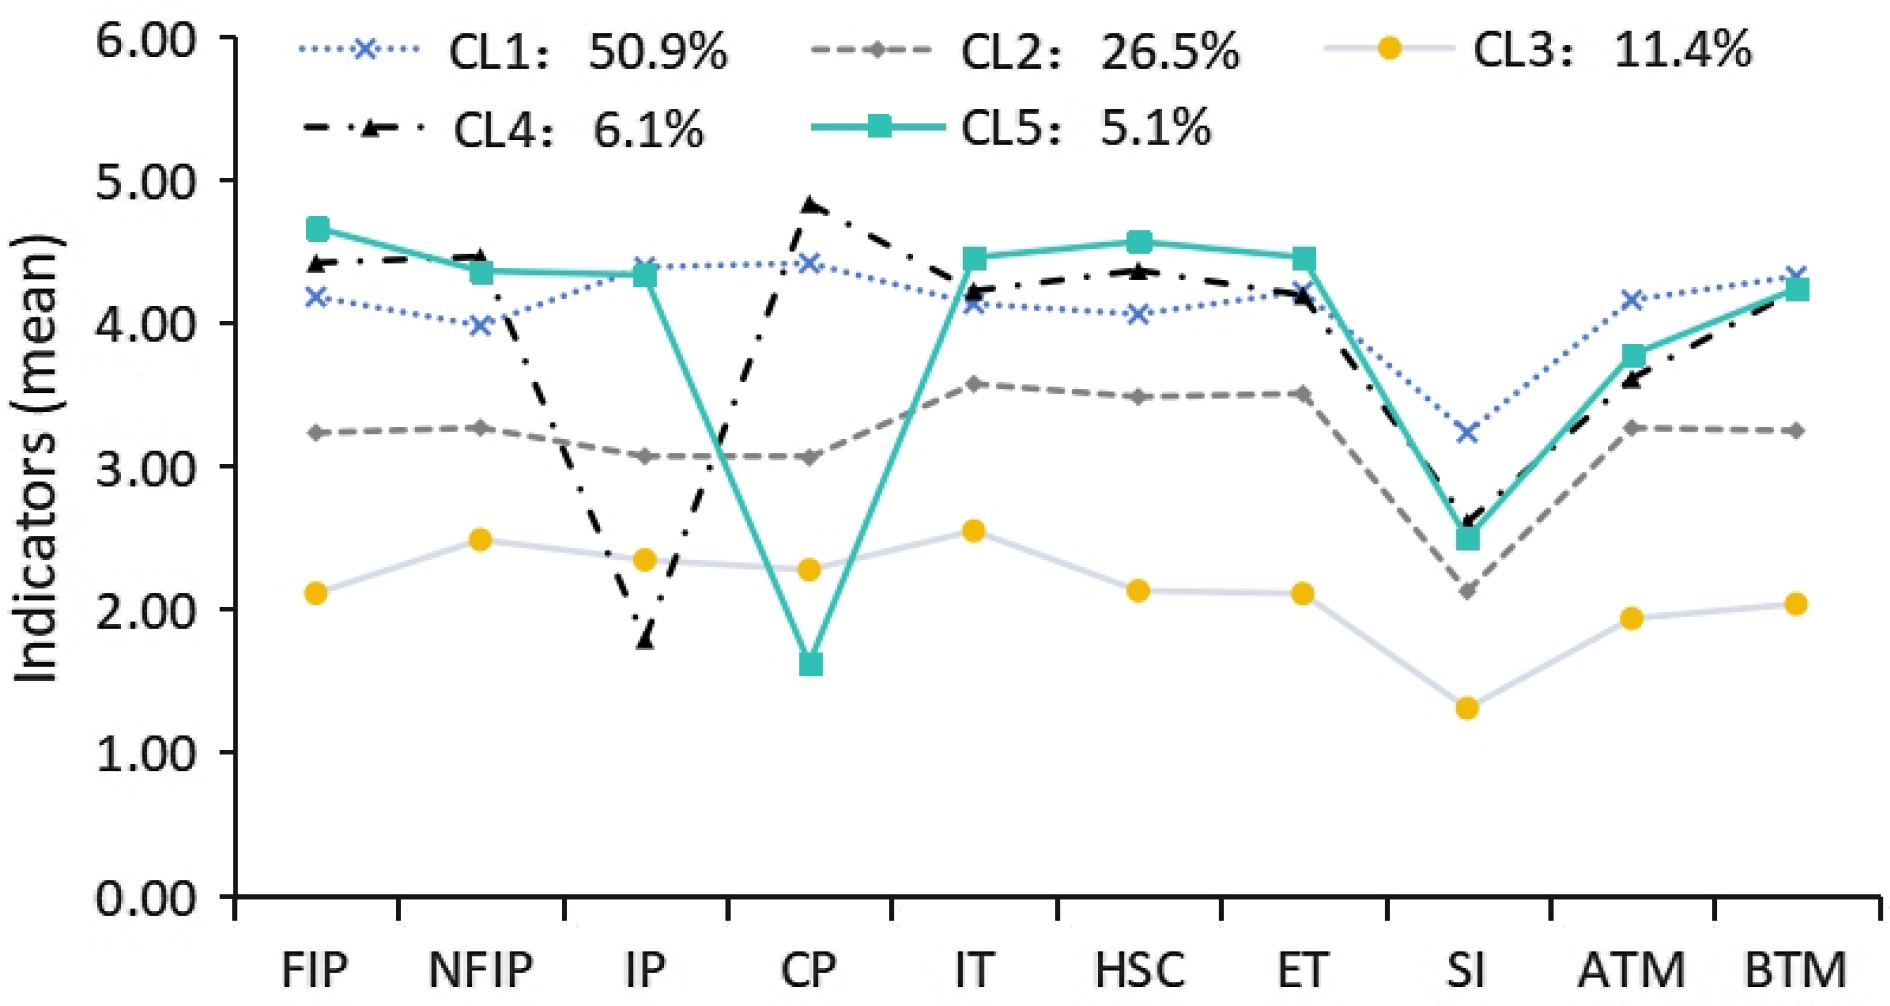
Figure 3.
The distribution of different latent classes.
-
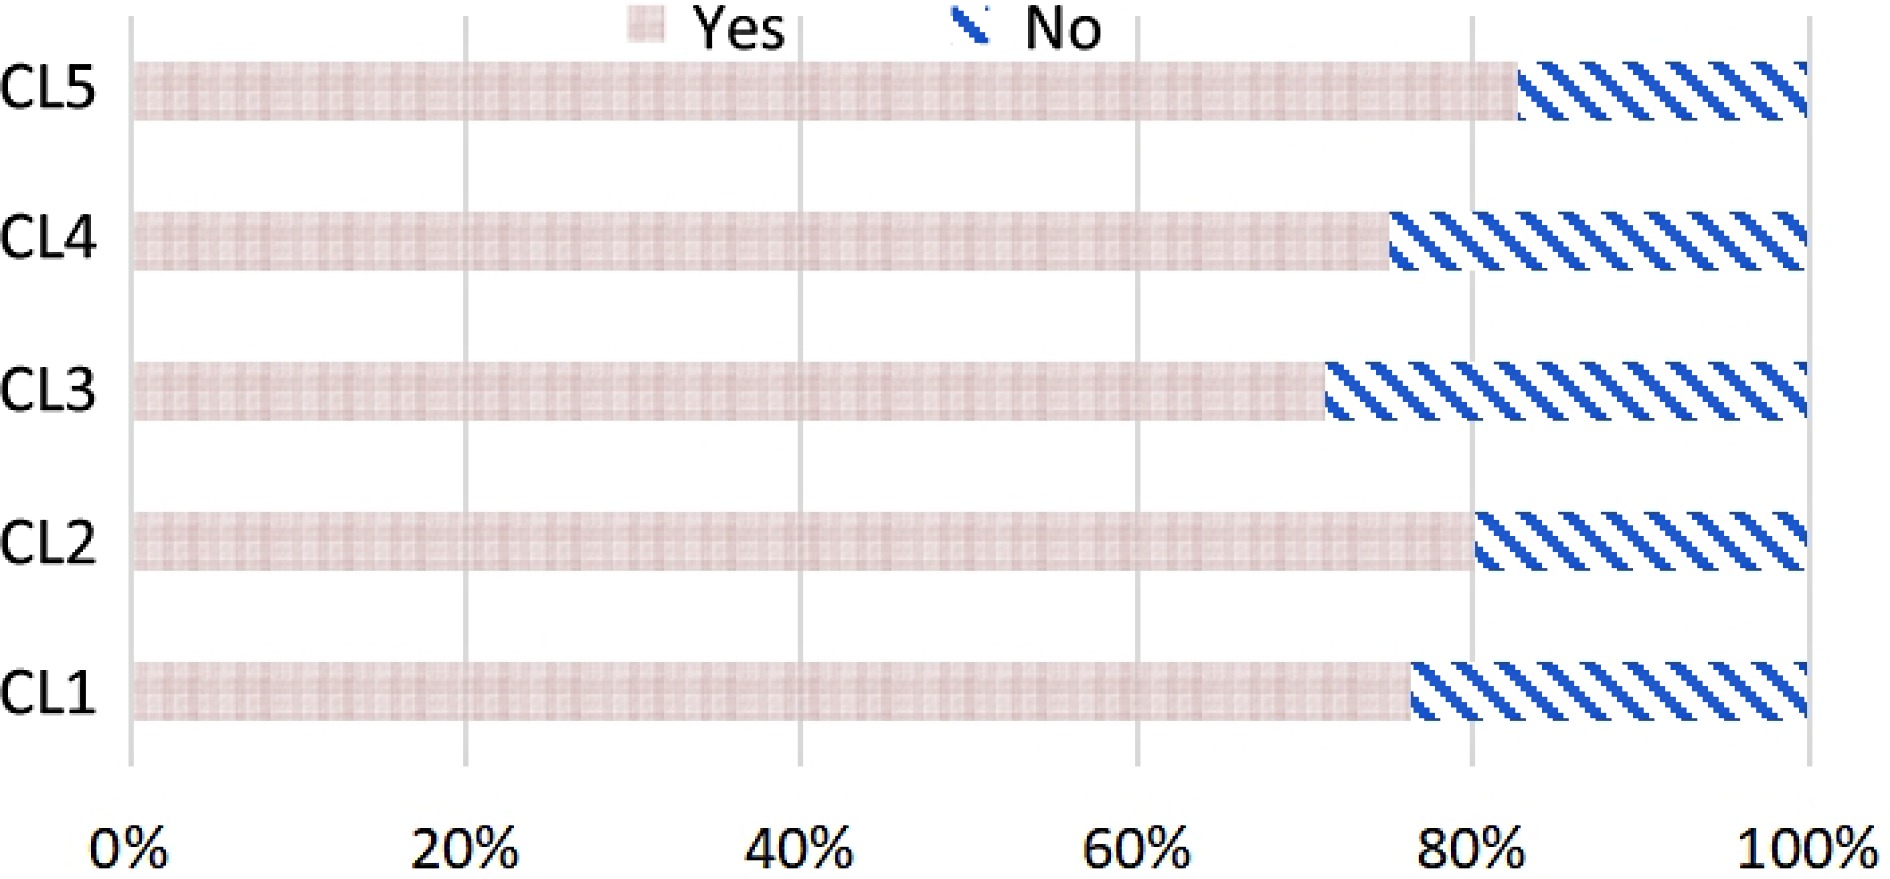
Figure 4.
Ownership of private cars of different latent classes.
-
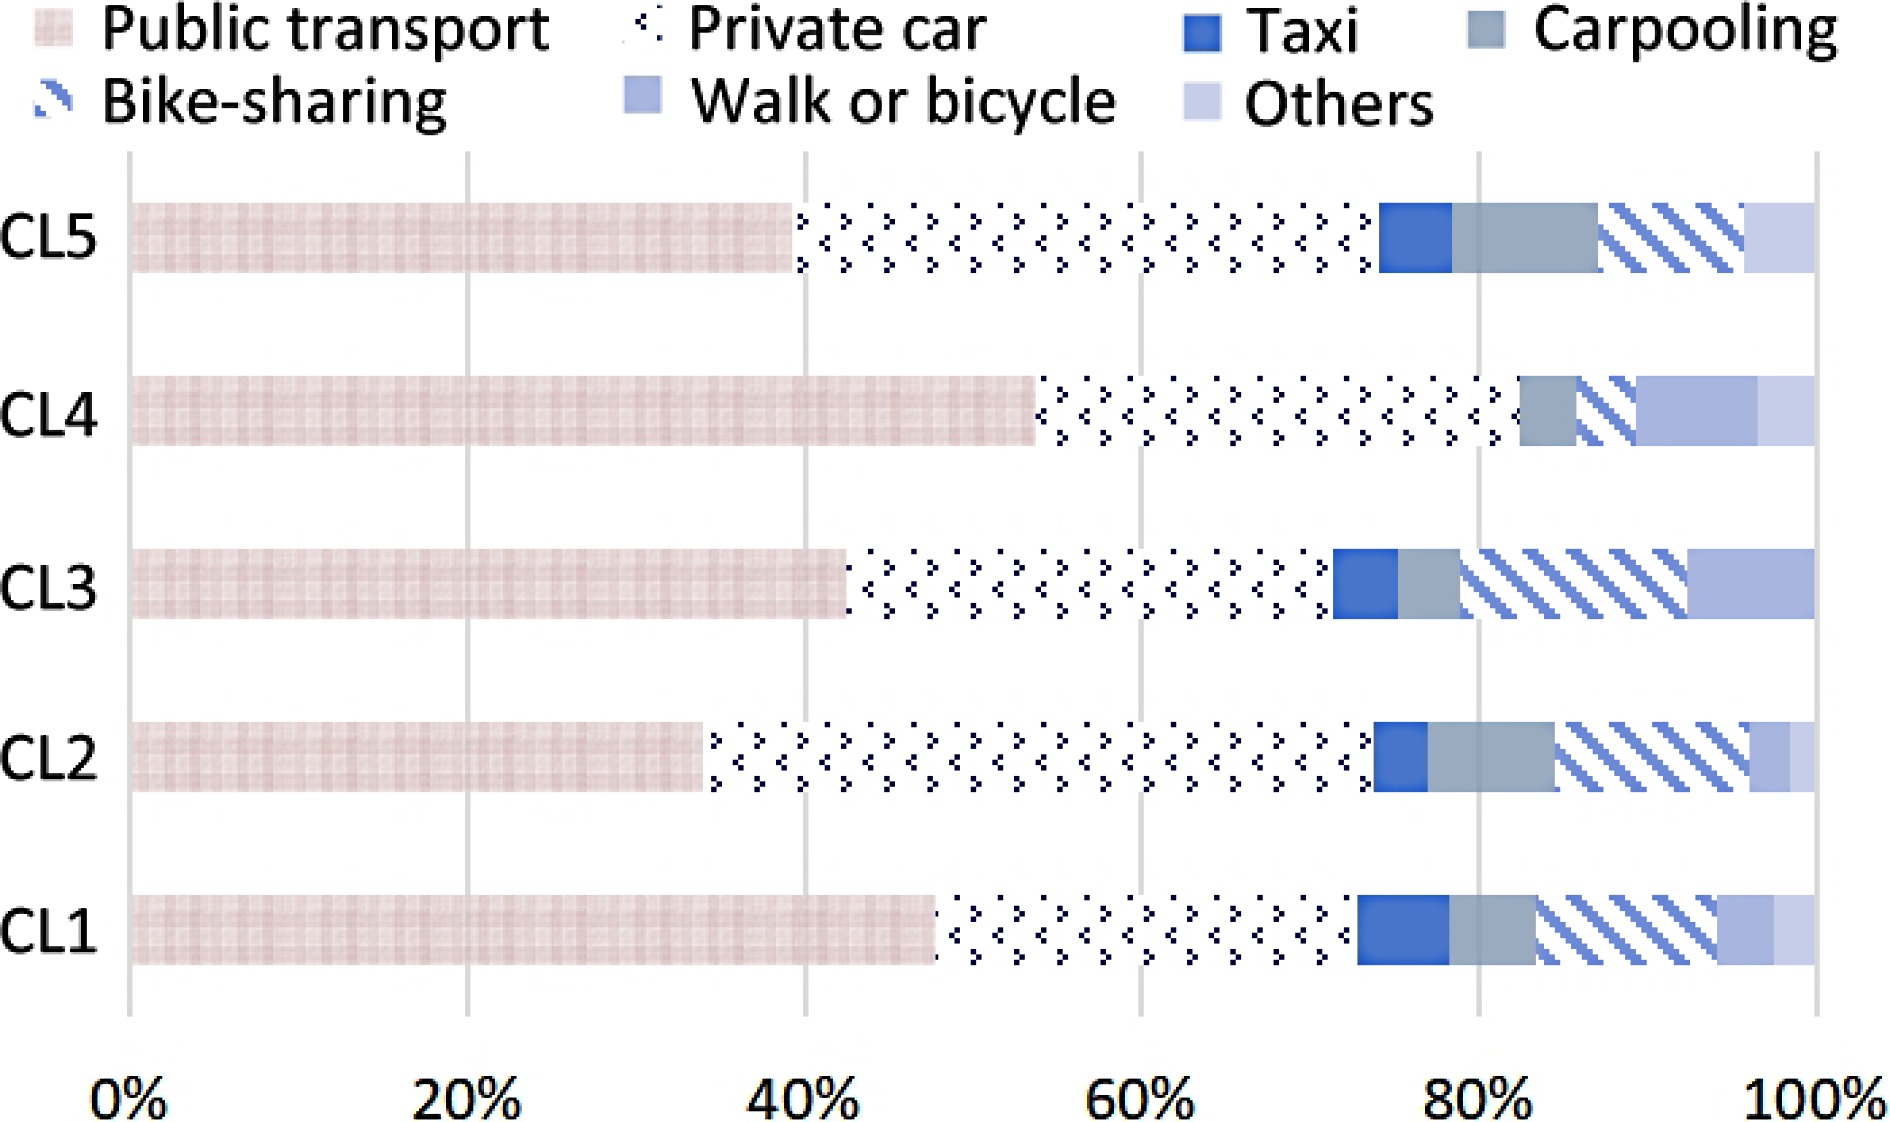
Figure 5.
Travel modes of different latent classes.
-
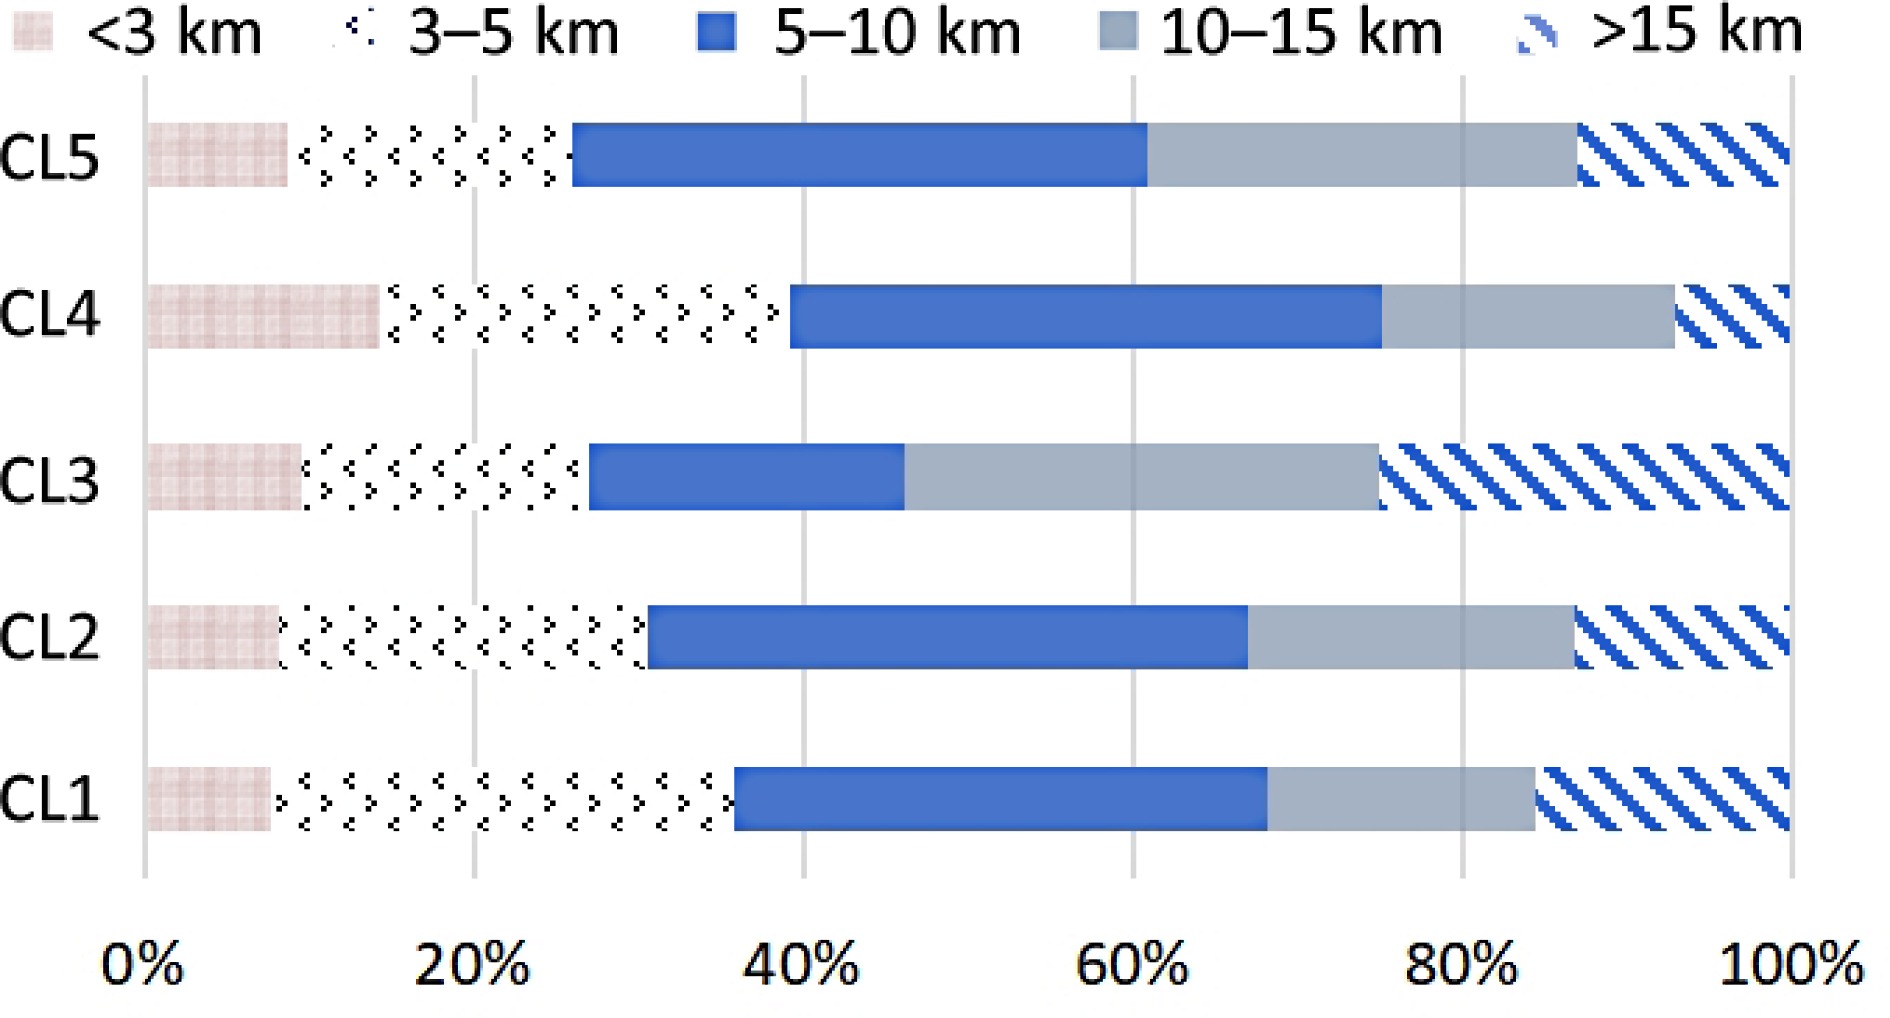
Figure 6.
Travel distance of different latent classes.
-
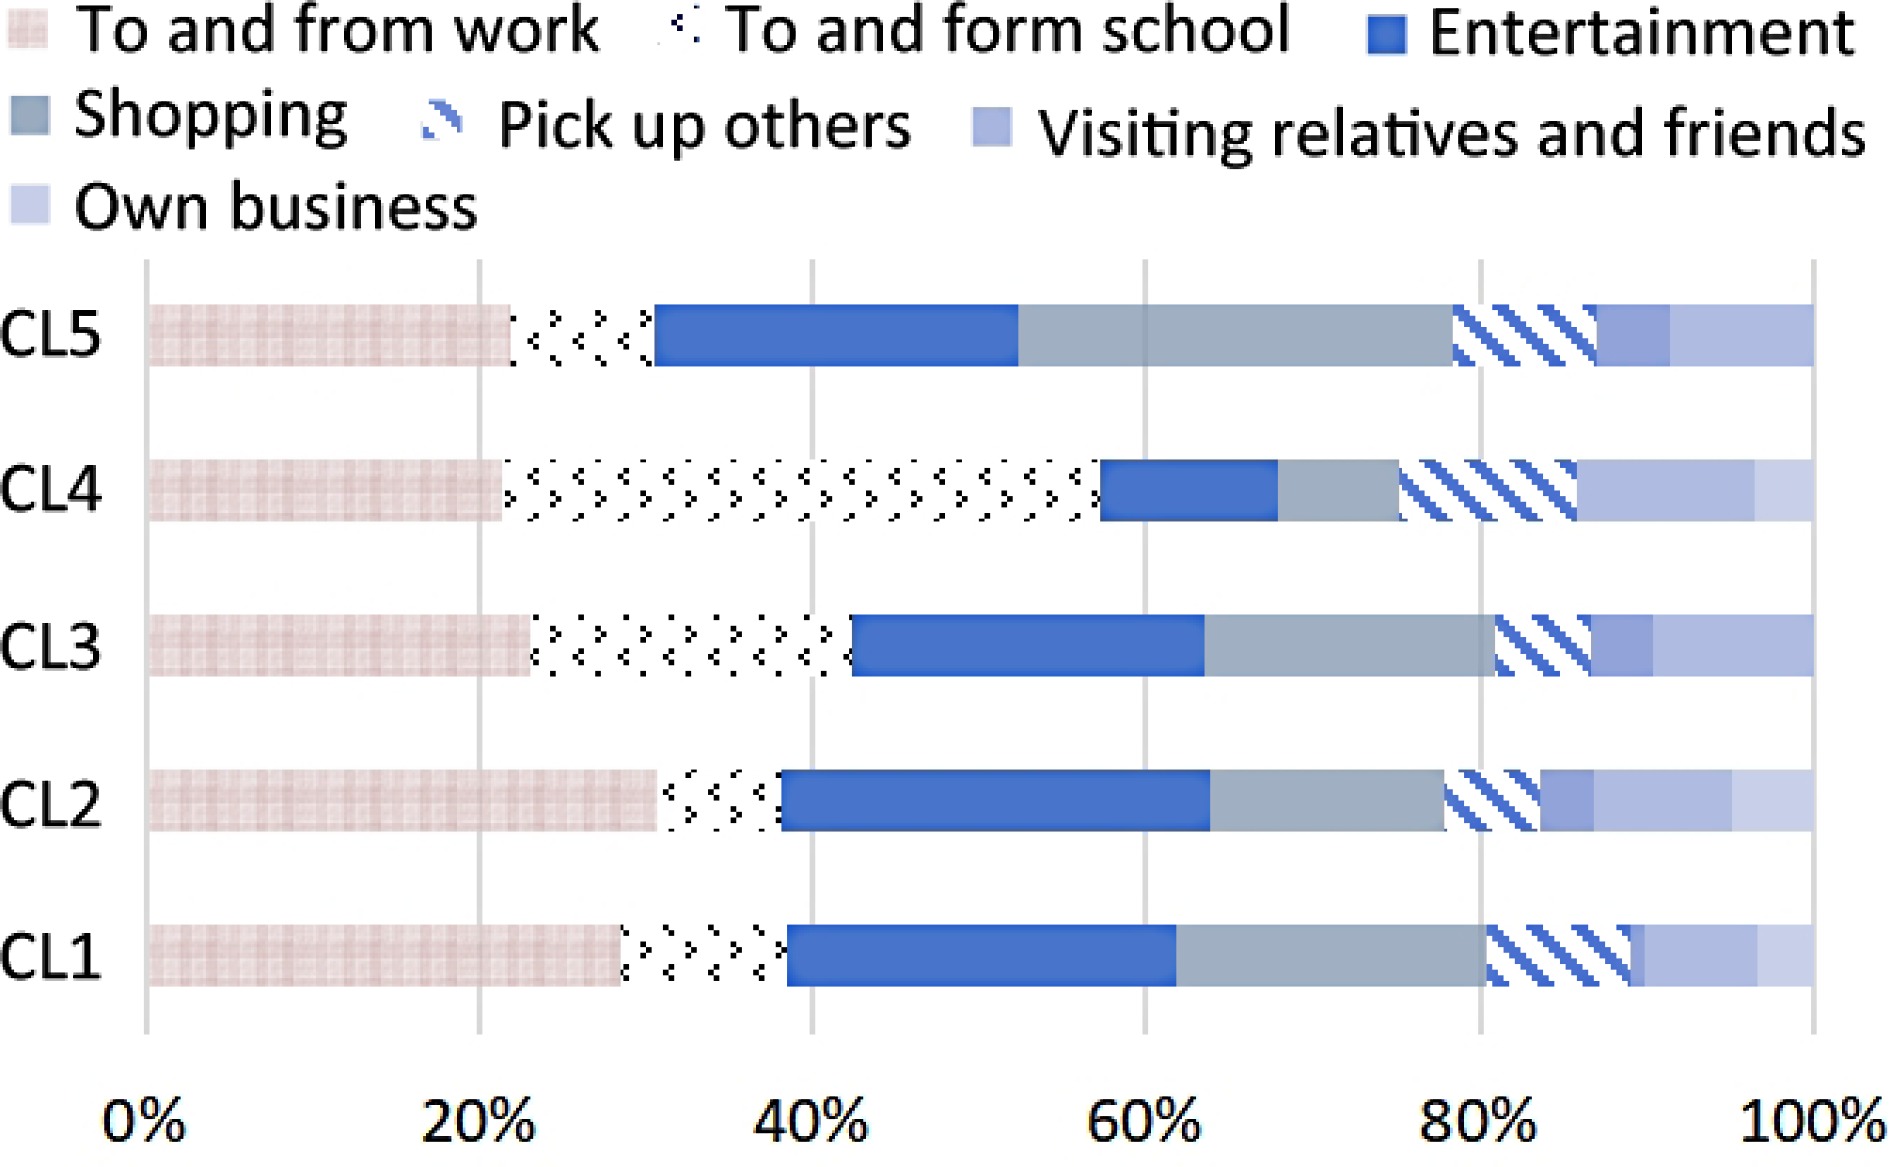
Figure 7.
Travel purposes of different latent classes.
-
Constructs Items Item descriptions Financial incentive policy FIP1 For adopting MaaS, direct financial subsidy is attractive to me. FIP2 For adopting MaaS, subsidy for travel is very attractive to me. FIP3 For adopting MaaS, getting the discount coupon available to supermarket is very attractive to me. Non-financial incentive policy NFIP1 For adopting MaaS, participating in charity donation (Ant Forest from Alibaba) is very attractive to me. NFIP2 For adopting MaaS, getting the carbon coin is very attractive to me. Information policy IP1 For adopting MaaS, the information about route planning is useful to me. IP2 For adopting MaaS, the information about predicted travel time and cost is helpful. IP3 For adopting MaaS, the Information related to the real-time free parking space is helpful to me. IP4 For adopting MaaS, the information related to my carbon footprint is valuable to me. Convenience policy CP1 For adopting MaaS, one-code pass (a QR code can scan all public transport services) is essential. CP2 For adopting MaaS, connect with other travel platform(such as taxi system)is essential. CP3 For adopting MaaS, reducing the queuing time makes sense for me. Innovation trait IT1 I am always curious about new things. IT2 I usually take the lead in trying new technologies compare to people aroud me. IT3 I think it's very interesting to try out the new travel service mode. Habit schema congruence HSC1 MaaS system is similar with my current way of travel. HSC2 MaaS system is similar to the product or service that I am used to. HSC3 I am familiar with using my smartphone for payments and I always take it with me outside. HSC4 I am familiar with the use of journey planning apps (for example Google Map) Environment trait ET1 I am very concerned about the environment, and I feel that environmental problems have become more and more serious. ET2 I think the harmony between man and nature can promote sustainable development. ET3 I think that everyone has the responsibility to protect the environment. ET4 I am worried about the future shortage of natural resources. Social influence SI1 I am willing to adopt MaaS if the government evaluation is good. SI2 I am willing to adopt MaaS if the media evaluation is good. SI3 I am willing to adopt it if MaaS can get support and praise from people around me. Attitude to MaaS ATM1 I think it is necessary to travel with MaaS. ATM2 I think the government should encourage the use of MaaS mode. ATM3 I think once I use the MaaS, I will reduce my car usage. Behavior to MaaS BTM1 I plan to be involved in the MaaS travel mode in the future. BTM2 I am looking forward to take part in the MaaS travel mode in the future. Table 1.
Factor statements.
-
Characteristics Items Frequency
(n = 456)Percentage
(%)Gender Male 228 50 Female 228 50 Age (years) 18−24 142 31.1 25−34 140 30.7 35−44 98 21.4 45−54 54 11.8 55−64 15 3.2 ≥ 65 7 1.5 Education High school or below 79 17.3 Bachelor's degree 227 49.7 Master's degree or above 150 32.8 Employment status Enterprise employees 84 18.4 Administrative staff 75 16.4 Institution staff 75 16.4 Students 125 27.4 Freelancer 47 10.3 Others 50 10.9 Monthly income
(CNY)< 2,000 80 17.5 2,000−5,000 92 20.1 5,001−10,000 129 28.2 10,001−20,000 108 23.6 > 20,000 47 10.3 Own private car Yes 351 76.9 No 105 23.1 Trip mode Public transport 197 43.2 Private car 137 30 Taxi 20 4.3 Carpooling 26 5.7 Bike-sharing 49 10.7 Walk or bicycle 17 3.7 Others 10 2.1 Table 2.
Sample demographic profile.
-
Construct Item Estimate CR AVE Cronbach α Financial incentive policy FIP1 0.788 0.778 0.540 0.779 FIP2 0.721 FIP3 0.692 Non-financial incentive policy NFIP1 0.778 0.741 0.588 0.74 NFIP2 0.756 Information policy IP1 0.855 0.896 0.682 0.894 IP2 0.772 IP3 0.821 IP4 0.853 Convenience policy CP1 0.831 0.867 0.686 0.867 CP2 0.823 CP3 0.83 Innovation trait IT1 0.745 0.784 0.548 0.782 IT2 0.754 IT3 0.721 Habit schema congruence HSC1 0.883 0.882 0.652 0.879 HSC2 0.79 HSC3 0.783 HSC4 0.768 Environment trait ET1 0.838 0.898 0.687 0.897 ET2 0.829 ET3 0.835 ET4 0.812 Social influence SI1 0.882 0.870 0.691 0.869 SI2 0.816 SI3 0.793 Attitute to MaaS ATM1 0.831 0.836 0.630 0.839 ATM2 0.789 ATM3 0.76 Behavior to MaaS BTM1 0.855 0.796 0.661 0.794 BTM2 0.769 Table 3.
Results of confirmatory factor analysis.
-
FIP NFIP IP CP IT HSC ET SI ATM BTM FIP 0.735 NFIP 0.473** 0.767 IP 0.532** 0.384** 0.826 CP 0.507** 0.398** 0.436** 0.828 IT 0.429** 0.364** 0.432** 0.414** 0.740 HSC 0.414** 0.350** 0.399** 0.425** 0.417** 0.807 ET 0.535** 0.424** 0.519** 0.506** 0.497** 0.468** 0.892 SI 0.409** 0.357** 0.499** 0.540** 0.315** 0.374** 0.457** 0.831 ATM 0.564** 0.415** 0.574** 0.535** 0.435** 0.520** 0.535** 0.509** 0.794 BTM 0.662** 0.567** 0.616** 0.632** 0.551** 0.584** 0.650** 0.548** 0.708** 0.813 ***, **, and * represent significance levels of 1%, 5%, and 10% respectively. The diagonal numbers (in bold) represents the value of √AVE. Table 4.
Discriminant validity analysis.
-
Hypothesis Path Coefficients p-value Test results H1a FIP→ATM 0.232 0.004** Supported H2a NFIP→ATM 0.012 0.847 Rejected H3a IP→ATM 0.210 0.000*** Supported H4a CP→ATM 0.130 0.04** Supported H5a IT→ATM 0.055 0.353 Rejected H6a HSC→ATM 0.213 0.000*** Supported H7a ET→ATM 0.057 0.35 Rejected H8a SI→ATM 0.141 0.014** Supported H1b FIP→BTM 0.187 0.004** Supported H2b NFIP→BTM 0.190 0.000*** Supported H3b IP→BTM 0.085 0.07* Supported H4b CP→BTM 0.130 0.008** Supported H5b IT→BTM 0.103 0.024** Supported H6b HSC→BTM 0.118 0.003** Supported H7b ET→BTM 0.098 0.035** Supported H8b SI→BTM 0.036 0.423 Rejected H9 ATM→BTM 0.292 0.000*** Supported ***, **, and * represent significance levels of 1%, 5%, and 10% respectively. Table 5.
Results of the hypotheses.
-
Path Effect value LLCI ULCI FIP→ATM→BTM 0.068 0.016 0.160 NFIP→ATM→BTM 0.003 −0.038 0.050 IP→ATM→BTM 0.062 0.022 0.122 CP→ATM→BTM 0.038 −0.008 0.112 IT→ATM→BTM 0.016 −0.029 0.066 HSC→ATM→BTM 0.062 0.021 0.134 ET→ATM→BTM 0.017 −0.025 0.068 SI→ATM→BTM 0.041 0.003 0.097 Table 6.
Results of the mediation effect.
-
Number of clusters LL AIC BIC aBIC Entropy LMR (p) BLRT (p) 1 −6,360.714 12,761.428 12,843.878 12,780.404 − − − 2 −5,517.477 11,096.963 11,224.750 11,126.366 0.939 0.000 0.000 3 −5,276.776 10,637.553 10,810.698 10,677.403 0.924 0.000 0.000 4 −5,088.362 10,282.723 10,501.216 10,333.011 0.957 0.090 0.000 5 −4,885.488 9,898.977 10,162.816 9,959.701 0.971 0.002 0.000 6 −4,718.805 9,587.610 9896.797 9658.771 0.952 0.007 0.000 Table 7.
Model fit statistics.
-
Variable Cluster 1 Cluster 2 Cluster 3 Cluster 4 Cluster 5 F value
(p ≤ 0.001)Post hoc test
(p ≤ 0.001)Mean SD Mean SD Mean SD Mean SD Mean SD FIP 4.19 0.60 3.24 0.84 2.13 0.73 4.44 0.37 4.67 0.33 137.9*** 5 > 4 & 1 > 2 > 3 NFIP 3.99 0.76 3.27 0.82 2.50 0.75 4.50 0.36 4.37 0.68 63.509*** 4 & 5 > 1 > 2 > 3 IP 4.39 0.42 3.07 0.44 2.36 0.25 1.77 0.27 4.34 0.21 580.705*** 1 & 5 > 2 > 3 > 4 CP 4.42 0.35 3.08 0.51 2.29 0.23 4.83 0.23 1.64 0.38 676.122*** 4 > 1 > 2 > 3 > 5 IT 4.14 0.60 3.59 0.75 2.58 0.91 4.23 0.91 4.44 0.61 61.921*** 5 > 4 & 1 > 2 > 3 HSC 4.06 0.72 3.50 0.82 2.15 0.93 4.38 0.38 4.57 0.37 85.273*** 5 > 4 & 1 > 2 > 4 ET 4.23 0.62 3.52 0.76 2.13 0.70 4.20 0.75 4.46 0.46 118.395*** 5 & 1 & 4 > 2 > 3 SI 3.25 0.96 2.12 0.90 1.32 0.50 2.61 0.84 2.49 0.96 64.822*** 1 > 4 & 5 > 3 > 2 ATM 4.17 0.71 3.28 0.59 1.94 0.67 3.62 0.82 3.78 0.78 121.583*** 1 > 5 > 2 > 4 > 3 BTM 4.33 0.55 3.25 0.52 2.07 0.64 4.25 0.66 4.24 0.60 208.954*** 1 & 4 & 5 > 2 > 3 ***, **, and * represent significance levels of 1%, 5%, and 10% respectively. Table 8.
Latent profile feature.
-
Cluster 1 Cluster 2 Cluster 3 Cluster 4 Cluster 5 Cluster size 50.90% 26.50% 11.40% 6.10% 5.10% Indicators (mean) FIP 4.19 3.24 2.13 4.44 4.67 NFIP 3.99 3.27 2.5 4.50 4.37 IP 4.39 3.07 2.36 1.77 4.34 CP 4.42 3.08 2.29 4.83 1.63 IT 4.14 3.59 2.58 4.23 4.46 HSC 4.07 3.50 2.15 4.38 4.57 ET 4.22 3.52 2.13 4.20 4.46 SI 3.24 2.12 1.32 2.61 2.50 ATM 4.16 3.28 1.94 3.62 3.78 BTM 4.33 3.25 2.07 4.25 4.24 Socio-demographics Gender Male 45.6% 61.9% 46.10% 46.4% 43.4% Female 54.4% 38.1% 53.80% 53.6% 56.6% Age 18−24 32.3% 29.7% 32.60% 39.2% 13.0% 25−34 34.0% 28.0% 21.10% 25.0% 39.1% 35−44 17.6% 23.9% 28.80% 25.0% 26.0% 45−54 9.9% 14.0% 13.40% 10.7% 17.3% 55−64 4.3% 2.4% 1.90% 0.0% 4.3% ≥ 65 1.7% 1.6% 1.90% 0.0% 0.0% Education High school or below 14.6% 12.3% 26.90% 21.4% 43.4% Bachelor's degree 48.7% 56.1% 48.00% 53.5% 26.0% Master's degree or above 36.6% 31.4% 25.10% 25.0% 30.6% Employment status Enterprise employees 20.6% 19.0% 9.60% 21.4% 8.6% Administrative staff 13.3% 15.7% 25.00% 21.4% 26.0% Institution staff 14.6% 18.1% 19.20% 7.1% 30.4% Students 31.4% 20.6% 26.90% 35.7% 13.0% Freelancer 8.1% 18.1% 3.80% 7.1% 8.6% Others 11.6% 8.2% 15.30% 7.1% 13.0% Monthly income (CNY) < 2,000 22.4% 9.0% 13.40% 21.4% 17.3% 2,000−5,000 19.8% 19.0% 25.00% 21.4% 17.3% 5,001−10,000 26.2% 33.0% 28.80% 28.5% 21.7% 10,001−20,000 22.4% 24.7% 25.00% 17.8% 34.7% > 20,000 9.0% 14.0% 7.60% 10.7% 8.6% Own private car Yes 71.1% 75.0% 80.1% 76.2% 82.6% No 28.9% 25.0% 19.9% 23.8% 17.3% Trip mode Public transport 42.3% 53.5% 33.8% 47.7% 39.1% Private car 28.8% 28.5% 39.6% 25.0% 34.7% Taxi 3.8% 0.0% 3.3% 5.6% 4.3% Carpooling 3.8% 3.5% 7.4% 5.1% 8.6% Bike-sharing 13.4% 3.5% 11.5% 10.7% 8.6% Walk or bicycle 7.6% 7.1% 2.4% 3.4% 0.0% Others 0.0% 3.5% 1.6% 2.5% 4.3% Distance < 3 km 9.6% 14.2% 8.2% 7.7% 8.6% 3−5 km 17.3% 25.0% 22.3% 28.0% 17.3% 5−10 km 19.2% 35.7% 36.3% 32.3% 34.7% 10−15 km 28.8% 17.8% 19.8% 16.3% 26.0% > 15 km 25.0% 7.1% 13.2% 15.5% 13.0% Purpose To and from work 23.0% 21.4% 30.5% 28.4% 21.7% To and from school 19.2% 35.7% 7.4% 9.9% 8.6% Entertainment 21.1% 10.7% 25.6% 23.2% 21.7% Shopping 17.3% 7.1% 14.0% 18.5% 26.0% Pick up others 5.7% 10.7% 5.7% 8.6% 8.6% Visiting relatives and friends 3.8% 0.0% 3.3% 0.8% 4.3% Own business 9.6% 10.7% 8.2% 6.8% 8.6% Other purposes 0.0% 3.5% 4.9% 3.4% 0.0% Table 9.
Profile of the final model.
-
Predictor variable Cluster 2 Cluster 3 Cluster 4 Cluster 5 Intercept SE Intercept SE Intercept SE Intercept SE Gender −0.688** 0.238 0.001 0.320 −0.037 0.043 0.091 0.447 Age 0.082 0.097 0.080 0.132 −0.136 0.171 0.233* 0.144 Education −0.063 0.163 −0.522** 0.239 −0.389 0.285 −0.748* 0.397 Employment status 0.000 0.074 0.035 0.097 −0.085 0.126 −0.008 0.132 Monthly income (RMB) 0.272** 0.093 0.079 0.122 −0.003 0.168 0.160 0.183 ***, **, and * represent significance levels of 1%, 5%, and 10% respectively. Table 10.
Regression results.
Figures
(7)
Tables
(10)