


-
With the development of the economy, people's demand for high-quality living is constantly increasing. In terms of transportation, there is a growing dependence on private cars, leading to an annual increase in car ownership. As a result, congestion and environmental pollution problems are becoming increasingly prominent, becoming a contradiction in urban transportation development. Although various shared modes of transportation have been widely mentioned, their effects have been minimal[1]. To alleviate related issues, Mobility as a Service has emerged and has become a new development in urban transportation in recent years. This service integrates public transportation with various shared modes of transportation, providing one-stop travel information services. The emergence of MaaS not only reduces the frequency of private car usage for travelers, but also reduces congestion, improves traffic efficiency, and thus protects the environment[2]. Internationally, Western countries have proposed new goals for MaaS in terms of integrating green transportation, based on intelligent and digital transportation. At the same time, many provinces and cities in China actively utilize the development ideas of MaaS to solve urban transportation problems, taking into account their urban transportation development status. In 2022, Beijing held a MaaS Ecosystem Development Forum to discuss the 'Beijing MaaS 2.0 Work Plan', which plans to include new modes of transportation such as 'rail+' in the Beijing MaaS plan; Shanghai aims to comprehensively promote MaaS and achieve 'one code access' for rail transit, ground buses, and ferries. However, due to imperfect governance mechanisms and low levels of travel privacy and security[3], the participation of MaaS still needs to be improved. Therefore, it is still a research focus for scholars to call for more travelers to participate in MaaS travel in a targeted manner.
Carbon inclusivity refers to the specific quantification of energy-saving and carbon-reduction behaviors of small and micro-enterprises, community households, and individuals. It assigns a certain value to these efforts and establishes a positive guiding mechanism that combines commercial incentives, policy encouragement, and verified emission reduction trading. In the context of MaaS, transportation service apps like Ubigo and Whim in various countries have designed goals for low-carbon travel. In 2019, Beijing collaborated with Amap, launching the first domestic integrated green travel service platform. It implemented carbon incentives such as taxi fare refunds and discounted vouchers to encourage travelers in choosing green travel options. Furthermore, in terms of travel incentives, scholars have expressed diverse opinions on the effectiveness of different measures. Researchers believe that the incentive approach is related to the individual characteristics of travelers[4] and their socio-economic attributes[5]. Different incentive measures can alleviate peak travel demand from different perspectives. For example, financial incentives not only encourage people's participation in non-motorized travel but also have long-term effects on travelers' travel behavior[6,7]. Information incentives can promote sustainable low-carbon consumption among individuals[8] and so on.
In order to promote the participation of travelers in MaaS, previous studies have mainly explored the preferences and willingness of travelers to use MaaS, as well as the factors behind these preferences. Several reports suggests that, user participation in MaaS travel and their travel habits[9], environmental awareness and the awareness of innovation[10] and other personal characteristics have significant relationships, besides, In recent years, some scholars have combined the satisfaction of MaaS participation with gender, age, and occupation[11] and other combination of personal characteristics. Some scholars have also conducted research from the perspective of a specific population, for example, van't Veer et al.[12] analyzed the acceptance attitude of the commuter population towards MaaS, and Kriswardhana et al.[13] explored the preference of college students for MaaS. With the development of intelligent transportation, the related research on MaaS at home and abroad is gradually increasing. However, most of the existing studies only focus on the acceptance of MaaS by different populations and lack the discussion of how to motivate more different groups of users to participate in MaaS. Therefore, this paper comprehensively considers the following three directions: First, explore the willingness of users with different characteristics to participate in MaaS under the incentive policies; next, according to the existing literature, the personal characteristics of users were included in the study of behavioral intention; lastly, as MaaS services are just emerging in China, to explore the intention of different populations to participate in MaaS[14]. The potential category analysis of the above influencing factors, to study the willingness of populations with different social attributes and travel characteristics to participate in MaaS, it provides a targeted reference basis for the application and promotion of MaaS travel in China.
-
While MaaS is considered a new direction for future urban transportation, whether it can undermine the dominance of private car travel largely depends on the level of participation by travelers[15]. Therefore, governments and operators have to formulate related policies to promote travelers' participation in MaaS from different angles[16,17]. Relevant research has also confirmed the positive effects of financial and non-financial incentives on travel behavior. For example, direct price subsidies and exemption from purchase taxes can incentivize travelers to use electric vehicles[18]; financial incentives are more effective in encouraging travelers to accept smart mobility services compared to other approaches[19]. Additionally, the Chinese Amap platform has incorporated both financial and non-financial incentives into Beijing MaaS platform design. It assigns corresponding carbon energy values based on individuals' level of participation in MaaS, providing incentives such as discounted ride vouchers and discounts from relevant third-party partner businesses to encourage traveler participation[20]. Besides, according to the discussion on the integration level[21], information integration functionality is the first-level requirement of an integrated platform. As a mobility integration service platform, MaaS also provides travelers with one-stop travel information services, offering convenient services. In existing services, platforms like Whim in Finland, Ubigo in Sweden have incorporated real-time travel information into their MaaS services[22]. They provide travelers with information such as intelligent trip planning, travel times, and distances[23], thereby saving travelers' time spent waiting for transportation and queuing. Additionally, to encourage low-carbon travel, some platforms also provide real-time information on carbon emissions and combine it with carbon-inclusive incentives. At the same time, to improve the design of the MaaS platform and encourage more travelers to choose non-private car travel modes, various local governments have issued different policies to enhance travel convenience. According to the annual report released by 'Suishenxing' (Shanghai MaaS service platform) in 2022, Shanghai's government-developed MaaS platform integrates various travel modes and services, including ferries, ride-hailing, shared bicycles, maglev trains, and smart parking[24]. Furthermore, the inclusion of electric shared scooters and carpooling into the MaaS platform provides travelers with more options[25].
Research on the personal traits
-
Many scholars believe that the heterogeneity of travelers has a significant impact on their participation in MaaS. Therefore, scholars have expanded models such as the Technology Acceptance Model (TAM) and the Unified Theory of Acceptance and Use of Technology (UTAUT) to understand the heterogeneity of users' participation in MaaS is based on different habits and personality traits[26,27]. Hence, this study refers to existing literature on the impact of individual traits on MaaS participation and discusses the influencing factors in four aspects: Innovation trait, Habit schema congruence, Environment trait, and Social influence.
Innovation trait is considered one of the influencing factors for individuals' willingness to accept new products and technologies[28]. As an integrated platform, MaaS not only innovates users' travel methods but also introduces a brand-new 'one-stop' platform technology into the urban transportation system. Compared to traditional travel methods, MaaS can provide not only point-to-point travel recommendations but also various travel modes supplementary information[29]. Technophilia[30] refers to a group of people who have a preference for new technologies or products. These individuals often exhibit more enthusiasm for engaging with new technologies[31,32]. They are also an important target audience for promoting MaaS, as they tend to have a positive impact on the usage intention and participation level of MaaS[33]. Since MaaS requires people's participation through mobile devices, travel habits not only include users' choice of transportation modes but also their usage habits of mobile devices. Under the concept of MaaS, which may disrupt traditional travel patterns, users with consistent travel habits are considered to be more receptive to MaaS services and they may have a higher willingness to pay for it[34]. According to existing literature, environmentalists are often more inclined toward public transportation travel[35]. As MaaS is considered to encourage low-carbon travel and maximized social welfare associated with travel impacts[36,37], individuals with high environmental awareness are more likely to prefer participating in MaaS. In addition to individual characteristics, social networks are often considered an important factor influencing people's behavior. Previous studies have also shown that social influence has a positive impact on people's acceptance of automated public transport[38], driverless cars[39], and other new travel modes. Therefore, social influence factors are frequently included in adoption studies of new transportation technologies[40,41]. The results consistently show that social influence factors have a positive impact on user participation in new travel modes.
Research gap
-
Based on the literature reviewed above, it is evident that MaaS has also received a lot of attention in China. With the emphasis on intelligent transportation, related research on MaaS has gradually increased. However, a majority of the existing research is derived from foreign investigations and empirical studies on the acceptance of MaaS, while research on this topic in China remains limited. Furthermore, most of the studies only focus on the acceptance of MaaS by different populations, with a lack of relevant discussion on the related policies for MaaS. Therefore, this paper focuses on the incentives that affect travelers, and takes into account personal characteristics in combination with the theoretical basis of TAM and UTAUT models to identify policies that encourage or discourage consumer adoption of MaaS.
-
Based on the above-mentioned research gap, this paper proposes nine hypotheses. The research framework is illustrated in Fig. 1.
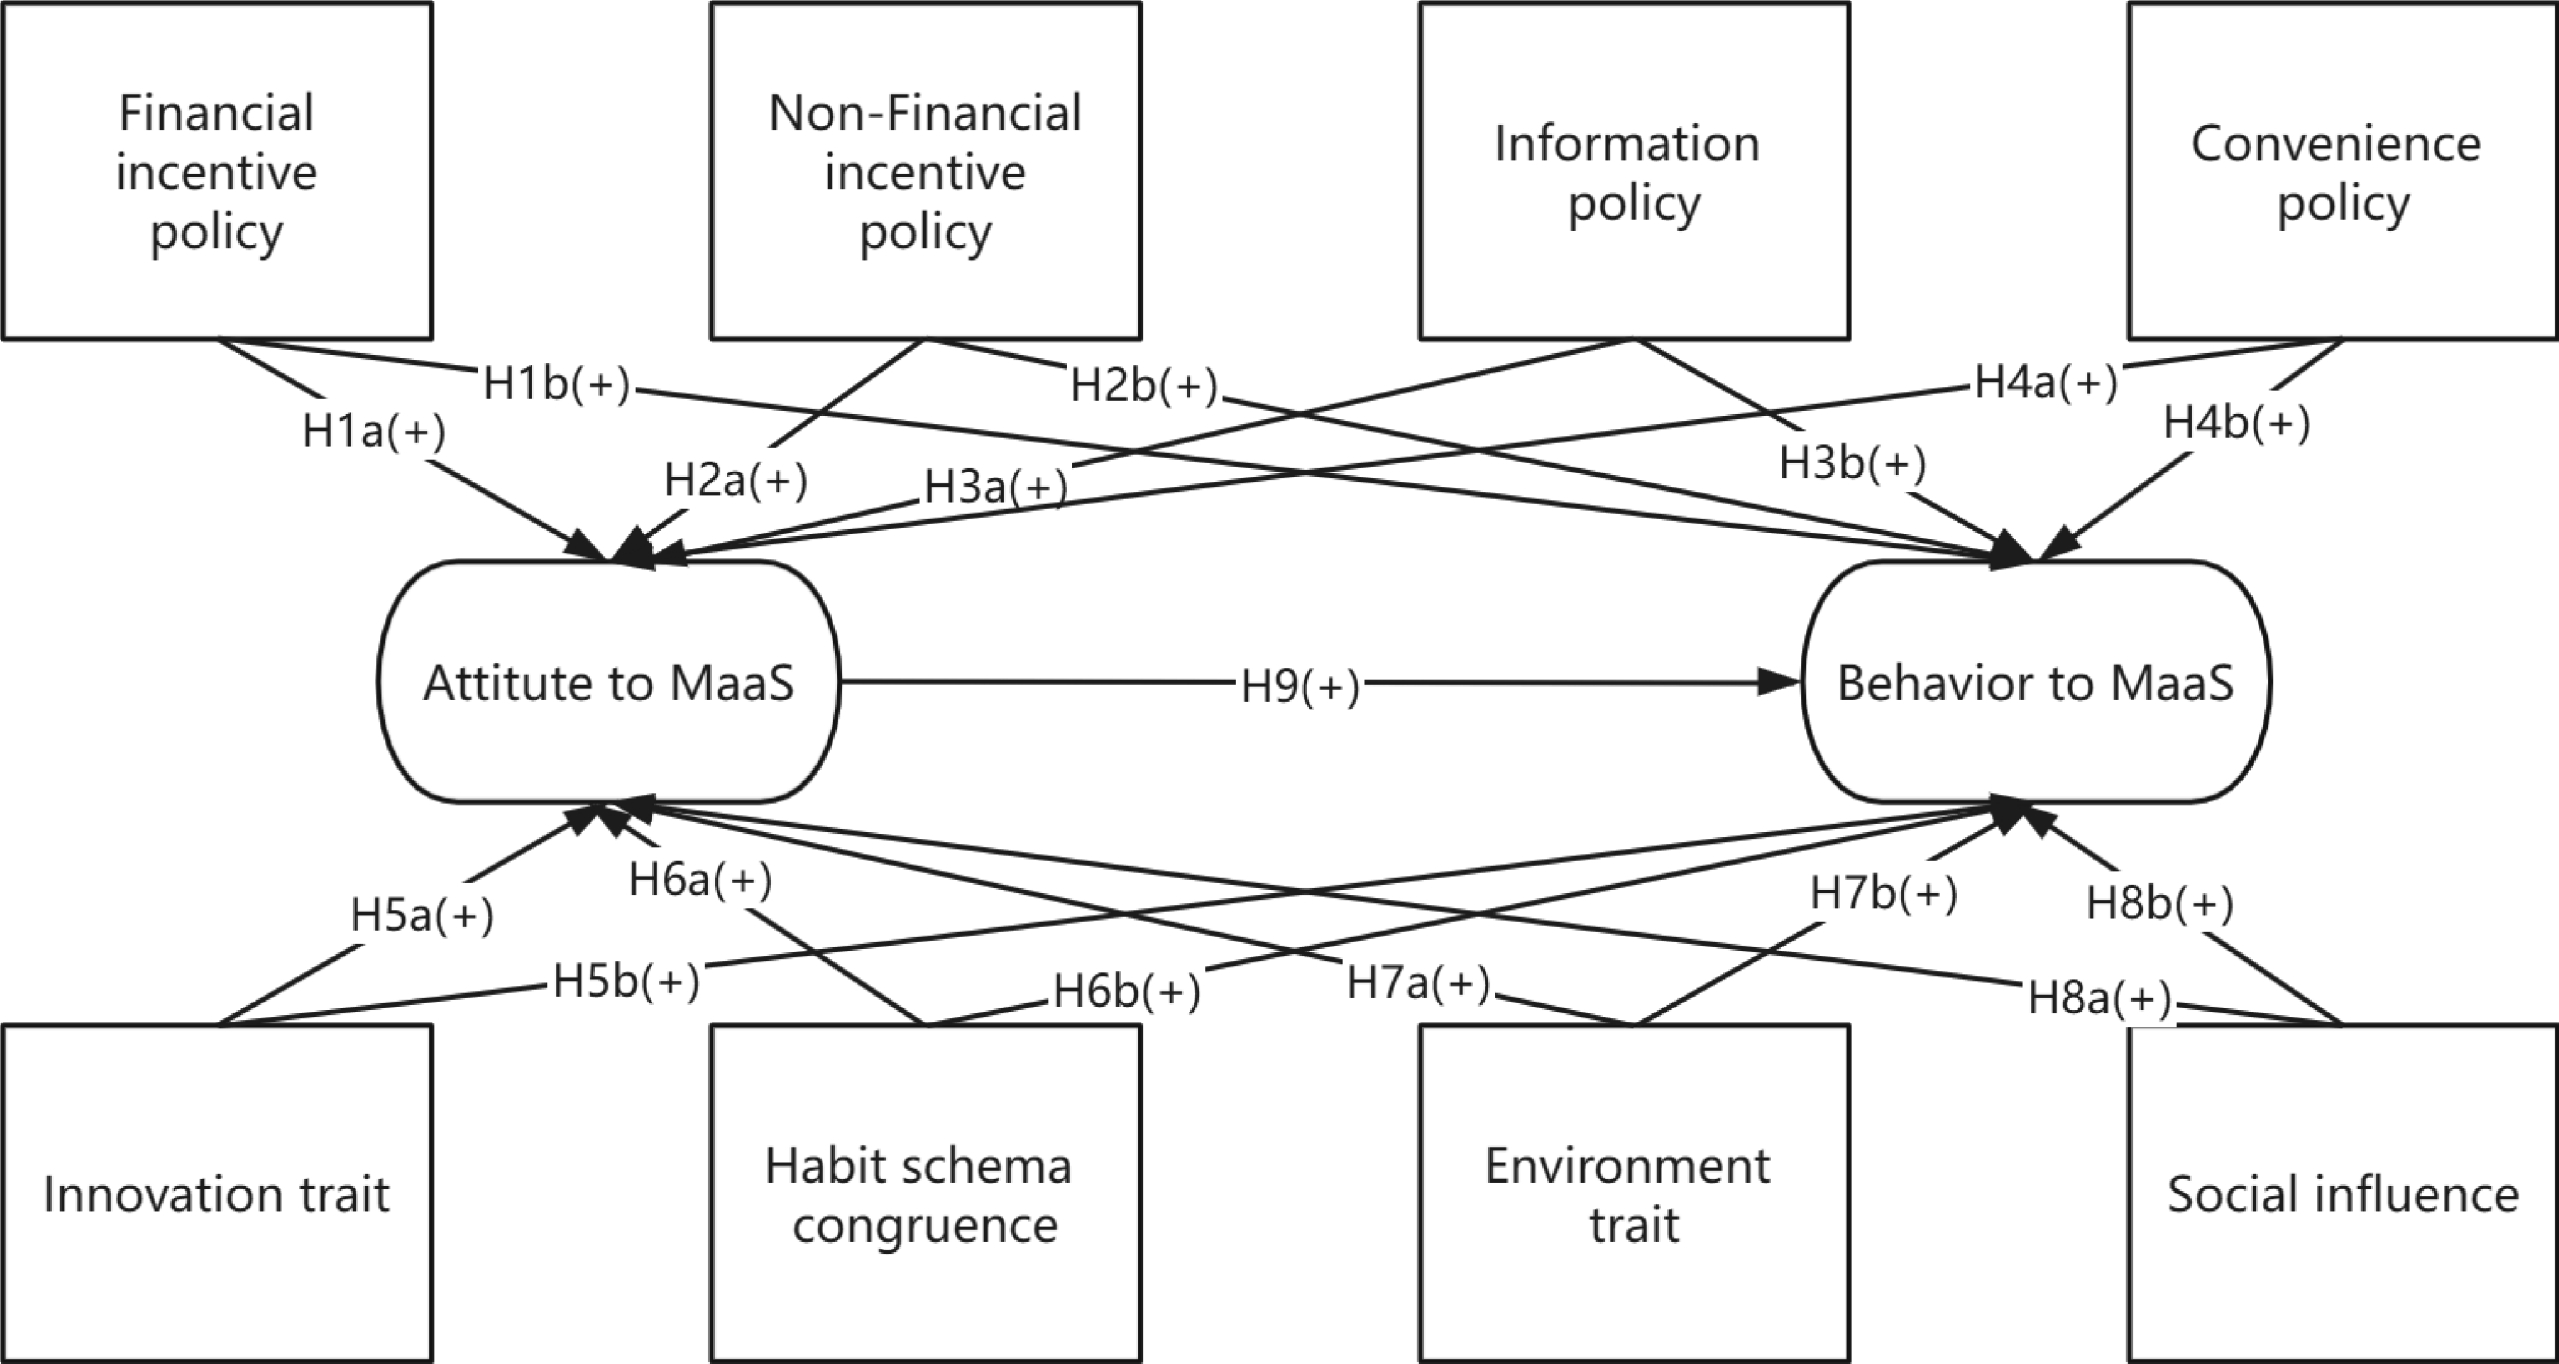
Figure 1.
Research framework.
Conceptual model and proposed hypotheses
-
In this study, financial policies refer to the measures taken by the government or providers, which could encourage people's participation in MaaS by travel discounts or subsidies.
Non-financial policies, on the other hand, involve the carbon coin or carbon incentives through mechanisms such as total control and free quotas.
Information policy refers to 'the degree to which users are prefer to the information offered by the MaaS platform'. People can obtain information about travel planning, estimated time, and estimated cost from the platform. This comprehensive travel information shows the various possibilities of travel in front of users, which may encourage people to participate in MaaS.
Convenience policy can be defined as 'Compared with traditional travel services, MaaS has a convenience policy'. Since MaaS is a one-stop travel service platform, the platform will bring the technical convenience and policy convenience besides the travel service itself, which may also affect the participation degree of users.
H1. Financial incentive policy is positively related to the attitude toward MaaS (H1a) and behavior toward MaaS (H1b).
H2. Non Financial incentive policy is positively related to the attitude to MaaS (H2a) and behavior to MaaS (H2b).
H3. Information policy is positively related to the attitude to MaaS (H3a) and behavior to MaaS (H3b).
H4. Convenience policy is positively related to the attitude to MaaS (H4a) and behavior to MaaS (H4b).
Innovation trait refers to 'the degree to which users are willing to actively try new travel modes'. When users can actively face new technology products, it can be assumed that they will also be willing to explore MaaS in advance or try them out more actively.
Habit schema congruence can be defined as 'The similarity of the user's current travel pattern to the MaaS'. As a new transportation mode, MaaS need users to be familiar with mobile phones, such as navigation softwares. If users have a similar travel habit, their willingness to take part in MaaS will also increase.
Environment trait refers to users' environmental awareness, which includes their concerns about environmental pollution and their participation in environmental behaviors. MaaS as a representative of low-carbon travel, we guess that users with higher environmental awareness will be more willing to participate in it.
Social influence specifically is defined as 'the degree to which users are influenced by the surrounding group when accepting MaaS', especially authoritative media, relatives, and governments that will have an impact on individual behavior. Thus, the following hypothesis is proposed:
H5. Innovation trait is positively related to the attitude to MaaS (H5a) and behavior to MaaS (H5b).
H6. Habit schema congruence is positively related to the attitude to MaaS (H6a) and behavior to MaaS (H6b).
H7. Environment trait is positively related to the attitude to MaaS (H7a) and behavior to MaaS (H7b).
H8. Social influence is positively related to the attitude to MaaS (H8a) and behavior to MaaS (H8b).
The Theory of Reasoned Action (TRA) believes that, to some extent, the individual's attitude and subjective criteria can affect one's behavioral intention, and the individual's behavioral intention can reasonably infer the final behavior. Therefore, based on the conclusions of previous scholars, this paper proposes hypothesis H9:
H9. Attitude to MaaS is positively related to the behavior to MaaS.
Survey design
-
This study employed a combined online and offline questionnaire survey to collect data. The questionnaires were distributed in Beijing, China. The main reason for selecting Beijing was that it launched China's first integrated green travel MaaS service platform in November 2019, making it the first demonstration city for promoting MaaS in China. So users in Beijing would have a better understanding of MaaS-related policies. Additionally, as one of China's mega-cities, Beijing has a well-developed public transportation infrastructure, which provides a larger pool of potential MaaS users. To enhance the effectiveness and validity of the questionnaire, a pre-survey was conducted with 40 participants representing different demographic characteristics, and the questionnaire was modified and optimized accordingly.
The questionnaire in this study consisted of four parts. The first part was about MaaS travel acceptance and questionnaire screening, including 'Have you heard of MaaS travel?' or 'Have you participated in MaaS travel?'. If the respondent answered 'yes' to either of these questions, they were considered to have a certain understanding of MaaS. Otherwise, the questionnaire was considered invalid. The second part was about personal characteristics, including gender, age, monthly income, education level, and commuting characteristics. The third part focused on perceived information, aiming to understand the respondents' awareness of existing financial incentive policies (FIP), non-financial incentive policies (NFIP), information policies (IP), and convenience policies (CP) related to MaaS. The fourth part gathered information about the respondents' characteristics, exploring the heterogeneity under innovation traits (IT), habit schema congruence (HSC), environmental traits (ET), and social influence (SI). The respondents were asked to rate their level of agreement on a Likert scale ranging from '1 = strongly disagree' to '5 = strongly agree' about all the measured items. Table 1 contains the complete scale. Additionally, to ensure data quality, deception questions were included in the questionnaire. Ultimately, 64 questionnaires that did not pass the screening were removed, resulting in a final sample of 456 respondents.
Table 1. Factor statements.
Constructs Items Item descriptions Financial incentive policy FIP1 For adopting MaaS, direct financial subsidy is attractive to me. FIP2 For adopting MaaS, subsidy for travel is very attractive to me. FIP3 For adopting MaaS, getting the discount coupon available to supermarket is very attractive to me. Non-financial incentive policy NFIP1 For adopting MaaS, participating in charity donation (Ant Forest from Alibaba) is very attractive to me. NFIP2 For adopting MaaS, getting the carbon coin is very attractive to me. Information policy IP1 For adopting MaaS, the information about route planning is useful to me. IP2 For adopting MaaS, the information about predicted travel time and cost is helpful. IP3 For adopting MaaS, the Information related to the real-time free parking space is helpful to me. IP4 For adopting MaaS, the information related to my carbon footprint is valuable to me. Convenience policy CP1 For adopting MaaS, one-code pass (a QR code can scan all public transport services) is essential. CP2 For adopting MaaS, connect with other travel platform(such as taxi system)is essential. CP3 For adopting MaaS, reducing the queuing time makes sense for me. Innovation trait IT1 I am always curious about new things. IT2 I usually take the lead in trying new technologies compare to people aroud me. IT3 I think it's very interesting to try out the new travel service mode. Habit schema congruence HSC1 MaaS system is similar with my current way of travel. HSC2 MaaS system is similar to the product or service that I am used to. HSC3 I am familiar with using my smartphone for payments and I always take it with me outside. HSC4 I am familiar with the use of journey planning apps (for example Google Map) Environment trait ET1 I am very concerned about the environment, and I feel that environmental problems have become more and more serious. ET2 I think the harmony between man and nature can promote sustainable development. ET3 I think that everyone has the responsibility to protect the environment. ET4 I am worried about the future shortage of natural resources. Social influence SI1 I am willing to adopt MaaS if the government evaluation is good. SI2 I am willing to adopt MaaS if the media evaluation is good. SI3 I am willing to adopt it if MaaS can get support and praise from people around me. Attitude to MaaS ATM1 I think it is necessary to travel with MaaS. ATM2 I think the government should encourage the use of MaaS mode. ATM3 I think once I use the MaaS, I will reduce my car usage. Behavior to MaaS BTM1 I plan to be involved in the MaaS travel mode in the future. BTM2 I am looking forward to take part in the MaaS travel mode in the future. -
Among the 456 questionnaires, the proportion of males and females was 50%. Respondents aged between 18 and 24 accounted for 31.1% of the total sample, followed by those aged 25−34 (30.7%). 49.7% of the respondents had a bachelor's degree, and students represented 27.4% of the sample. The proportions of respondents who were employees in companies, government agencies, and institutions ranged from 16% to 19%. Additionally, over 50% of the respondents had a monthly income between 5,000 and 20,000 CNY, while the remaining 55% had a monthly income below 10,000 CNY.
Furthermore, it is worth noting that 76.9% of the respondents owned private cars, but the public transportation mode had the highest proportion in the sample (43.2%), followed by private car usage (30.0%). Table 2 provides an overview of the respondents' demographic characteristics.
Table 2. Sample demographic profile.
Characteristics Items Frequency
(n = 456)Percentage
(%)Gender Male 228 50 Female 228 50 Age (years) 18−24 142 31.1 25−34 140 30.7 35−44 98 21.4 45−54 54 11.8 55−64 15 3.2 ≥ 65 7 1.5 Education High school or below 79 17.3 Bachelor's degree 227 49.7 Master's degree or above 150 32.8 Employment status Enterprise employees 84 18.4 Administrative staff 75 16.4 Institution staff 75 16.4 Students 125 27.4 Freelancer 47 10.3 Others 50 10.9 Monthly income
(CNY)< 2,000 80 17.5 2,000−5,000 92 20.1 5,001−10,000 129 28.2 10,001−20,000 108 23.6 > 20,000 47 10.3 Own private car Yes 351 76.9 No 105 23.1 Trip mode Public transport 197 43.2 Private car 137 30 Taxi 20 4.3 Carpooling 26 5.7 Bike-sharing 49 10.7 Walk or bicycle 17 3.7 Others 10 2.1 Reliability and validity test of the measurement model
-
The data were analyzed by AMOS 24. Confirmatory factor analysis (CFA) was conducted to assess the validity and reliability of the measurement model. Structural equation modeling (SEM) was used to test the hypotheses proposed in this study.
The results of the calculations are presented in Tables 3 & 4.
Table 3. Results of confirmatory factor analysis.
Construct Item Estimate CR AVE Cronbach α Financial incentive policy FIP1 0.788 0.778 0.540 0.779 FIP2 0.721 FIP3 0.692 Non-financial incentive policy NFIP1 0.778 0.741 0.588 0.74 NFIP2 0.756 Information policy IP1 0.855 0.896 0.682 0.894 IP2 0.772 IP3 0.821 IP4 0.853 Convenience policy CP1 0.831 0.867 0.686 0.867 CP2 0.823 CP3 0.83 Innovation trait IT1 0.745 0.784 0.548 0.782 IT2 0.754 IT3 0.721 Habit schema congruence HSC1 0.883 0.882 0.652 0.879 HSC2 0.79 HSC3 0.783 HSC4 0.768 Environment trait ET1 0.838 0.898 0.687 0.897 ET2 0.829 ET3 0.835 ET4 0.812 Social influence SI1 0.882 0.870 0.691 0.869 SI2 0.816 SI3 0.793 Attitute to MaaS ATM1 0.831 0.836 0.630 0.839 ATM2 0.789 ATM3 0.76 Behavior to MaaS BTM1 0.855 0.796 0.661 0.794 BTM2 0.769 Table 4. Discriminant validity analysis.
FIP NFIP IP CP IT HSC ET SI ATM BTM FIP 0.735 NFIP 0.473** 0.767 IP 0.532** 0.384** 0.826 CP 0.507** 0.398** 0.436** 0.828 IT 0.429** 0.364** 0.432** 0.414** 0.740 HSC 0.414** 0.350** 0.399** 0.425** 0.417** 0.807 ET 0.535** 0.424** 0.519** 0.506** 0.497** 0.468** 0.892 SI 0.409** 0.357** 0.499** 0.540** 0.315** 0.374** 0.457** 0.831 ATM 0.564** 0.415** 0.574** 0.535** 0.435** 0.520** 0.535** 0.509** 0.794 BTM 0.662** 0.567** 0.616** 0.632** 0.551** 0.584** 0.650** 0.548** 0.708** 0.813 ***, **, and * represent significance levels of 1%, 5%, and 10% respectively. The diagonal numbers (in bold) represents the value of √AVE. The overall fit of the model was evaluated using fit indices. All indices (χ2/df = 1.779, CFI = 0.965, TLI = 0.958, RMSEA = 0.041) were within the recommended threshold ranges[42]. The reliability of the scales is typically assessed by Cronbach's α and composite reliability (CR). As shown in Table 3, Cronbach's α and CR values for each dimension of the model were above 0.7, indicating good reliability[43].
The content of the scales was derived from research findings in the relevant literature, combined with the current development of MaaS both domestically and internationally, ensuring good construct validity. As shown in Table 3, the average variance extracted (AVE) was above 0.5 for all dimensions, and factor loadings were above 0.65, indicating good convergent validity of the model. For discriminant validity, the correlation coefficients between the dimensions of the scales were lower than the square roots of their respective AVEs, supporting the discriminant validity of the measurement model (Table 4). Overall, the scales passed the tests for reliability and validity and can be used for subsequent analysis.
Evaluation of the structural model
-
Structural equation modeling was used to examine the relationship between incentive policies, personal characteristics, and respondents' participation in MaaS. The results of the analysis are presented in Table 5. Overall, the structural model showed a good fit to the data (χ2/df = 1.779, IFI = 0.965, CFI = 0.95, RMSEA = 0.06), indicating that all proposed structural paths were statistically significant. Except hypotheses H2a, H5a, H7a, and H8b, all other hypotheses were supported.
Table 5. Results of the hypotheses.
Hypothesis Path Coefficients p-value Test results H1a FIP→ATM 0.232 0.004** Supported H2a NFIP→ATM 0.012 0.847 Rejected H3a IP→ATM 0.210 0.000*** Supported H4a CP→ATM 0.130 0.04** Supported H5a IT→ATM 0.055 0.353 Rejected H6a HSC→ATM 0.213 0.000*** Supported H7a ET→ATM 0.057 0.35 Rejected H8a SI→ATM 0.141 0.014** Supported H1b FIP→BTM 0.187 0.004** Supported H2b NFIP→BTM 0.190 0.000*** Supported H3b IP→BTM 0.085 0.07* Supported H4b CP→BTM 0.130 0.008** Supported H5b IT→BTM 0.103 0.024** Supported H6b HSC→BTM 0.118 0.003** Supported H7b ET→BTM 0.098 0.035** Supported H8b SI→BTM 0.036 0.423 Rejected H9 ATM→BTM 0.292 0.000*** Supported ***, **, and * represent significance levels of 1%, 5%, and 10% respectively. The results of this study indicate that financial incentive policies (β = 0.232, p = 0.004), information policies (β = 0.210, p < 0.01), and convenience policies (β = 0.130, p = 0.04) are significantly positively correlated to participate in MaaS. Therefore, hypotheses H1a, H3a, and H4a are supported. Although non-financial incentive policies are also positively correlated to participate, the results are not significant, thus rejecting H1b. Furthermore, financial incentive policies, non-financial incentive policies, information policies, and convenience policies all have a significant positive impact on participation behavior in MaaS, thus supporting hypotheses H1b to H4b. Additionally, this paper found that financial policies and information policies have a more significant incentive effect. One possible explanation is that financial policies, as a material reward, can directly stimulate users' participation motivation. Furthermore, providing transportation subsidies and other forms of incentives can reduce the cost burden for users who have to travel longer distances. Non-financial incentives did not yield significant results in this study, possibly because the study only considered carbon credits and carbon coins as non-financial incentive measures. Another possible explanation is that non-financial incentives are closely related to carbon emission calculations, and travelers may lack detailed knowledge of them, leading to distrust and unfamiliarity. Moreover, the existing redemption models for non-financial incentives are relatively limited, which may also contribute to their inability to attract travelers.
In terms of individual characteristics of travelers, innovative traits (β = 0.055, p > 0.05), habit schema congruence (β = 0.213, p < 0.001), environmental influence (β = 0.057, p > 0.05), and social influence (β = 0.141, p < 0.014) are all positively related to attitude, but only H6a and H8a are significantly supported. Additionally, personal characteristics have a positive and significant impact on participation behavior in MaaS, except for social influence (β = 0.036, p > 0.05). Thus, H5b, H6b, and H7b are also supported. Attitudes to participate in MaaS also has a significant positive impact on participation behavior, thus supporting H9. Contrary to the study expectations, environmental factors do not have a significant impact on users' attitudes to participate but show a positive relationship with participation behavior. This could be due to MaaS being a relatively new concept that has not been well promoted and publicized, resulting in limited awareness of its green and low-carbon features. Additionally, although the influence of media and government can enhance users' willingness to participate, there are no significant behavioral outcomes. Therefore, in the future, combining media promotion with actual incentives will be necessary to encourage more users to participate in MaaS travel.
Furthermore, to further analyze the willingness of individuals to participate in MaaS based on the incentive policies and personal characteristics, the Bootstrap method was used to estimate the mediating effects in a sample of 2,000 observations at a 95% confidence interval (as shown in Table 6). The results indicated that the mediating effects of financial incentives, information incentives, habit schema congruence, and social influence were significant, suggesting that these factors indirectly influenced the willingness to participate in MaaS through attitudes towards behavior.
Table 6. Results of the mediation effect.
Path Effect value LLCI ULCI FIP→ATM→BTM 0.068 0.016 0.160 NFIP→ATM→BTM 0.003 −0.038 0.050 IP→ATM→BTM 0.062 0.022 0.122 CP→ATM→BTM 0.038 −0.008 0.112 IT→ATM→BTM 0.016 −0.029 0.066 HSC→ATM→BTM 0.062 0.021 0.134 ET→ATM→BTM 0.017 −0.025 0.068 SI→ATM→BTM 0.041 0.003 0.097 Latent profile analysis
-
To better explore the heterogeneity of different user groups in MaaS and their main demographic characteristics, and to provide more targeted incentives for different populations to participate in MaaS, this paper uses Mplus 8.3 to use the 10 dimensions in Table 1 as observed variables for latent category analysis and characterized each category[44].
To investigate the potential latent classes of users' participation in MaaS, starting with one class as a baseline, the number of profiles was gradually increased. According to Table 7, the AIC, BIC, and aBIC values progressively decreased with the increase in the number of clusters, and the Bootstrap Likelihood Ratio Test (BLRT) values were significant for all categories. By comparing the models, the five-cluster model showed lower AIC, BIC, and aBIC values than the four-cluster model, and the entropy value was greater than 0.9. Therefore, it is considered that the five-cluster model can better predict respondents' choices in MaaS participation.
Table 7. Model fit statistics.
Number of clusters LL AIC BIC aBIC Entropy LMR (p) BLRT (p) 1 −6,360.714 12,761.428 12,843.878 12,780.404 − − − 2 −5,517.477 11,096.963 11,224.750 11,126.366 0.939 0.000 0.000 3 −5,276.776 10,637.553 10,810.698 10,677.403 0.924 0.000 0.000 4 −5,088.362 10,282.723 10,501.216 10,333.011 0.957 0.090 0.000 5 −4,885.488 9,898.977 10,162.816 9,959.701 0.971 0.002 0.000 6 −4,718.805 9,587.610 9896.797 9658.771 0.952 0.007 0.000 To further analyze the relationship between each dimension and MaaS participation, this study conducted an analysis of variance (ANOVA) to explore whether there are significant differences between the latent classes in each dimension. From Fig. 2 & Table 8, it can be observed that the five latent classes exhibit significant differences in the classification. Table 9 provides an overview of the final classification indices and demographic indicators, arranged in order of percentage shares. The results show that Cluster 1 has the highest level of positive intention and behavior in MaaS participation. According to post hoc tests, this group has the highest average scores in information incentives, environmental influence, and social influence. Cluster 2 shows reduced willingness compared to Cluster 1, while Cluster 3 has the lowest scores across all categories.Additionally, both Cluster 4 and Cluster 5 demonstrate relatively high intention and behavior in MaaS participation. However, they score the lowest in information incentives and convenience incentives, respectively. Moreover, Cluster 5 users have lower scores in the Innovation trait, indicating a lower acceptance of new technologies, making them more likely to reject MaaS travel.
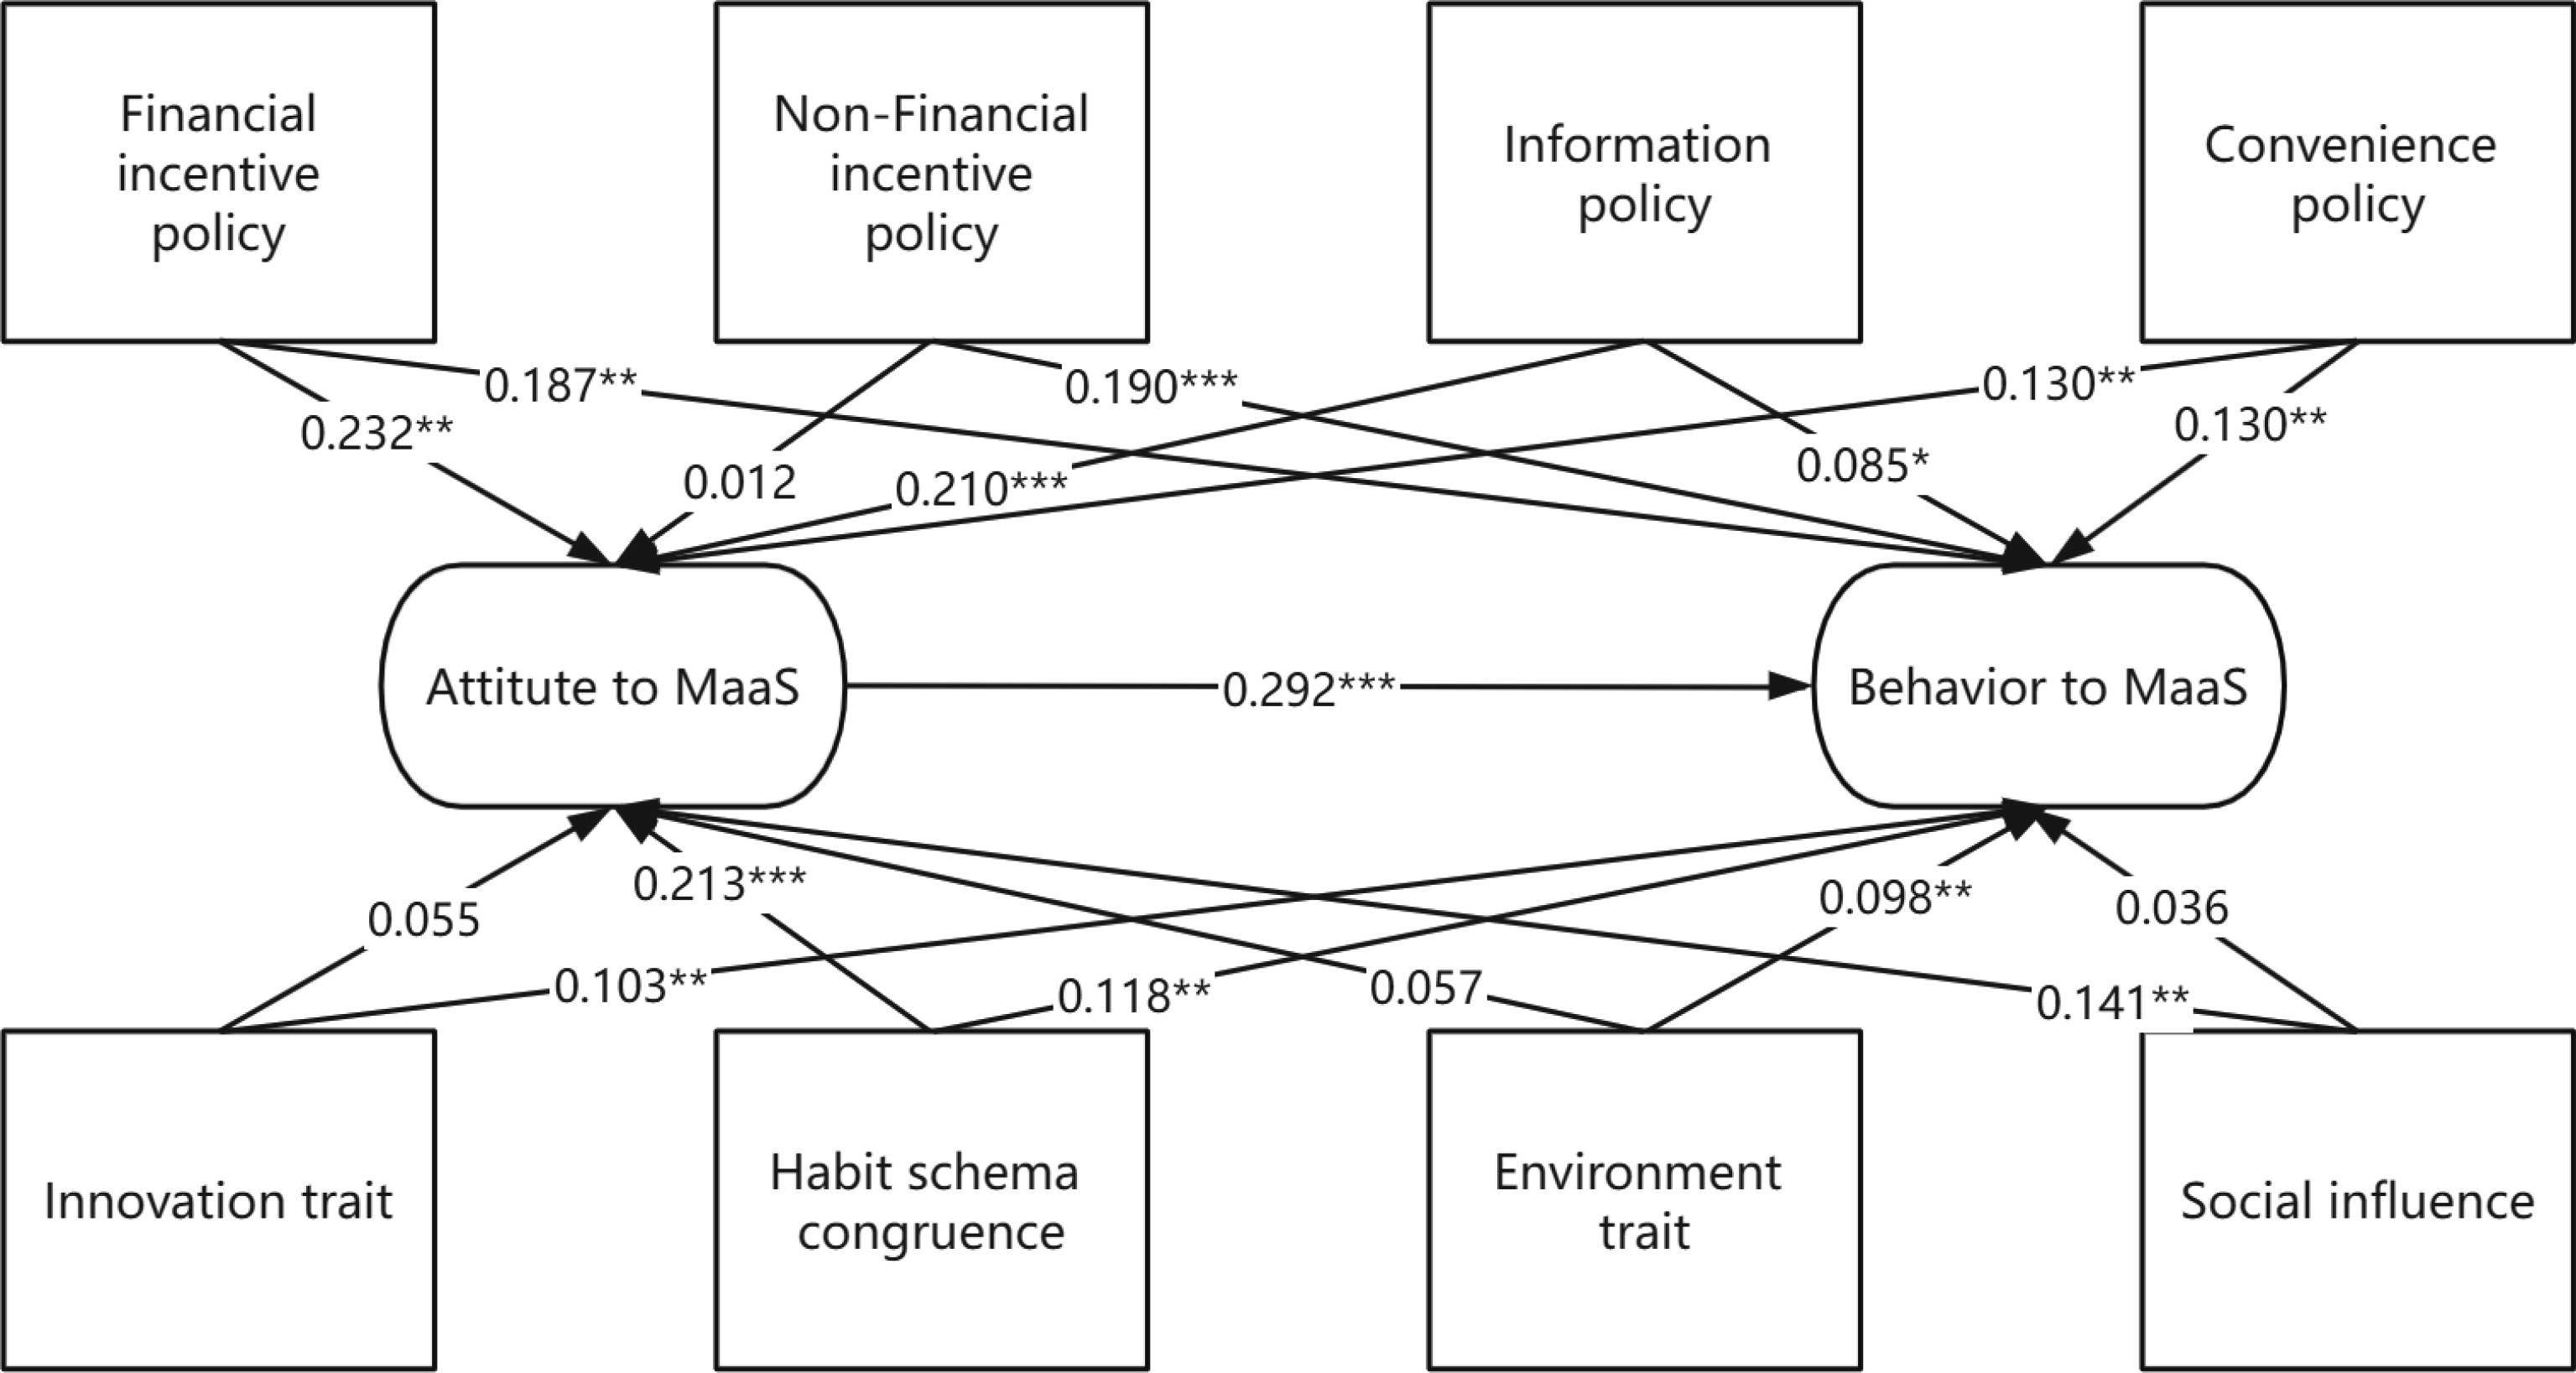
Figure 2.
Results of the hypotheses.
Table 8. Latent profile feature.
Variable Cluster 1 Cluster 2 Cluster 3 Cluster 4 Cluster 5 F value
(p ≤ 0.001)Post hoc test
(p ≤ 0.001)Mean SD Mean SD Mean SD Mean SD Mean SD FIP 4.19 0.60 3.24 0.84 2.13 0.73 4.44 0.37 4.67 0.33 137.9*** 5 > 4 & 1 > 2 > 3 NFIP 3.99 0.76 3.27 0.82 2.50 0.75 4.50 0.36 4.37 0.68 63.509*** 4 & 5 > 1 > 2 > 3 IP 4.39 0.42 3.07 0.44 2.36 0.25 1.77 0.27 4.34 0.21 580.705*** 1 & 5 > 2 > 3 > 4 CP 4.42 0.35 3.08 0.51 2.29 0.23 4.83 0.23 1.64 0.38 676.122*** 4 > 1 > 2 > 3 > 5 IT 4.14 0.60 3.59 0.75 2.58 0.91 4.23 0.91 4.44 0.61 61.921*** 5 > 4 & 1 > 2 > 3 HSC 4.06 0.72 3.50 0.82 2.15 0.93 4.38 0.38 4.57 0.37 85.273*** 5 > 4 & 1 > 2 > 4 ET 4.23 0.62 3.52 0.76 2.13 0.70 4.20 0.75 4.46 0.46 118.395*** 5 & 1 & 4 > 2 > 3 SI 3.25 0.96 2.12 0.90 1.32 0.50 2.61 0.84 2.49 0.96 64.822*** 1 > 4 & 5 > 3 > 2 ATM 4.17 0.71 3.28 0.59 1.94 0.67 3.62 0.82 3.78 0.78 121.583*** 1 > 5 > 2 > 4 > 3 BTM 4.33 0.55 3.25 0.52 2.07 0.64 4.25 0.66 4.24 0.60 208.954*** 1 & 4 & 5 > 2 > 3 ***, **, and * represent significance levels of 1%, 5%, and 10% respectively. Table 9. Profile of the final model.
Cluster 1 Cluster 2 Cluster 3 Cluster 4 Cluster 5 Cluster size 50.90% 26.50% 11.40% 6.10% 5.10% Indicators (mean) FIP 4.19 3.24 2.13 4.44 4.67 NFIP 3.99 3.27 2.5 4.50 4.37 IP 4.39 3.07 2.36 1.77 4.34 CP 4.42 3.08 2.29 4.83 1.63 IT 4.14 3.59 2.58 4.23 4.46 HSC 4.07 3.50 2.15 4.38 4.57 ET 4.22 3.52 2.13 4.20 4.46 SI 3.24 2.12 1.32 2.61 2.50 ATM 4.16 3.28 1.94 3.62 3.78 BTM 4.33 3.25 2.07 4.25 4.24 Socio-demographics Gender Male 45.6% 61.9% 46.10% 46.4% 43.4% Female 54.4% 38.1% 53.80% 53.6% 56.6% Age 18−24 32.3% 29.7% 32.60% 39.2% 13.0% 25−34 34.0% 28.0% 21.10% 25.0% 39.1% 35−44 17.6% 23.9% 28.80% 25.0% 26.0% 45−54 9.9% 14.0% 13.40% 10.7% 17.3% 55−64 4.3% 2.4% 1.90% 0.0% 4.3% ≥ 65 1.7% 1.6% 1.90% 0.0% 0.0% Education High school or below 14.6% 12.3% 26.90% 21.4% 43.4% Bachelor's degree 48.7% 56.1% 48.00% 53.5% 26.0% Master's degree or above 36.6% 31.4% 25.10% 25.0% 30.6% Employment status Enterprise employees 20.6% 19.0% 9.60% 21.4% 8.6% Administrative staff 13.3% 15.7% 25.00% 21.4% 26.0% Institution staff 14.6% 18.1% 19.20% 7.1% 30.4% Students 31.4% 20.6% 26.90% 35.7% 13.0% Freelancer 8.1% 18.1% 3.80% 7.1% 8.6% Others 11.6% 8.2% 15.30% 7.1% 13.0% Monthly income (CNY) < 2,000 22.4% 9.0% 13.40% 21.4% 17.3% 2,000−5,000 19.8% 19.0% 25.00% 21.4% 17.3% 5,001−10,000 26.2% 33.0% 28.80% 28.5% 21.7% 10,001−20,000 22.4% 24.7% 25.00% 17.8% 34.7% > 20,000 9.0% 14.0% 7.60% 10.7% 8.6% Own private car Yes 71.1% 75.0% 80.1% 76.2% 82.6% No 28.9% 25.0% 19.9% 23.8% 17.3% Trip mode Public transport 42.3% 53.5% 33.8% 47.7% 39.1% Private car 28.8% 28.5% 39.6% 25.0% 34.7% Taxi 3.8% 0.0% 3.3% 5.6% 4.3% Carpooling 3.8% 3.5% 7.4% 5.1% 8.6% Bike-sharing 13.4% 3.5% 11.5% 10.7% 8.6% Walk or bicycle 7.6% 7.1% 2.4% 3.4% 0.0% Others 0.0% 3.5% 1.6% 2.5% 4.3% Distance < 3 km 9.6% 14.2% 8.2% 7.7% 8.6% 3−5 km 17.3% 25.0% 22.3% 28.0% 17.3% 5−10 km 19.2% 35.7% 36.3% 32.3% 34.7% 10−15 km 28.8% 17.8% 19.8% 16.3% 26.0% > 15 km 25.0% 7.1% 13.2% 15.5% 13.0% Purpose To and from work 23.0% 21.4% 30.5% 28.4% 21.7% To and from school 19.2% 35.7% 7.4% 9.9% 8.6% Entertainment 21.1% 10.7% 25.6% 23.2% 21.7% Shopping 17.3% 7.1% 14.0% 18.5% 26.0% Pick up others 5.7% 10.7% 5.7% 8.6% 8.6% Visiting relatives and friends 3.8% 0.0% 3.3% 0.8% 4.3% Own business 9.6% 10.7% 8.2% 6.8% 8.6% Other purposes 0.0% 3.5% 4.9% 3.4% 0.0% In addition, this study utilized the R3Step method and incorporated personal attributes as covariates in a logistic regression analysis. To ensure the robustness of the results, Cluster 1 was selected as the reference category for the regression. The results are shown in Table 10. The findings indicate that gender, age, education, and income all have significant impacts on the latent classes.
Table 10. Regression results.
Predictor variable Cluster 2 Cluster 3 Cluster 4 Cluster 5 Intercept SE Intercept SE Intercept SE Intercept SE Gender −0.688** 0.238 0.001 0.320 −0.037 0.043 0.091 0.447 Age 0.082 0.097 0.080 0.132 −0.136 0.171 0.233* 0.144 Education −0.063 0.163 −0.522** 0.239 −0.389 0.285 −0.748* 0.397 Employment status 0.000 0.074 0.035 0.097 −0.085 0.126 −0.008 0.132 Monthly income (RMB) 0.272** 0.093 0.079 0.122 −0.003 0.168 0.160 0.183 ***, **, and * represent significance levels of 1%, 5%, and 10% respectively. To conduct a more comprehensive analysis, we have included users' travel characteristics as covariates in the model and visualized the ownership of private cars, travel modes, travel distances, and travel purposes among different groups in Figs 3−7.
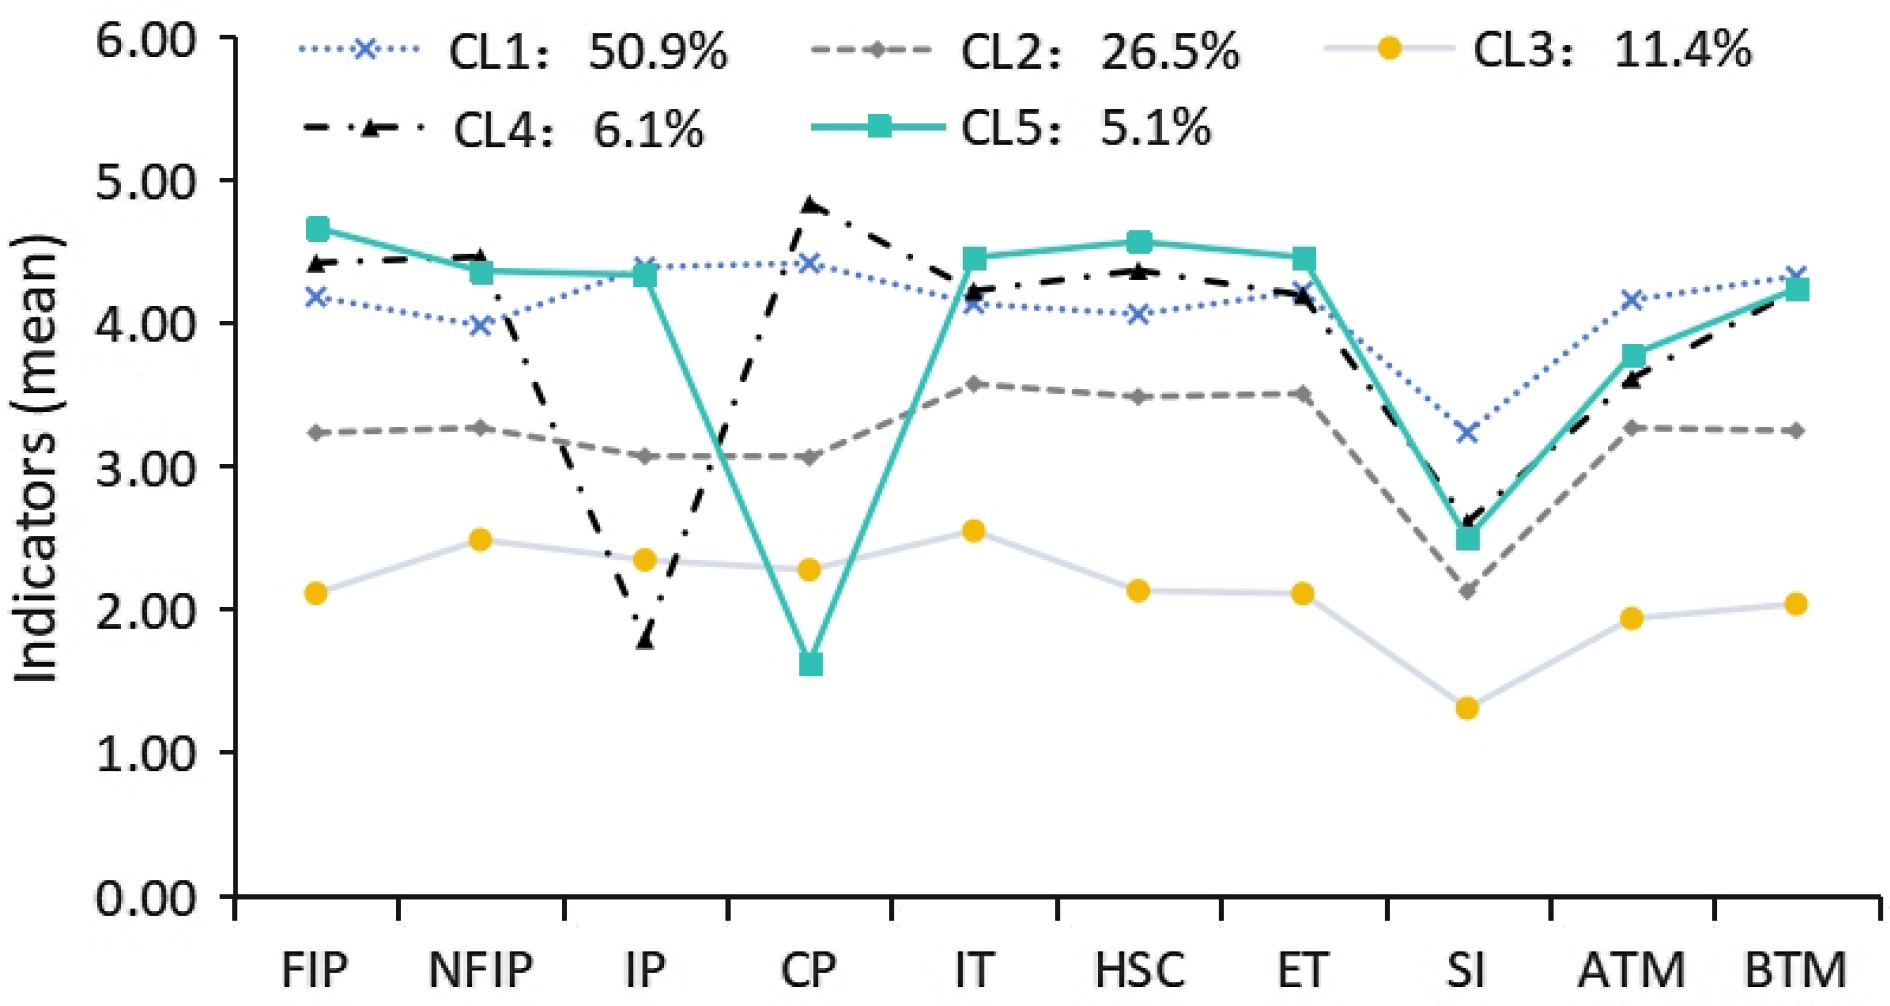
Figure 3.
The distribution of different latent classes.
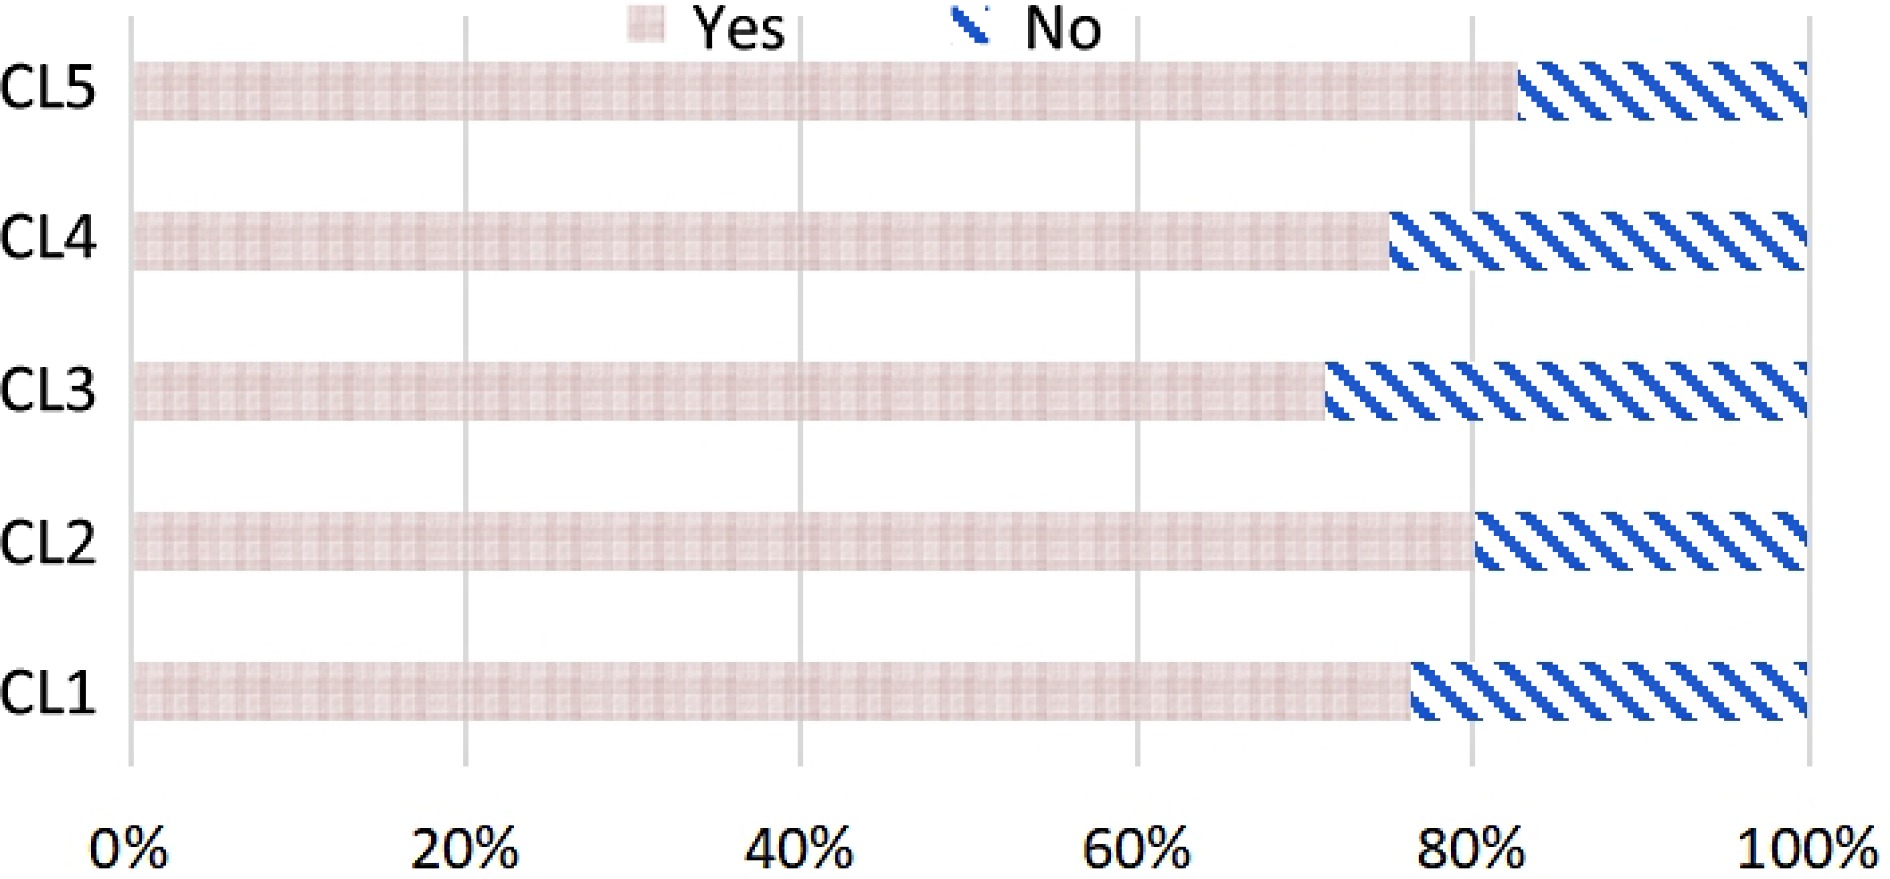
Figure 4.
Ownership of private cars of different latent classes.
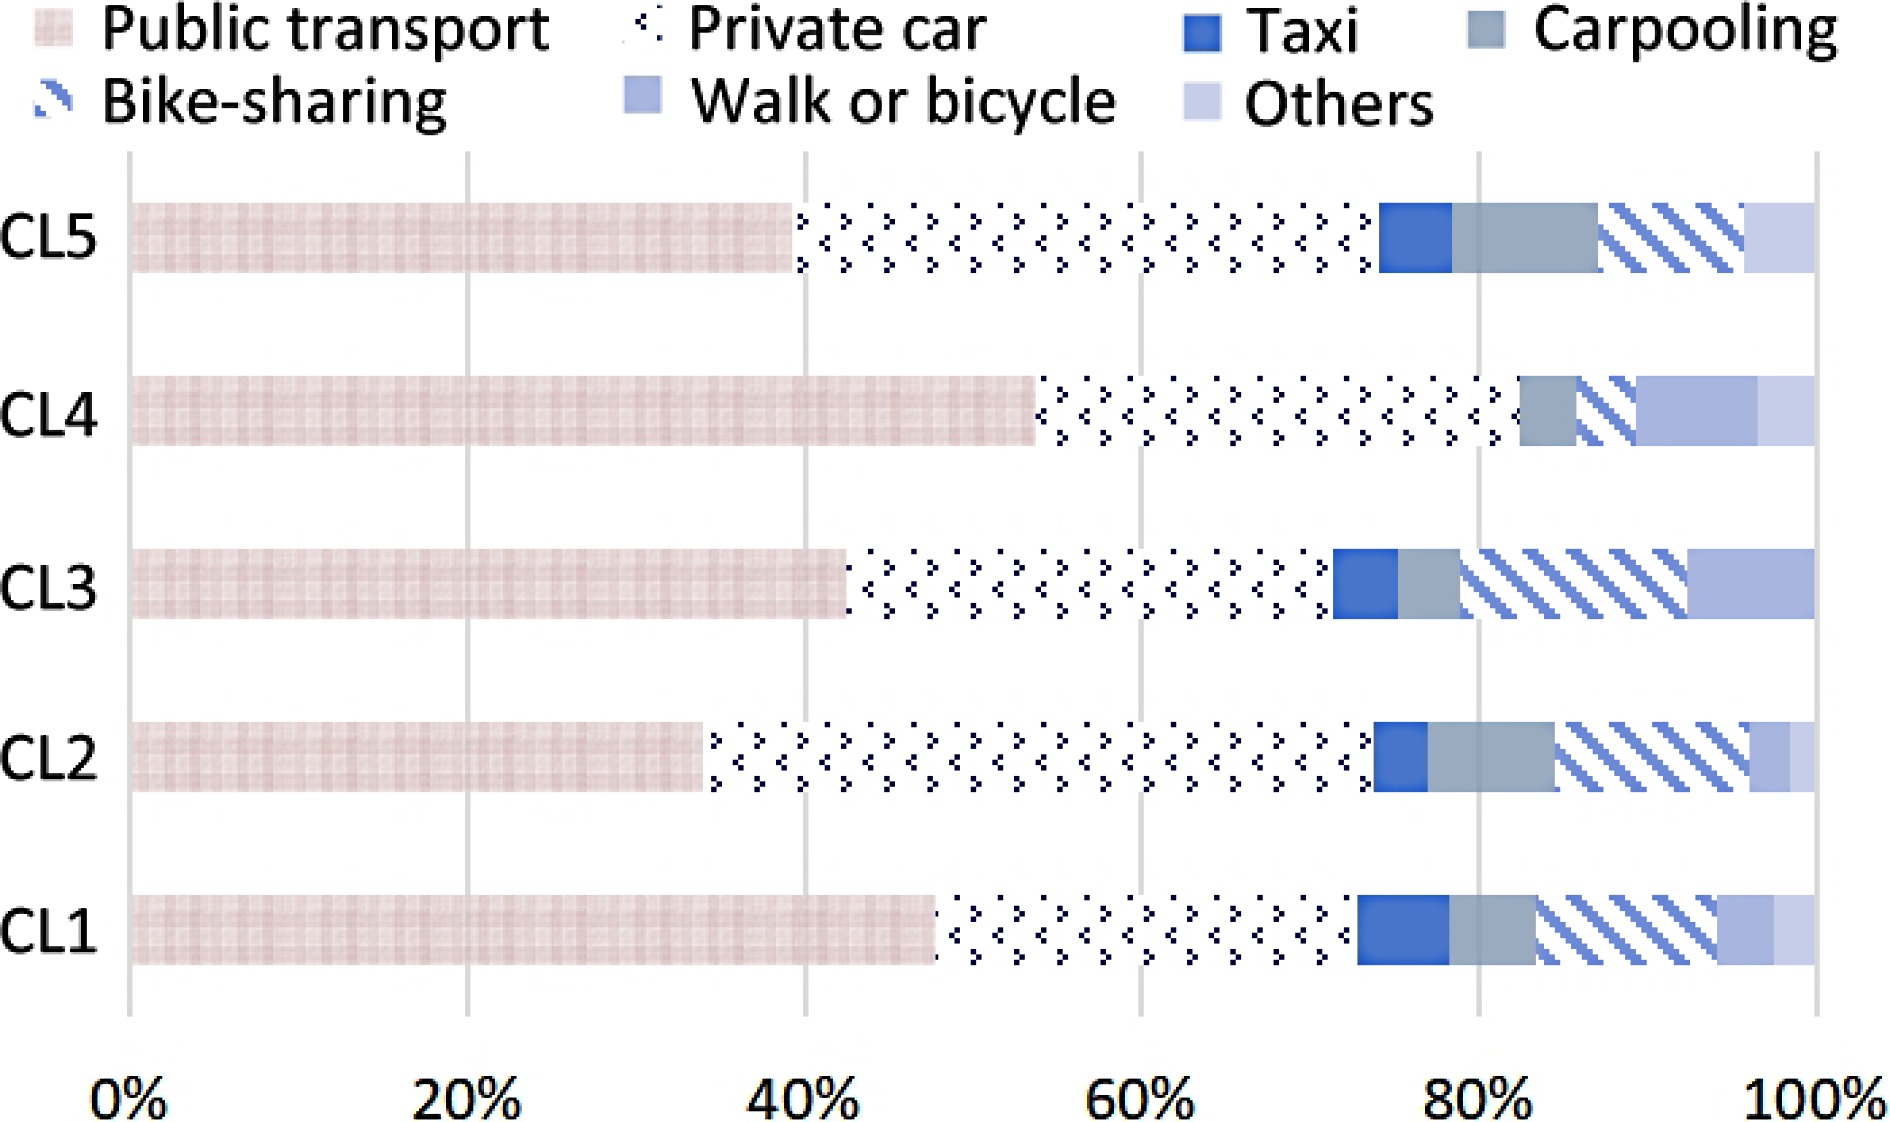
Figure 5.
Travel modes of different latent classes.
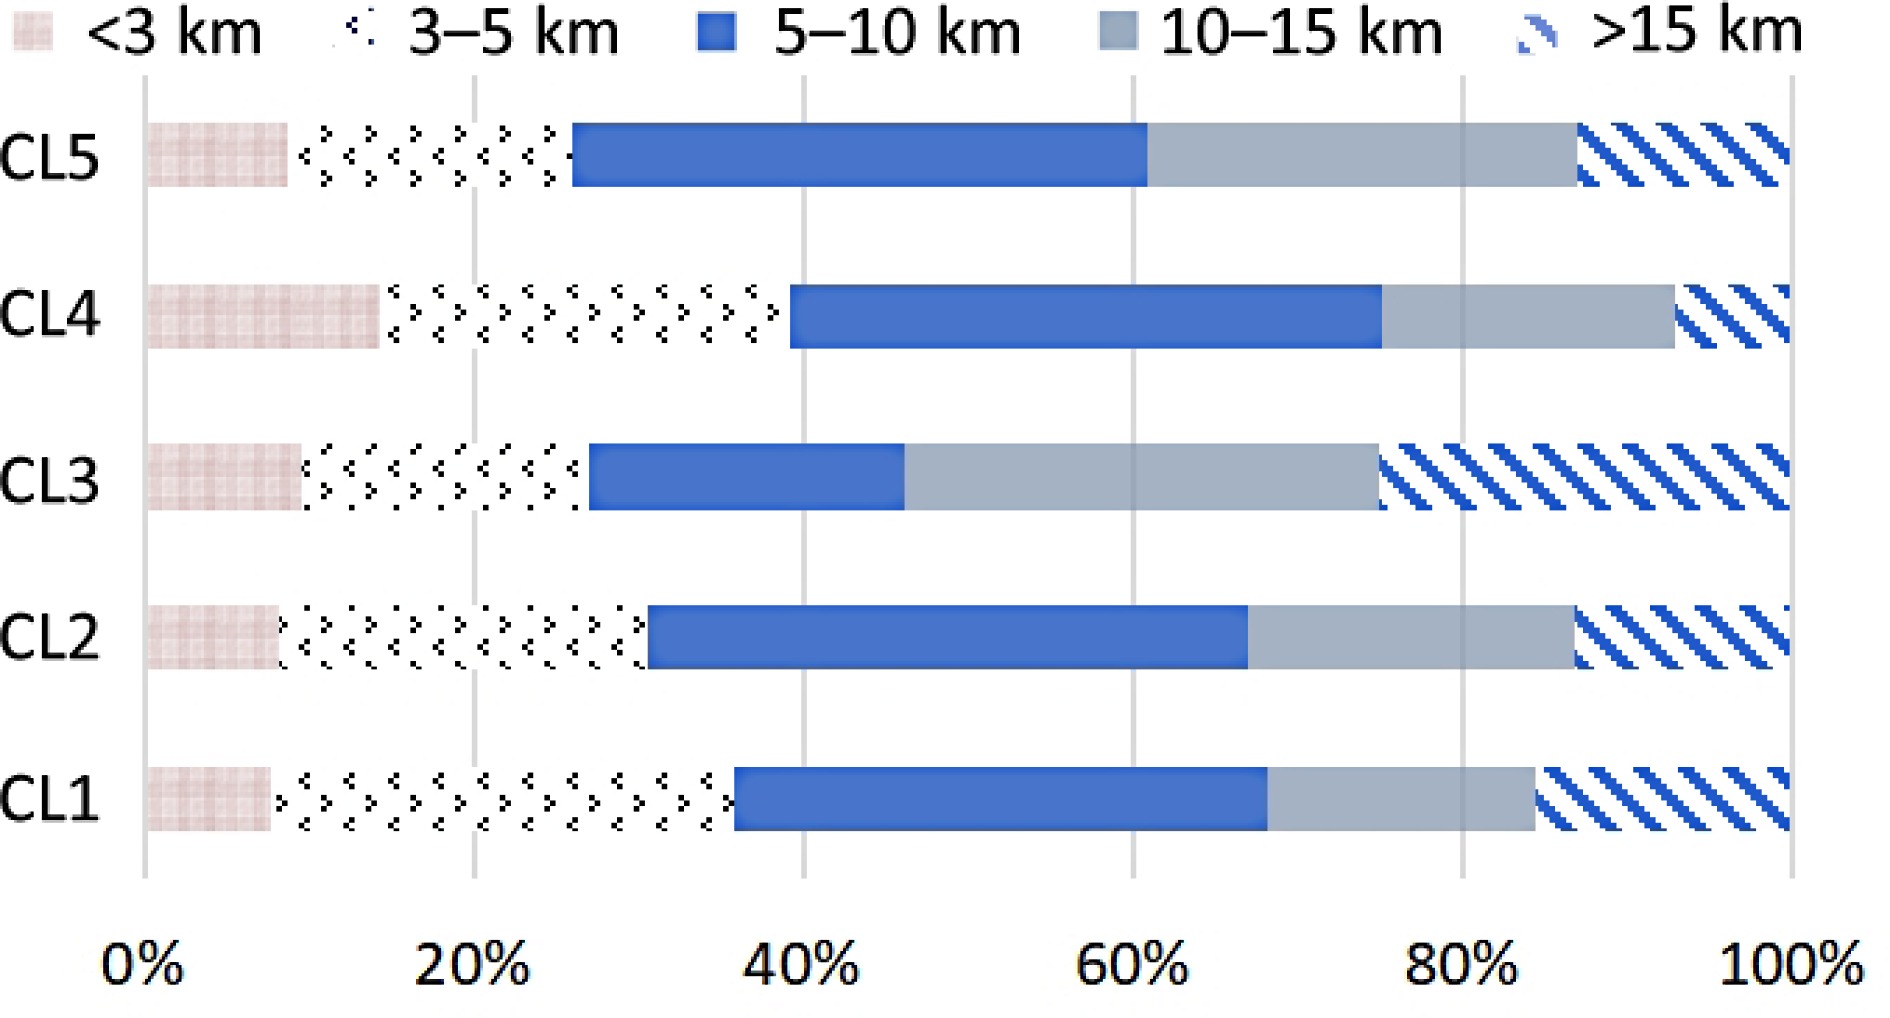
Figure 6.
Travel distance of different latent classes.
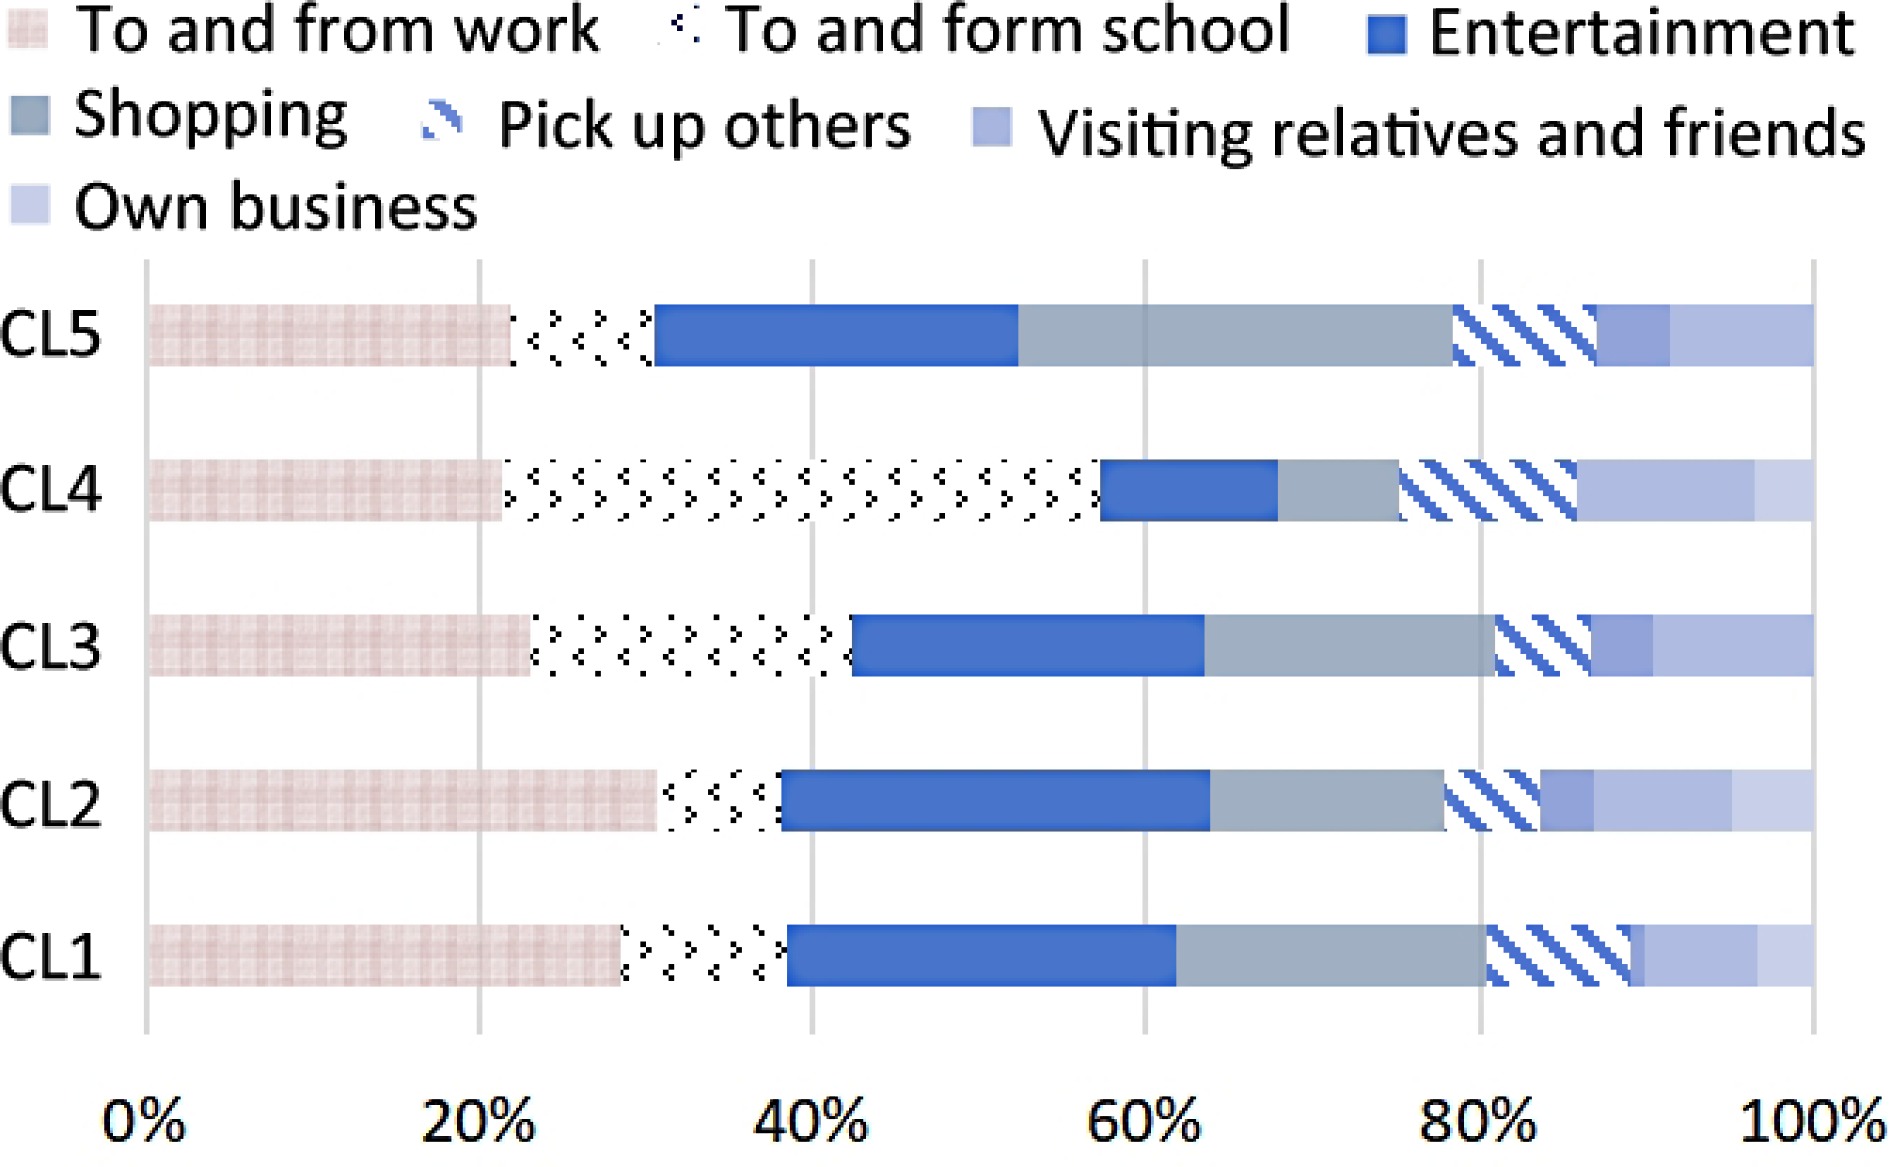
Figure 7.
Travel purposes of different latent classes.
Based on the above analysis, the following names and specific explanations for the five clusters were provided:
Cluster 1 (Actively participating individuals): This cluster represents half of the sample and has values higher than other groups in terms of incentive policies and personal characteristics, indicating the strongest intention to participate in MaaS. In this group, except for non-financial policy and social influence, the average score for all other items is above four points. The average score in attitude to MaaS and behavior to MaaS is 4.16 and 4.33, which is the highest among all groups. So they are referred to as 'MaaS actively participating individuals'. The main age group in this cluster is 25−34 years old (34%) with over one-third of its members still being students. Compared with other clusters, the monthly income distribution of this group is more average, so more users will choose bus transportation (47.7%), most of which are commuting to work (28.4%), followed by leisure and entertainment (23.2%).
Cluster 2 (Mobility neutrals): This second cluster comprises 26.5% of the sample. All the average scores are between 2-3, most of them are near 3. Innovation trait is the highest average score in this group (3.59) and social influence is the lowest. There is not much difference between financial incentive policy (3.24) and non-financial policy (3.27). Compared to Cluster 1, the individuals in Cluster 2 are younger, with over 85% of them having received higher education. Notably, this cluster is the only one among the five clusters with a higher number of male respondents (61.9%) compared to female respondents (38.1%). In terms of travel characteristics, this cluster shows a stronger preference for private cars, with 39.6% of users choosing it as their primary travel mode. The majority of their trips fall within the distance range of 5−10 km (36.3%), and their travel purposes are primarily commuting to work (23%) and going to school (19.2%). Due to their relatively lower willingness to participate in MaaS compared to Cluster 1, they are referred to as 'Mobility neutrals'.
Cluster 3 (Indifferent individuals): This third cluster represents 11.4% of the total sample. Due to their lowest willingness to participate in MaaS among all clusters and relatively low scores on incentive policies, they are considered 'MaaS indifferent individuals'. The average scores are all around 2 and the scores of social influence and attitude to MaaS are below 2. Financial incentive policy (2.13) and habit schema congruence (2.15) and environment traits (2.13) all have low scores compared with other groups. This cluster has the highest proportion of members (53.8%) who travel more than 10 km among the five clusters, but their ownership of private cars is relatively low (71.1%). The majority of members in this cluster have travel purposes related to commuting to work (23%) or going to school (19.2%). In comparison to the first two clusters, this cluster has a higher percentage of members with a high school education or below (26.9%).
Cluster 4 (Public transport supporters): The fourth cluster (6.1%) is named 'Public transport supporters', and their willingness to participate in MaaS is second only to the 'Actively participating individuals' cluster. The average score of this category is mostly higher than that of the first category, except for information policy (1.77), which also brings this groups low attitude to MaaS (3.26). It is important to note that this cluster has lower scores on information incentive policies than any other cluster, which may be attributed to the fact that the majority of this group is aged between 18−24 years (39.2%) and their primary travel purpose is going to school (35.7%). Despite having private car ownership (75%), taking public transportation is still the most preferred mode for this cluster (53.5%). Therefore, information incentives related to parking spaces and similar aspects might not significantly influence this particular group.
Cluster 5 (Diversified travels): The final cluster represents 5.1% of the total sample. Although it has the smallest number of individuals, this cluster stands out for its significant diversity in travel purposes compared to other clusters. In terms of travel characteristics, shopping (26%), participating in entertainment activities (21.7%), and commuting to work (21.7%) are the top three travel purposes for this cluster. Additionally, this cluster has the highest proportion of individuals using carpooling (8.6%) as their preferred mode of travel. Furthermore, their average innovation trait score is the highest among the five clusters, indicating that they are more open to trying new things and are more likely to participate in MaaS travel. Therefore, this cluster is named 'Diversified travels'. This group shows a high interest in the incentive dimension of financial incentive policy (4.67), non-financial incentive policy (4.37), information policy (4.34), innovation traits (4.46), habit schema congruence (4.57) and environment traits (4.46). Despite showing strong interest in both the intention and behavior of participating in MaaS, this cluster scores relatively low in convenience incentives (1.63). This might be because a significant portion of this group consists of middle-aged individuals (65.1%) with diverse travel purposes. Despite having a high level of awareness for MaaS participation, 82.6% of users still own private cars, and 34.7% of them prefer private cars for their travels.
-
Based on different incentive policies, combined with TAM, UTAUT and TRA theory, and comprehensively considering the personal characteristics of users, this paper constructs the MaaS travel intention model under the incentive policy, to reveal the incentive policies that affect users' participation in MaaS, and analyzes the structural equation model. On this basis, the groups are grouped according to the travel characteristics of different users, and the latent category model. The main conclusions are summarized as follows:
The study found that financial incentive policies, information policies and convenience policies have an obvious direct impact on users 'participation in MaaS travel, indicating that the promotion of more users' participation in MaaS is inseparable from the joint efforts of direct financial subsidies and more convenient travel information. Users with innovation and environmental awareness, or travel habits similar to MaaS, are more willing to try to participate in MaaS, while social influence can indirectly affect users' participation behavior through intermediary variables.
As can be seen from the latent category model, different types of users have different preferences for MaaS participation as well as related incentive policies. The 18−34 age group and higher education also showed higher motivation for participating in MaaS, similar to the findings of Narayanan & Antoniou[45]. In addition, among the three categories with the highest participation, female members are higher than male members, so this paper believes that women prefer and participate in MaaS more than men, which may result from the heterogeneity of different gender preferences for MaaS platform design, content services, etc. In addition, those users with longer travel distance and more travel purposes, despite showing interest in MaaS, may still be a hindering factor in actual participation because information policy and facilitation policy have no significant incentive effect on this part of the group.
Therefore, in the future, on the one hand, the travel platform can expand the way of financial incentives, and provide more diverse exchange options for travelers who prefer public transportation. To encourage more potential users to join, the platform suppliers can provide more favorable direct financial relief for users who participate in MaaS travel for the first time, and establish the connection between the platform and travelers. On the other hand, in terms of information policy, the platform can cooperate with the government. In addition to incorporate more travel modes into MaaS, the MaaS travel platform can also be combined with scenic spots, ticketing, parking and even cross-city tourism to create a more comprehensive information platform and provide one-stop information services for travelers[46]. Finally, because the user's personal characteristics are closely related to the participation of MaaS, the government or suppliers need to try to promote the concept and service of MaaS, but also need to explain its green, environmental protection and other characteristics, to stimulate the participation of potential users with environmental awareness and expand the audience range of MaaS services.
It is necessary to note several limitations. Firstly, the development of MaaS, brings new issues and solutions such as platform privacy and security, fairness, and monopolies[47]. These aspects were not considered in this study. Therefore, future research can further investigate the impact of new incentive policies on user participation in MaaS. Secondly, the sample of this study was limited to Beijing, China. Future research can consider larger samples and broader geographical regions, while also accounting for geographical effects. Another limitation of this study is that it only explores users' willingness to participate in MaaS under incentive policies. Although some groups show enthusiasm for MaaS participation, they may not engage in it. Therefore, in the future, it would be beneficial to conduct research and analysis on the actual participation of users under incentive policies.
-
The authors confirm contribution to the paper as follows: study conception and design: Zhang R, Xiao L; data collection: Zhang R, Ouyang L; analysis and interpretation of results: Zhang R, Xiao L; draft manuscript preparation: Zhang R, Ouyang L, Xiao L. All authors reviewed the results and approved the final version of the manuscript.
-
The datasets generated during and/or analyzed during the current study are available from the corresponding author on reasonable request.
This research was sponsored by The National Natural Science Foundation of China (Grant No. 71971020).
-
The authors declare that they have no conflict of interest.
- Copyright: © 2024 by the author(s). Published by Maximum Academic Press, Fayetteville, GA. This article is an open access article distributed under Creative Commons Attribution License (CC BY 4.0), visit https://creativecommons.org/licenses/by/4.0/.
-
About this article
Cite this article
Zhang R, Ouyang L, Xiao L. 2024. Will the perceptions to incentive policies have any effect on users' willingness to participate in Mobility-as-a-Service? Digital Transportation and Safety 3(2): 53−64 doi: 10.48130/dts-0024-0006 

Will the perceptions to incentive policies have any effect on users' willingness to participate in Mobility-as-a-Service?
- Received: 02 February 2024
- Revised: 02 June 2024
- Accepted: 06 June 2024
- Published online: 27 June 2024
Abstract: With the increasing severity of urban traffic congestion and environmental pollution issues, Mobility-as-a-Service (MaaS) has garnered increasing attention as an emerging mode of transportation. Thus, how to motivate users to participate in MaaS has become an important research issue. This study first classified the incentive policies into four aspects: financial incentive policy, non-financial incentive policy, information policy, and convenience policy. Then, through online questionnaires and field interviews, 456 sets of data were collected in Beijing, and the data were analyzed by the structural equation model and latent class model. The results show that the four incentive policies are positively correlated with users' participation in MaaS, among which financial incentive policy and information policy have the greatest impact, that is, they can better encourage users by increasing direct financial subsidies and broadening the information about MaaS. In addition, Latent Class Analysis was performed to class different users and it was found that the personal characteristics of users had some influence on willingness to participate in MaaS. Therefore, incentive policies should be designed to consider the needs and characteristics of different user groups to improve their willingness to participate in MaaS. The results can provide theoretical suggestions for the government to promote the widespread application of MaaS in urban transportation.
-
Key words:
- Mobility-as-a-Service /
- Incentive policies /
- Personal traits /
- Latent class analysis