-
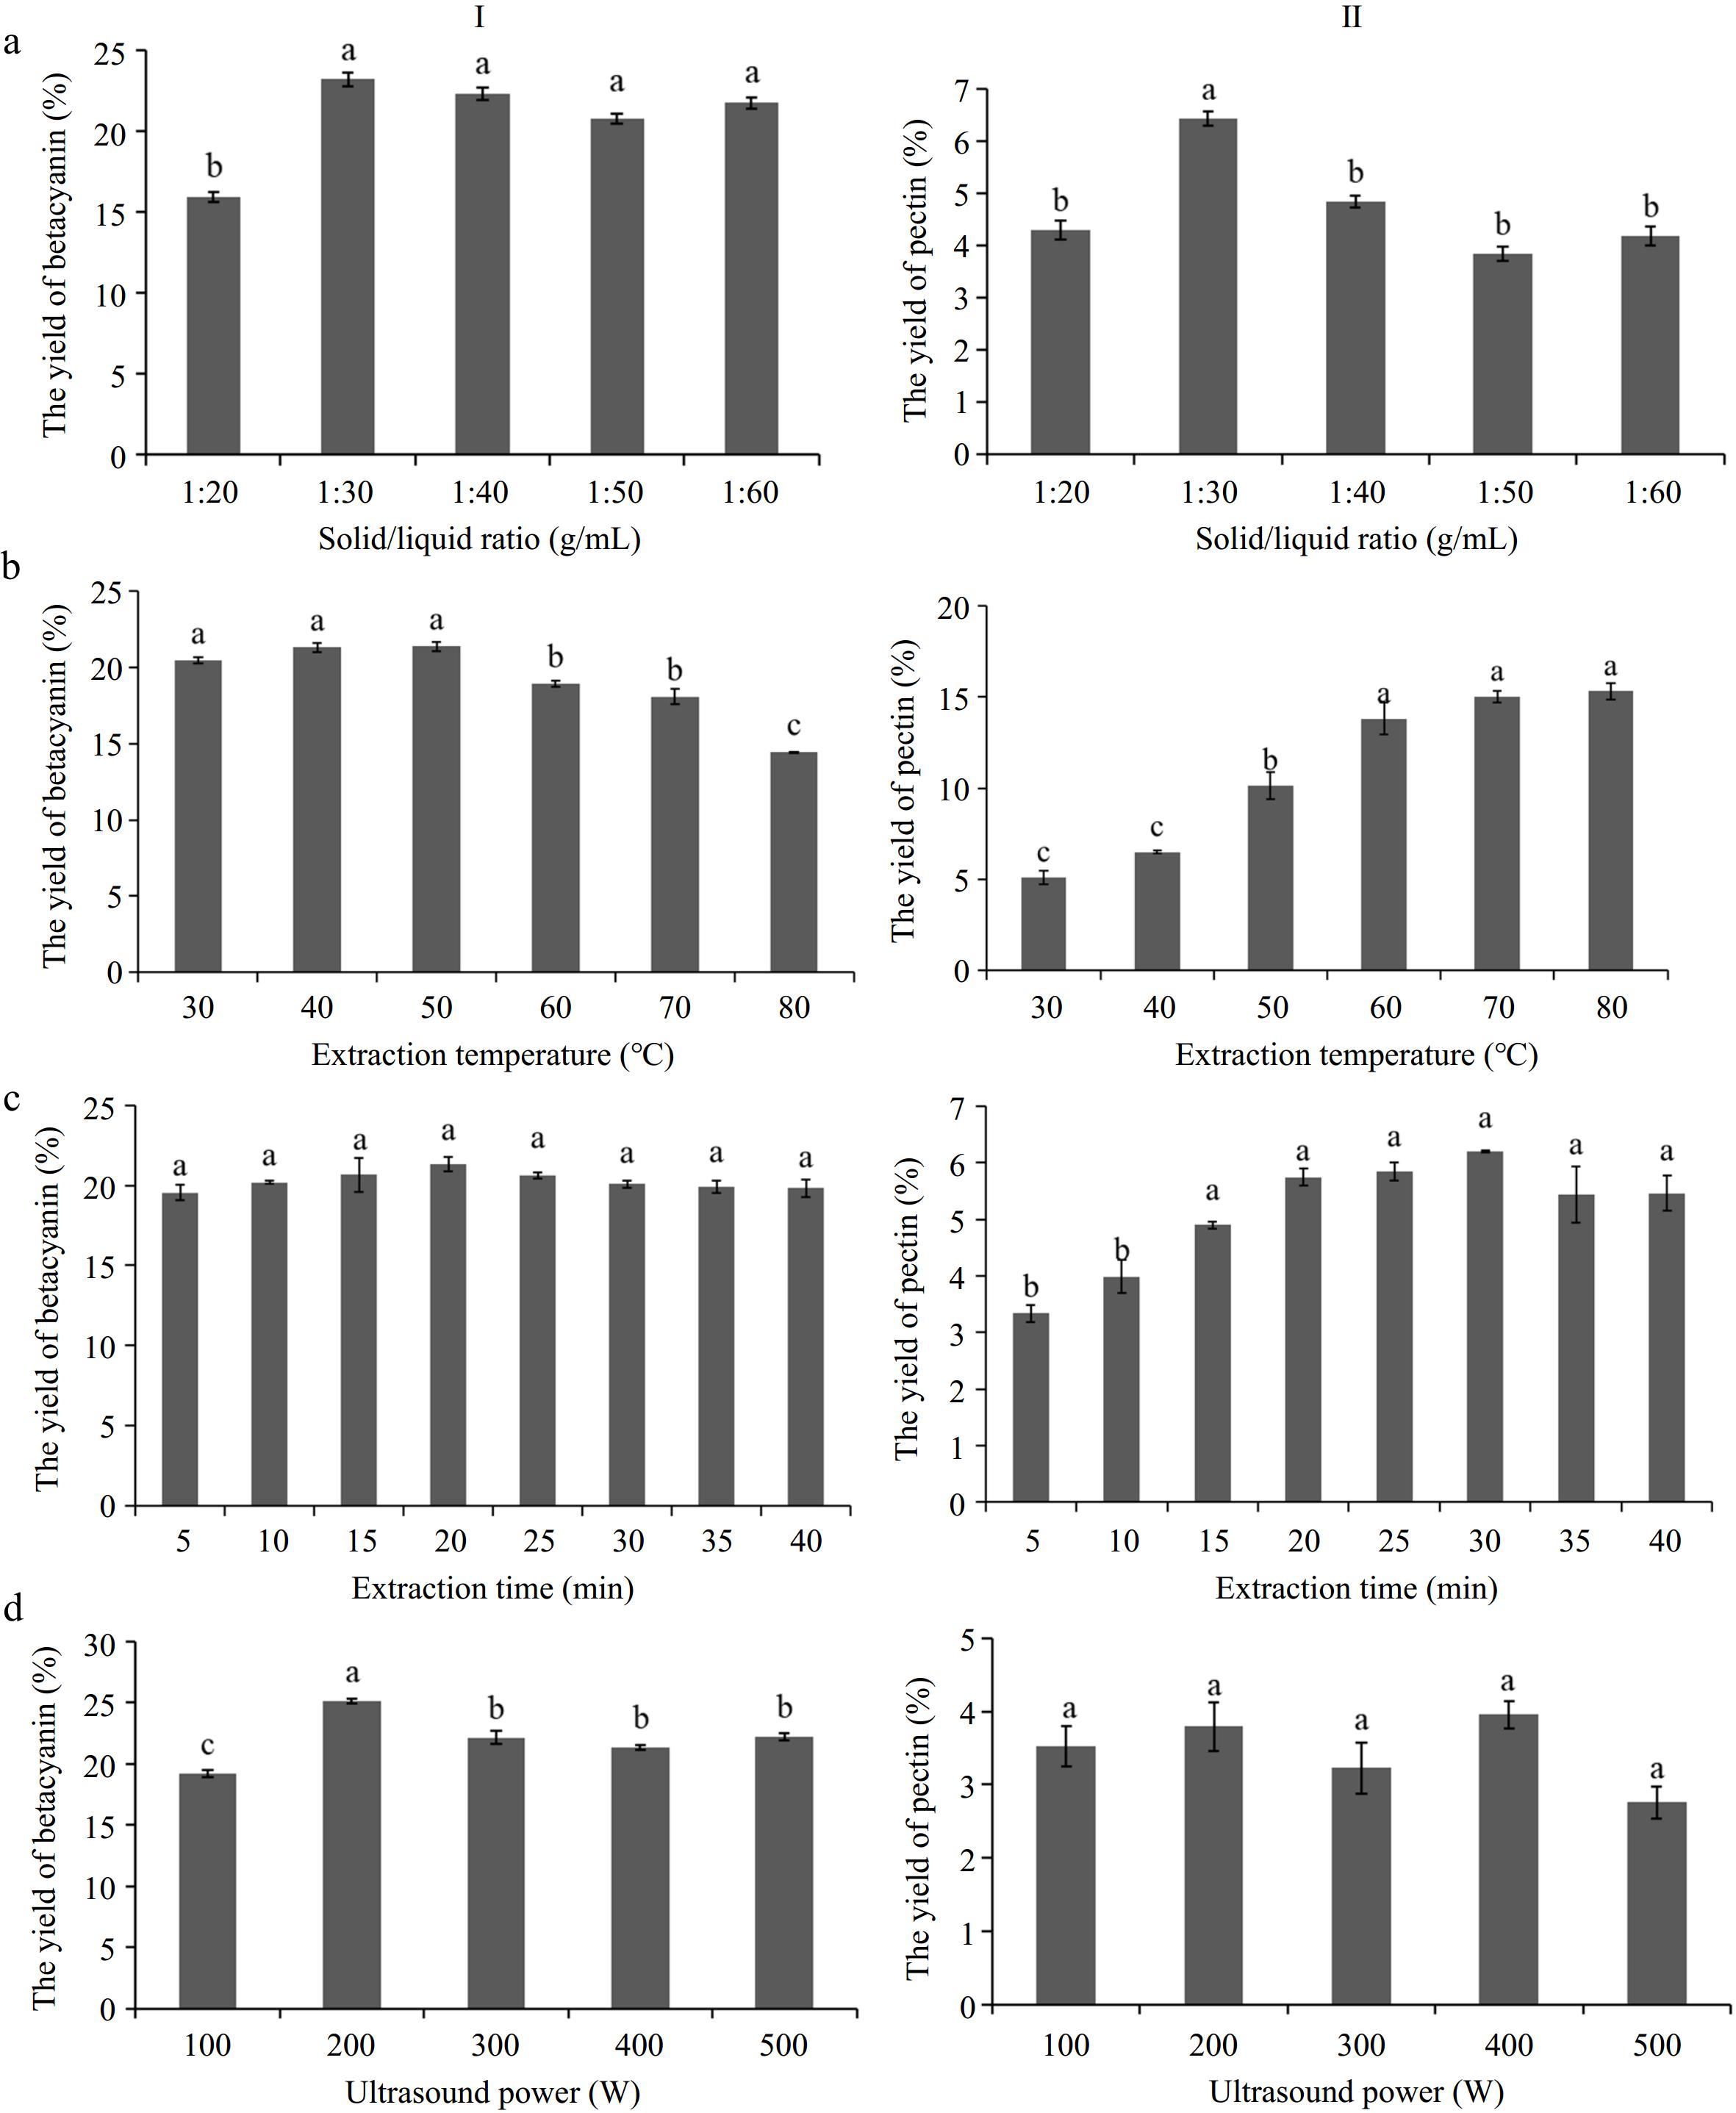
Figure 1.
Effect of (a) solid/liquid ratio, (b) extraction temperature, (c) extraction time and (d) ultrasound power on yields of betacyanin (I) and pectin (II). Those marked with different lower-case letters among fractions are significantly different (p < 0.05) according to Duncan's multiple range test.
-
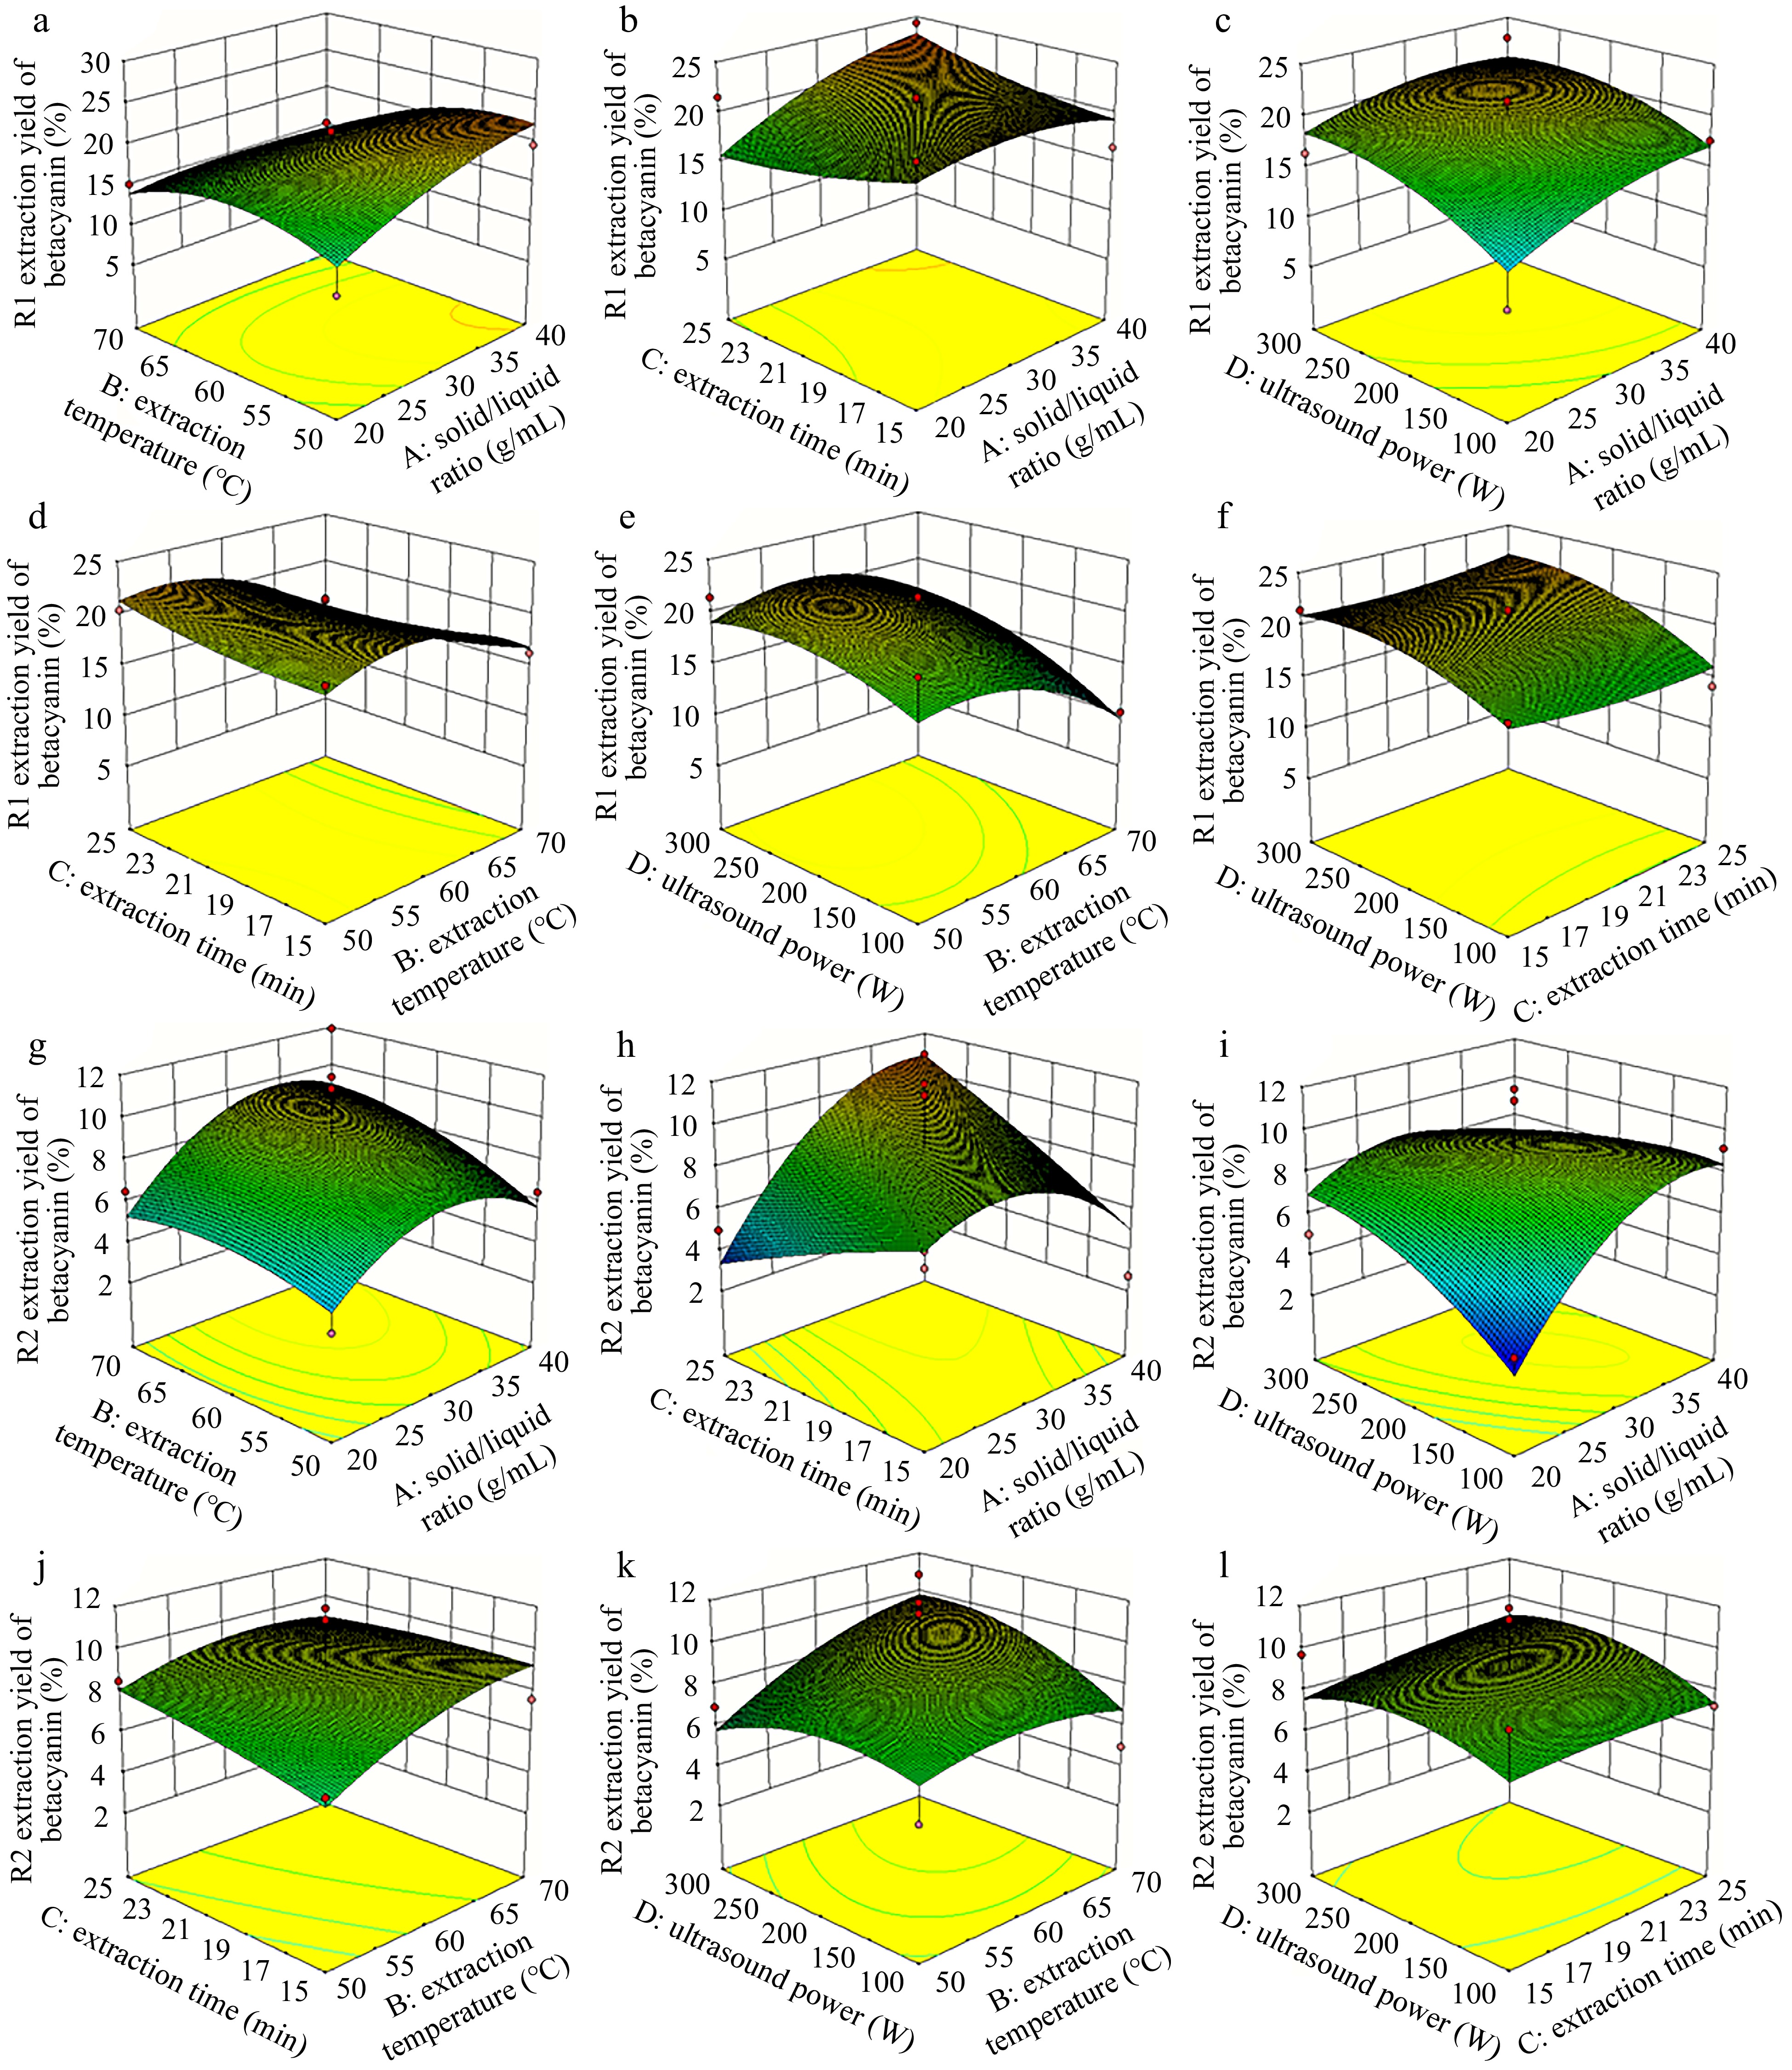
Figure 2.
Response surface diagrams showing effects of independent variables (A: solid/liquid ratio, B: extraction temperature, C: extraction time and D: ultrasound power) on (a)−(f) the yield of pectin from pitaya fruit peel.
-

Figure 3.
Fourier-transform infrared spectrum of pectin from pitaya fruit peel.
-
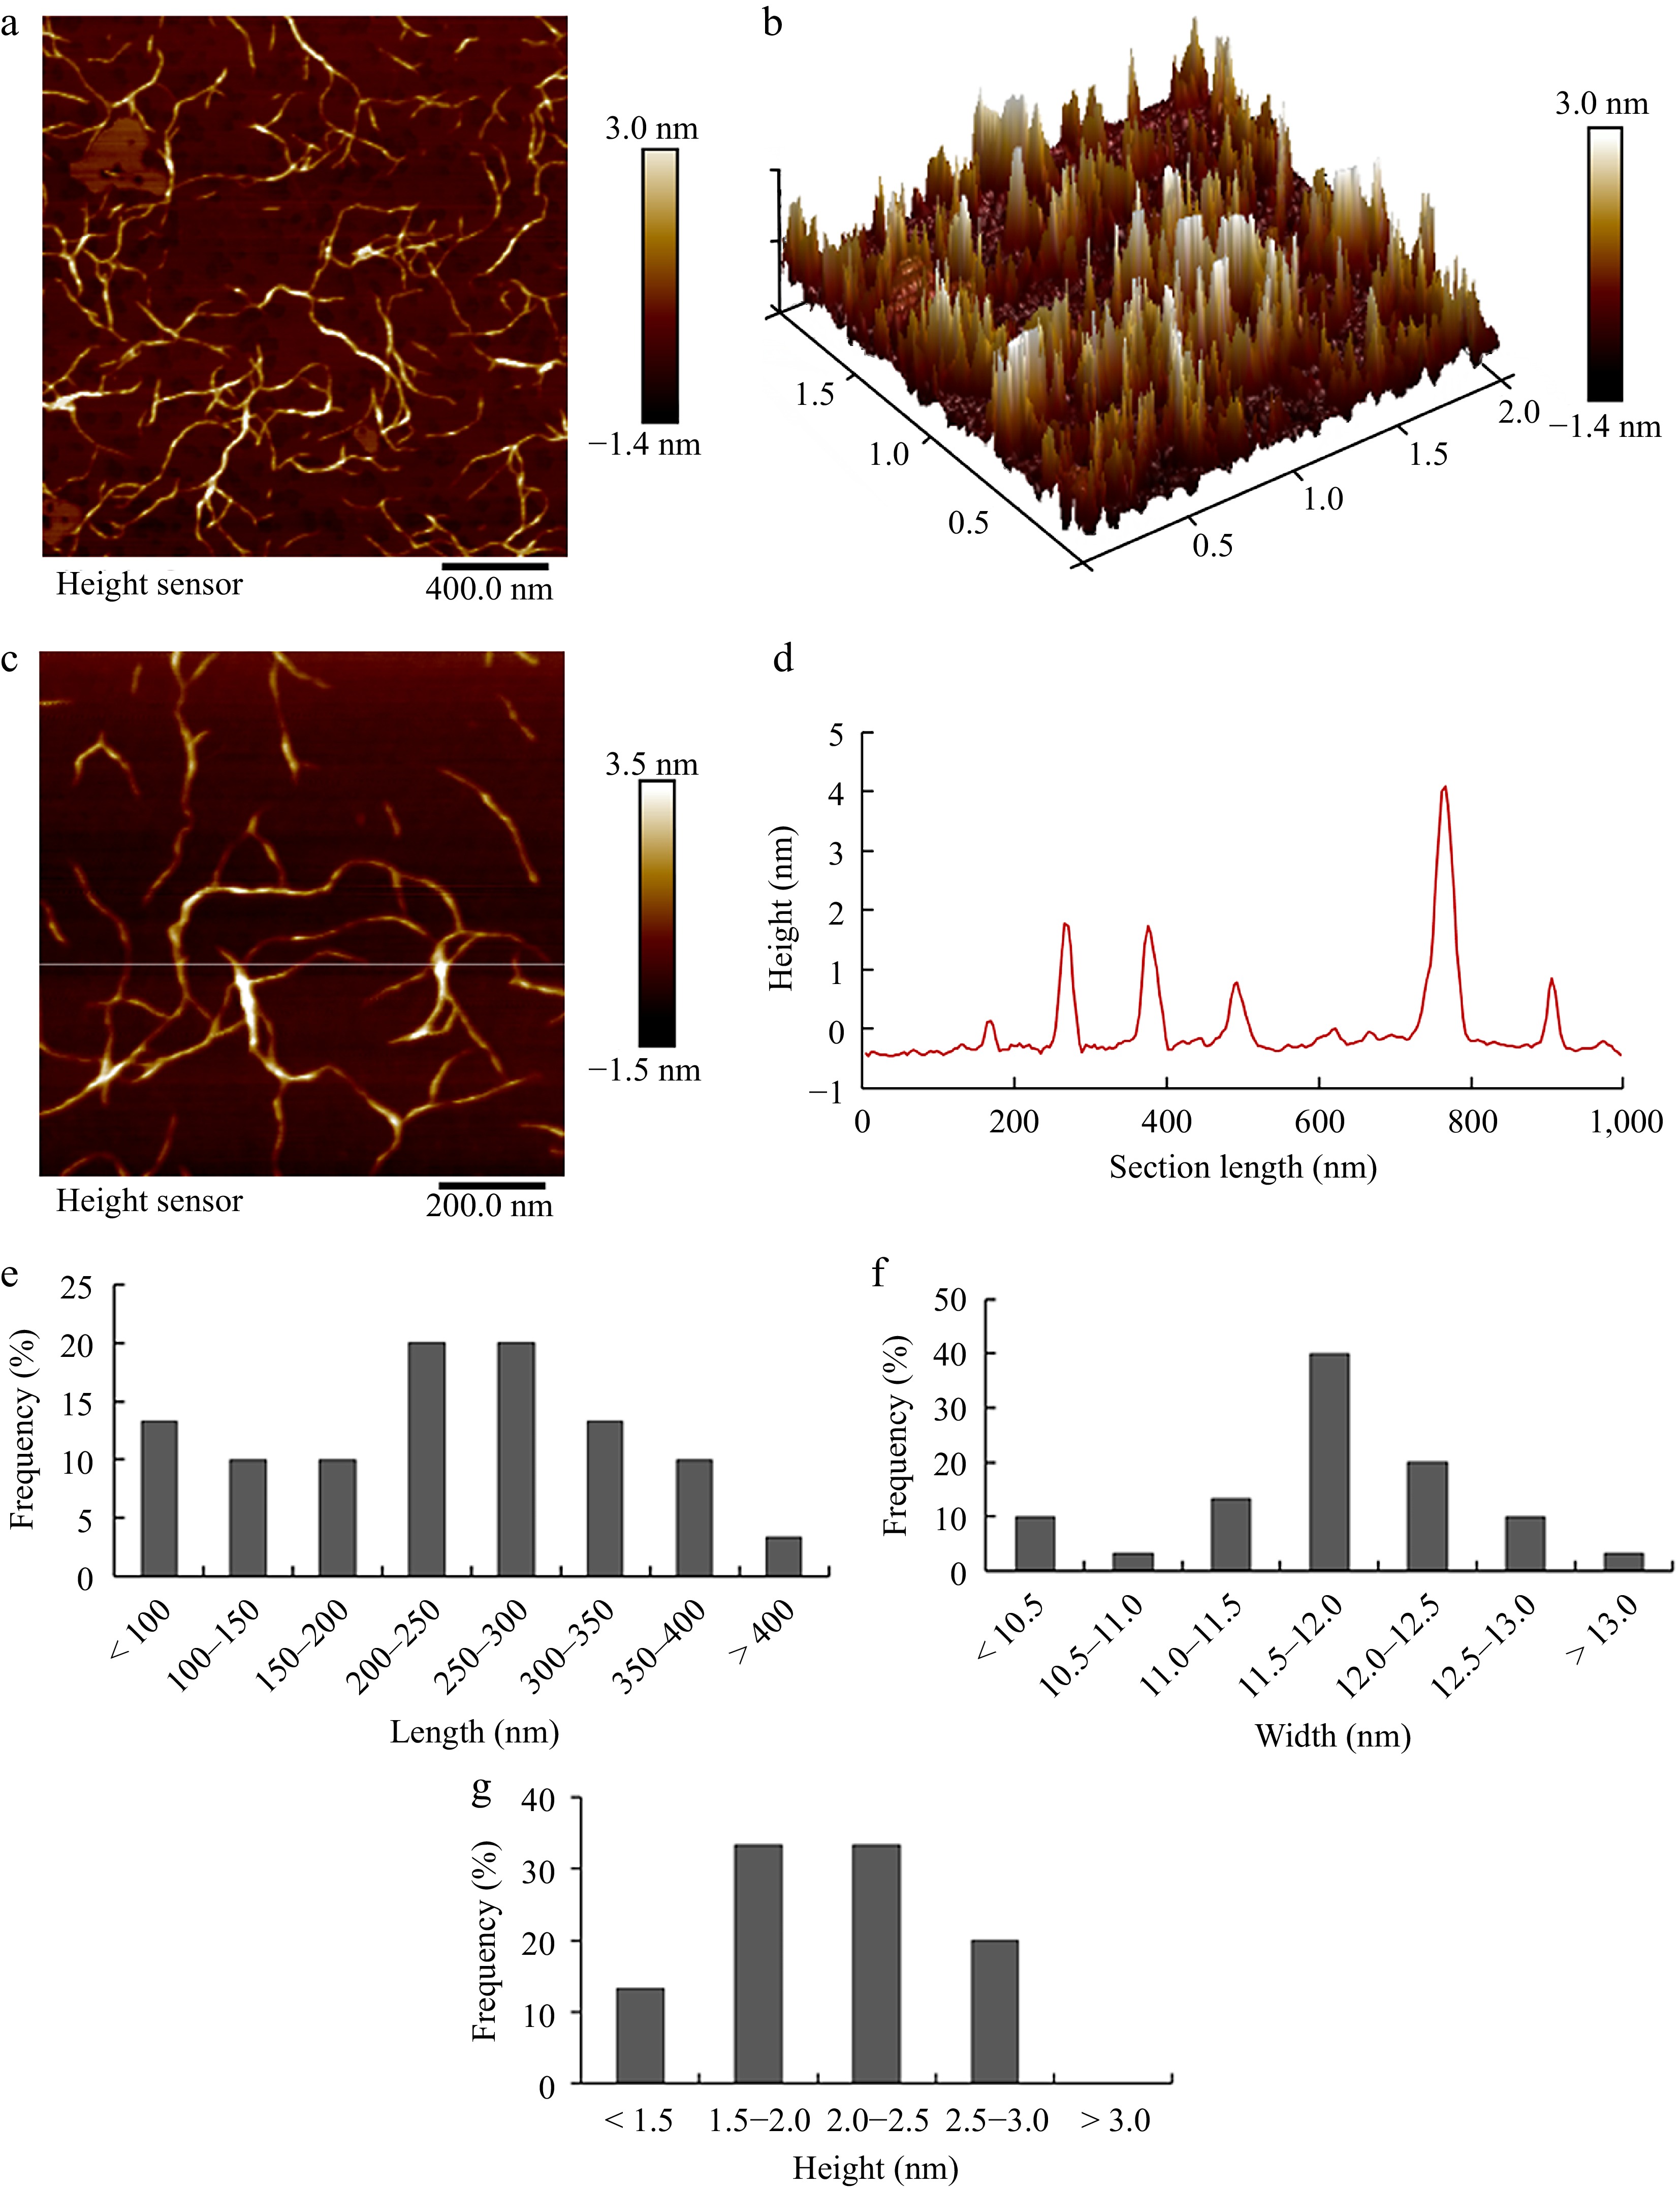
Figure 4.
AFM images of pectin from pitaya peel. (a) 2D and (b) 3D AFM images with image size of 2 μm × 2 μm. (c) 2D AFM images with image size of 1 μm × 1 μm. (d) Height profile of the cross-section highlighted in the image C. The frequency histograms of (e) length, (f) width and (g) height of single chains in pectin, respectively. The height and width of single chain were measured using section analysis of the NanoScope Analysis software 1.90 (Bruker Co., Karlsruhe, Germany). The length of single chain was measured using perimeter tools of Adobe Acrobat 9 Pro software (Adobe Inc., San Jose, CA, USA).
-
Run Factor 1 Factor 2 Factor 3 Factor 4 Response A (g·mL−1) B (°C) C (min) D (W) R (%) 1 1:30 50 20 100 5.04 2 1:20 70 20 200 6.48 3 1:20 50 20 200 3.64 4 1:20 60 25 200 4.96 5 1:30 50 25 200 8.47 6 1:30 60 20 200 3.93 7 1:40 60 15 200 2.71 8 1:30 70 20 300 10.84 9 1:30 60 20 200 11.35 10 1:30 50 15 200 6.53 11 1:30 60 25 100 7.24 12 1:20 60 15 200 6.84 13 1:40 50 20 200 6.44 14 1:20 60 20 300 5.00 15 1:30 60 15 300 9.70 16 1:30 60 25 300 8.73 17 1:20 60 20 100 3.13 18 1:30 60 20 200 6.57 19 1:30 70 20 100 4.94 20 1:40 70 20 200 11.90 21 1:30 70 25 200 7.35 22 1:30 60 20 200 11.36 23 1:40 60 25 200 10.90 24 1:30 70 15 200 7.59 25 1:40 60 20 300 3.83 26 1:40 60 20 100 9.12 27 1:30 60 15 100 9.42 28 1:30 60 20 200 11.88 29 1:30 50 20 300 6.89 A: Solid/liquid ratio; B: Extraction temperature; C: Extraction time; D: Ultrasound power; R: The yield of pectin. Table 1.
Experimental design and results of yields of crude betacyanin and pectin.
-
Source Sum of
squaresDF Mean
squareF-value P-value
Prob > FModel 114.2 14 8.16 1.11 0.4245 A 18.38 1 18.38 2.5 0.1362 B 12.18 1 12.18 1.66 0.219 C 1.97 1 1.97 0.27 0.613 D 3.1 1 3.1 0.42 0.5266 AB 1.72 1 1.72 0.23 0.6365 AC 25.35 1 25.35 3.45 0.0845 AD 12.82 1 12.82 1.74 0.208 BC 1.19 1 1.19 0.16 0.6938 BD 4.1 1 4.1 0.56 0.4676 CD 0.37 1 0.37 0.05 0.8267 A2 29.35 1 29.35 3.99 0.0655 B2 3.48 1 3.48 0.47 0.5028 C2 0.24 1 0.24 0.032 0.8601 D2 6.63 1 6.63 0.9 0.3584 Residual 102.95 14 7.35 Lack of Fit 51.96 10 5.2 0.41 0.8862 Pure Error 50.99 4 12.75 Cor Total 217.16 28 A: Solid/liquid ratio; B: Extraction temperature; C: Extraction time; D: Ultrasound power; DF: Degree of freedom. The analysis of variance (ANOVA) for response surface quadratic model was obtained by Design-Expert software 10.0.4 (Stat Ease Inc., Minneapolis, USA). Table 2.
The analysis of variance (ANOVA) for response surface quadratic model.
-
Items Content Proximate composition (w, %) Moisture 7.68 ± 0.02 Protein 6.03 ± 0.03 DMA (%) NDB Molecular characteristics MwC (kDa) 33.52 ± 0.43 MnD (kDa) 22.55 ± 0.23 Polydispersity Index 1.49 ± 0.02 Monosaccharides composition (mol%) Galacturonic acid 48.35 ± 1.74 Rhamnose 30.04 ± 1.10 Galactose 11.05 ± 0.37 Arabinose 6.25 ± 0.29 Glucose 1.42 ± 0.26 Glucuronic acid 1.21 ± 0.11 Xylose 0.87 ± 0.31 Mannose 0.53 ± 0.11 Fucose 0.17 ± 0.03 Molar ratios of monosaccharides GalA/(Fuc+Rha+GlcA+Ara+Gal+Xyl)E 0.98 ± 0.08 Rha/GalAF 0.62 ± 0.05 (Gal+Ara)/RhaG 0.58 ± 0.01 A DM: degree of methylesterification; B ND: not detected; C Mw: weight-average molecular weight; D Mn: number-average molecular weight. E GalA / (Fuc + Rha + GlcA + Ara + Gal + Xyl): the linearity of pectin; F Rha/GalA: the contribution of RG to pectin population; G (Gal+Ara)/Rha: the branching extent of the RG-I domain. Values represent means ± standard derivatives of three replicates. Table 3.
Physico-chemical properties of pectin.
-
Items Values Crystal plane distance (Å) 4.77 ± 0.001 FWHM (°) 0.61 ± 0.008 Crystallite size (Å) 134 ± 1.42 Crystalline index (%) 0.60 ± 0.007 FWHM: the full width at half maximum. Values represent means ± standard derivatives of three replicates. Table 4.
The XRD parameters for pectin.
Figures
(4)
Tables
(4)