


-
Pitaya, which originated in Mexico and Central America, is also known as 'dragon fruit' and belonged to the genus Hylocereus or Seleniereus (Cactaceae) under Caryophyllales[1]. Nowadays, pitaya is one of the most favorite fruits for consumers and has been extensively cultivated in the tropic and sub-tropic areas of the world[2]. Pitayas with edible fruit can be classified into three main categories based on the fruit color, including yellow pitaya with white pulp (Selenicereus megalanthus), pitaya with red-purple peel and pulp (Hylocereus polyrhzius), and red-purple pitaya with white pulp (Hylocereus undatus)[1,3]. The typical tissue structure of a red pitaya is composed of a thick peel that originated from the receptacle and pericarp with large green or red scales. The edible pulp that developed from the placenta scattered with numerous small soft seeds, varying from different colors from red or purple to white. While the pulp of pitaya is highly valued with nutrients in consumption, the peel, which accounts for approximately 18%−24 % (w/w) of the whole fruit, is unsuitable for eating or processing[4]. While for these reasons consumers often discard the pitaya fruit peel, researchers have focused on the comprehensive utilization of pitaya peel because of its attribution to the richness of nutritional compounds. For instance, numerous studies investigated the bioactive functions of the biomass extracted from pitaya fruit peel[5−7], basically polysaccharides and pigments[8], and insights into developing sustainable and greener technologies aroused many interests[5].
The red pigment in pitaya peel is mainly betacyanin[9]. Previous studies have suggested that the peel of pitaya is a highly valuable resource for the purpose of the preparation of betacyanin and pectin[5,10], which are two important auxiliary materials or additives widely applied in many industrial fields, such as food processing, cosmetics, textiles, medicines and healthcare[8,9]. Betacyanin, the most frequently investigated betalain pigment showing red-violet in various flowers and fruits, is comparatively stable, water-soluble, and has good coloring ability, which means it replaces chemically synthetic colorants in application[11]. Besides, betacyanin has currently attracted attention due to its antioxidant activity with a protective effect in reducing oxidative stress and other health-promoting effects including antimicrobial, anticancer and anti-lipidemic[11]. Betacyanin is currently extracted from red beetroot[12], red amaranth[13] and pitaya[9], using solvents including ethanol[5], methanol[14], acetone[15], or deionized water[16].
Pectin is a heteropolysaccharide that primarily consists of homogalacturonan (HG), rhamnogalacturonan I (RG-I), and rhamnogalacturonan II (RG-II)[17]. HG, the major structural polymer of pectin, is a linear chain of D-galacturonic acid (GalA) residues linked via α-1,4 glycoside bonds, in which part of the carboxyl groups is methylated or acetylated[18]. RG-I consists of approximately 100−300 repeating disaccharide units ([→4-α-D-GalpA-(1→2)-α-L-Rhap-(1→]) served as the backbone, where some of the rhamnosyl residues may be substituted at O-4 with sugar side chains like galactan, arabinan, or arabinogalactan. The RG-II domain contains the backbone of more than seven α-(1,4)-linked GalA, attached with 4−5 pre-fixed side chains rich in rhamnose, galactose, xylose, fucose, apiose, and other species of neutral sugars[17]. The composition of neutral sugars and structural characteristics of pectic polysaccharides possessing different HG, RG-I, and RG-II domains are closely related to the physical and chemical properties. The decrease in HG content often corresponds to an increase in RG content, while pectin with more RG-I domains often has higher molecular weight and more flexible helix conformation, which endows excellent emulsification and gelling properties as well as greater bioactivities on antioxidant, prebiotic, hypolipidemic, and anti-inflammatory properties[19,20]. The characteristics of pectin are also greatly affected by the raw materials and extraction methods. The pectic substances are usually extracted from plant materials with water and then precipitated with ethanol[21,22]. Conventional pectin extraction that is based on hot water consumes a prolonged extraction time and might cause thermal degradation of the pectin and results in a decrease in polymerization degree. Therefore, lots of chemical products such as diluted hydrochloric, sulfuric and nitric acids, citric acid or ammonium oxalate/oxalic acid are integrated to reduce extraction time and promote the quality of pectin[23]. Novel methods including enzyme, microwave, and ultrasonic-assisted as well as subcritical water extraction have also been applied[24]. Ultrasonic-assisted extraction utilises sound waves to generate cavitation bubbles, which enables easier entry of the solvent into the cell, and is not only effective in achieving high yields in a short time, but also environmentally friendly. Previous studies have demonstrated that pitaya peel would potentially be an alternative source for pectin extraction to meet the huge market need[22,25].
Recently, non-methylesterified pectin or low-methylesterified pectin has increasingly attracted much attention in the food industry, health care, and pharmacy[24,26]. Such pectin can form the gel in the presence of Ca2+ but not affected by sugar content[27], and can form a delivery system with various applications. For instance, encapsulating probiotics that have good compatibility with yogurt[28], showing high lipid antioxidant capacity in emulsions[29] and preparing complex coacervates to encapsulate vitamin E[30]. However, less is available on the preparation of non-methylesterified pectin from natural materials, and fewer studies have systematically elucidated the structure of such pectin.
Accordingly, an extraction was developed to obtain non-methylesterified pectin from the residue of pitaya fruit peel after extraction of red pigments, which effectively utilized the pitaya peel waste. Ultrasonic-assisted acid extraction by single-factor test and response surface design analysis were employed to optimize the extraction conditions for pectin from pitaya peel residue. The physicochemical properties and nanostructure of pectin extracted under optimal conditions require further investigation to understand the characteristics of the pectin prepared from pitaya peel. The results would provide a time-saving and eco-friendly procedure for the effective extraction preparation of non-methylesterified pectin from red pitaya peel residue.
-
Monosaccharides standards, glucan, sodium hydroxide, sodium acetate, trifluoroacetic acid, and methanol, used in chromatography, were all chromatographic grade and purchased from Sigma-Aldrich (Shanghai, China). Potassium bromide was spectral grade, bovine serum albumin, Coomassie Brilliant Blue G-250 and betacyanin standard were guarantee reagents, and other chemical reagents including carbazole, ethanol, hydrochloric acid, and concentrated sulfuric acid were of analytical grade and purchased from Beijing Chemical Reagent Company (Beijing, China).
Fruit materials
-
Fresh red pitaya fruit (Hylocereus undatus) was obtained from a market in Beijing, China. The fruit peel was separated and cut into small pieces. Then the pieces were dried at 50 °C for 16 h after heated at 110 °C for 10 min to inactivate enzymes. The dried pieces were ground into powder and the powder was passed through a 60-mesh sieve, sealed, and stored in desiccators until use.
Extraction of pectin
-
The extraction of pectin was carried out according to the method of Shivamathi et al.[20] and Wang et al.[21] with some modifications. The ultrasound-assisted extraction was performed with distilled water acidified to pH 3.5 with hydrochloric acid. Pitaya peel powder was mixed with the extraction solvent before being heated and ultrasonically treated in an ultrasonic apparatus (KQ5200DE, Kunshan Ultrasonic Instrument Co., Ltd, Jiangsu Province, China). After extraction, the mixture was filtered under vacuum (−0.04 MPa). 5-fold of 95% ethanol was then added into the filtrate to precipitate and decolorize the coagulated pectin. The precipitated sample was filtered under vacuum (−0.04 MPa) before being washed three times with 90% acetone. The residue was then frozen at −4 °C, and dried in a vacuum freeze dryer (LGJ-10B, Sihuan Scientific Instrument Factory Co., Ltd, Beijing, China) for 24 h to obtain crude pectin (Supplemental Fig. S1).
Optimization of extraction of the pectin
Single-factor experiment
-
Factors including the solid/liquid ratio of the pitaya peel powder to the solvent at 1:20, 1:30, 1:40, 1:50, and 1:60 (g·mL−1), extraction temperature at 30, 40, 50, 60, 70, and 80 °C, extraction time for 5, 10, 15, 20, 25, 30, 35, and 40 min, ultrasound power of 100, 200, 300, 400, and 500 W were chosen as independent variables in the extraction of pectin according to the method described above in extraction of pectin section.
Experimental design for RSM and data analysis
-
Ultrasonic-assisted acid extraction of pectin from pitaya peel was optimized using response surface methodology (RSM) and Box-Behnken design (BBD). With the extraction yield of pectin (R) served as the response, a BBD with four independent variables including solid/liquid ratio (A), extraction temperature (B), extraction time (C), and ultrasound power (D) at three levels obtained from the single-factor experiment was carried out. The whole design consisted of 29 experimental points and the extraction of pectin was conducted according to the method described in Table 1. The experimental design and data analysis were performed using Design-Expert software 10.0.4 (Stat Ease Inc., Minneapolis, USA).
Table 1. Experimental design and results of yields of crude betacyanin and pectin.
Run Factor 1 Factor 2 Factor 3 Factor 4 Response A (g·mL−1) B (°C) C (min) D (W) R (%) 1 1:30 50 20 100 5.04 2 1:20 70 20 200 6.48 3 1:20 50 20 200 3.64 4 1:20 60 25 200 4.96 5 1:30 50 25 200 8.47 6 1:30 60 20 200 3.93 7 1:40 60 15 200 2.71 8 1:30 70 20 300 10.84 9 1:30 60 20 200 11.35 10 1:30 50 15 200 6.53 11 1:30 60 25 100 7.24 12 1:20 60 15 200 6.84 13 1:40 50 20 200 6.44 14 1:20 60 20 300 5.00 15 1:30 60 15 300 9.70 16 1:30 60 25 300 8.73 17 1:20 60 20 100 3.13 18 1:30 60 20 200 6.57 19 1:30 70 20 100 4.94 20 1:40 70 20 200 11.90 21 1:30 70 25 200 7.35 22 1:30 60 20 200 11.36 23 1:40 60 25 200 10.90 24 1:30 70 15 200 7.59 25 1:40 60 20 300 3.83 26 1:40 60 20 100 9.12 27 1:30 60 15 100 9.42 28 1:30 60 20 200 11.88 29 1:30 50 20 300 6.89 A: Solid/liquid ratio; B: Extraction temperature; C: Extraction time; D: Ultrasound power; R: The yield of pectin. The quadratic polynomial model[31] is provided in the Supplementary information (Equation A.1). Validation was further performed under the optimum extraction conditions obtained by RSM analysis. The pectin extracted from pitaya peel powder under the optimum conditions was used for physicochemical measurement.
Measurement of pectin yield
-
Pectin content was determined by carbazole sulfate colorimetry[32] according to its absorbance value at a wavelength of 530 nm.
$ The\;yield\;of\;pectin\;\left(\text{%}\right)=\dfrac{{C}\times{V}\times {N}}{{W}\times{10^6}}\times\text{100}\text{%} $ (1) Where, C is the galacturonic acid concentration (μg·mL−1) according to the standard curve; V is the volume (mL) of extracted solution; N is the times of volume dilution; and W is the mass (g) of pitaya peel powder.
Proximate composition and degree of methylesterification (DM) of pectin
-
Determination of moisture content was carried out by direct drying method until the weight of pectin was constant and was presented on a dry basis. The protein content was analyzed by the Bradford method using Bovine serum albumin (BSA) as the standard[33]. The DM was analyzed according to the method of Jafari et al.[34].
Monosaccharide composition of pectin
-
Ten mg prepared pectin was hydrolyzed with 4 mL of 4 mol·L−1 trifluoroacetic acid at 120 °C for 2 h and dried by nitrogen blowing. The remaining material was dissolved to 10 mL with ultrapure water and passed through a 0.22-μm membrane before analysis. The monosaccharide composition was analyzed by high-performance anion-exchange chromatography (HPAEC). The HPAEC system (Thermo Scientific Co., Waltham, MA, USA) consisted of a DIONEX ICS-3000 chromatographic instrument and a Carbo PacTM PA20 (3 mm × 150 mm) analytical column. The eluent was 250 mmol·L−1 NaOH and 1 mol·L−1 CH3COONa, and then passed through the column at 35 °C with the flow rate of 0.5 mL·min−1. Sugar mixtures were used as standards.
Molecular weight (Mw) distribution of pectin
-
The Mw distribution of pectin was analyzed by high performance size exclusion chromatography (HPSEC) referred to Wang et al.[35]. An Agilent 1260 HP-GPC chromatographic instrument (Agilent Co., Palo Alto, CA, USA) equipped with an Agilent PL aquagel-OH MIXED-M (8 μm) column was utilized. The pectin solution (2 mg·mL−1) was prepared with hot water at 60 °C, stirred magnetically for 30 min and placed at 4 °C overnight to fully dissolve the pectin. Before analysis, the solution passed through a 0.22 μm hydrophilic membrane and exhausted by ultrasound for 30 min. The solution was then eluted with 0.1 mol/L NaNO3 at the flow rate of 1 mL·min−1 with the temperature of 30 °C. The standard curve was prepared with 2 mg/mL dextran with a weight-average Mw of 135,350, 64,650, 36,800, 13,050, 9,750, 5,250, and 2,700 Da.
Fourier transform infrared spectroscopy (FTIR) analysis of pectin
-
Based on the approach outlined by Wang et al.[21], the FTIR spectrum analysis of pectin was conducted. The spectrum was collected using a PE-SP100 Fourier transform infrared spectrometer (Perkin Elmer Co., Waltham, MA, USA). The spectral recording spanned a range of 4,000 to 400 cm−1, with a total of 32 scans and a spectral resolution of 4 cm−1.
X-ray diffraction (XRD) measurements of pectin
-
XRD pattern was measured by an X-ray diffractometer (D8 advance, Bruker Co., Karlsruhe, Germany). The scanning range of pectin powder was 5°−45° diffraction angle (2θ) in a continuous mode with the step size of 0.02° 2θ and time per step of 0.5 s. The XRD parameters for pectin were analyzed by MDI Jade software 6.5 (Materials Data Inc., Livermore, CA, USA).
Atomic force microscopy (AFM) analysis of pectin
-
The AFM was conducted according to methods described by Wang et al.[36]. The dried pectin powder was dissolved in deionized water and subsequently subjected to a dialysis membrane with a Mw cutoff of 3,000 Da for 48 h. The solution was then diluted to approximately 5 μg·mL−1 and ultrasonically treated for 10 min. A freshly cleaved mica sheet was attached to a slide with double-sided tape. After vortex oscillation, 20 μL of the solution was dropped briefly (for about 5 s) onto the surface of the mica and naturally dried at room temperature. AFM images were obtained using a Dimension ICON atomic force microscope (Bruker Co., Karlsruhe, Germany) equipped with an AC160-NA micro cantilevered scanner. The tapping mode was used with a resolution of 256 × 256 lines and a scanning speed of 1.0 Hz.
AFM images were analyzed off-line using the NanoScope Analysis software 1.90 (Bruker Co., Karlsruhe, Germany). The bright and dark areas in the images represented the highs and lows of the observed pectin chain and polymer. The vertical and horizontal axes used different scales, and the analysis used height mode images[36]. The height and width of a single chain was measured using section analysis of the AFM software. The length of single chain was measured using perimeter tools of Adobe Acrobat 9 Pro software (Adobe Inc., San Jose, CA, USA).
Statistical analysis
-
All experiments were performed at least in triplicate. Analysis of variance (ANOVA) was used to conduct and analyze statistics with Microsoft Excel 2016 (Microsoft Co., Redmond, WA, USA), where p < 0.05 indicated significant difference according to Duncan's multiple range test using SPSS Statistics v26.0 (IBM Co., Armonk, NY, USA). The value was recorded as mean ± standard deviation (SD). Design-Expert software 10.0.4 (Stat Ease Inc., Minneapolis, USA) was used for BBD and analysis of variance (ANOVA) in RSM.
-
To comprehensively and economically extract pectin, an extraction containing acidified-water extraction and the subsequent ethanol-precipitation was selected. Taking solid-liquid ratio, extraction temperature, extraction time and ultrasonic power as independent variables, the effects of the main factors on extraction rate were investigated. In light of the results obtained from single-factor experiments (Fig. 1), response surface methodology (RSM) and Box-Behnken design (BBD) were used to further optimize the extraction of pectin, and a quadratic polynomial regression model was developed for the extraction yield of pectin (Table 1). Lack of Fit for regression model was not significant as the P-value was more than 0.05 (Table 2). According to the F-value of each factor, the solid/liquid ratio was the most important factor that influenced the extraction yield of pectin, followed by extraction temperature, ultrasound power and extraction time. The cavitation generated by ultrasonic waves can make the extracted liquid close enough to the solid surface, which increases the contact area between the solvent and the solid, and thus improve the dissolution rate of the extracted compound from the solid[37].
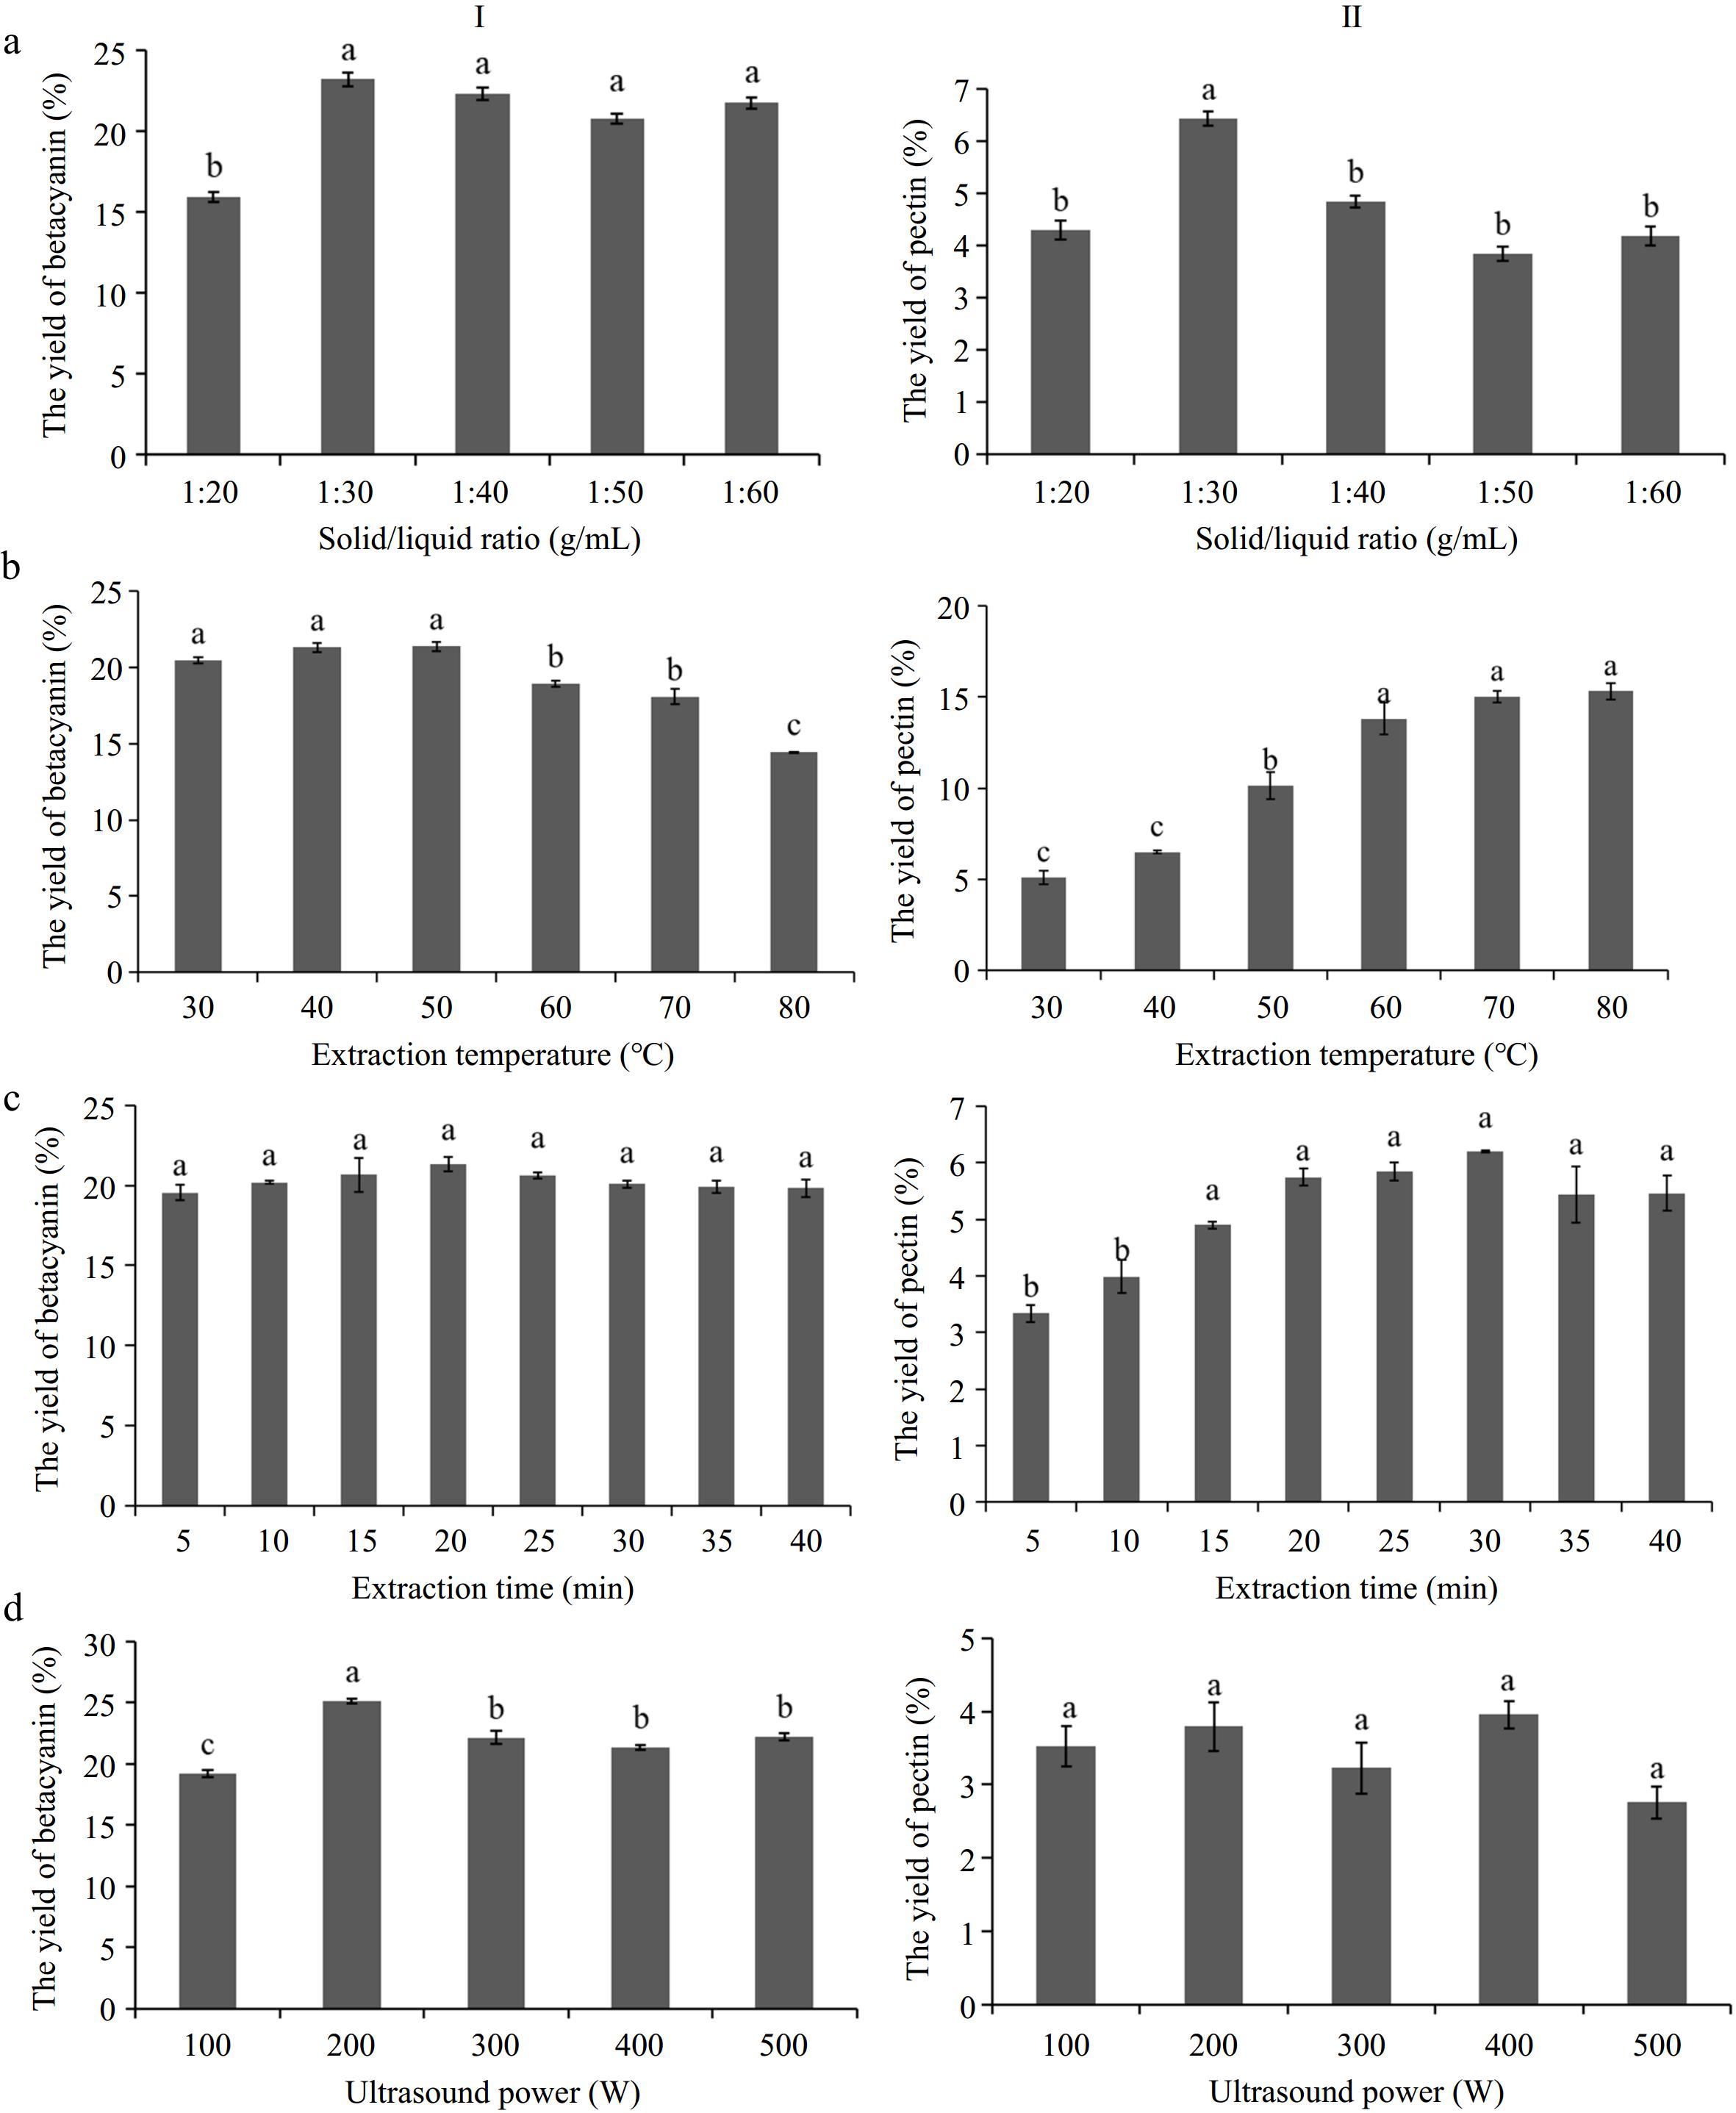
Figure 1.
Effect of (a) solid/liquid ratio, (b) extraction temperature, (c) extraction time and (d) ultrasound power on yields of betacyanin (I) and pectin (II). Those marked with different lower-case letters among fractions are significantly different (p < 0.05) according to Duncan's multiple range test.
Table 2. The analysis of variance (ANOVA) for response surface quadratic model.
Source Sum of
squaresDF Mean
squareF-value P-value
Prob > FModel 114.2 14 8.16 1.11 0.4245 A 18.38 1 18.38 2.5 0.1362 B 12.18 1 12.18 1.66 0.219 C 1.97 1 1.97 0.27 0.613 D 3.1 1 3.1 0.42 0.5266 AB 1.72 1 1.72 0.23 0.6365 AC 25.35 1 25.35 3.45 0.0845 AD 12.82 1 12.82 1.74 0.208 BC 1.19 1 1.19 0.16 0.6938 BD 4.1 1 4.1 0.56 0.4676 CD 0.37 1 0.37 0.05 0.8267 A2 29.35 1 29.35 3.99 0.0655 B2 3.48 1 3.48 0.47 0.5028 C2 0.24 1 0.24 0.032 0.8601 D2 6.63 1 6.63 0.9 0.3584 Residual 102.95 14 7.35 Lack of Fit 51.96 10 5.2 0.41 0.8862 Pure Error 50.99 4 12.75 Cor Total 217.16 28 A: Solid/liquid ratio; B: Extraction temperature; C: Extraction time; D: Ultrasound power; DF: Degree of freedom. The analysis of variance (ANOVA) for response surface quadratic model was obtained by Design-Expert software 10.0.4 (Stat Ease Inc., Minneapolis, USA). The experimental design and result of the yield of pectin are shown in Table 1. The quadratic polynomial regression model developed by Design-Expert 10.0.4 software was as follows:
$ \begin{split}R=\;&9.02+1.24A+1.01B+0.41C+0.51D+0.66AB+\\&2.52AC-1.79AD-0.55BC+1.01BD+0.30CD-\\&2.13A^2-0.73B^2-0.19C^2-1.01D^2 \end{split}$ (2) where, R is the extraction yield of pectin. A is the solid/liquid ratio, B is extraction temperature, C is extraction time, and D is ultrasound power.
The response value and these affecting factors formed three-dimensional surface diagrams, which intuitively indicated the influence of the interactions between variables on pectin extraction from pitaya fruit peel (Fig. 2).
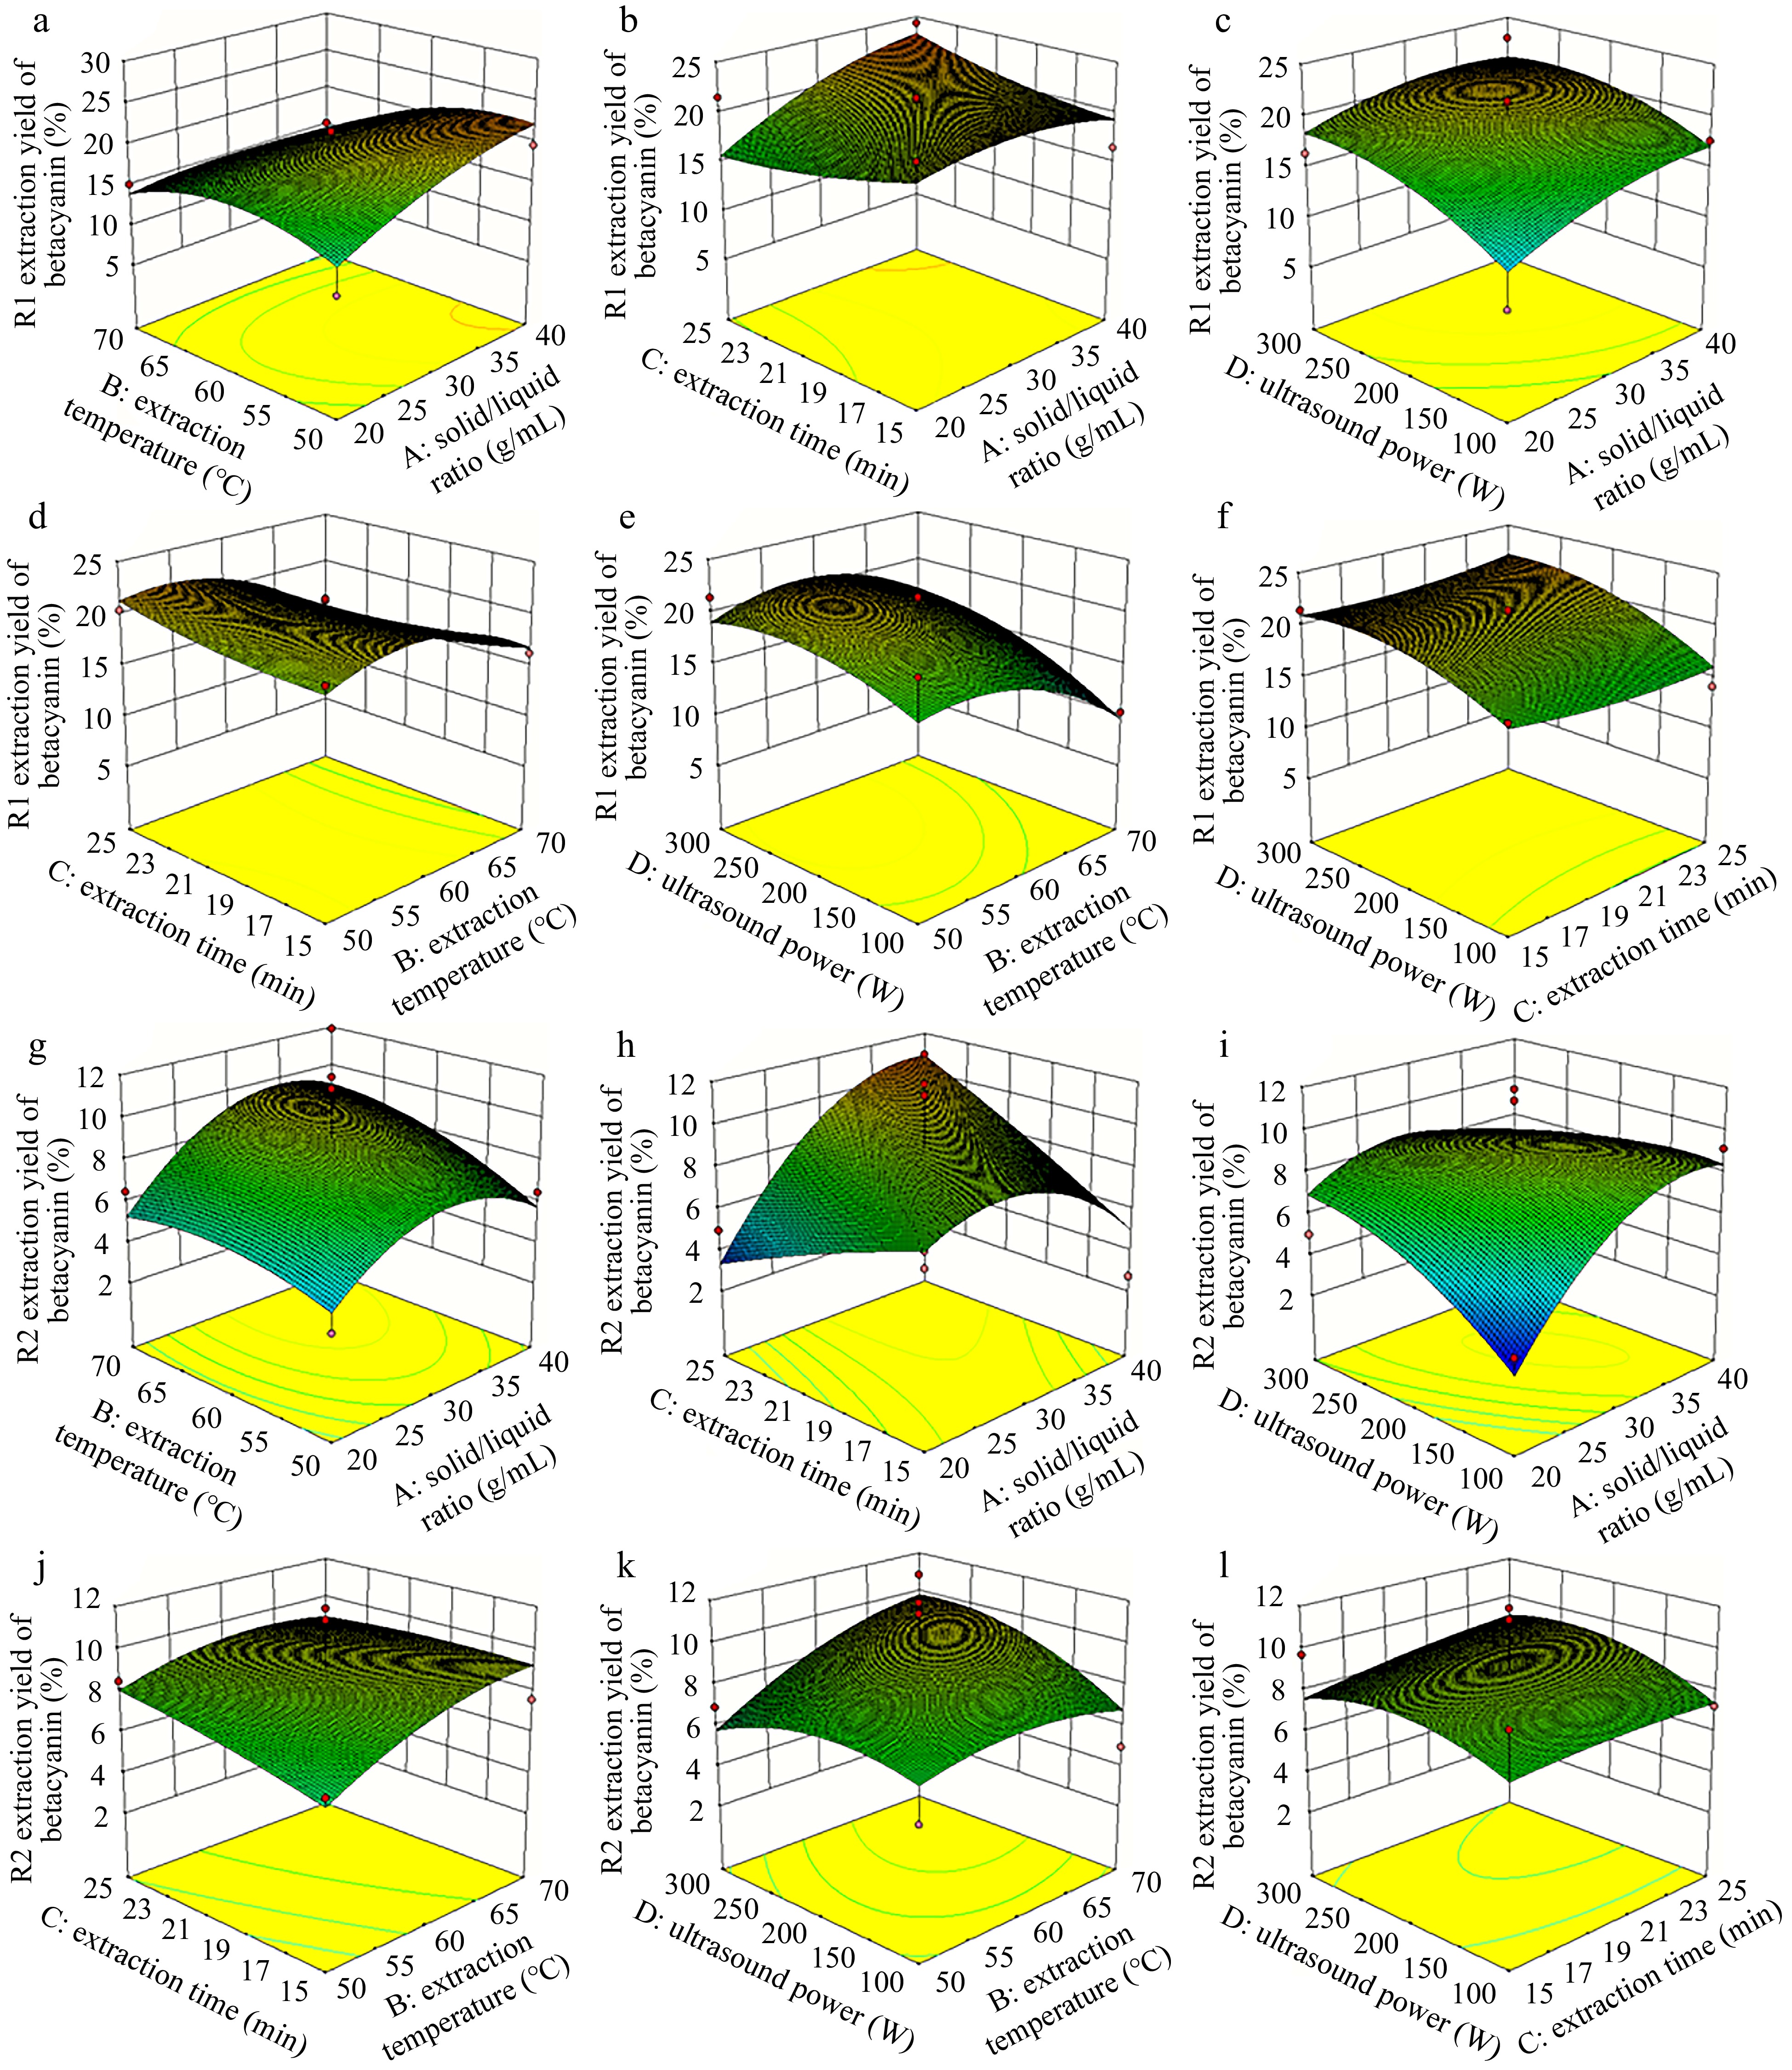
Figure 2.
Response surface diagrams showing effects of independent variables (A: solid/liquid ratio, B: extraction temperature, C: extraction time and D: ultrasound power) on (a)−(f) the yield of pectin from pitaya fruit peel.
According to the regression model, taking into account the comprehensive yield of pectin and betacyanin, the optimal extraction conditions were identified as follows: solid-liquid ratio of 1:40 (g·mL−1), extraction temperature at 55.81 °C, extraction time of 25 min, and ultrasonic power of 186.98 W. To facilitate practical operation, the optimal extraction temperature and ultrasonic power were amended to 56 °C and 200 W, respectively. After three verification experiments, the average extraction yield of pectin from pitaya peel was 9.93% ± 0.97%, which was not significantly different from the predicted result obtained by the model (Supplemental Table S1). These results indicated that the modified extraction conditions obtained by response surface analysis were reliable and of certain practical value. Compared to previous studies of extracting pectin from pitaya fruit peel with similar conditions, the yield of pectin was much higher than hot water extraction, but lower than microwave[38] and enzyme-assisted extraction[7]. For ultrasound-assisted extraction, the yield of pectin extracted from pitaya fruit peel was slightly improved[39].
Proximate composition and DM of pectin
-
Characterization of pectin prepared from pitaya fruit peel under the optimal co-extraction conditions was evaluated in this study. The proximate composition of the pectin is shown in Table 3.
Table 3. Physico-chemical properties of pectin.
Items Content Proximate composition (w, %) Moisture 7.68 ± 0.02 Protein 6.03 ± 0.03 DMA (%) NDB Molecular characteristics MwC (kDa) 33.52 ± 0.43 MnD (kDa) 22.55 ± 0.23 Polydispersity Index 1.49 ± 0.02 Monosaccharides composition (mol%) Galacturonic acid 48.35 ± 1.74 Rhamnose 30.04 ± 1.10 Galactose 11.05 ± 0.37 Arabinose 6.25 ± 0.29 Glucose 1.42 ± 0.26 Glucuronic acid 1.21 ± 0.11 Xylose 0.87 ± 0.31 Mannose 0.53 ± 0.11 Fucose 0.17 ± 0.03 Molar ratios of monosaccharides GalA/(Fuc+Rha+GlcA+Ara+Gal+Xyl)E 0.98 ± 0.08 Rha/GalAF 0.62 ± 0.05 (Gal+Ara)/RhaG 0.58 ± 0.01 A DM: degree of methylesterification; B ND: not detected; C Mw: weight-average molecular weight; D Mn: number-average molecular weight. E GalA / (Fuc + Rha + GlcA + Ara + Gal + Xyl): the linearity of pectin; F Rha/GalA: the contribution of RG to pectin population; G (Gal+Ara)/Rha: the branching extent of the RG-I domain. Values represent means ± standard derivatives of three replicates. DM is the percentage of carboxyl methyl ester in the total number of carboxyl groups. However, the ester carbonyl group was not detected in the pectin extracted, indicating that the pectin obtained was low or even non-methoxy pectin. The result didn't agree with previous results that the DM of pectin from pitaya peel was above 50%[22,40]. In this study, the peel powder was processed with hot acidified water with ultrasonic assistance. The procedure of hydrolysis and ultrasound treatment might lead to the de-methylesterification of the pectic polysaccharide[41], which such ultra-low methoxylated pectin was also verified in other studies using the hot-acid method[42] or ultra-high pressure enzyme extraction[7]. Low methoxy pectin solutions readily formed gels when exposed to divalent metal ions. These ions interacted with the pectin, facilitating crosslinking and enhancing gelling properties[43], such as softer, more elastic, and has thermal reversibility.
Monosaccharide composition of pectin
-
The contents of neutral sugars and uronic acids in pectin, varied according to the raw materials used and the extraction techniques employed are shown in Table 3. Galacturonic acid (GalA), reached 48.35% (mol%), accounted for a large portion of the component in the ethanol-precipitated substance obtained from pitaya fruit peel, which suggested that this ethanol insoluble material belonged to pectic polysaccharides. GalA was found comparable to that obtained by Zaid et al.[40] and Chen et al.[7] in pectin extracted from Hylocereus polyrhizus's peels, suggesting that the ultrasonic-assisted acid extraction was feasible. Rhamnose (Rha) (30.04%) was found as the most predominant neutral sugar presented in the pectin, followed by galactose (Gal) (11.05%) and arabinose (Ara) (6.25%). There was also a smaller amount of glucose (Glc), glucuronic acid (GlcA), xylose (Xyl), mannose (Man) and fucose (Fuc) in the pectin. The backbone of HG and RG regions of pectin were composed of GalA and Rha together with GalA, respectively. Among them, RG-I possesses side chains rich in poly galactose and poly arabinose, which are attached to the C-4 of Rha residues in the backbone. RG-II contains 4 to 5 compositionally steady sidechains that consist of many monosaccharides including Rha, Gal, Ara, GlcA, and Fuc. Xylose is one of the main constituents of xylogalacturonan (XG), the branched HG. Man and Glc may be found in non-pectic polysaccharides such as hemicellulose and cellulose which could be associated with pectin side chains[21].
The GalA/(Fuc + Rha + GlcA + Ara + Gal + Xyl) molar ratio reflects the linearity of pectin, which was 0.98 ± 0.08, lower than that obtained by Zaid et al.[40] and demonstrated higher percentage of side chains. The Rha/GalA molar ratio suggests the contribution of RG to the pectin population, which was 0.62 ± 0.05, showed much higher than that in previous studies[40]. The (Ara + Gal)/Rha molar ratio shows the branching degree of the RG-I domain in pectic polymer, which was 0.58 ± 0.01, was much lower than that obtained by Zhang & Cai[44]. The decrease was mostly affected by the ultrasonic modification on degradation of side chains and linear changes in the pectin[41].
Molecular weight distribution of pectin
-
The Mw of pectin co-extracted from pitaya fruit peel was determined by a high-performance size exclusion chromatography (HPSEC) and only one elution peak was detected, showing the Mw distribution of pectin was relatively uniform (Supplemental Fig. S2). The weight-average Mw of pectin was 33.52 kDa (Table 3). The polydispersity index (PDI) indicates the range of the molecular weight distribution. A larger PDI marked a wider Mw distribution. Compared to pectin extracted from cold water or hot acid, the Mw of pectin extracted by ultrasonic-assisted hot acid in this study was much smaller, which may be due to the cavitation force possibly causing fragmentation of the pectin leading to a decrease in Mw[25].
FTIR spectra of pectin
-
The analysis of pitaya peel pectin using FTIR was conducted to identify the primary functional groups (Fig. 3). The finger-print regions of typical pectic polymers are represented by absorption bands within the 800−1,200 cm−1 wavelength range[22]. The widest absorption occurred at 3384 cm−1 was originated from O-H stretching vibrations, while the absorption at 2,936 cm−1 was caused by C-H stretching vibrations of CH2 groups. The band at 1,632 cm−1 was characteristic for non-methyl-esterified carboxyl groups in pectin. The band at 1,412 cm−1 was attributed to C-H bending vibrations of CH and CH2 groups. The absorption at 1,020−1,144 cm−1 was caused by C-OH, C-O-C, and C-C stretching vibrations, indicating the existence of pyranose ring. The absorption at 952 cm−1 might be caused by glucose, while 812 cm−1 and 892 cm−1 were due to α-glycosidic bonds and β-glycosidic bonds, respectively[21]. These bands were characteristic of pectin[21].

Figure 3.
Fourier-transform infrared spectrum of pectin from pitaya fruit peel.
No absorption peak at 1,735−1,750 cm−1 was identified, showing that there were almost no stretching vibrations caused by the C=O and the DM of the pectin was pretty low, which was consistent with the measurement of DM results in pectin from pitaya fruit peel.
XRD of pectin
-
The amorphous or crystalline properties of pectin could be revealed by the XRD. The characteristic diffraction peak of pectin extracted from pitaya fruit peel was identified as 18.58° 2θ (Supplemental Fig. S3), though the crystallinity was little, the crystallite size was large (Table 4). The crystalline index (CI) value was low in comparison with those reported by Wang et al.[21]. The result of crystallinity may be caused by excessive ultrasonic treatment power, which might partly damage the internal structure of pectin[45]. Previous studies suggested that pectic polysaccharides tend to be mostly amorphous, with very little crystalline property that might be produced by cellulose residue in pectin precipitation[46,47].
Table 4. The XRD parameters for pectin.
Items Values Crystal plane distance (Å) 4.77 ± 0.001 FWHM (°) 0.61 ± 0.008 Crystallite size (Å) 134 ± 1.42 Crystalline index (%) 0.60 ± 0.007 FWHM: the full width at half maximum. Values represent means ± standard derivatives of three replicates. AFM analysis of pectin
-
Atomic force microscopy (AFM) was utilized to investigate the nanostructure of pectin co-extracted from pitaya fruit peel, generating three-dimensional scans of individual pectin molecules with nanometer precision. The images obtained from AFM revealed a meshwork of interconnected pectin chains, consisting of both singular linear strands and branched linear chains of various lengths (Fig. 4a−c). The interconnected structure observed in pitaya peel pectin closely resembled that seen in sonicated citrus pectin[48]. It was likely that the long, straight segments corresponded to smooth homogalacturonan (HG) molecules, while the thicker regions between the linear molecules were indicative of the side chains of rhamnogalacturonan I (RG-I). These findings highlighted the presence of diverse polymers, micellar formations, and aggregates, reflecting the intricate and multifaceted characteristics of pectin. The heights of the chains were measured in Fig. 4d to judge whether the intersections between molecules were intramolecular branched or overlapping structures. Generally, when two single chains cross, the height is equal to the sum of the heights of the two single chains and is kept equal to the height of a single chain at the actual bifurcation point. Pitaya peel pectin showed linear filamentous structures with a large proportion of them possessing branches.
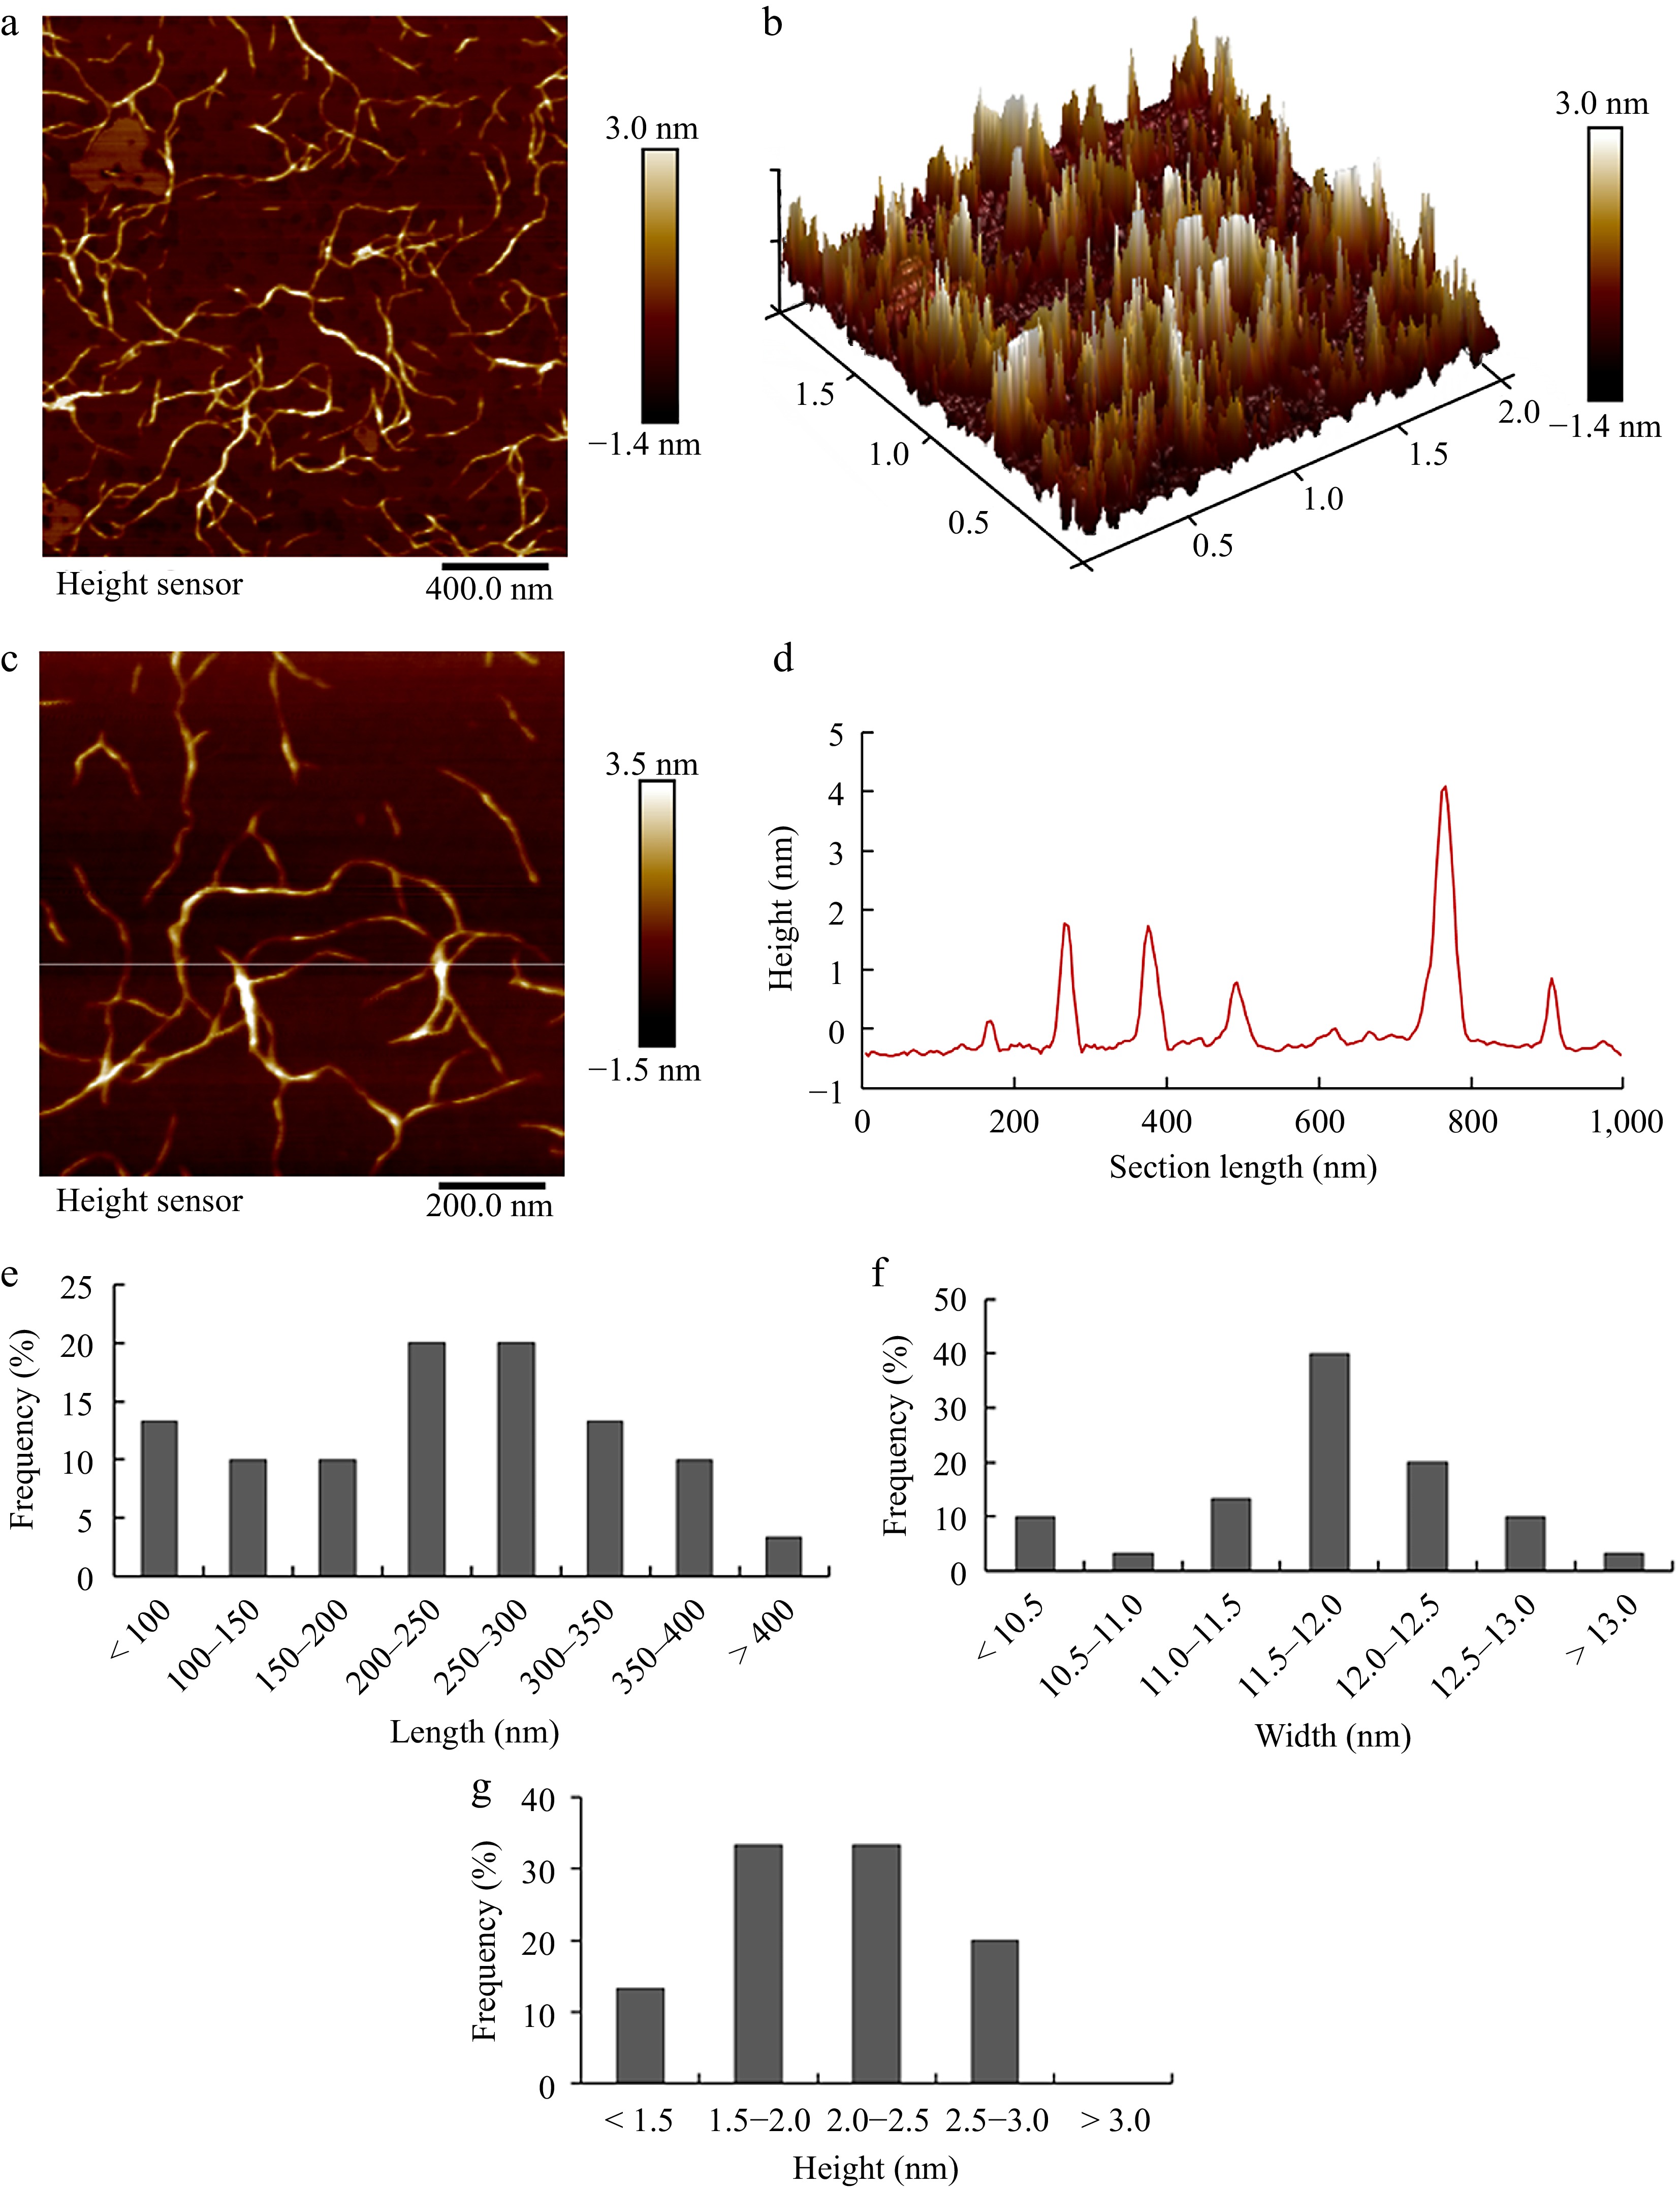
Figure 4.
AFM images of pectin from pitaya peel. (a) 2D and (b) 3D AFM images with image size of 2 μm × 2 μm. (c) 2D AFM images with image size of 1 μm × 1 μm. (d) Height profile of the cross-section highlighted in the image C. The frequency histograms of (e) length, (f) width and (g) height of single chains in pectin, respectively. The height and width of single chain were measured using section analysis of the NanoScope Analysis software 1.90 (Bruker Co., Karlsruhe, Germany). The length of single chain was measured using perimeter tools of Adobe Acrobat 9 Pro software (Adobe Inc., San Jose, CA, USA).
The pectin molecules were analyzed based on histograms displaying distributions of the contour backbone chain lengths using AFM images. The chain lengths were predominantly distributed from 100 to 400 nm and the lengths that focused on the range of 150~300 nm were over 72.9% of the overall distribution (Fig. 4e). This suggested a narrow range of Mw distribution, which was significantly longer than the wax apple pectin chain as reported by Wang et al.[36]. The width of pectin single chains was about 11.5~12.0 nm, while the height was approximately 1.5~2.5 nm, indicating the presence of RG-I and RG-II polymers in hairy regions of pectin. The average chain height of extracted pectin was lower than that of wax apple pectin[36] but higher than that of water-soluble pectin from mango[46]. The results were further supported by the observation of pectic polymer aggregates in AFM images (Fig. 4a), correlating with high levels of Gal, Ara, and Rha, suggesting that pitaya peel pectin was a highly branched polymer.
-
In this study, pectin from pitaya fruit peel was extracted through an effective and economical ultrasonic-assisted extraction procedure and the structure was characterized. The extraction optimization was conducted and analyzed using RSM and BBD for four independent factors, with the optimal extraction conditions identified as a solid-liquid ratio of 1:40 (g/mL), extraction temperature at 55.81 °C, extraction time of 25 min, and ultrasonic power of 186.98 W to reach the yield of 9.93% ± 0.97%. The Mw of the extracted pectin was relatively low, and the ester carbonyl group was not detected. XRD and AFM showed the pectin was amorphous and rich in highly branched polymers with less linearity, but possessed more RG regions. These results suggest that pectin would be a potential for use in low- or non-methylesterified pectic substances with plenty of highly-branched RG polymers, which helps to effectively utilize the pitaya peel waste.
-
The authors confirm contribution to the paper as follows: study conception and design: Fang Q, Cao J; data collection: Wang Y, Fang Q; analysis and interpretation of results: Wang Y, Shu C, Zhang T; writing - original draft: Fang Q, Wang Y, Cao J; writing - review & editing: Wang Y, Shu C, Zhang T, Cao J. All authors reviewed the results and approved the final version of the manuscript.
-
All data generated or analyzed during this study are included in this published article and its supplementary information files.
This study was financially supported by the National Natural Science Foundation of China (No. 32272371).
-
The authors declare that they have no conflict of interest.
- Supplemental Table S1 The verification results of optimum extraction process.
- Supplemental Fig. S1 The flow diagram of extraction of pectin from pitaya peel.
- Supplemental Fig. S2 The elution profile of pectin from pitaya fruit peel.
- Supplemental Fig. S3 X-ray diffraction pattern of pectin powder.
- Equation A.1 The quadratic polynomial model explaining the relationship between the response and variables.
- Copyright: © 2024 by the author(s). Published by Maximum Academic Press on behalf of China Agricultural University, Zhejiang University and Shenyang Agricultural University. This article is an open access article distributed under Creative Commons Attribution License (CC BY 4.0), visit https://creativecommons.org/licenses/by/4.0/.
-
About this article
Cite this article
Wang Y, Fang Q, Shu C, Zhang T, Cao J. 2024. Non-methylesterified pectin from pitaya (Hylocereus undatus) fruit peel: optimization of extraction and nanostructural characterization. Food Innovation and Advances 3(2): 181−190 doi: 10.48130/fia-0024-0019 

Non-methylesterified pectin from pitaya (Hylocereus undatus) fruit peel: optimization of extraction and nanostructural characterization
- Received: 09 April 2024
- Revised: 12 June 2024
- Accepted: 12 June 2024
- Published online: 21 June 2024
Abstract: The peel of pitaya fruit is a promising source of pectin, and non- or low-methylesterified pectin has multiple bioactivities and application scenarios. In this study, non-methylated pectin was prepared from pitaya peel and the structure was characterized. Single factor experiment and response surface methodology were conducted to optimize the procedure of ultrasonic-assisted extraction for pectin. Under the optimal conditions (solid-liquid ratio of 1:40 g·mL−1, extraction temperature at 56 °C, extraction time of 25 min and ultrasonic power of 200 W), the pectin yield was up to 9.93% ± 0.97%. Degree of methylesterification and FTIR analysis confirmed that the extracted pectin was almost non-methylesterified. The pectin possessed less linear homogalacturonan (HG) but more rhamnogalacturonan (RG) regions according to the molar ratios of monosaccharides. Meanwhile, the molecular weight of the pectin was 33.52 kDa and the crystalline index was only 0.60%. Furthermore, the nanoscale structure observed by atomic force microscopy showed that the pectin was rich in highly branched polymers. Generally, pitaya peel pectin extracted by ultrasonic-assisted extraction showed a wide range of potential use as a non-or low- methylesterified pectic substance to reach the efficient utilization of fruit waste.
-
Key words:
- Dragon fruit /
- Response surface methodology /
- Ultrasonic-assisted extraction /
- Structure