-
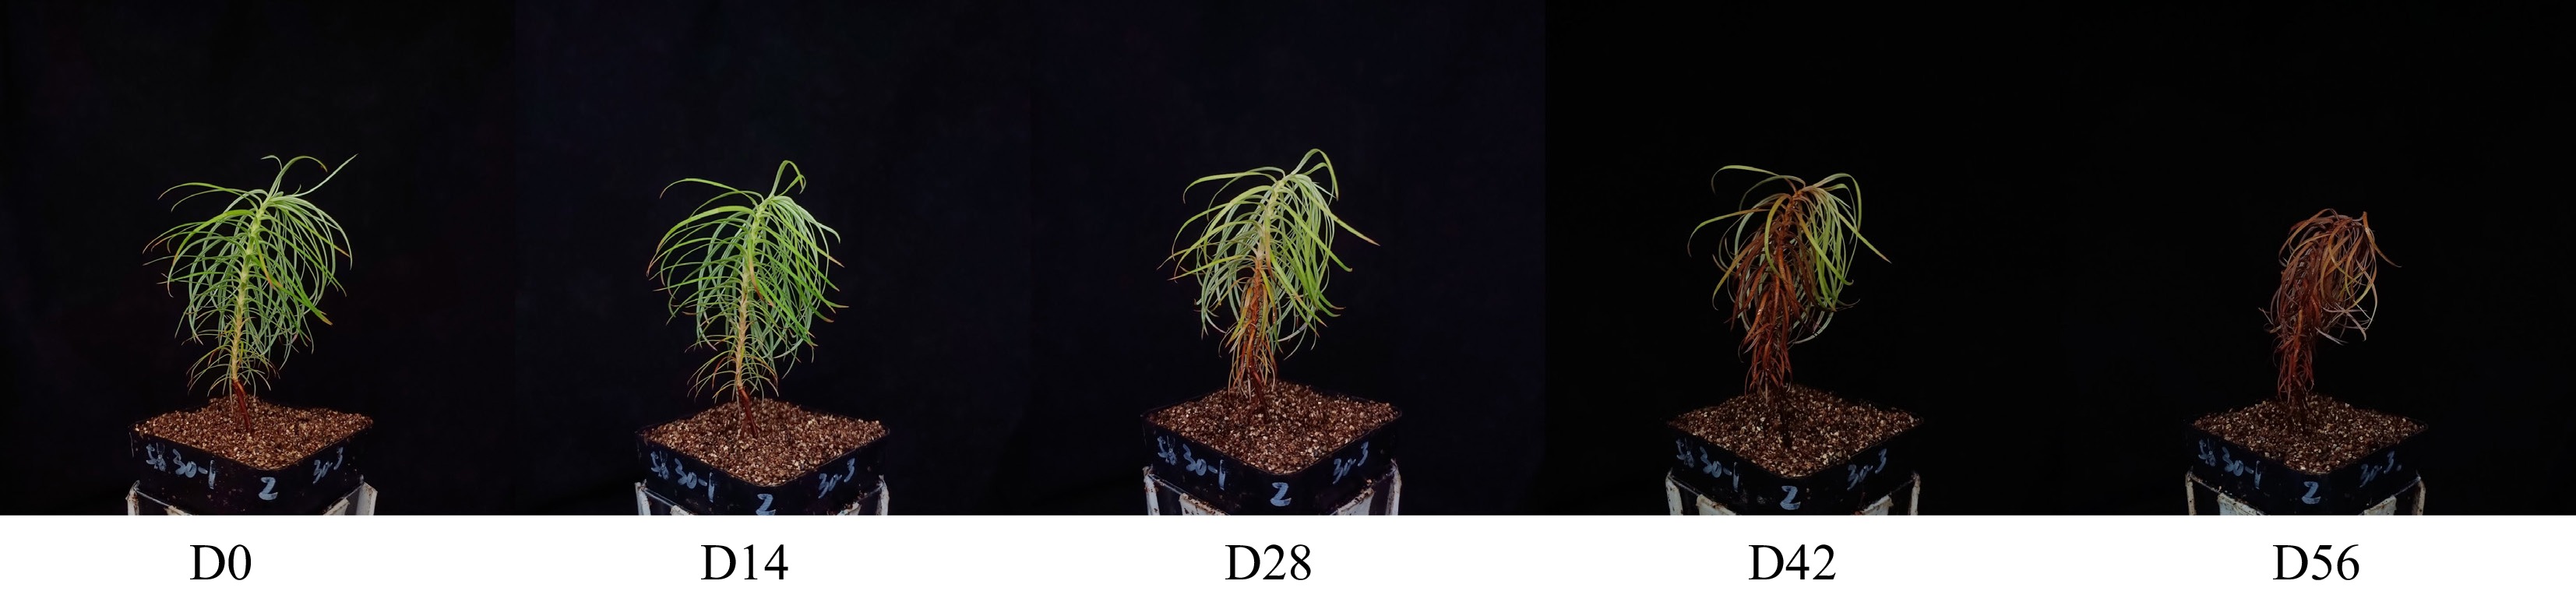
Figure 1.
Chinese fir seedlings from different drought treatments.
-
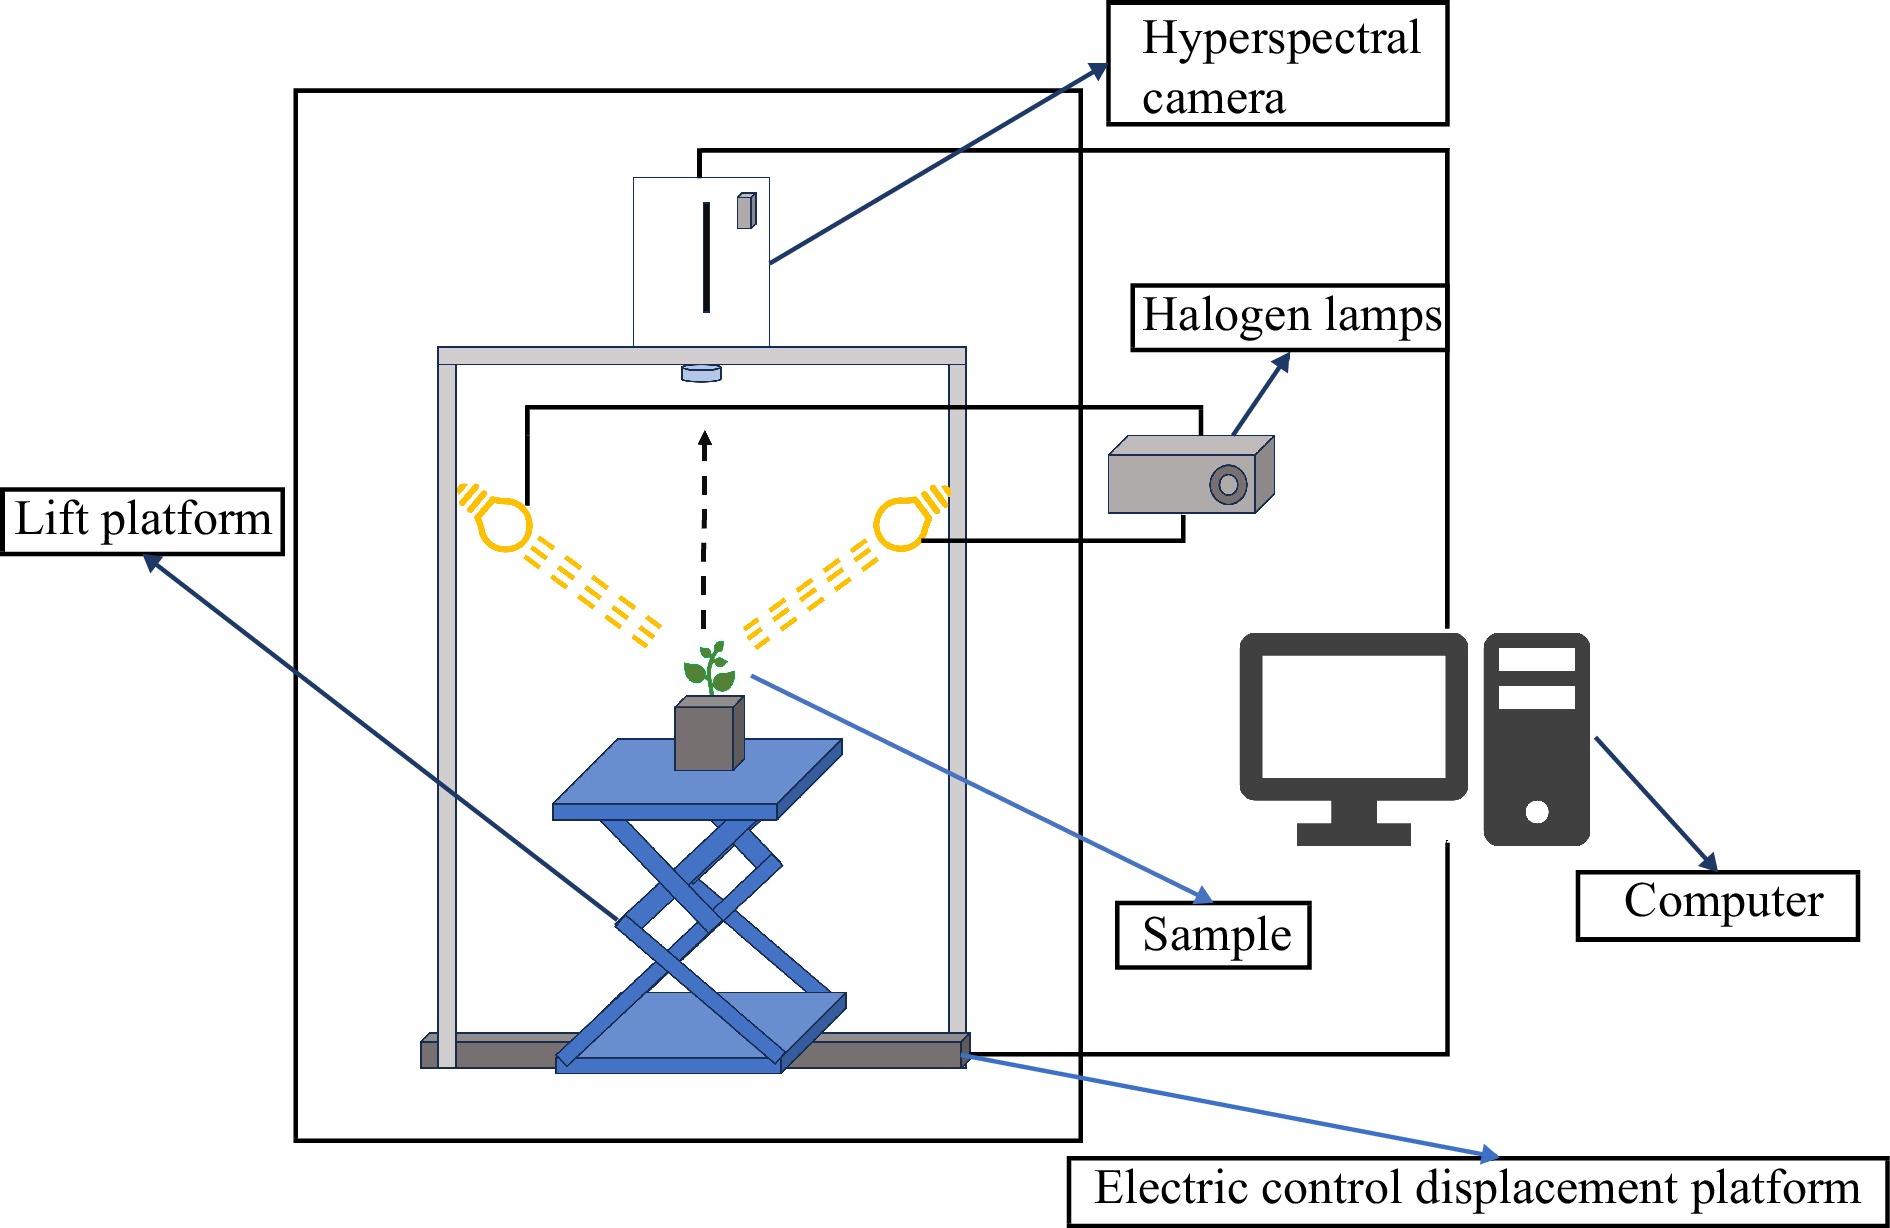
Figure 2.
Hyperspectral imaging system.
-
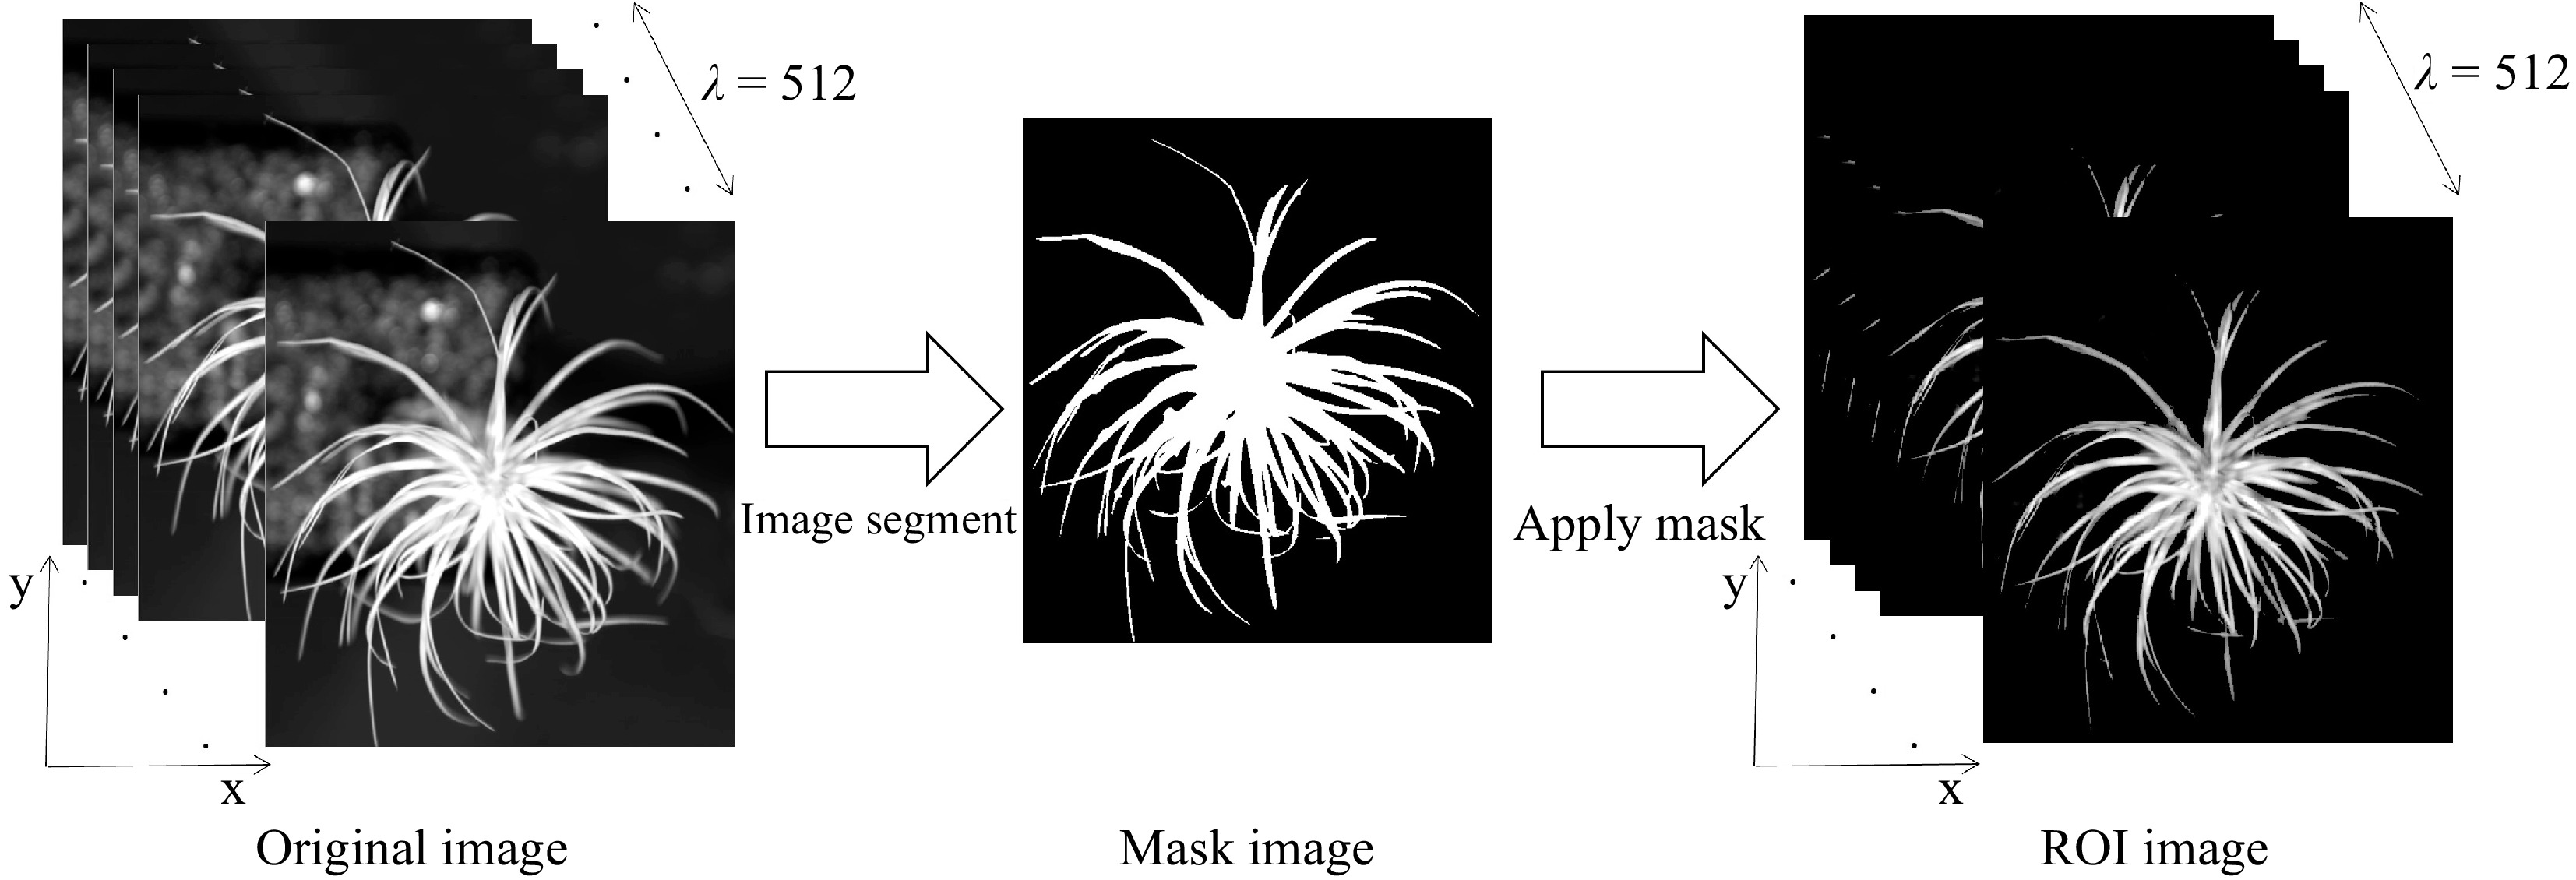
Figure 3.
Flow chart of hyperspectral data extraction from NIR hyperspectral images.
-
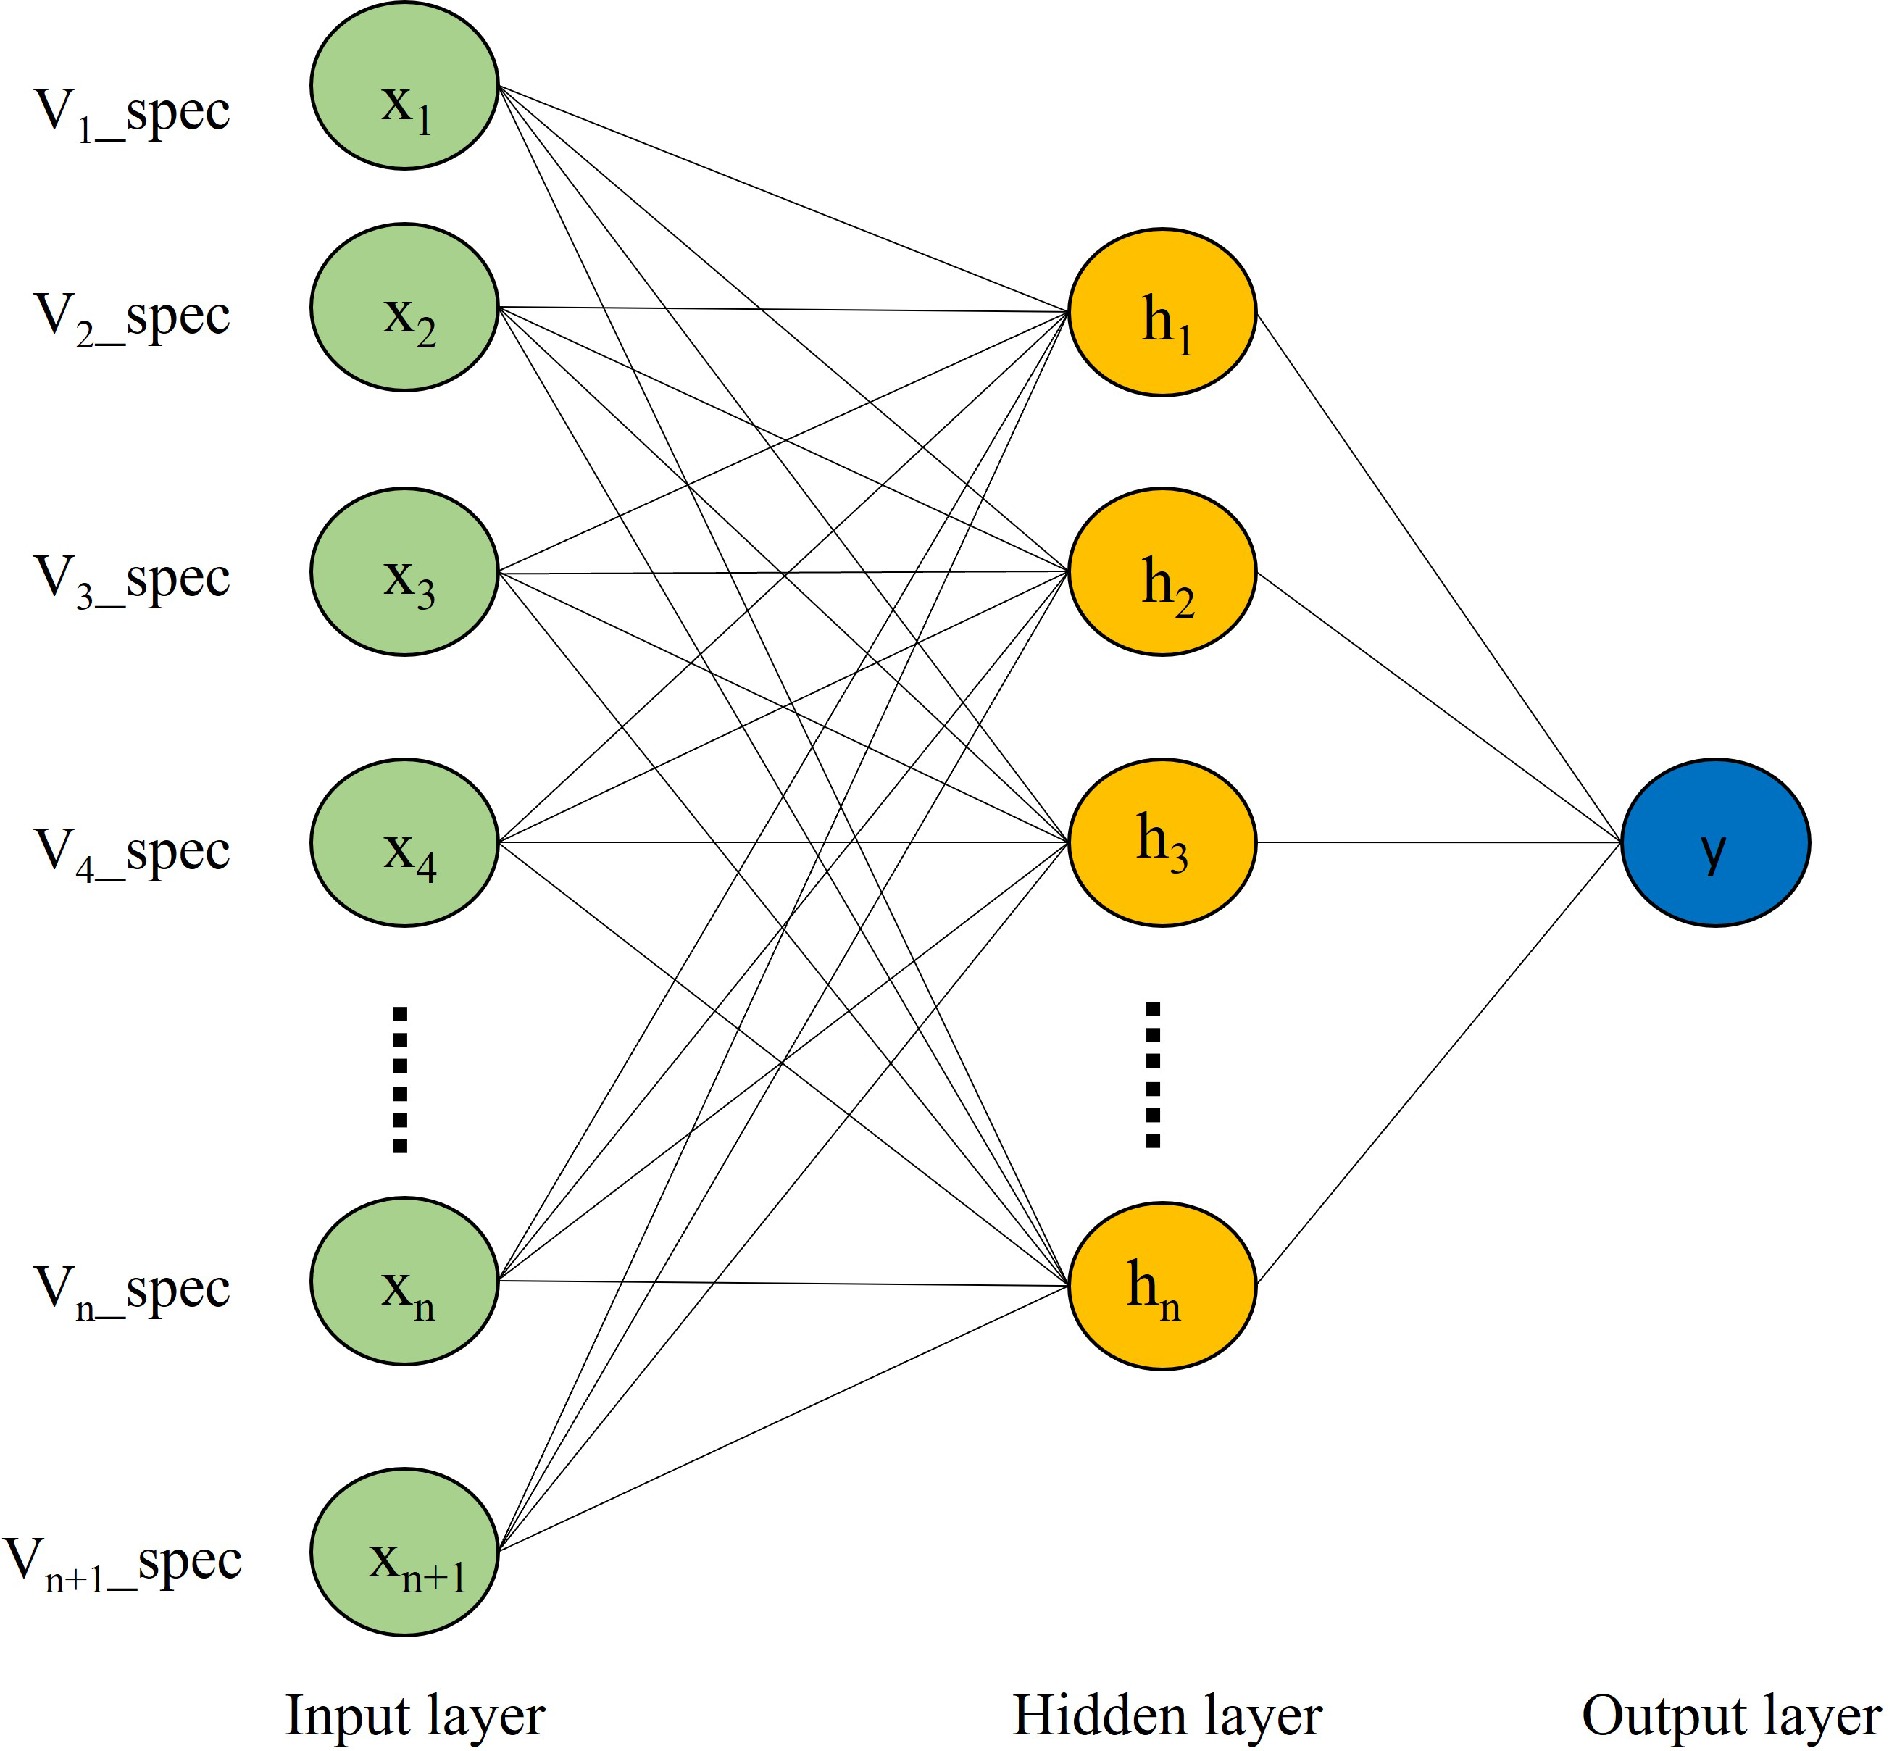
Figure 4.
ANNs structure.
-
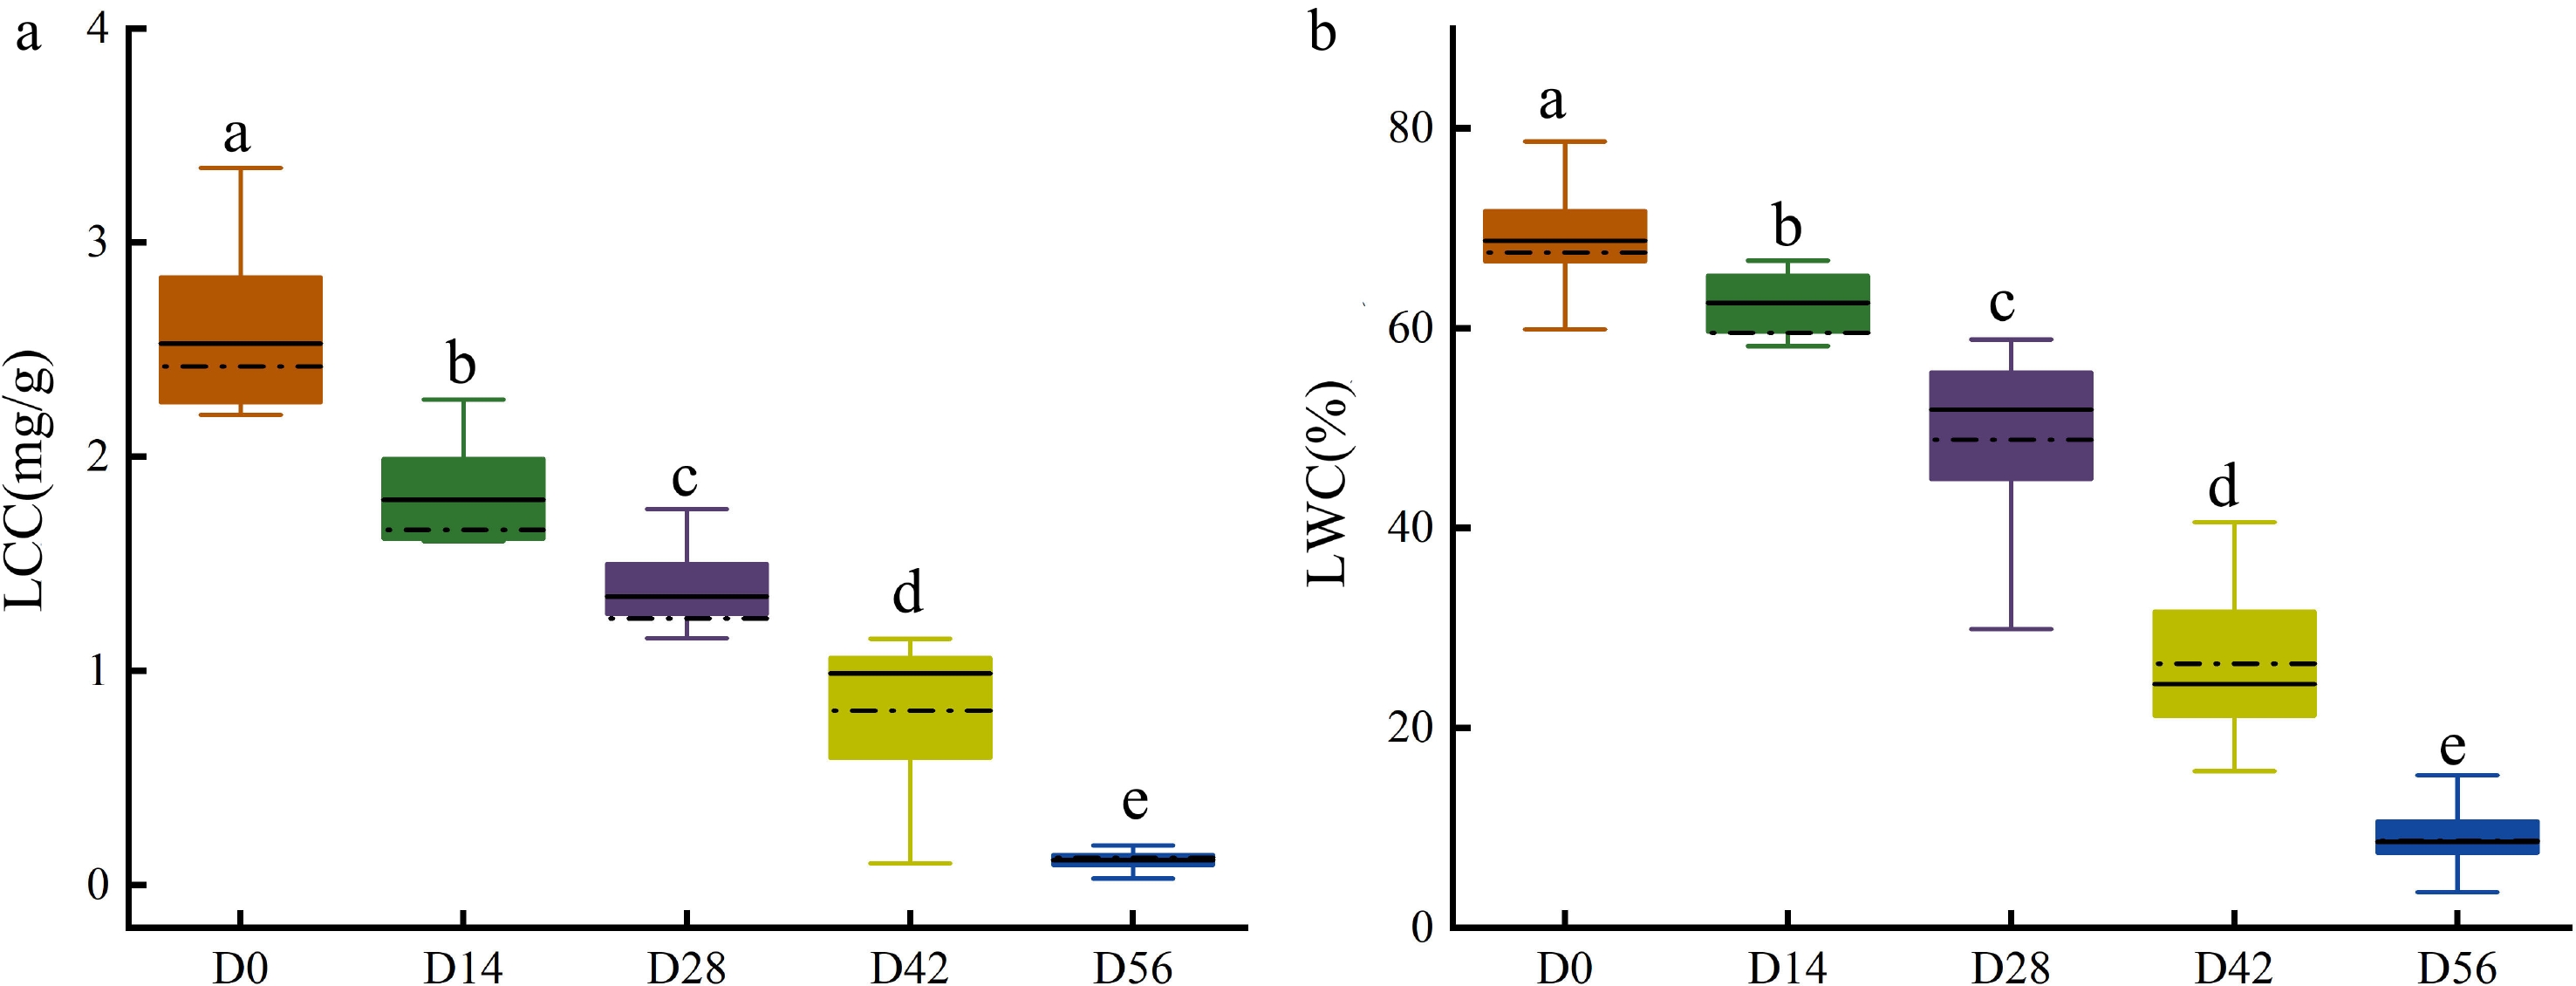
Figure 5.
Measured (a) LCC and (b) LWC in Chinese fir seedlings of the five drought treatment groups.
-
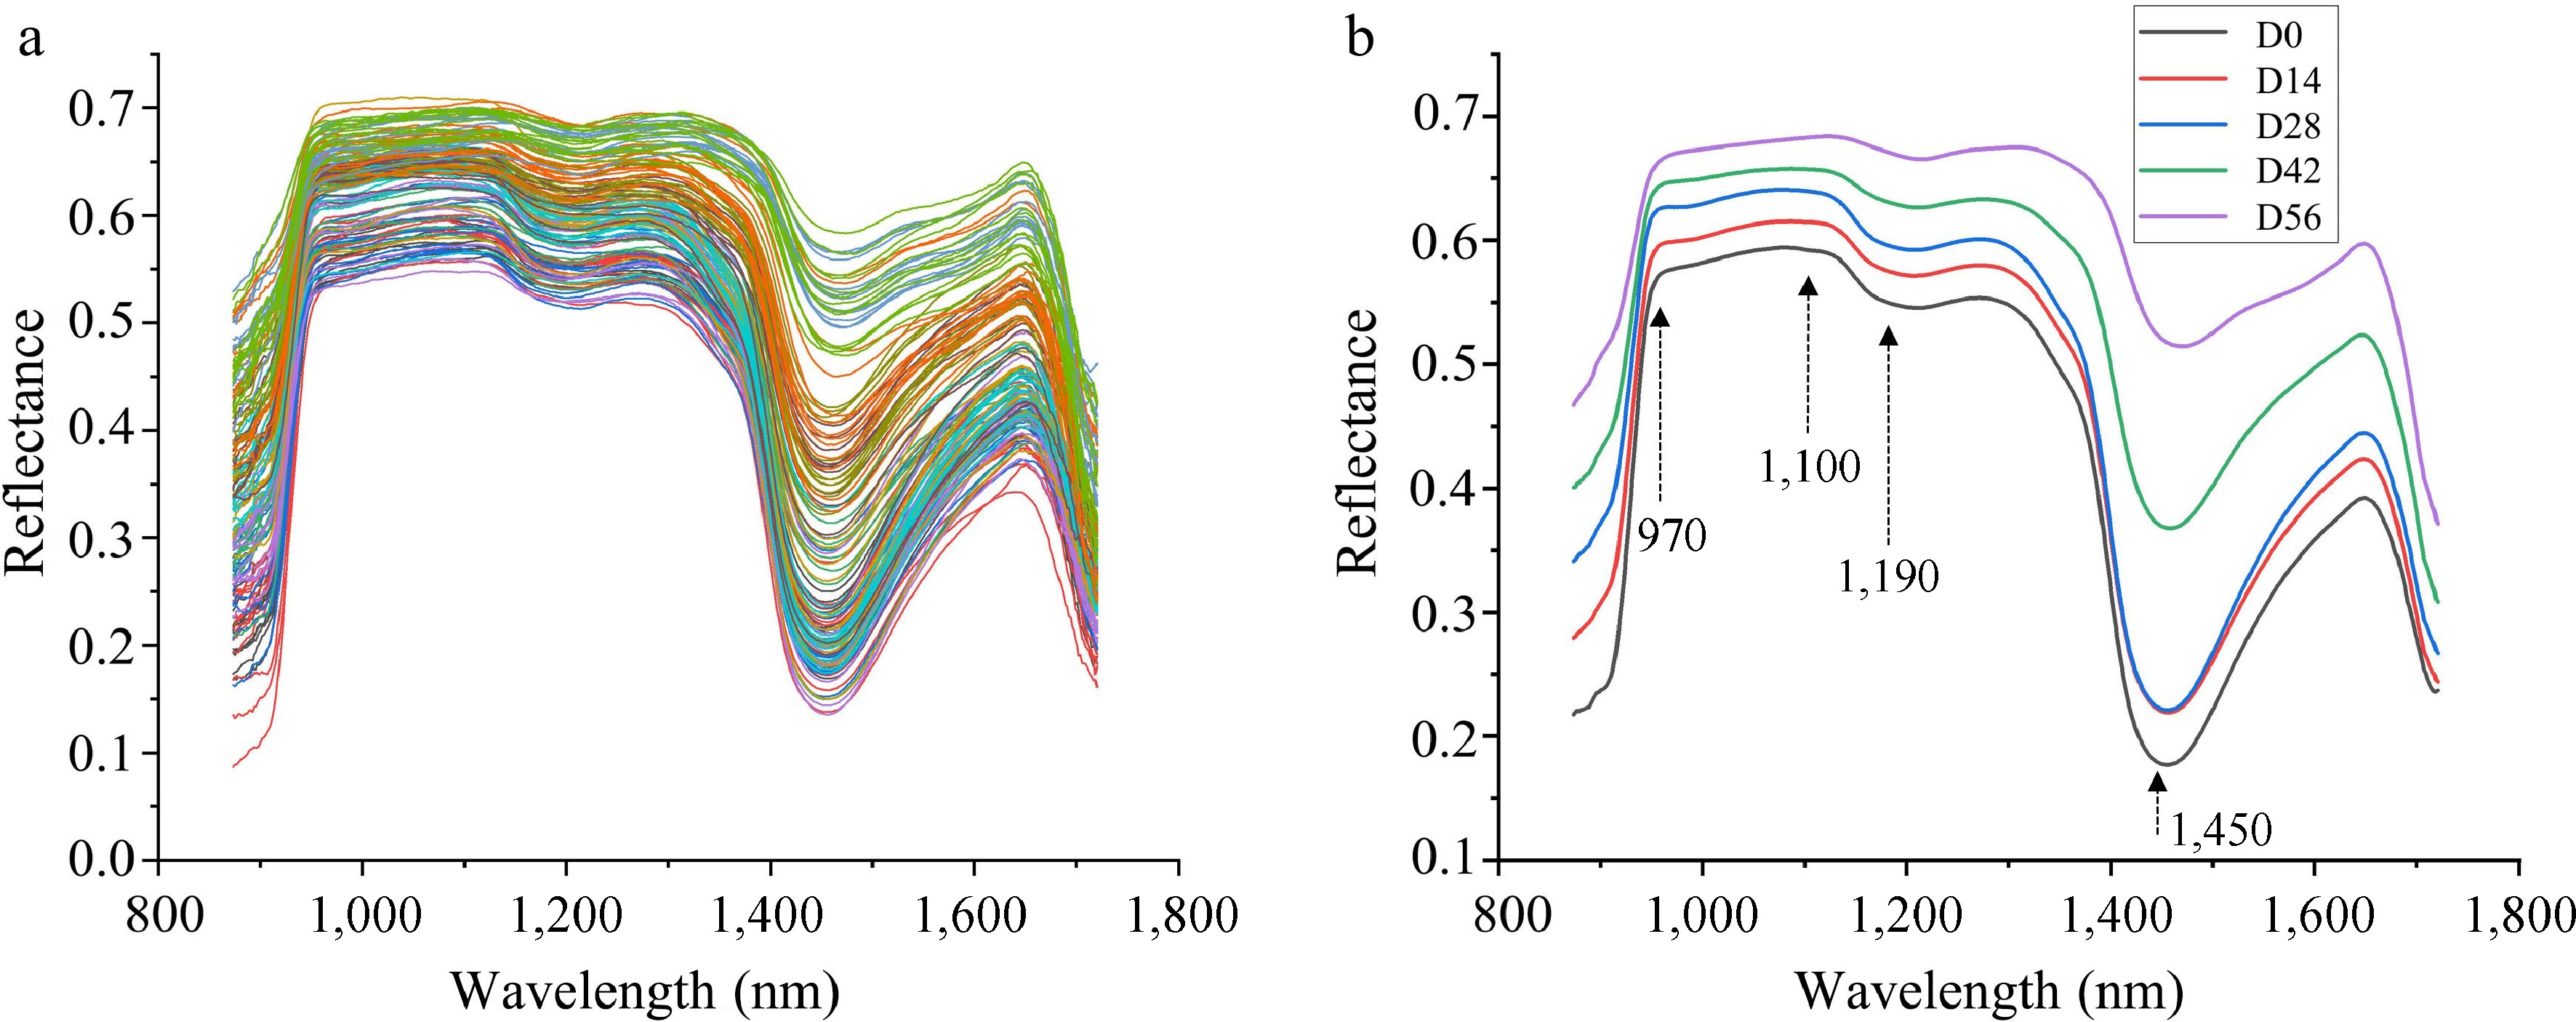
Figure 6.
(a) Raw reflectance curves and (b) average reflectance curves of Chinese fir seedlings with different LCC and LWC.
-
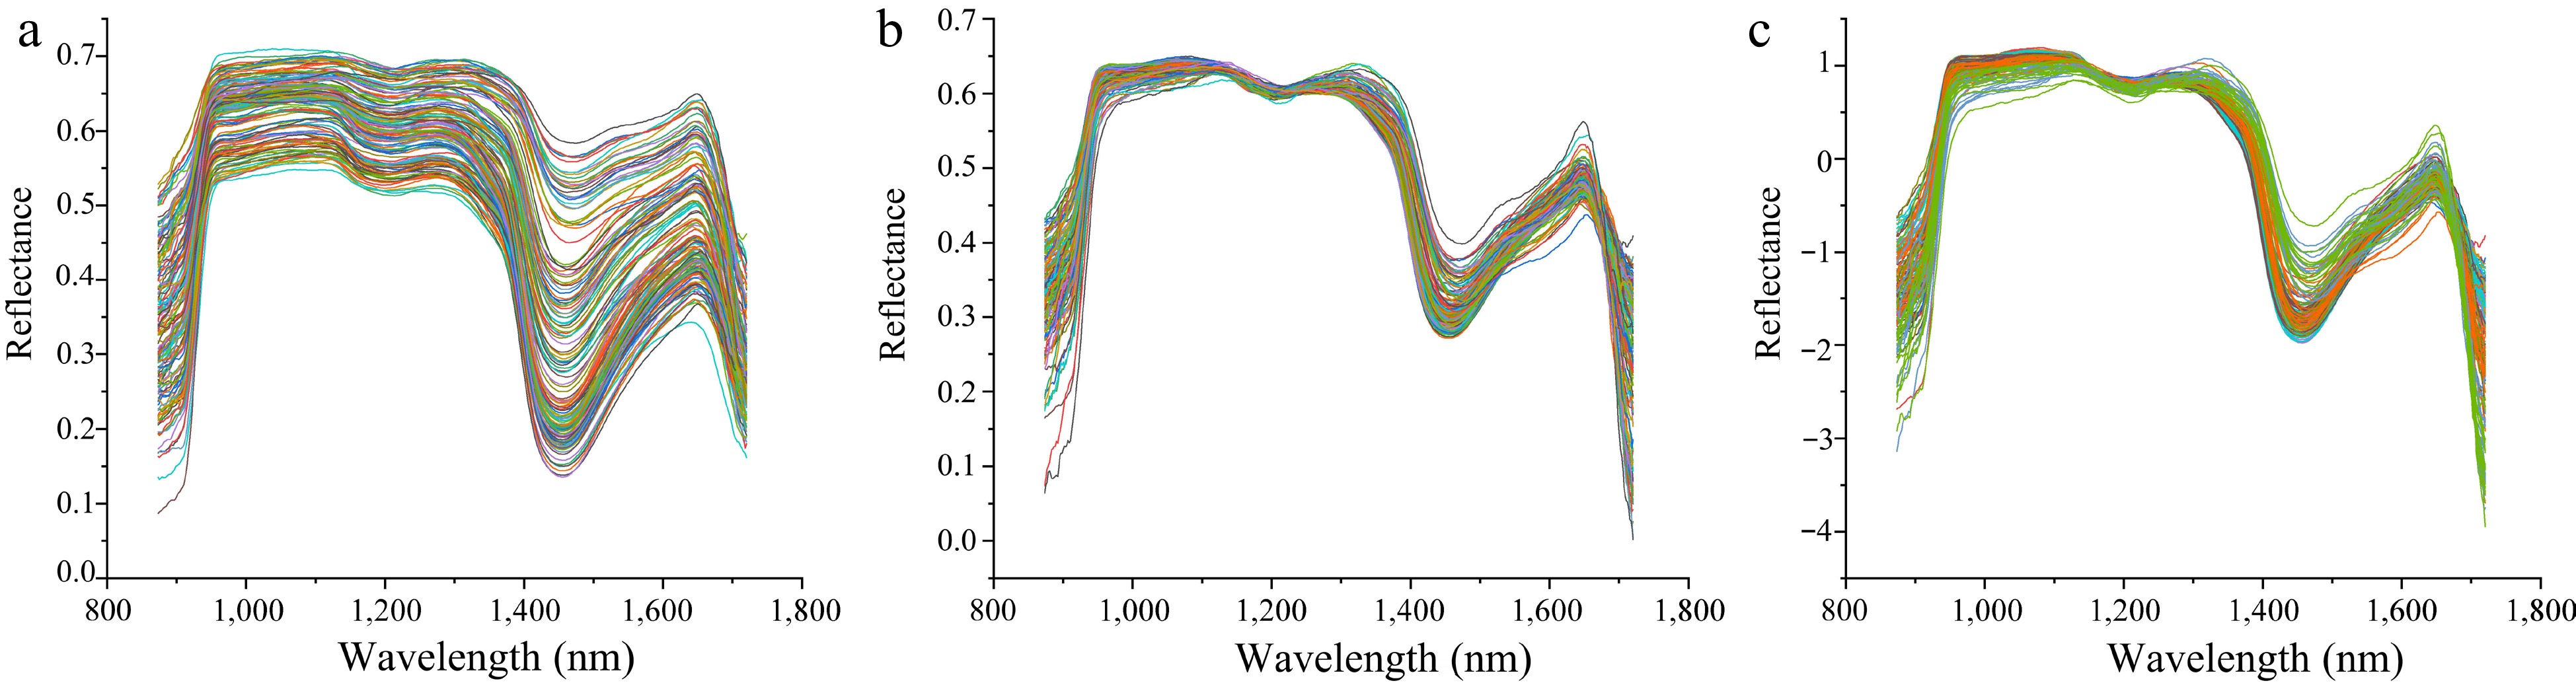
Figure 7.
Comparison of different preprocessing methods for hyperspectral data. (a) Hyperspectral data preprocessed by SG. (b) Hyperspectral data preprocessed by MSC. (c) Hyperspectral data preprocessed by SNV.
-
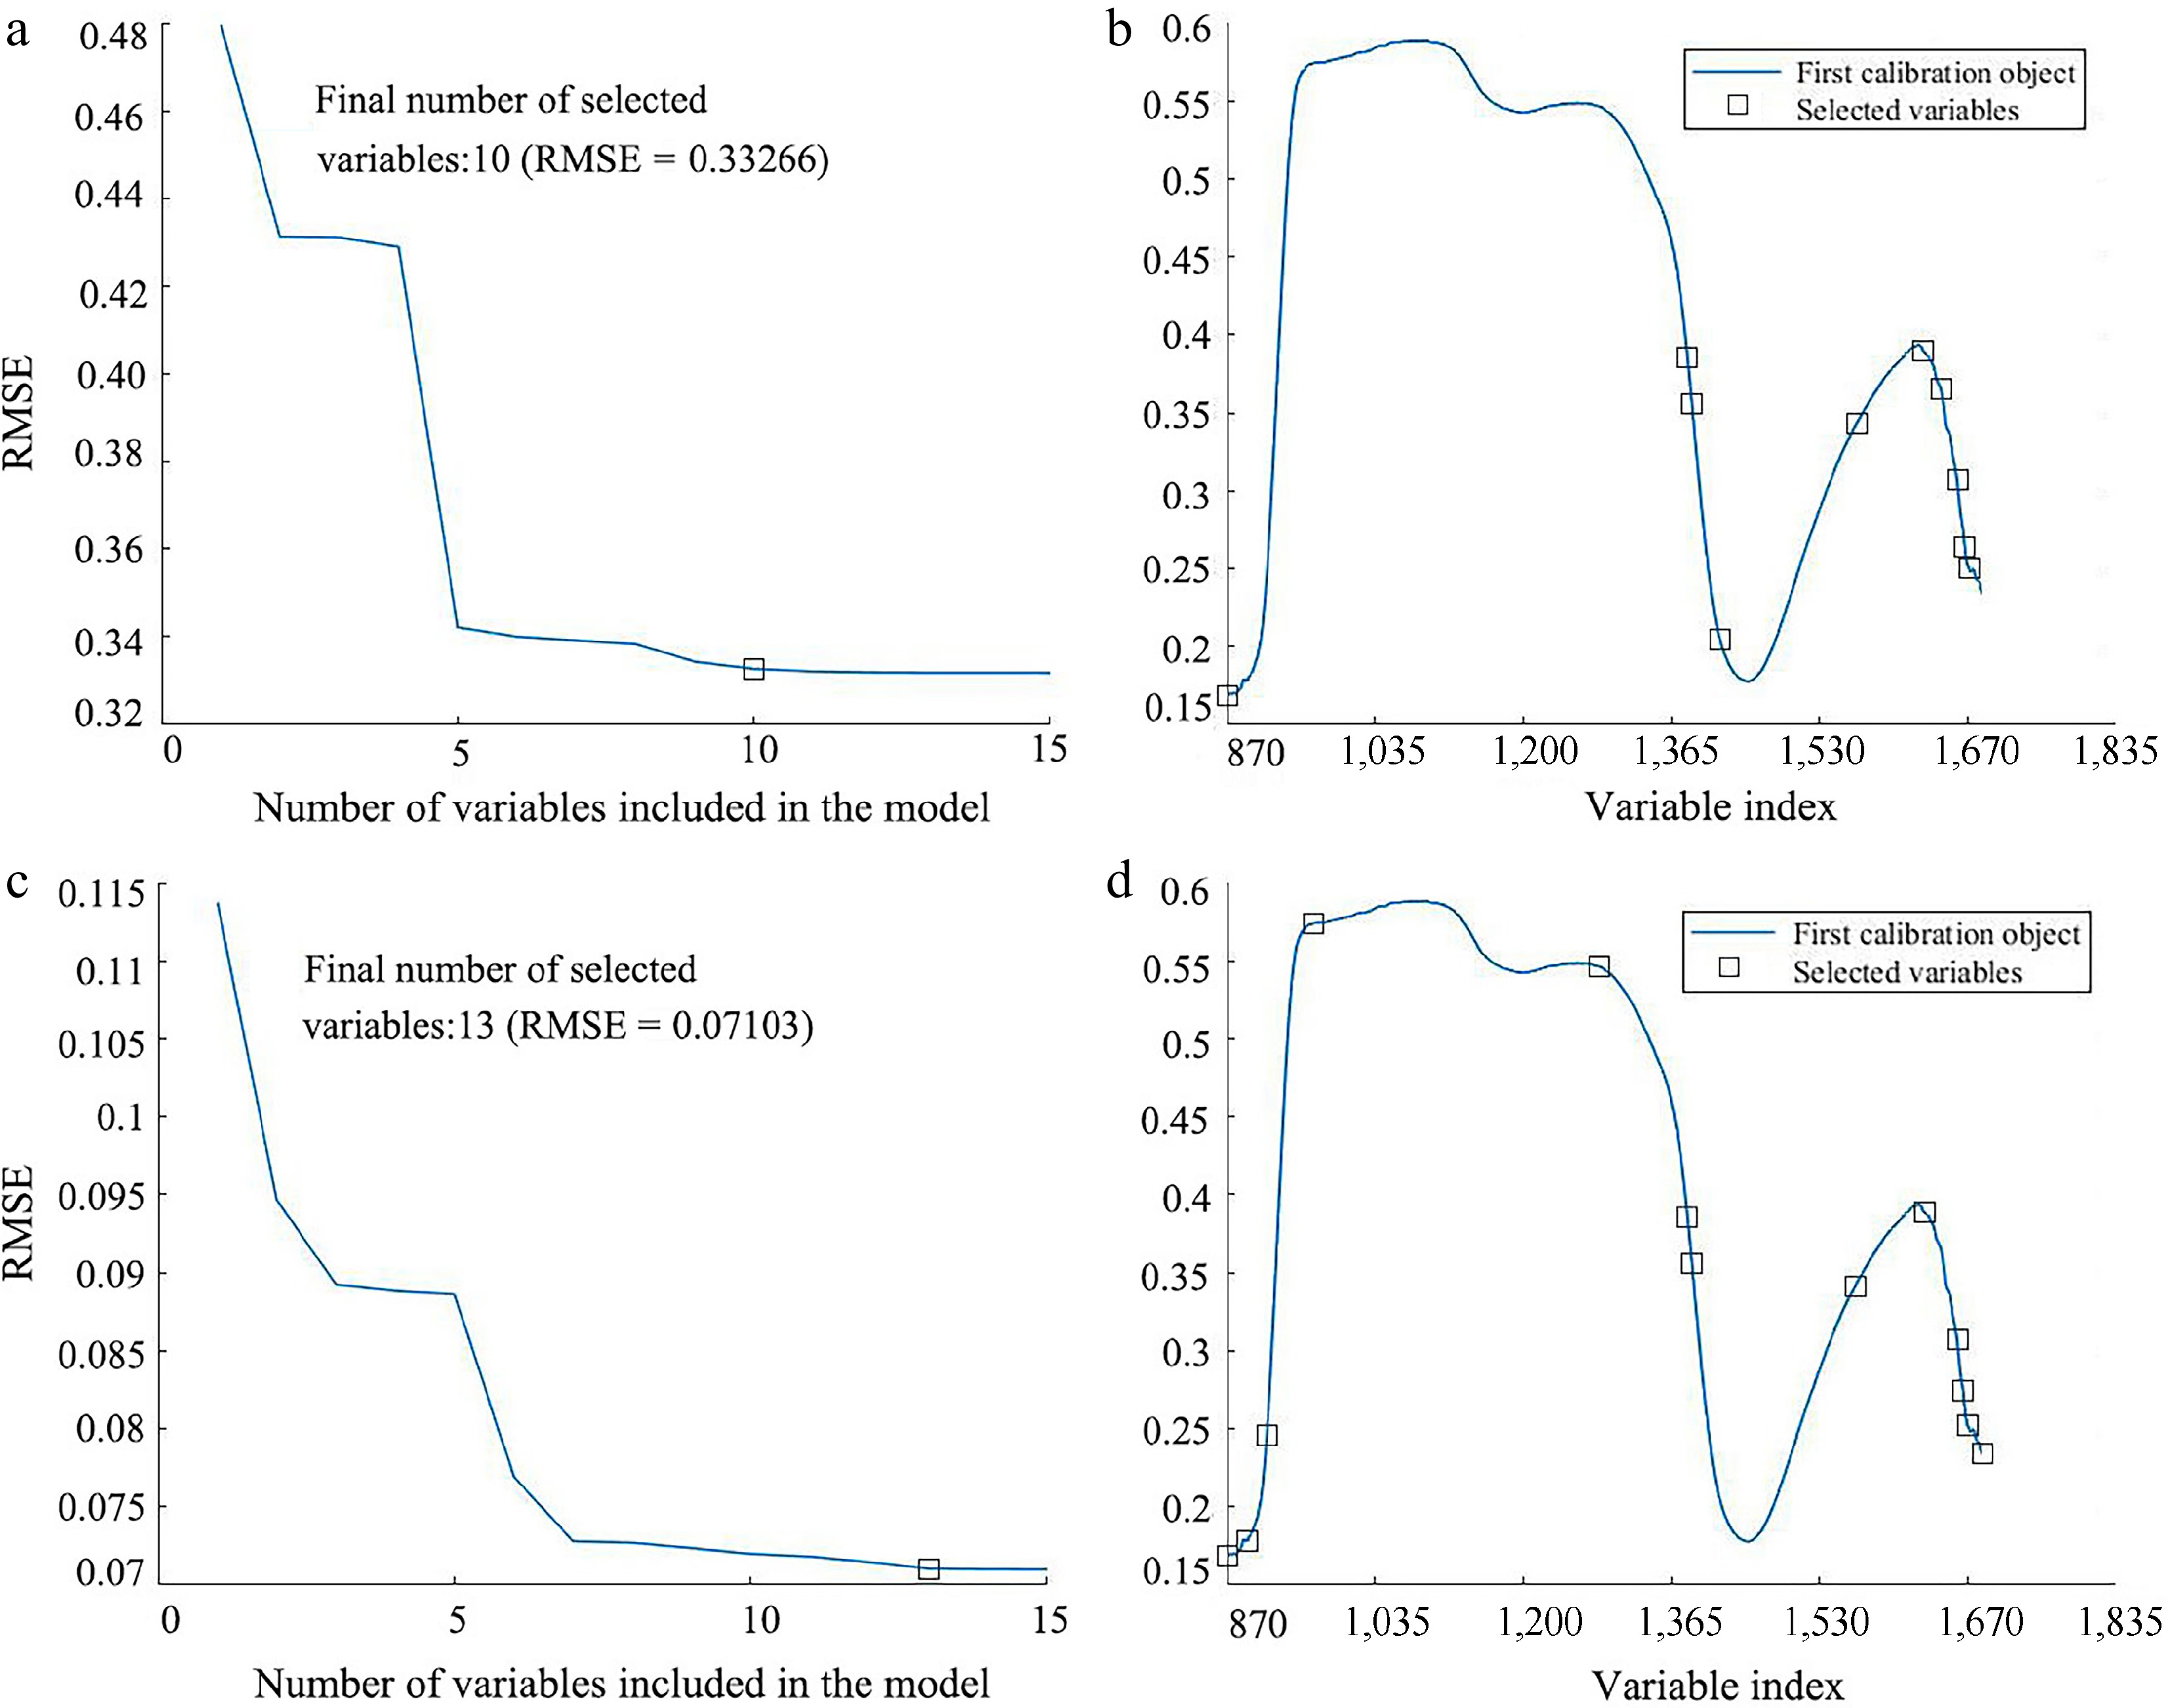
Figure 8.
Result of applying SPA wavelength selection on the SG pre-processed spectrum for predicting LCC and LWC. (a) Variation of RMSE vs the number of wavelengths, and (b) the selected wavelengths for LCC prediction. (c) Variation of RMSE vs the number of wavelengths, and (d) the selected wavelengths for LWC prediction.
-
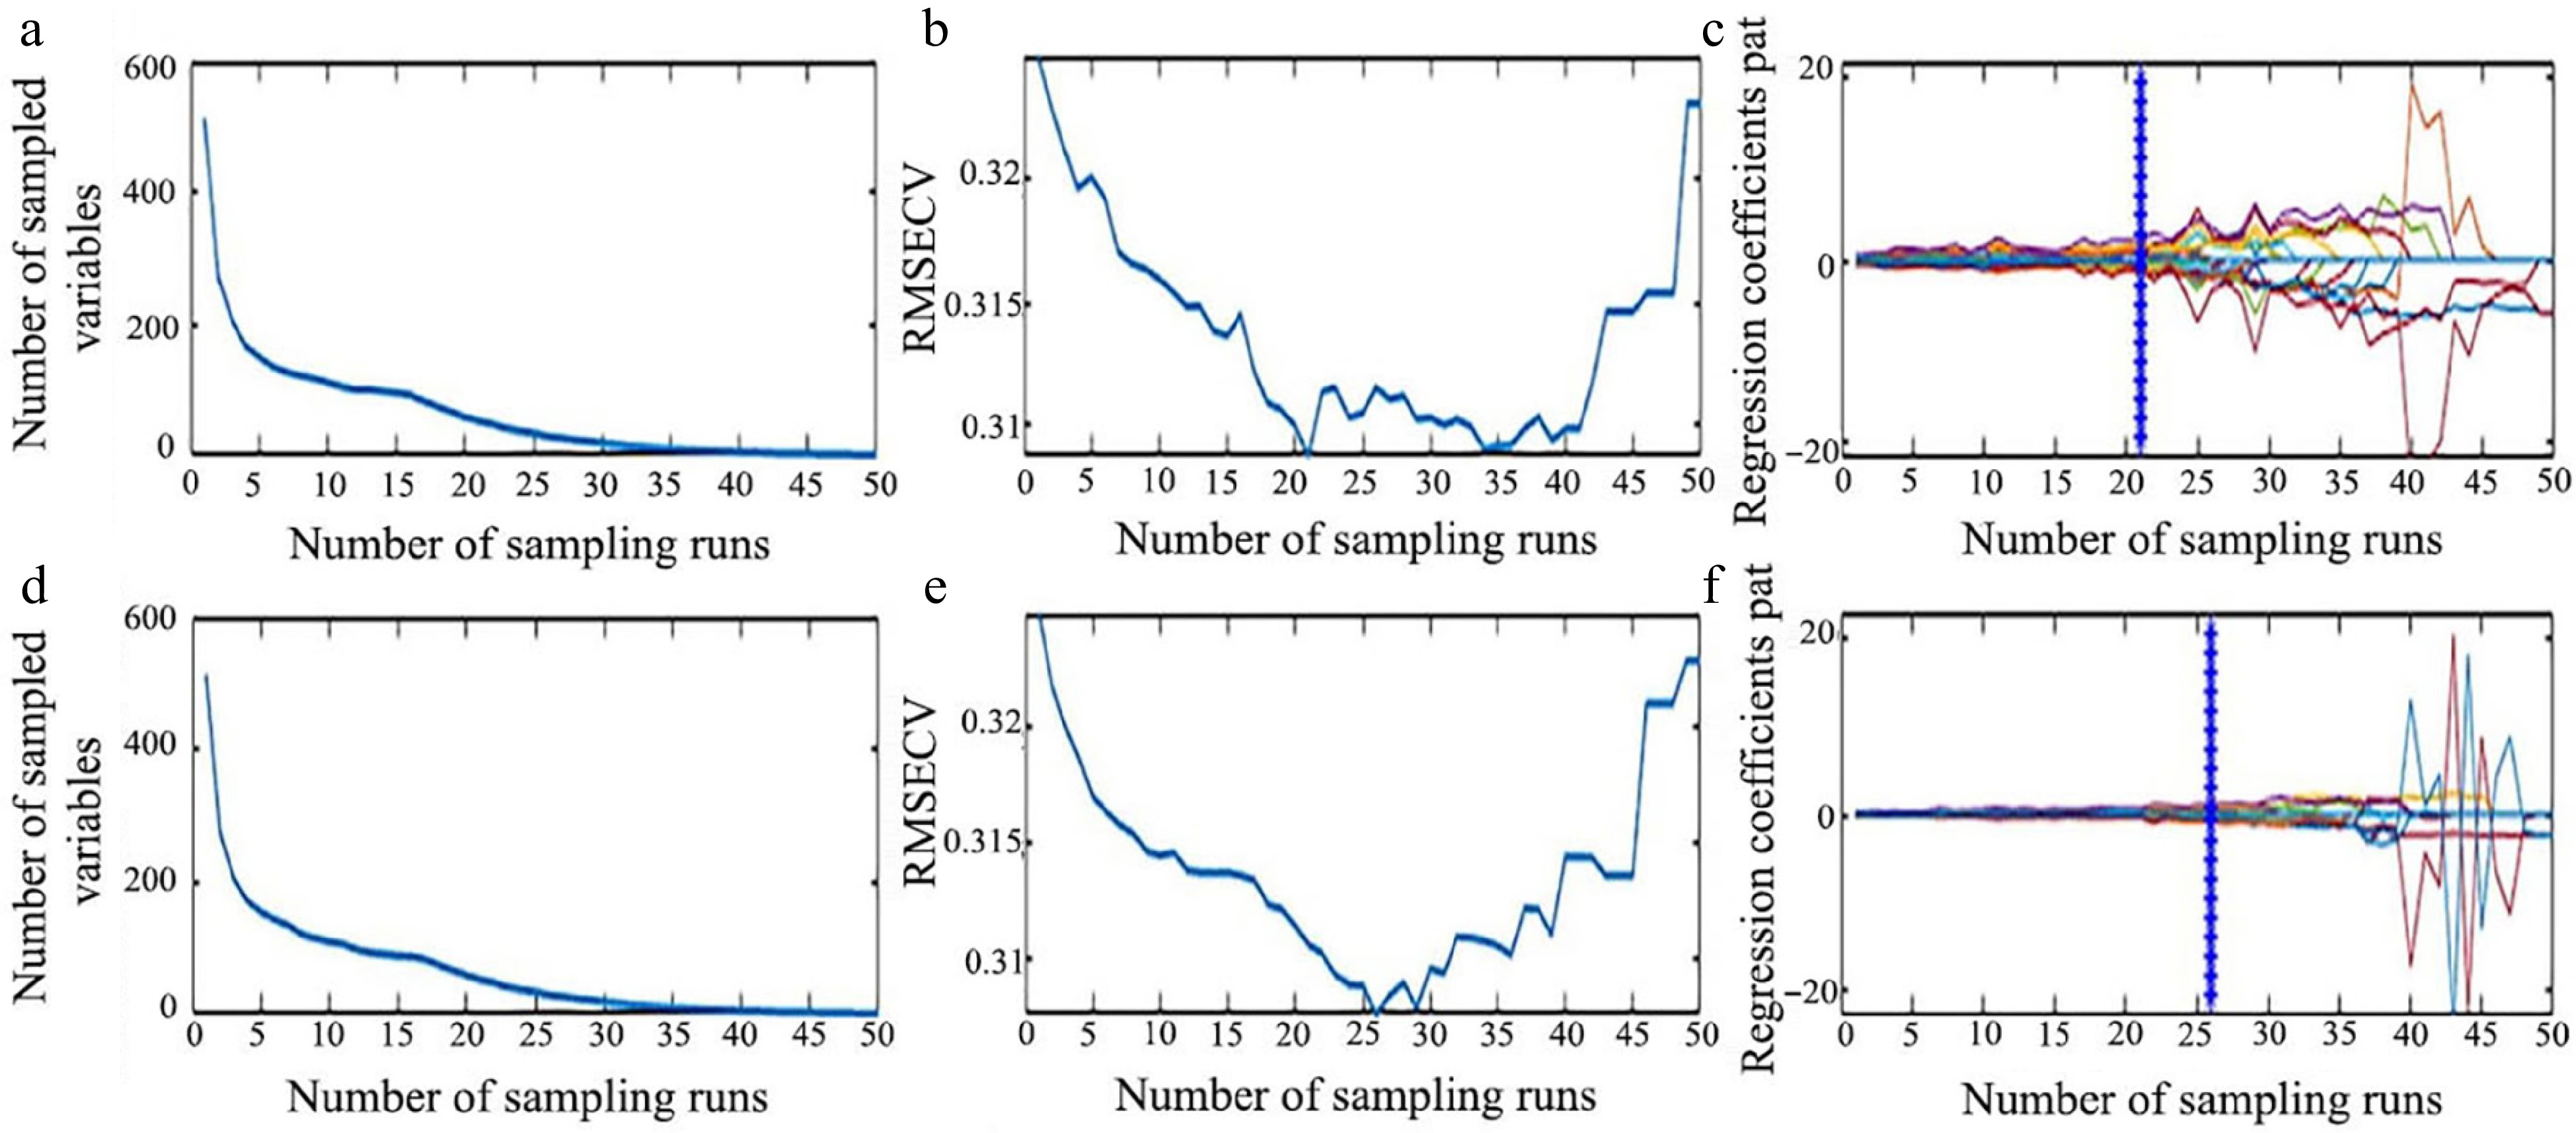
Figure 9.
Process of extracting characteristic wavelength by CARS. (a) Number of preferred characteristic wavelength variables, (b) the root mean square error of cross-validation variation, and (c) regression coefficient path map for LCC. (d) Number of preferred characteristic wavelength variables, (e) the root mean square error of cross-validation variation, and (f) regression coefficient path map for LWC.
-
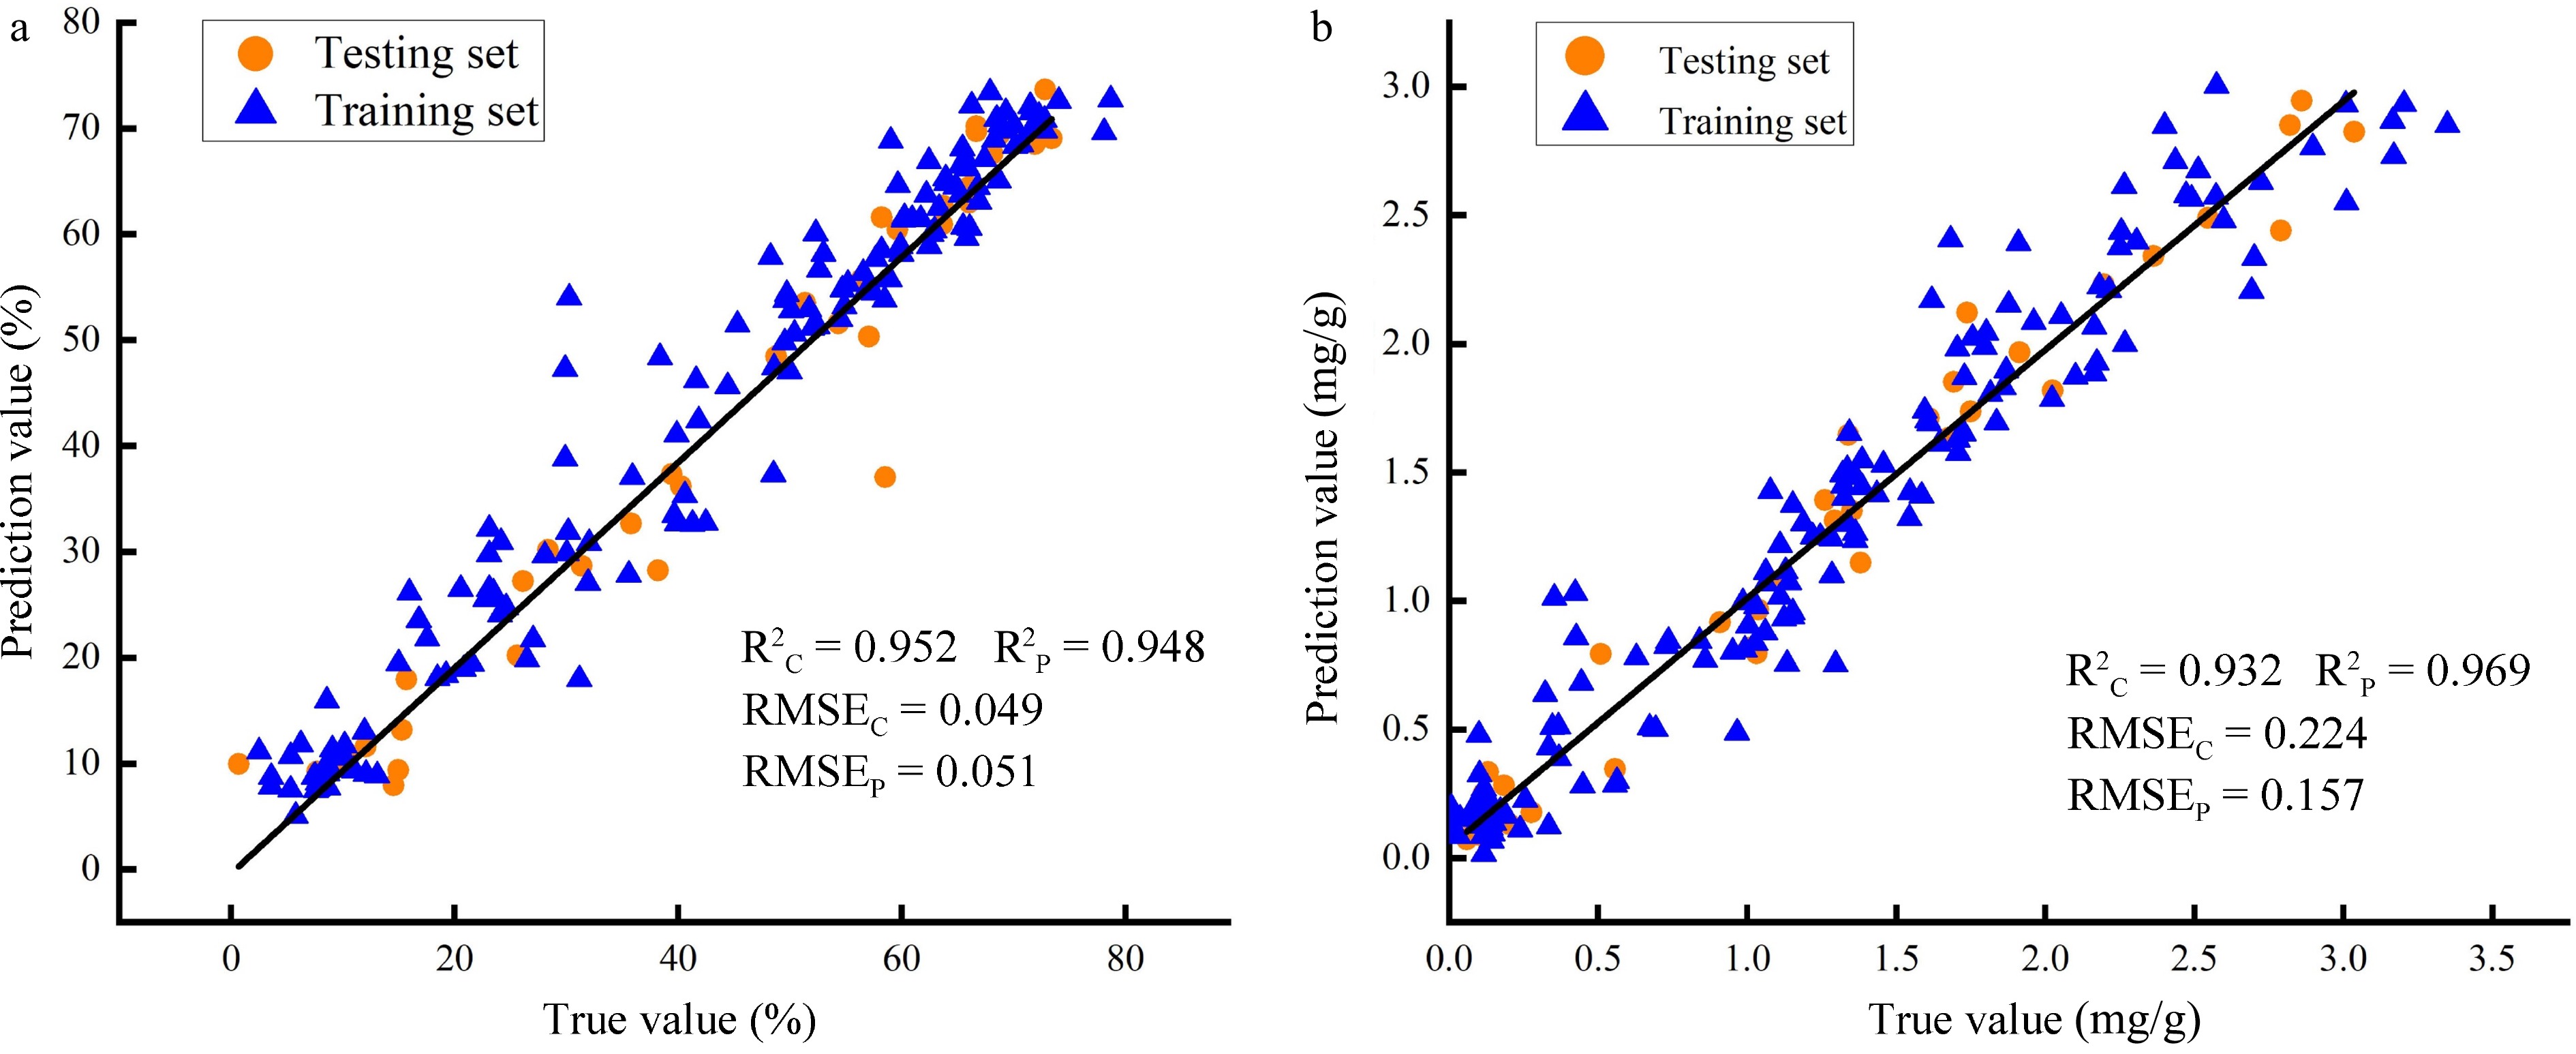
Figure 10.
Correlation analysis between true and prediction values. (a) Prediction accuracy of SPA-ANNs model for LWC; (b) Prediction accuracy of CARS-ANNs model for LCC.
-
Index Preprocessing Calibration set Prediction set R2C RMSEC R2P RMSEP LCC None 0.8943 0.2835 0. 8198 0.3268 MSC 0.8140 0.3654 0.7756 0.4405 SG 0.9166 0.2587 0.8616 0.3547 SNV 0.8322 0.3491 0.7135 0.5053 LWC None 0.9023 0.0540 0.8904 0.0771 MSC 0.8983 0.0694 0.7832 0.1027 SG 0.9350> 0.0552 0.9048 0.0661 SNV 0.9120 0.0459 0.8714 0.1073 Table 1.
Influence of different preprocessing methods on LCC and LWC prediction.
-
Selection method Index Number of feature bands Selected wavelengths (nm) SPA LCC 10 873.5, 1,387.6, 1,394.2, 1,425.7, 1,577.4, 1,651.4, 1,671.1, 1,689.2, 1,697.4, 1,702.3 LWC 13 873.5, 895.3, 917, 968.8, 1,289.9, 1,389.3, 1,394.2, 1,575.7, 1,653, 1,689.2, 1,695.8, 1,700.7, 1,702.3 CARS LCC 53 880.2, 881.9, 883.6, 885.3, 890.3, 953.8, 955.5, 957.1, 958.8, 962.2, 967.2, 1,137.2, 1,138.8, 1,142.2, 1,152.2, 1,153.8, 1,158.8, 1,162.1, 1,213.6, 1,225.3, 1,231.9, 1,233.6, 1,424, 1,430.6, 1,432.3, 1,433.9, 1,435.6, 1,542.8, 1,544.4, 1,546.1, 1,547.7, 1,549.4, 1,552.7, 1,557.6, 1,559.3, 1,560.9, 1,565.9, 1,567.5, 1,574.1, 1,580.7, 1,662.9, 1,664.6, 1,666.2, 1,669.5, 1,671.1, 1,672.8, 1,674.4, 1,676.1, 1,677.7, 1,684.3, 1,699, 1,700.7, 1,702.3 LWC 29 881.9, 883.6, 885.3, 958.8, 1,213.6, 1,231.9, 1,233.6, 1,427.3, 1,433.9, 1,435.6, 1,440.5, 1,549.4, 1,552.7, 1,554.3, 1,556, 1,557.6, 1,560.9, 1,562.6, 1,565.9, 1,567.5, 1,580.7, 1,664.6, 1,669.5, 1,671.1, 1,672.8, 1,674.4, 1,676.1, 1,700.7, 1,702.3 Table 2.
Characteristic wavelengths selected by SPA and CARS.
-
Index Model Number
of bandsCalibration set Prediction set R2C RMSEC R2P RMSEP LCC Full-PLSR 512 0.797 0.363 0.839 0.359 SPA-PLSR 10 0.804 0.360 0.842 0.354 CARS -PLSR 53 0.805 0.358 0.843 0.353 Full-SVM 512 0.830 0.350 0.820 0.392 SPA-SVM 10 0.812 0.380 0.770 0.450 CARS-SVM 53 0.830 0.360 0.820 0.397 Full-ANNs 512 0.930 0.240 0.870 0.349 SPA-ANNs 10 0.920 0.267 0.924 0.300 CARS-ANNs 53 0.932 0.224 0.969 0.157 LWC Full-PLSR 512 0.856 0.070 0.901 0.082 SPA-PLSR 13 0.804 0.360 0.842 0.354 CARS -PLSR 29 0.858 0.072 0.901 0.079 Full-SVM 512 0.873 0.079 0.930 0.060 SPA-SVM 13 0.850 0.090 0.920 0.062 CARS-SVM 29 0.858 0.078 0.929 0.063 Full-ANNs 512 0.954 0.187 0.873 0.348 SPA-ANNs 13 0.952 0.049 0.948 0.051 CARS-ANNs 29 0.952 0.050 0.940 0.058 Table 3.
The prediction results of LCC and LWC by PLSR, SVM and ANNs models full and selected wavelengths.
Figures
(10)
Tables
(3)