ARTICLE   Open Access    

Non-destructive estimation of needle leaf chlorophyll and water contents in Chinese fir seedlings based on hyperspectral reflectance spectra

  • # Authors contributed equally: Dong Xing, Penghui Sun

More Information
  • Received: 01 February 2024
    Revised: 11 June 2024
    Accepted: 13 June 2024
    Published online: 02 July 2024
    Forestry Research  4 Article number: e024 (2024)  |  Cite this article
  • Chinese fir is the most important native softwood tree in China and has significant economic and ecological value. Accurate assessment of the growth status is critical for both seedling cultivation and germplasm evaluation of this commercially significant tree. Needle leaf chlorophyll content (LCC) and needle leaf water content (LWC), which are determinants of plant health and photosynthetic efficiency, are important indicators of the growth status in plants. In this study, for the first time, the LCC and LWC of Chinese fir seedlings were estimated based on hyperspectral reflectance spectra and machine learning algorithms. A line-scan hyperspectral imaging system with a spectral range of 870 to 1,720 nm was used to capture hyperspectral images of seedlings with varying LCC and LWC. The spectral data of the canopy area of the seedlings were extracted and preprocessed using the Savitzky-Golay smoothing (SG) algorithm. Subsequently, the Successive Projection Algorithm (SPA) and Competitive Adaptive Reweighted Sampling (CARS) methods were employed to extract the most informative wavelengths. Moreover, SVM, PLSR and ANNs were utilized to construct models that predict LCC and LWC based on effective wavelengths. The results indicated that the CARS-ANNs were the best for predicting LCC, with R²C = 0.932, RSMEC = 0.224, and R²P = 0.969, RSMEP = 0.157. Similarly, the SPA-ANNs model exhibited the best prediction performance for LWC, with R²C = 0.952, RSMEC = 0.049, and R²P = 0.948, RSMEP = 0.051. In conclusion, the present study highlights the significant potential of combining hyperspectral imaging (HSI) with machine learning algorithms as a rapid, non-destructive, and highly accurate method for estimating LCC and LWC in Chinese fir.
  • Crops require a variety of nutrients for growth and nitrogen is particularly important. Nitrogen is the primary factor limiting plant growth and yield formation, and it also plays a significant role in improving product quality[14]. Nitrogen accounts for 1%−3% of the dry weight of plants and is a component of many compounds. For example, it is an important part of proteins, a component of nucleic acids, the skeleton of cell membranes, and a constituent of chlorophyll[5,6]. When the plant is deficient in nitrogen, the synthesis process of nitrogen-containing substances such as proteins decrease significantly, cell division and elongation are restricted, and chlorophyll content decreases, and this leads to short and thin plants, small leaves, and pale color[2,7,8]. If nitrogen in the plant is in excess, a large number of carbohydrates will be used for the synthesis of proteins, chlorophyll, and other substances, so that cells are large and thin-walled, and easy to be attacked by pests and diseases. At the same time, the mechanical tissues in the stem are not well developed and are prone to collapse[3,8,9]. Therefore, the development of new crop varieties with both high yields and improved nitrogen use efficiency (NUE) is an urgently needed goal for more sustainable agriculture with minimal nitrogen demand.

    Plants obtain inorganic nitrogen from the soil, mainly in the form of NH4+ and nitrate (NO3)[1013]. Nitrate uptake by plants occurs primarily in aerobic environments[3]. Transmembrane proteins are required for nitrate uptake from the external environment as well as for transport and translocation between cells, tissues, and organs. NITRATE TRANSPORTER PROTEIN 1 (NRT1)/PEPTIDE TRANSPORTER (PTR) family (NPF), NRT2, CHLORIDE CHANNEL (CLC) family, and SLOW ACTIVATING ANION CHANNEL are four protein families involved in nitrate transport[14]. One of the most studied of these is NRT1.1, which has multiple functions[14]. NRT1.1 is a major nitrate sensor, regulating many aspects of nitrate physiology and developmental responses, including regulating the expression levels of nitrate-related genes, modulating root architecture, and alleviating seed dormancy[1518].

    There is mounting evidence that plant growth and development are influenced by interactions across numerous phytohormone signaling pathways, including abscisic acid, gibberellins, growth hormones, and cytokinins[3,19,20]. To increase the effectiveness of plant nitrogen fertilizer application, it may be possible to tweak the signaling mediators or vary the content of certain phytohormones. Since the 1930s, research on the interplay between growth factors and N metabolism has also been conducted[3]. The Indole acetic acid (IAA) level of plant shoots is shown to decrease in early studies due to N shortage, although roots exhibit the reverse tendency[3,21]. In particular, low NO3 levels caused IAA buildup in the roots of Arabidopsis, Glycine max, Triticum aestivum, and Zea mays, indicating that IAA is crucial for conveying the effectiveness of exogenous nitrogen to the root growth response[20,22,23].

    Studies have shown that two families are required to control the expression of auxin-responsive genes: one is the Auxin Response Factor (ARF) and the other is the Aux/IAA repressor family[2426]. As the transcription factor, the ARF protein regulates the expression of auxin response genes by specifically binding to the TGTCNN auxin response element (AuxRE) in promoters of primary or early auxin response genes[27]. Among them, rice OsARF18, as a class of transcriptional repressor, has been involved in the field of nitrogen utilization and yield[23,28]. In rice (Oryza sativa), mutations in rice salt tolerant 1 (rst1), encoding the OsARF18 gene, lead to the loss of its transcriptional repressor activity and up-regulation of OsAS1 expression, which accelerates the assimilation of NH4+ to Asn and thus increases N utilization[28]. In addition, dao mutant plants deterred the conversion of IAA to OxIAA, thus high levels of IAA strongly activates OsARF18, which subsequently represses the expression of OsARF2 and OsSUT1 by directly binding to the AuxRE and SuRE promoter motifs, resulting in the inhibition of carbohydrate partitioning[23]. As a result, rice carrying the dao has low yields.

    Apples (Malus domestica) are used as a commercially important crop because of their high ecological adaptability, high nutritional value, and annual availability of fruit[29]. To ensure high apple yields, growers promote rapid early fruit yield growth by applying nitrogen. However, the over-application of nitrogen fertilizer to apples during cultivation also produces common diseases and the over-application of nitrogen fertilizer is not only a waste of resources but also harmful to the environment[29]. Therefore, it is of great significance to explore efficient nitrogen-regulated genes to understand the uptake and regulation of nitrogen fertilizer in apples, and to provide reasonable guidance for nitrogen application during apple production[30]. In this study, MdARF18 is identified which is a key transcription factor involved in nitrate uptake and transport in apples and MdARF18 reduces NO3 uptake and assimilation. Further analysis suggests that MdRF18 may inhibit the transcriptional level of MdNRT1.1 promoter by directly binding to its TGTCTT target, thus affecting normal plant growth.

    The protein sequence of apple MdARF18 (MD07G1152100) was obtained from The Apple Genome (https://iris.angers.inra.fr/gddh13/). Mutant of arf18 (GABI_699B09) sequence numbers were obtained from the official TAIR website (www.arabidopsis.org). The protein sequences of ARF18 from different species were obtained from the protein sequence of apple MdARF18 on the NCBI website. Using these data, a phylogenetic tree with reasonably close associations was constructed[31].

    Protein structural domain prediction of ARF18 was performed on the SMART website (https://smart.embl.de/). Motif analysis of ARF18 was performed by MEME (https://meme-suite.org/meme/tools/meme). Clustal was used to do multiple sequence comparisons. The first step was accessing the EBI web server through the Clustal Omega channel. The visualization of the results was altered using Jalview, which may be downloaded from www.jalview.org/download.[32]

    The apple 'Orin' callus was transplanted on MS medium containing 1.5 mg·L−1 6-benzylaminopurine (6-BA) and 0.5 mg·L−1 2,4 dichlorophenoxyacetic acid (2,4-D) at 25 °C, in the dark, at 21-d intervals. 'Royal Gala' apple cultivars were cultured in vermiculite and transplanted at 25 °C every 30 d. The Arabidopsis plants used were of the Columbia (Col-0) wild-type variety. Sowing and germinating Arabidopsis seeds on MS nutrient medium, and Arabidopsis seeds were incubated and grown at 25 °C (light/dark cycle of 16 h/8 h)[33].

    The nutrient solution in the base contained 1.0 mM CaCl2, 1.0 mM KH2PO4, 1.0 mM MgSO4, 0.1 mM FeSO4·7H2O 0.1 mM Na2EDTA·2H2O, 50 μM MnSO4·H2O, 50 μM H3BO3, 0.05 μM CuSO4·5H2O, 0.5 μM Na2MoO4·2H2O, 15 μM ZnSO4·7H2O, 2.5 μM KI, and 0.05 μM CoCl·6H2O, and 0.05 μM CoCl·6H2O, and 0.05 μM CoCl· 6H2O. 2H2O, 15 μM ZnSO4·7H2O, 2.5 μM KI and 0.05 μM CoCl·6H2O, and 0.05 μM CoCl·6H2O, supplemented with 0.5 mM, 2 mM, and 10 mM KNO3 as the sole nitrogen source, and added with the relevant concentrations of KCl to maintain the same K concentration[33,34].

    For auxin treatment, 12 uniformly growing apple tissue-cultured seedlings (Malus domestica 'Royal Gala') were selected from each of the control and treatment groups, apple seedlings were incubated in a nutrient solution containing 1.5 mg·L−1 6-BA, 0.2 mg·L−1 naphthalene acetic acid, and IAA (10 μM) for 50 d, and then the physiological data were determined. Apple seedlings were incubated and grown at 25 °C (light/dark cycle of 16 h/8 h).

    For nitrate treatment, Arabidopsis seedlings were transferred into an MS medium (containing different concentrations of KNO3) as soon as they germinated to test root development. Seven-day-old Arabidopsis were transplanted into vermiculite and then treated with a nutrient solution containing different concentrations of KNO3 (0.5, 2, 10 mM) and watered at 10-d intervals. Apple calli were treated with medium containing 1.5 mg·L−1 6-BA, 0.5 mg·L−1 2,4-D, and varying doses of KNO3 (0.5, 2, and 10 mM) for 25 d, and samples were examined for relevant physiological data. Apple calli were subjected to the same treatment for 1 d for GUS staining[35].

    To obtain MdARF18 overexpression materials, the open reading frame (ORF) of MdARF18 was introduced into the pRI-101 vector. To obtain pMdNRT1.1 material, the 2 kb segment located before the transcription start site of MdNRT1.1 was inserted into the pCAMBIA1300 vector. The Agrobacterium tumefaciens LBA4404 strain was cultivated in lysozyme broth (LB) medium supplemented with 50 mg·L−1 kanamycin and 50 mg·L−1 rifampicin. The MdARF18 overexpression vector and the ProMdNRT1.1::GUS vector were introduced into Arabidopsis and apple callus using the flower dip transformation procedure. The third-generation homozygous transgenic Arabidopsis (T3) and transgenic calli were obtained[36]. Information on the relevant primers designed is shown in Supplemental Table S1.

    Plant DNA and RNA were obtained using the Genomic DNA Kit and the Omni Plant RNA Kit (tDNase I) (Tiangen, Beijing, China)[37].

    cDNA was synthesized for qPCR by using the PrimeScript First Strand cDNA Synthesis Kit (Takara, Dalian, China). The cDNA for qPCR was synthesized by using the PrimeScript First Strand cDNA Synthesis Kit (Takara, Dalian, China). Quantitative real-time fluorescence analysis was performed by using the UltraSYBR Mixture (Low Rox) kit (ComWin Biotech Co. Ltd., Beijing, China). qRT-PCR experiments were performed using the 2−ΔΔCᴛ method for data analysis. The data were analyzed by the 2−ΔΔCᴛ method[31].

    GUS staining buffer contained 1 mM 5-bromo-4-chloro-3-indolyl-β-glutamic acid, 0.01 mM EDTA, 0.5 mM hydrogen ferrocyanide, 100 mM sodium phosphate (pH 7.0), and 0.1% (v/v) Triton X-100 was maintained at 37 °C in the dark. The pMdNRT1.1::GUS construct was transiently introduced into apple calli. To confirm whether MdNRT1.1 is activated or inhibited by MdARF18, we co-transformed 35S::MdARF18 into pMdNRT1.1::GUS is calling. The activity of transgenic calli was assessed using GUS labeling and activity assays[33,38].

    The specimens were crushed into fine particles, combined with 1 mL of ddH2O, and thereafter subjected to a temperature of 100 °C for 30 min. The supernatant was collected in a flow cell after centrifugation at 12,000 revolutions per minute for 10 min. The AutoAnalyzer 3 continuous flow analyzer was utilized to measure nitrate concentrations. (SEAL analytical, Mequon, WI, USA). Nitrate reductase (NR) activity was characterized by the corresponding kits (Solarbio Life Science, Beijing, China) using a spectrophotometric method[31].

    Y1H assays were performed as previously described by Liu et al.[39]. The coding sequence of MdARF18 was integrated into the pGADT7 expression vector, whereas the promoter region of MdNRT1.1 was included in the pHIS2 reporter vector. Subsequently, the constitutive vectors were co-transformed into the yeast monohybrid strain Y187. The individual transformants were assessed on a medium lacking tryptophan, leucine, and histidine (SDT/-L/-H). Subsequently, the positive yeast cells were identified using polymerase chain reaction (PCR). The yeast strain cells were diluted at dilution factors of 10, 100, 1,000, and 10,000. Ten μL of various doses were added to selective medium (SD-T/-L/-H) containing 120 mM 3-aminotriazole (3-AT) and incubated at 28 °C for 2−3 d[37].

    Dual-luciferase assays were performed as described previously[40]. Full-length MdARF18 was cloned into pGreenII 62-SK to produce MdARF18-62-SK. The promoter fragment of MdNRT1.1 was cloned into pGreenII 0800-LUC to produce pMdNRT1.1-LUC. Different combinations were transformed into Agrobacterium tumefaciens LBA4404 and the Agrobacterium solution was injected onto the underside of the leaves of tobacco (Nicotiana benthamiana) leaves abaxially. The Dual Luciferase Reporter Kit (Promega, www.promega.com) was used to detect fluorescence activity.

    Total protein was extracted from wild-type and transgenic apple calli with or without 100 μM MG132 treatment. The purified MdARF18-HIS fusion protein was incubated with total protein[41]. Samples were collected at the indicated times (0, 1, 3, 5, and 7 h).

    Protein gel blots were analyzed using GST antibody. ACTIN antibody was used as an internal reference. All antibodies used in this study were provided by Abmart (www.ab-mart.com).

    Unless otherwise noted, every experiment was carried out independently in triplicate. A one-way analysis of variance (ANOVA) was used to establish the statistical significance of all data, and Duncan's test was used to compare results at the p < 0.05 level[31].

    To investigate whether auxin affects the effective uptake of nitrate in apple, we first externally applied IAA under normal N (5 mM NO3) environment, and this result showed that the growth of Gala apple seedlings in the IAA-treated group were better than the control, and their fresh weights were heavier than the control group (Fig. 1a, d). The N-related physiological indexes of apple seedlings also showed that the nitrate content and NR activity of the root part of the IAA-treated group were significantly higher than the control group, while the nitrate content and NR activity of the shoot part were lower than the control group (Fig. 1b, c). These results demonstrate that auxin could promote the uptake of nitrate and thus promotes growth of plants.

    Figure 1.  Auxin enhances nitrate uptake of Gala seedlings. (a) Phenotypes of apple (Malus domestica 'Royal Gala') seedlings grown nutritionally for 50 d under IAA (10 μM) treatment. (b) Nitrate content of shoot and root apple (Malus domestica 'Royal Gala') seedlings treated with IAA. (c) NR activity in shoot and root of IAA treatment apple (Malus domestica 'Royal Gala') seedlings. (d) Seedling fresh weight under IAA treatment. Bars represent the mean ± SD (n = 3). Different letters above the bars indicate significant differences using the LSD test (p < 0.05).

    To test whether auxin affects the expression of genes related to nitrogen uptake and metabolism. For the root, the expression levels of MdNRT1.1, MdNRT2.1, MdNIA1, MdNIA2, and MdNIR were higher than control group (Supplemental Fig. S1a, f, hj), while the expression levels of MdNRT1.2, MdNRT1.6 and MdNRT2.5 were lower than control group significantly (Supplemental Fig. S1b, d, g). For the shoot, the expression of MdNRT1.1, MdNRT1.5, MdNRT1.6, MdNRT1.7, MdNRT2.1, MdNRT2.5, MdNIA1, MdNIA2, and MdNIR genes were significantly down-regulated (Supplemental Fig. S1a, cj). This result infers that the application of auxin could mediate nitrate uptake in plants by affecting the expression levels of relevant nitrate uptake and assimilation genes.

    Since the auxin signaling pathway requires the regulation of the auxin response factors (ARFs)[25,27], it was investigated whether members of ARF genes were nitrate responsive. Firstly, qPCR quantitative analysis showed that the five subfamily genes of MdARFs (MdARF9, MdARF2, MdARF12, MdARF3, and MdARF18) were expressed at different levels in various organs of the plant (Supplemental Fig. S2). Afterward, the expression levels of five ARF genes were analyzed under different concentrations of nitrate treatment (Fig. 2), and it was concluded that these genes represented by each subfamily responded in different degrees, but the expression level of MdARF18 was up-regulated regardless of low or high nitrogen (Fig. 2i, j), and the expression level of MdARF18 showed a trend of stable up-regulation under IAA treatment (Supplemental Fig. S3). The result demonstrates that MdARFs could affect the uptake of external nitrate by plants and MdARF18 may play an important role in the regulation of nitrate uptake.

    Figure 2.  Relative expression analysis of MdARFs subfamilies in response to different concentrations of nitrate. Expression analysis of representative genes from five subfamilies of MdARF transcription factors. Bars represent the mean ± SD (n = 3). Different letters above the bars indicate significant differences using the LSD test (p < 0.05).

    MdARF18 (MD07G1152100) was predicted through The Apple Genome website (https://iris.angers.inra.fr/gddh13/) and it had high fitness with AtARF18 (AT3G61830). The homologs of ARF18 from 15 species were then identified in NCBI (www.ncbi.nlm.nih.gov) and then constructed an evolutionary tree (Supplemental Fig. S4). The data indicates that MdARF18 was most closely genetically related to MbARF18 (Malus baccata), indicating that they diverged recently in evolution (Supplemental Fig. S4). Conserved structural domain analyses indicated that all 15 ARF18 proteins had highly similar conserved structural domains (Supplemental Fig. S5). In addition, multiple sequence alignment analysis showed that all 15 ARF18 genes have B3-type DNA-binding domains (Supplemental Fig. S6), which is in accordance with the previous reports on ARF18 protein structure[26].

    To explore whether MdARF18 could affect the development of the plant's root system. Firstly, MdARF18 was heterologously expressed into Arabidopsis, and an arf18 mutant (GABI_699B09) Arabidopsis was also obtained (Supplemental Fig. S7). Seven-day-old MdARF18 transgenic Arabidopsis and arf18 mutants were treated in a medium with different nitrate concentrations for 10 d (Fig. 3a, b). After observing results, it was found that under the environment of high nitrate concentration, the primary root of MdARF18 was shorter than arf18 and wild type (Fig. 3c), and the primary root length of arf18 is the longest (Fig. 3c), while there was no significant difference in the lateral root (Fig. 3d). For low nitrate concentration, there was no significant difference in the length of the primary root, and the number of lateral roots of MdARF18 was slightly more than wild type and arf18 mutant. These results suggest that MdARF18 affects root development in plants. However, in general, low nitrate concentrations could promote the transport of IAA by NRT1.1 and thus inhibit lateral root production[3], so it might be hypothesized that MdARF18 would have some effect on MdNRT1.1 thus leading to the disruption of lateral root development.

    Figure 3.  MdARF18 inhibits root development. (a) MdARF18 inhibits root length at 10 mM nitrate concentration. (b) MdARF18 promotes lateral root growth at 0.5 mM nitrate concentration. (c) Primary root length statistics. (d) Lateral root number statistics. Bars represent the mean ± SD (n = 3). Different letters above the bars indicate significant differences using the LSD test (p < 0.05).

    To investigate whether MdARF18 affects the growth of individual plants under different concentrations of nitrate, 7-day-old overexpression MdARF18, and arf18 mutants were planted in the soil and incubated for 20 d. It was found that arf18 had the best growth of shoot, while MdARF18 had the weakest shoot growth at any nitrate concentration (Fig. 4a). MdARF18 had the lightest fresh weight and the arf18 mutant had the heaviest fresh weight (Fig. 4b). N-related physiological indexes revealed that the nitrate content and NR activity of arf18 were significantly higher than wild type, whereas MdARF18 materials were lower than wild type (Fig. 4c, d). More detail, MdARF18 had the lightest fresh weight under low and normal nitrate, while the arf18 mutant had the heaviest fresh weight, and the fresh weight of arf18 under high nitrate concentration did not differ much from the wild type (Fig. 4b). Nitrogen-related physiological indexes showed that the nitrate content of arf18 was significantly higher than wild type, while MdARF18 was lower than wild type. The NR activity of arf18 under high nitrate did not differ much from the wild type, but the NR activity of MdARF18 was the lowest in any treatment (Fig. 4c, d). These results indicate that MdARF18 significantly inhibits plant growth by inhibiting plants to absorb nitrate, and is particularly pronounced at high nitrate concentrations.

    Figure 4.  Ectopic expression of MdARF18 inhibits Arabidopsis growth. (a) Status of Arabidopsis growth after one month of incubation at different nitrate concentrations. (b) Fresh weight of Arabidopsis. (c) Nitrate content of Arabidopsis. (d) NR activity in Arabidopsis. Bars represent the mean ± SD (n = 3). Different letters above the bars indicate significant differences using the LSD test (p < 0.05).

    In addition, to further validate this conclusion, MdARF18 overexpression calli were obtained and treated with different concentrations of nitrate (Supplemental Fig. S8). The results show that the growth of overexpressed MdARF18 was weaker than wild type in both treatments (Supplemental Fig. S9a). The fresh weight of MdARF18 was significantly lighter than wild type (Supplemental Fig. S9b), and its nitrate and NR activity were lower than wild type (Supplemental Fig. S9c, d), which was consistent with the above results (Fig. 4). This result further confirms that MdARF18 could inhibit the development of individual plants by inhibiting the uptake of nitrate.

    Nitrate acts as a signaling molecule that takes up nitrate by activating the NRT family as well as NIAs and NIR[3,34]. To further investigate the pathway by which MdARF18 inhibits plant growth and reduces nitrate content, qRT-PCR was performed on the above plant materials treated with different concentrations of nitrate (Fig. 5). The result shows that the expression levels of AtNRT1.1, AtNIA1, AtNIA2, and AtNIR were all down-regulated in overexpression of MdARF18, and up-regulated in the arf18 mutant (Fig. 5a, hj). There was no significant change in AtNRT1.2 at normal nitrate levels, but AtNRT1.2 expression levels were down-regulated in MdARF18 and up-regulated in arf18 at both high and low nitrate levels (Fig. 5b). This trend in the expression levels of these genes might be consistent with the fact that MdARF18 inhibits the expression of nitrogen-related genes and restricts plant growth. The trend in the expression levels of these genes is consistent with MdARF18 restricting plant growth by inhibiting the expression of nitrogen-related genes. However, AtNRT1.5, AtNRT1.6, AtNRT1.7, AtNRT2.1, and AtNRT2.5 did not show suppressed expression levels in MdARF18 (Fig. 5cg). These results suggest that MdARF18 inhibits nitrate uptake and plant growth by repressing some of the genes for nitrate uptake or assimilation.

    Figure 5.  qPCR-RT analysis of N-related genes. Expression analysis of N-related genes in MdARF18 transgenic Arabidopsis at different nitrate concentrations. Bars represent the mean ± SD (n = 3). Different letters above the bars indicate significant differences using the LSD test (p < 0.05).

    In addition, to test whether different concentrations of nitrate affect the protein stability of MdARF18. However, it was found that there was no significant difference in the protein stability of MdARF18 at different concentrations of nitrate (Supplemental Fig. S10). This result suggests that nitrate does not affect the degradation of MdARF18 protein.

    To further verify whether MdARF18 can directly bind N-related genes, firstly we found that the MdNRT1.1 promoter contains binding sites to ARF factors (Fig. 6a). The yeast one-hybrid research demonstrated an interaction between MdARF18 and the MdNRT1.1 promoter, as shown in Fig. 6b. Yeast cells that were simultaneously transformed with MdNRT1.1-P-pHIS and pGADT7 were unable to grow in selected SD medium. However, cells that were transformed with MdNRT1.1-P-pHIS and MdARF18-pGADT7 grew successfully in the selective medium. The result therefore hypothesizes that MdARF18 could bind specifically to MdNRT1.1 promoter to regulate nitrate uptake in plants.

    Figure 6.  MdARF18 binds directly to the promoter of MdNRT1.1. (a) Schematic representation of MdNRT1.1 promoter. (b) Y1H assay of MdARF18 bound to the MdNRT1.1 promoter in vitro. 10−1, 10−2, 10−3, and 10−4 indicate that the yeast concentration was diluted 10, 100, 1,000, and 10,000 times, respectively. 3-AT stands for 3-Amino-1,2,4-triazole. (c) Dual luciferase assays demonstrate the binding of MdARF18 with MdNRT1.1 promoter. The horizontal bar on the left side of the right indicates the captured signal intensity. Empty LUC and 35S vectors were used as controls. Representative images of three independent experiments are shown here.

    To identify the inhibition or activation of MdNRT1.1 by MdARF18, we analyzed their connections by Dual luciferase assays (Fig. 6c), and also analyzed the fluorescence intensity (Supplemental Fig. S11). It was concluded that the fluorescence signals of cells carrying 35Spro and MdNRT1.1pro::LUC were stronger, but the mixture of 35Spro::MdARF18 and MdNRT1.1pro::LUC injected with fluorescence signal intensity was significantly weakened. Next, we transiently transformed the 35S::MdARF18 into pMdNRT1.1::GUS transgenic calli (Fig. 7). GUS results first showed that the color depth of pMdNRT1.1::GUS and 35S::MdARF18 were significantly lighter than pMdnNRT1.1::GUS alone (Fig. 7a). GUS enzyme activity, as well as GUS expression, also indicated that the calli containing pMdnNRT1.1::GUS alone had a stronger GUS activity (Fig. 7b, c). In addition, the GUS activity of calli containing both pMdNRT1.1:GUS and 35S::MdARF18 were further attenuated under both high and low nitrate concentrations (Fig. 7a). These results suggest that MdARF18 represses MdNRT1.1 expression by directly binding to the MdNRT1.1 promoter region.

    Figure 7.  MdARF18 inhibits the expression of MdNRT1.1. (a) GUS staining experiment of pMdNRT1.1::GUS transgenic calli and transgenic calli containing both pMdNRT1.1::GUS and 35S::MdARF18 with different nitrate treatments. (b) GUS activity assays in MdARF18 overexpressing calli with different nitrate treatments. (c) GUS expression level in MdARF18 overexpressing calli with different nitrate treatments. Bars represent the mean ± SD (n = 3). Different numbers of asterisk above the bars indicate significant differences using the LSD test (*p < 0.05 and **p< 0.01).

    Plants replenish their nutrients by absorbing nitrates from the soil[42,43]. Previous studies have shown that some of the plant hormones such as IAA, GA, and ABA interact with nitrate[25,4445]. The effect of nitrate on the content and transport of IAA has been reported in previous studies, e.g., nitrate supply reduced IAA content in Arabidopsis, wheat, and maize roots and inhibited the transport of IAA from shoot to root[20,21]. In this study, it was found that auxin treatment promoted individual fresh weight gain and growth (Fig. 1a, b). Nitrate content and NR activity were also significantly higher in their root parts (Fig. 1c, d) and also affected the transcript expression levels of related nitrate uptake and assimilation genes (Supplemental Fig. S1). Possibly because IAA can affect plant growth by influencing the uptake of external nitrates by the plant.

    ARFs are key transcription factors to regulate auxin signaling[4649]. We identified five representative genes of the apple MdARFs subfamily and they all had different expression patterns (Supplemental Fig. S2). The transcript levels of each gene were found to be affected to different degrees under different concentrations of nitrate, but the expression level of MdARF18 was up-regulated under both low and high nitrate conditions (Fig. 2). The transcript level of MdARF18 was also activated under IAA treatment (Supplemental Fig. S3), so MdARF18 began to be used in the study of the mechanism of nitrate uptake in plants. In this study, an Arabidopsis AtARF18 homolog was successfully cloned and named MdARF18 (Supplemental Figs S4, S5). It contains a B3-type DNA-binding structural domain consistent with previous studies of ARFs (Supplemental Fig. S6), and arf18 mutants were also obtained and their transcript levels were examined (Supplemental Fig. S7).

    Plants rely on rapid modification of the root system to efficiently access effective nitrogen resources in the soil for growth and survival. The plasticity of root development is an effective strategy for accessing nitrate, and appropriate concentrations of IAA can promote the development of lateral roots[7,44]. The present study found that the length of the primary root was shortened and the number of lateral roots did increase in IAA-treated Gl3 apple seedlings (Supplemental Fig. S12). Generally, an environment with low concentrations of nitrate promotes the transport of IAA by AtNRT1.1, which inhibits the growth of lateral roots[14]. However, in the research of MdARF18 transgenic Arabidopsis, it was found that the lateral roots of MdARF18-OX increased under low concentrations of nitrate, but there was no significant change in the mutant arf18 (Fig. 3). Therefore, it was hypothesized that MdARF18 might repress the expression of the MdNRT1.1 gene or other related genes that can regulate root plasticity, thereby affecting nitrate uptake in plants.

    In rice, several researchers have demonstrated that OsARF18 significantly regulates nitrogen utilization. Loss of function of the Rice Salt Tolerant 1 (RST1) gene (encoding OsARF18) removes its ability to transcriptionally repress OsAS1, accelerating the assimilation of NH4+ to Asn and thereby increasing nitrogen utilization[28]. During soil incubation of MdARF18-OX Arabidopsis, it was found that leaving aside the effect of differences in nitrate concentration, the arf18 mutant grew significantly better than MdARF18-OX and had higher levels of nitrate and NR activity in arf18 than in MdARF18-OX. This demonstrates that MdARF18 may act as a repressor of nitrate uptake and assimilation, thereby inhibiting normal plant development (Fig. 4). Interestingly, an adequate nitrogen environment promotes plant growth, but MdARF18-OX Arabidopsis growth and all physiological indexes were poorer under high nitrate concentration than MdARF18-OX at other concentrations. We hypothesize that MdARF18 may be activated more intensively at high nitrate concentrations, or that MdARF18 suppresses the expression levels of genes for nitrate uptake or assimilation (genes that may play a stronger role at high nitrate concentrations), thereby inhibiting plant growth. In addition, we obtained MdARF18 transgenic calli (Supplemental Fig. S8) and subjected them to high and low concentrations of nitrate, and also found that MdARF18 inhibited the growth of individuals at both concentrations (Supplemental Fig. S9). This further confirms that MdARF18 inhibits nitrate uptake in individuals.

    ARF family transcription factors play a key role in transmitting auxin signals to alter plant growth and development, e.g. osarf1 and osarf24 mutants have reduced levels of OsNRT1.1B, OsNRT2.3a and OsNIA2 transcripts[22]. Therefore, further studies are needed to determine whether MdARF18 activates nitrate uptake through different molecular mechanisms. The result revealed that the transcript levels of AtNRT1.1, AtNIA1, AtNIA2, and AtNIR in MdARF18-OX were consistent with the developmental pattern of impaired plant growth (Fig. 5). Unfortunately, we attempted to explore whether variability in nitrate concentration affects MdARF18 to differ at the protein level, but the two did not appear to differ significantly (Supplemental Fig. S10).

    ARF transcription factors act as trans-activators/repressors of N metabolism-related genes by directly binding to TGTCNN/NNGACA-containing fragments in the promoter regions of downstream target genes[27,50]. The NRT family plays important roles in nitrate uptake, transport, and storage, and NRT1.1 is an important dual-affinity nitrate transporter protein[7,5052], and nitrogen utilization is very important for apple growth[53,54]. We identified binding sites in the promoters of these N-related genes that are compatible with ARF factors, and MdARF18 was found to bind to MdNRT1.1 promoter by yeast one-hybrid technique (Fig. 6a, b). It was also verified by Dual luciferase assays that MdARF18 could act as a transcriptional repressor that inhibited the expression of the downstream gene MdNRT1.1 (Fig. 6c), which inhibited the uptake of nitrate in plants. In addition, the GUS assay was synchronized to verify that transiently expressed pMdNRT1.1::GUS calli with 35S::MdARF18 showed a lighter staining depth and a significant decrease in GUS transcript level and enzyme activity (Fig. 7). This phenomenon was particularly pronounced at high concentrations of nitrate. These results suggest that MdARF18 may directly bind to the MdNRT1.1 promoter and inhibit its expression, thereby suppressing NO3 metabolism and decreasing the efficiency of nitrate uptake more significantly under high nitrate concentrations.

    In conclusion, in this study, we found that MdARF18 responds to nitrate and could directly bind to the TGTCTT site of the MdNRT1.1 promoter to repress its expression. Our findings provide new insights into the molecular mechanisms by which MdARF18 regulates nitrate transport in apple.

    The authors confirm contribution to the paper as follows: study conception and design: Liu GD; data collection: Liu GD, Rui L, Liu RX; analysis and interpretation of results: Liu GD, Li HL, An XH; draft manuscript preparation: Liu GD; supervision: Zhang S, Zhang ZL; funding acquisition: You CX, Wang XF; All authors reviewed the results and approved the final version of the manuscript.

    Data sharing not applicable to this article as no datasets were generated or analyzed during the current study.

    This work was supported by the National Natural Science Foundation of China (32272683), the Shandong Province Key R&D Program of China (2022TZXD008-02), the China Agriculture Research System of MOF and MARA (CARS-27), the National Key Research and Development Program of China (2022YFD1201700), and the National Natural Science Foundation of China (NSFC) (32172538).

  • The authors declare that they have no conflict of interest.

  • [1]

    Ji Y, Zhu L, Hao Z, Su S, Zheng X, et al. 2022. Exploring the Cunninghamia lanceolata (lamb.) Hook genome by bac sequencing. Frontiers in Bioengineering and Biotechnology 10:854130

    doi: 10.3389/fbioe.2022.854130

    CrossRef   Google Scholar

    [2]

    Jiang Y, Hu Z, Han Z, Zhang J, Han S, Hao L. 2022. Growth characteristics of Cunninghamia lanceolata in China. Scientific Reports 12:18179

    doi: 10.1038/s41598-022-22809-6

    CrossRef   Google Scholar

    [3]

    Tian Q, Zhang H, Bian L, Zhou L, Ge Y. 2024. Three-dimensional quantification and visualization of leaf chlorophyll content in poplar saplings under drought using SFM-MVS. Forests 15:20

    doi: 10.3390/f15010020

    CrossRef   Google Scholar

    [4]

    Hao T, Han Y, Li Z, Yao H, Niu H. 2020. Estimating leaf chlorophyll content by laser-induced fluorescence technology at different viewing zenith angles. Applied Optics 59:7734−44

    doi: 10.1364/AO.400032

    CrossRef   Google Scholar

    [5]

    Li W, Sun Z, Lu S, Omasa K. 2019. Estimation of the leaf chlorophyll content using multiangular spectral reflectance factor. Plant, Cell & Environment 42:3152−65

    doi: 10.1111/pce.13605

    CrossRef   Google Scholar

    [6]

    Croft H, Chen JM, Luo X, Bartlett P, Chen B, et al. 2017. Leaf chlorophyll content as a proxy for leaf photosynthetic capacity. Global Change Biology 23:3513−24

    doi: 10.1111/gcb.13599

    CrossRef   Google Scholar

    [7]

    Cheng T, Rivard B, Sánchez-Azofeifa AG, Féret JB, Jacquemoud S, et al. 2012. Predicting leaf gravimetric water content from foliar reflectance across a range of plant species using continuous wavelet analysis. Journal of Plant Physiology 169:1134−42

    doi: 10.1016/j.jplph.2012.04.006

    CrossRef   Google Scholar

    [8]

    Ullah S, Skidmore AK, Naeem M, Schlerf M. 2012. An accurate retrieval of leaf water content from mid to thermal infrared spectra using continuous wavelet analysis. Science of the Total Environment 437:145−52

    doi: 10.1016/j.scitotenv.2012.08.025

    CrossRef   Google Scholar

    [9]

    Feng X, Zhan Y, Wang Q, Yang X, Yu C, et al. 2020. Hyperspectral imaging combined with machine learning as a tool to obtain high-throughput plant salt-stress phenotyping. The Plant Journal 101:1448−61

    doi: 10.1111/tpj.14597

    CrossRef   Google Scholar

    [10]

    Sarić R, Nguyen VD, Burge T, Berkowitz O, Trtílek M, et al. 2022. Applications of hyperspectral imaging in plant phenotyping. Trends in Plant Science 27:301−15

    doi: 10.1016/j.tplants.2021.12.003

    CrossRef   Google Scholar

    [11]

    Burnett AC, Serbin SP, Davidson KJ, Ely KS, Rogers A. 2021. Detection of the metabolic response to drought stress using hyperspectral reflectance. Journal of Experimental Botany 72:6474−89

    doi: 10.1093/jxb/erab255

    CrossRef   Google Scholar

    [12]

    Asaari MSM, Mertens S, Verbraeken L, Dhondt S, Inzé D, et al. 2022. Non-destructive analysis of plant physiological traits using hyperspectral imaging: a case study on drought stress. Computers and Electronics in Agriculture 195:106806

    doi: 10.1016/j.compag.2022.106806

    CrossRef   Google Scholar

    [13]

    Ball KR, Liu H, Brien C, Berger B, Power SA, et al. 2022. Hyperspectral imaging predicts yield and nitrogen content in grass–legume polycultures. Precision Agriculture 23:2270−88

    doi: 10.1007/s11119-022-09920-4

    CrossRef   Google Scholar

    [14]

    Lin M, Lynch V, Ma D, Maki H, Jin J, et al. 2022. Multi-species prediction of physiological traits with hyperspectral modeling. Plants 11:676

    doi: 10.3390/plants11050676

    CrossRef   Google Scholar

    [15]

    Zhang C, Zhou L, Xiao Q, Bai X, Wu B, et al. 2022. End-to-end fusion of hyperspectral and chlorophyll fluorescence imaging to identify rice stresses. Plant Phenomics 2022:9851096

    doi: 10.34133/2022/9851096

    CrossRef   Google Scholar

    [16]

    Mertens S, Verbraeken L, Sprenger H, Demuynck K, Maleux K, et al. 2021. Proximal hyperspectral imaging detects diurnal and drought-induced changes in maize physiology. Frontiers in Plant Science 12:640914

    doi: 10.3389/fpls.2021.640914

    CrossRef   Google Scholar

    [17]

    Nagasubramanian K, Jones S, Singh AK, Sarkar S, Singh A, et al. 2019. Plant disease identification using explainable 3D deep learning on hyperspectral images. Plant Methods 15:98

    doi: 10.1186/s13007-019-0479-8

    CrossRef   Google Scholar

    [18]

    Zhang G, Xu T, Tian Y. 2022. Hyperspectral imaging-based classification of rice leaf blast severity over multiple growth stages. Plant Methods 18:123

    doi: 10.1186/s13007-022-00955-2

    CrossRef   Google Scholar

    [19]

    Elmasry G, Kamruzzaman M, Sun D, Allen P. 2012. Principles and applications of hyperspectral imaging in quality evaluation of agro-food products: a review. Critical Reviews in Food Science and Nutrition 52:999−1023

    doi: 10.1080/10408398.2010.543495

    CrossRef   Google Scholar

    [20]

    Sendin K, Williams PJ, Manley M. 2018. Near infrared hyperspectral imaging in quality and safety evaluation of cereals. Critical Reviews in Food Science and Nutrition 58:575−90

    doi: 10.1080/10408398.2016.1205548

    CrossRef   Google Scholar

    [21]

    Shorten PR, Leath SR, Schmidt J, Ghamkhar K. 2019. Predicting the quality of ryegrass using hyperspectral imaging. Plant Methods 15:63

    doi: 10.1186/s13007-019-0448-2

    CrossRef   Google Scholar

    [22]

    Tang Y, Chen M, Wang C, Luo L, Li J, et al. 2020. Recognition and localization methods for vision-based fruit picking robots: a review. Frontiers in Plant Science 11:510

    doi: 10.3389/fpls.2020.00510

    CrossRef   Google Scholar

    [23]

    Zhang H, Ge Y, Xie X, Atefi A, Wijewardane NK, et al. 2022. High throughput analysis of leaf chlorophyll content in sorghum using RGB, hyperspectral, and fluorescence imaging and sensor fusion. Plant Methods 18:60

    doi: 10.1186/s13007-022-00892-0

    CrossRef   Google Scholar

    [24]

    Xiong J, Lin R, Bu R, Liu Z, Yang Z, et al. 2018. A micro-damage detection method of litchi fruit using hyperspectral imaging technology. Sensors 18:700

    doi: 10.3390/s18030700

    CrossRef   Google Scholar

    [25]

    Pyo J, Duan H, Ligaray M, Kim M, Baek S, et al. 2020. An integrative remote sensing application of stacked autoencoder for atmospheric correction and cyanobacteria estimation using hyperspectral imagery. Remote Sensing 12:1073

    doi: 10.3390/rs12071073

    CrossRef   Google Scholar

    [26]

    Liu W, Li Y, Tomasetto F, Yan W, Tan Z, et al. 2021. Non-destructive measurements of Toona sinensis chlorophyll and nitrogen content under drought stress using near infrared spectroscopy. Frontiers in Plant Science 12:809828

    doi: 10.3389/fpls.2021.809828

    CrossRef   Google Scholar

    [27]

    Yang F, Tao L, Wang Q, Du M, Yang T, et al. 2021. Rapid determination of leaf water content for monitoring waterlogging in winter wheat based on hyperspectral parameters. Journal of Integrative Agriculture 20:2613−26

    doi: 10.1016/S2095-3119(20)63306-8

    CrossRef   Google Scholar

    [28]

    Zhang J, Pan R, Gao W, Xu B, Li W. 2016. Automatic detection of layout of color yarns of yarn-dyed fabric. Part 2: region segmentation of double-system-mélange color fabric. Color Research & Application 41:626−35

    doi: 10.1002/col.22003

    CrossRef   Google Scholar

    [29]

    He H, Chen Y, Li G, Wang Y, Ou X, et al. 2023. Hyperspectral imaging combined with chemometrics for rapid detection of talcum powder adulterated in wheat flour. Food Control 144:109378

    doi: 10.1016/j.foodcont.2022.109378

    CrossRef   Google Scholar

    [30]

    Qu J, Sun D, Cheng J, Pu H. 2017. Mapping moisture contents in grass carp (Ctenopharyngodon idella) slices under different freeze drying periods by Vis-NIR hyperspectral imaging. LWT 75:529−36

    doi: 10.1016/j.lwt.2016.09.024

    CrossRef   Google Scholar

    [31]

    Zhang J, Rivard B, Rogge DM. 2008. The Successive Projection Algorithm (SPA), an algorithm with a spatial constraint for the automatic search of endmembers in hyperspectral data. Sensors 8:1321−42

    doi: 10.3390/s8021321

    CrossRef   Google Scholar

    [32]

    Araújo MCU, Saldanha TCB, Galvão RKH, Yoneyama T, Chame HC, et al. 2001. The successive projections algorithm for variable selection in spectroscopic multicomponent analysis. Chemometrics and Intelligent Laboratory Systems 57:65−73

    doi: 10.1016/S0169-7439(01)00119-8

    CrossRef   Google Scholar

    [33]

    Li H, Liang Y, Xu Q, Cao D. 2009. Key wavelengths screening using competitive adaptive reweighted sampling method for multivariate calibration. Analytica Chimica Acta 648:77−84

    doi: 10.1016/j.aca.2009.06.046

    CrossRef   Google Scholar

    [34]

    Haghbin N, Bakhshipour A, Zareiforoush H, Mousanejad S. 2023. Non-destructive pre-symptomatic detection of gray mold infection in kiwifruit using hyperspectral data and chemometrics. Plant Methods 19:53

    doi: 10.1186/s13007-023-01032-y

    CrossRef   Google Scholar

    [35]

    Wang Z, Fan S, Wu J, Zhang C, Xu F, et al. 2021. Application of long-wave near infrared hyperspectral imaging for determination of moisture content of single maize seed. Spectrochimica Acta Part A: Molecular and Biomolecular Spectroscopy 254:119666

    doi: 10.1016/j.saa.2021.119666

    CrossRef   Google Scholar

    [36]

    Martens H, Naes T. 1991. Multivariate calibration. New York: John Wiley & Sons. 440 pp.

    [37]

    Park B, Seo Y, Yoon SC, Hinton A Jr, Windham WR, et al. 2015. Hyperspectral microscope imaging methods to classify gram-positive and gram-negative foodborne pathogenic bacteria. Transactions of the ASABE 58:5−16

    doi: 10.13031/trans.58.10832

    CrossRef   Google Scholar

    [38]

    Zhang X, Sun J, Li P, Zeng F, Wang H. 2021. Hyperspectral detection of salted sea cucumber adulteration using different spectral preprocessing techniques and SVM method. LWT 152:112295

    doi: 10.1016/j.lwt.2021.112295

    CrossRef   Google Scholar

    [39]

    Rasooli Sharabiani V, Soltani Nazarloo A, Taghinezhad E, Veza I, Szumny A, et al. 2023. Prediction of winter wheat leaf chlorophyll content based on VIS/NIR spectroscopy using ANN and PLSR. Food Science & Nutrition 11:2166−75

    doi: 10.1002/fsn3.3071

    CrossRef   Google Scholar

    [40]

    Curcio JA, Petty CC. 1951. The near infrared absorption spectrum of liquid water. Journal of the Optical Society of America 41:302−04

    doi: 10.1364/JOSA.41.000302

    CrossRef   Google Scholar

    [41]

    Huang H, Shen Y, Guo Y, Yang P, Wang H, et al. 2017. Characterization of moisture content in dehydrated scallops using spectral images. Journal of Food Engineering 205:47−55

    doi: 10.1016/j.jfoodeng.2017.02.018

    CrossRef   Google Scholar

    [42]

    Maeda H, Ozaki Y, Tanaka M, Hayashi N, Kojima T. 1995. Near infrared spectroscopy and chemometrics studies of temperature-dependent spectral variations of water: relationship between spectral changes and hydrogen bonds. Journal of Near Infrared Spectroscopy 3:191−201

    doi: 10.1255/jnirs.69

    CrossRef   Google Scholar

    [43]

    Rongtong B, Suwonsichon T, Ritthiruangdej P, Kasemsumran S. 2018. Determination of water activity, total soluble solids and moisture, sucrose, glucose and fructose contents in osmotically dehydrated papaya using near-infrared spectroscopy. Agriculture and Natural Resources 52:557−64

    doi: 10.1016/j.anres.2018.11.023

    CrossRef   Google Scholar

    [44]

    Liu L, Zareef M, Wang Z, Li H, Chen Q, et al. 2023. Monitoring chlorophyll changes during Tencha processing using portable near-infrared spectroscopy. Food Chemistry 412:135505

    doi: 10.1016/j.foodchem.2023.135505

    CrossRef   Google Scholar

    [45]

    Cui L, Wang X, Xu Y, Li Y, Han M. 2022. Hyperspectral reflectance imaging for water content and firmness prediction of potatoes by optimum wavelengths. Journal of Consumer Protection and Food Safety 17:51−64

    doi: 10.1007/s00003-021-01343-z

    CrossRef   Google Scholar

    [46]

    Martens H, Stark E. 1991. Extended multiplicative signal correction and spectral interference subtraction: new preprocessing methods for near infrared spectroscopy. Journal of Pharmaceutical and Biomedical Analysis 9:625−35

    doi: 10.1016/0731-7085(91)80188-F

    CrossRef   Google Scholar

    [47]

    Balabin RM, Safieva RZ, Lomakina EI. 2007. Comparison of linear and nonlinear calibration models based on near infrared (NIR) spectroscopy data for gasoline properties prediction. Chemometrics and Intelligent Laboratory Systems 88:183−88

    doi: 10.1016/j.chemolab.2007.04.006

    CrossRef   Google Scholar

    [48]

    Feng S, Shang J, Tan T, Wen Q, Meng Q. 2023. Nondestructive quality assessment and maturity classification of loquats based on hyperspectral imaging. Scientific Reports 13:13189

    doi: 10.1038/s41598-023-40553-3

    CrossRef   Google Scholar

    [49]

    Li D, Hu Q, Ruan S, Liu J, Zhang J, et al. 2023. Utilizing hyperspectral reflectance and machine learning algorithms for non-destructive estimation of chlorophyll content in citrus leaves. Remote Sensing 15:4934

    doi: 10.3390/rs15204934

    CrossRef   Google Scholar

    [50]

    Zhang F, Zhang F, Wang S, Li L, Lv Q, et al. 2023. Hyperspectral imaging combined with cnn for maize variety identification. Frontiers in Plant Science 14:1254548

    doi: 10.3389/fpls.2023.1254548

    CrossRef   Google Scholar

    [51]

    Oliveira MM, Cruz-Tirado JP, Roque JV, Teófilo RF, Barbin DF. 2020. Portable near-infrared spectroscopy for rapid authentication of adulterated paprika powder. Journal of Food Composition and Analysis 87:103403

    doi: 10.1016/j.jfca.2019.103403

    CrossRef   Google Scholar

    [52]

    Sun J, Zhou X, Hu Y, Wu X, Zhang X, et al. 2019. Visualizing distribution of moisture content in tea leaves using optimization algorithms and NIR hyperspectral imaging. Computers and Electronics in Agriculture 160:153−59

    doi: 10.1016/j.compag.2019.03.004

    CrossRef   Google Scholar

    [53]

    Zhang Y, Guo W. 2020. Moisture content detection of maize seed based on visible/near-infrared and near-infrared hyperspectral imaging technology. International Journal of Food Science & Technology 55:631−40

    doi: 10.1111/ijfs.14317

    CrossRef   Google Scholar

    [54]

    Song Y, Cao S, Chu X, Zhou Y, Xu Y, et al. 2023. Non-destructive detection of moisture and fatty acid content in rice using hyperspectral imaging and chemometrics. Journal of Food Composition and Analysis 121:105397

    doi: 10.1016/j.jfca.2023.105397

    CrossRef   Google Scholar

    [55]

    Li X, Wei Z, Peng F, Liu J, Han G. 2023. Non-destructive prediction and visualization of anthocyanin content in mulberry fruits using hyperspectral imaging. Frontiers in Plant Science 14:1137198

    doi: 10.3389/fpls.2023.1137198

    CrossRef   Google Scholar

    [56]

    Sonobe R, Hirono Y, Oi A. 2020. Non-destructive detection of tea leaf chlorophyll content using hyperspectral reflectance and machine learning algorithms. Plants 9:368

    doi: 10.3390/plants9030368

    CrossRef   Google Scholar

    [57]

    Raczko E, Zagajewski B. 2017. Comparison of support vector machine, random forest and neural network classifiers for tree species classification on airborne hyperspectral APEX images. European Journal of Remote Sensing 50:144−54

    doi: 10.1080/22797254.2017.1299557

    CrossRef   Google Scholar

  • Cite this article

    Xing D, Sun P, Wang Y, Jiang M, Miao S, et al. 2024. Non-destructive estimation of needle leaf chlorophyll and water contents in Chinese fir seedlings based on hyperspectral reflectance spectra. Forestry Research 4: e024 doi: 10.48130/forres-0024-0021
    Xing D, Sun P, Wang Y, Jiang M, Miao S, et al. 2024. Non-destructive estimation of needle leaf chlorophyll and water contents in Chinese fir seedlings based on hyperspectral reflectance spectra. Forestry Research 4: e024 doi: 10.48130/forres-0024-0021

Figures(10)  /  Tables(3)

Article Metrics

Article views(2811) PDF downloads(296)

ARTICLE   Open Access    

Non-destructive estimation of needle leaf chlorophyll and water contents in Chinese fir seedlings based on hyperspectral reflectance spectra

Forestry Research  4 Article number: e024  (2024)  |  Cite this article

Abstract: Chinese fir is the most important native softwood tree in China and has significant economic and ecological value. Accurate assessment of the growth status is critical for both seedling cultivation and germplasm evaluation of this commercially significant tree. Needle leaf chlorophyll content (LCC) and needle leaf water content (LWC), which are determinants of plant health and photosynthetic efficiency, are important indicators of the growth status in plants. In this study, for the first time, the LCC and LWC of Chinese fir seedlings were estimated based on hyperspectral reflectance spectra and machine learning algorithms. A line-scan hyperspectral imaging system with a spectral range of 870 to 1,720 nm was used to capture hyperspectral images of seedlings with varying LCC and LWC. The spectral data of the canopy area of the seedlings were extracted and preprocessed using the Savitzky-Golay smoothing (SG) algorithm. Subsequently, the Successive Projection Algorithm (SPA) and Competitive Adaptive Reweighted Sampling (CARS) methods were employed to extract the most informative wavelengths. Moreover, SVM, PLSR and ANNs were utilized to construct models that predict LCC and LWC based on effective wavelengths. The results indicated that the CARS-ANNs were the best for predicting LCC, with R²C = 0.932, RSMEC = 0.224, and R²P = 0.969, RSMEP = 0.157. Similarly, the SPA-ANNs model exhibited the best prediction performance for LWC, with R²C = 0.952, RSMEC = 0.049, and R²P = 0.948, RSMEP = 0.051. In conclusion, the present study highlights the significant potential of combining hyperspectral imaging (HSI) with machine learning algorithms as a rapid, non-destructive, and highly accurate method for estimating LCC and LWC in Chinese fir.

    • Chinese fir (Cunninghamia lanceolata), the most important native softwood tree mainly distributed in southern China, occupies an important place in the timber industry. It provides essential raw materials for construction, furniture manufacturing and other related industries. The plantation area of Chinese fir covers approximately 11 million hectares, which accounts for around 12.9% of the total plantation forest area in China[1,2]. In order to meet the demand for afforestation, more than 500 million seedlings are cultivated every year. It is increasingly important to establish a powerful estimation method to effectively evaluate growth status during seedling cultivation and germplasm phenotyping.

      Chlorophyll, the primary pigment in plant photosynthesis, is closely associated with the nutritional status of plants, specifically in terms of its content and spatial distribution. It plays a crucial role in the physiological and developmental health of plants[36]. Similarly, leaf water content serves as a significant indicator of plant vigor and photosynthetic efficiency, widely used to assess the physiological status of plants[7,8]. The correlation between chlorophyll and water content in the needles of Chinese fir seedlings is of paramount importance for the growth of this species. Thus, needles leaf Chlorophyll Content (LCC) and needles leaf Water Content (LWC) can serve as vital indicators for evaluating the growth status of Chinese fir seedlings. However, conventional methods for measuring LCC and LWC in Chinese fir seedlings are destructive, labor-intensive, and rely on chemical reagents in the laboratory. To develop a non-destructive and efficient method for measuring LCC and LWC would be highly valuable for monitoring the growth of seedlings and evaluating the germplasm resources of Chinese fir.

      With the development of spectroscopy technology, hyperspectral imaging (HSI) has emerged as a promising tool for measuring traits and evaluating phenotypes in the laboratory, glasshouse, or field[9,10]. For instance, researchers have used hyperspectral reflectance data to predict leaf metabolite concentrations and assess drought stress in several agronomic species grown in glasshouses[11]. Asaari et al.[12] developed a supervised data-driven method based on the machine learning regression (MLR) algorithm using hyperspectral images, and the best prediction model for four physiological traits was successfully applied in a small-scale phenotyping experiment to study drought stress responses in maize plants. Additionally, many studies have explored the potential of HSI in various aspects of plant phenotyping including estimating physiological and biochemical traits[1315], detecting plant stress and diseases[1618] and evaluating plant quality[1921].

      In HSI technology, an appropriate algorithm is critical for establishing the correlation between reflectance spectra and plant traits. Models based on Machine Learning Regression (MLR) are frequently used to predict plant traits from reflectance spectra due to their flexibility and capacity to create responsive input-output relationships[22,23]. For example, Xiong et al.,[24] employed Partial Least Squares Discriminant Analysis (PLS-DA), a variable-based regression technique, to construct a predictive model for non-destructive grading and classification of litchi fruits using hyperspectral data ranging from 400 to 1,000 nm. Similarly, Pyo et al.[25] made use of Artificial Neural Network (ANN) and Support Vector Machine (SVM) to effectively classify and quantify cyanobacteria concentrations.

      However, to our knowledge, there are no previous reports on the application of HSI on the determination of physiological indicators in Chinese fir. In this study, the objective was to estimate the LCC and LWC in Chinese fir seedlings based on non-destructive HSI and machine learning. To achieve this goal, two estimation models were developed by exploring and validating three MLR algorithms: Partial least squares regression (PLSR), Support Vector Machine (SVM) and Artificial Neural Networks (ANNs). More specific goals were (i) to estimate two targeted physiological traits: LCC and LWC; (ii) to compare and evaluate the superior variable selection method between the Successive Projection Algorithm (SPA) and Competitive Adaptive Reweighted Sampling (CARS) to determine the optimal wavelengths that provide the highest correlation with the two physiological indicators; (iii) to develop robust and accurate estimation models (PLSR, SVM, ANNs) to quantitatively predict the LCC and LWC of Chinese fir seedlings using the optimal wavelengths.

    • The seeds were obtained from a bi-clonal seed orchard of Chinese fir clone Long-15 and Min-33 in Kaihua forest farm of Zhejiang Province, China, which were then used to cultivate seedlings in a greenhouse of Zhejiang A&F University. To prepare seedlings with different LWC and LCC, artificial drought stress was used to treat seedlings of about 20 cm in height. One hundred and eighty seedlings were used, and the drought stress was simulated by irrigating with 20% PEG 6000 solution. Each seedling was irrigated with 30 mL of the 20% PEG 6000 solution every 6 d, and the treatment was conducted for 56 d. Hyperspectral data and samples for determining LWC and LCC were collected from 36 seedlings every two weeks in the lab. Accordingly, the seedlings were categorized into five groups: D0 (day 0), D14 (day 14), D28 (day 28), D42 (day 42), and D56 (day 56) (Fig. 1). To enhance the overall robustness of the model, the collected data were divided into two sets: one comprising 126 seedlings for training the regression models, and the other including 54 seedlings for testing the prediction of models.
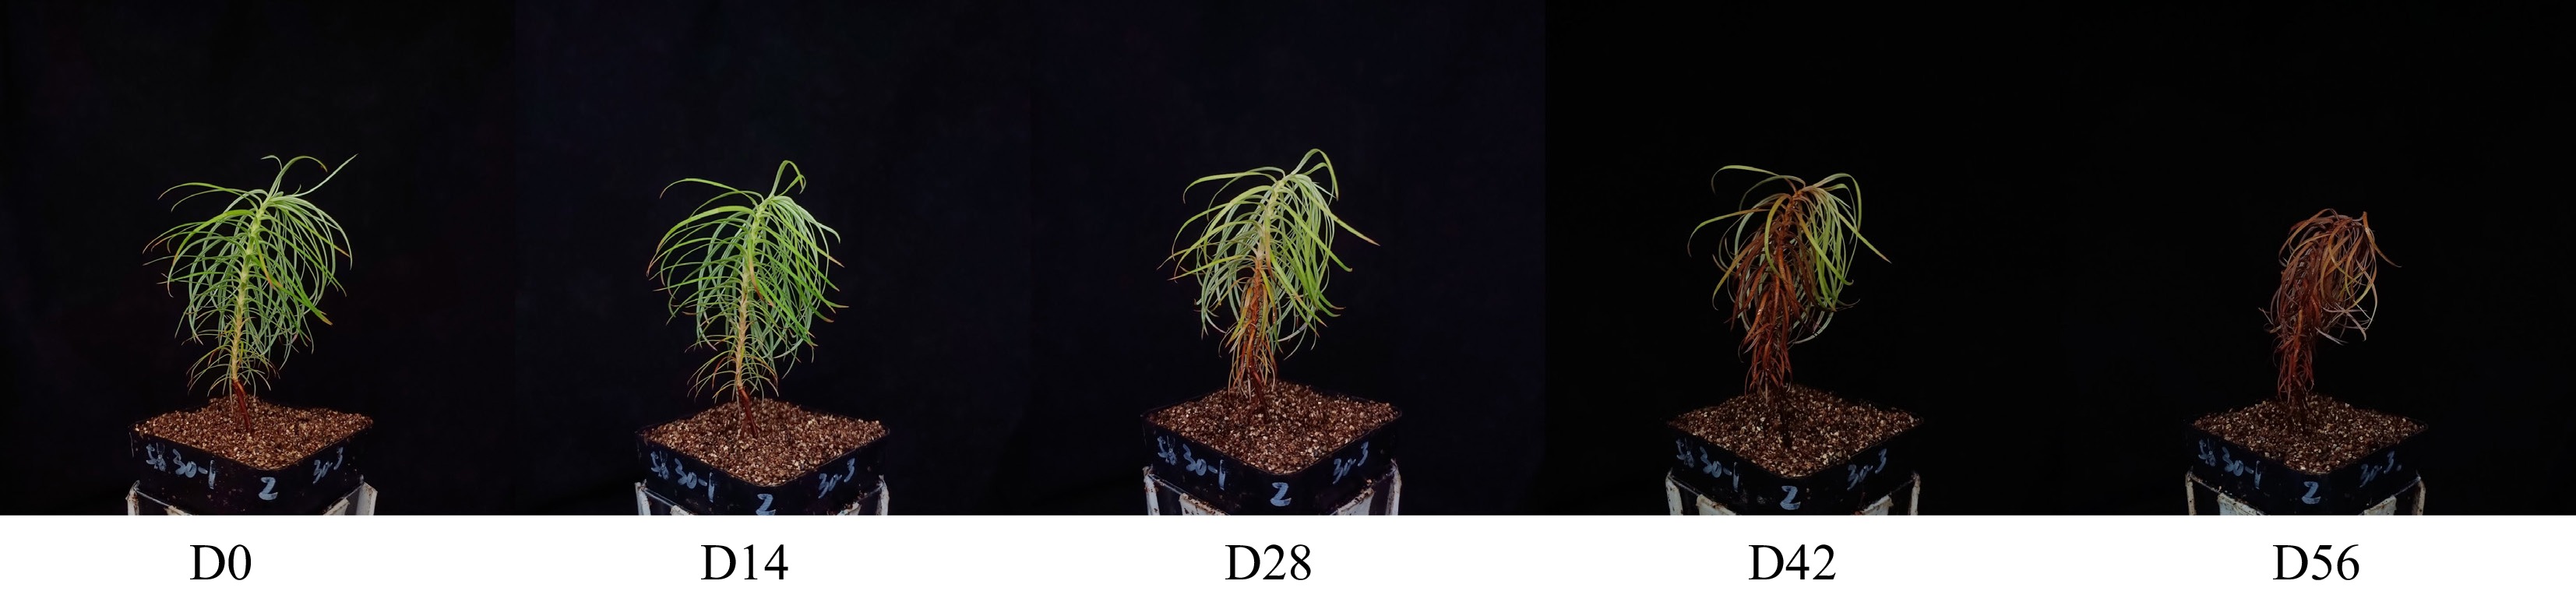
      Figure 1. 

      Chinese fir seedlings from different drought treatments.

    • As shown in Fig. 2, the system for hyperspectral imaging included a NIR hyperspectral imager (GaiaField-N17E, Dualix Spectral Imaging, Sichuan Shuangli Hepu Technology Co., Ltd.), an indoor test chamber (HSIA-BD), a set of four halogen lamps (50 W), a lifting table, a computer, and the supporting software (Optiplex 7080MT/SpecView). The NIR hyperspectral imager had a spectral range spanning from 870 to 1,720 nm, a spatial resolution of 640 pixels, 512 bands, and a spectral resolution of 5 nm. The dimensions of the lifting table were 300 mm × 300 mm, allowing for a lifting range between 90 and 370 mm. To ensure high-quality hyperspectral images of the samples, the conveyor belt was set to move at a speed of 0.6 cm/s with a distance of 25 cm. The sample-to-lens distance was maintained at 30 cm, the angle between the light source and the horizontal plane was set to 60 degrees, and the exposure time was 7 ms.
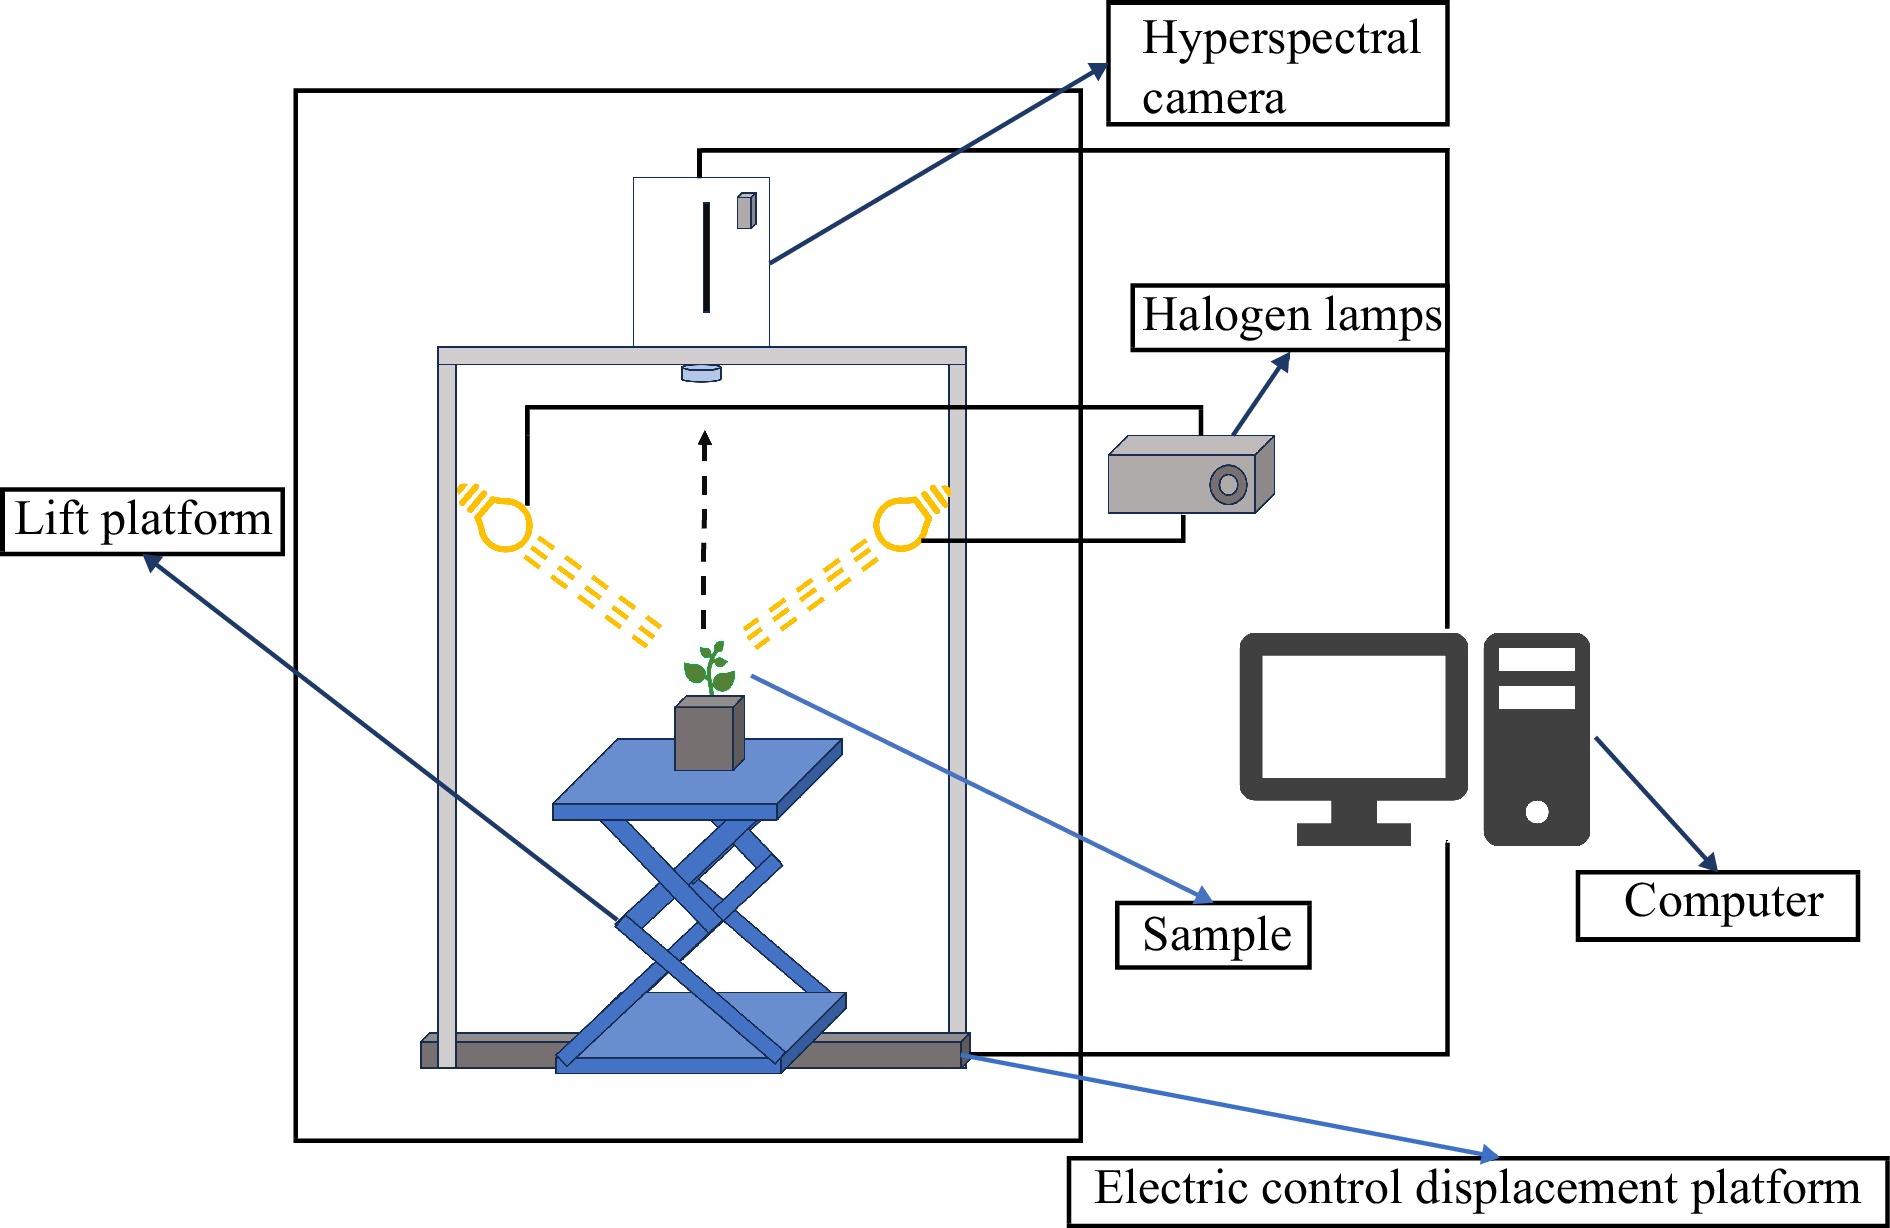
      Figure 2. 

      Hyperspectral imaging system.

      To avoid the effect caused by uneven light source intensity distribution and dark current during the image collecting process, the white reference image (W) was obtained from white reference panels and the dark reference image (D) was obtained by completely closing the lens of the camera with its opaque cap. The image calibration was performed according to the formula (1):

      R=IDWD (1)

      Where, R represents the corrected image, I represents the original image, W represents the white reference image and D represents the black reference image.

    • After collecting the spectral data, needle leaves were promptly collected to measure the LCC and LWC. To determine the LCC, 0.3 g of canopy needle leaves were chopped into pieces and soaked in 95% ethanol solution in the dark for 24−36 h to extract chlorophyll. The absorbance of the extracted components was then measured using a microplate reader (SpectraMax 190) at wavelengths of 665, 649, and 470 nm[26]. The LCC was calculated using the following formula:

      Ca(mg/L)=13.95×D6656.88×D649 (2)
      Cb(mg/L)=24.96×D6497.32×D665 (3)
      CT(mg/L)=Ca+Cb (4)
      LCC(mg/g)=CT×VT×BTW (5)

      Where, LCC (mg/g) represents the content of chlorophyll, CT (mg/L) represents the concentrations of chlorophyll a and chlorophyll b, VT (mL) represents the volume of extract solution, BT represents the dilution ratio, and W (g) represents the fresh weight of needle leaves.

      For LWC determination, the fresh weight of the needle leaves was initially measured. Subsequently, the needle leaves were subjected to incubation in an oven at 105 °C for 30 min, and then further dried at 80 °C for 48 h until a constant weight was achieved[27]. The LWC was calculated using the following formula:

      LWC(%)=M1M2M1×100% (6)

      Where, M1 represents fresh needle leaf weight, M2 represents drought needle leaf weight.

    • Hyperspectral imaging data were analyzed by the ENVI 4.5 software. The canopy area of the seedling was selected as region of interest (ROI) to extract NIR hyperspectral data. A flow chart (Fig. 3) presents the procedure for extracting the NIR hyperspectral data. Initially, a mask was created using a minimum threshold value of 0.45. Subsequently, the original image was masked to yield the target image. Lastly, the raw spectral data were obtained by calculating the mean spectrum of all pixels within the ROI.
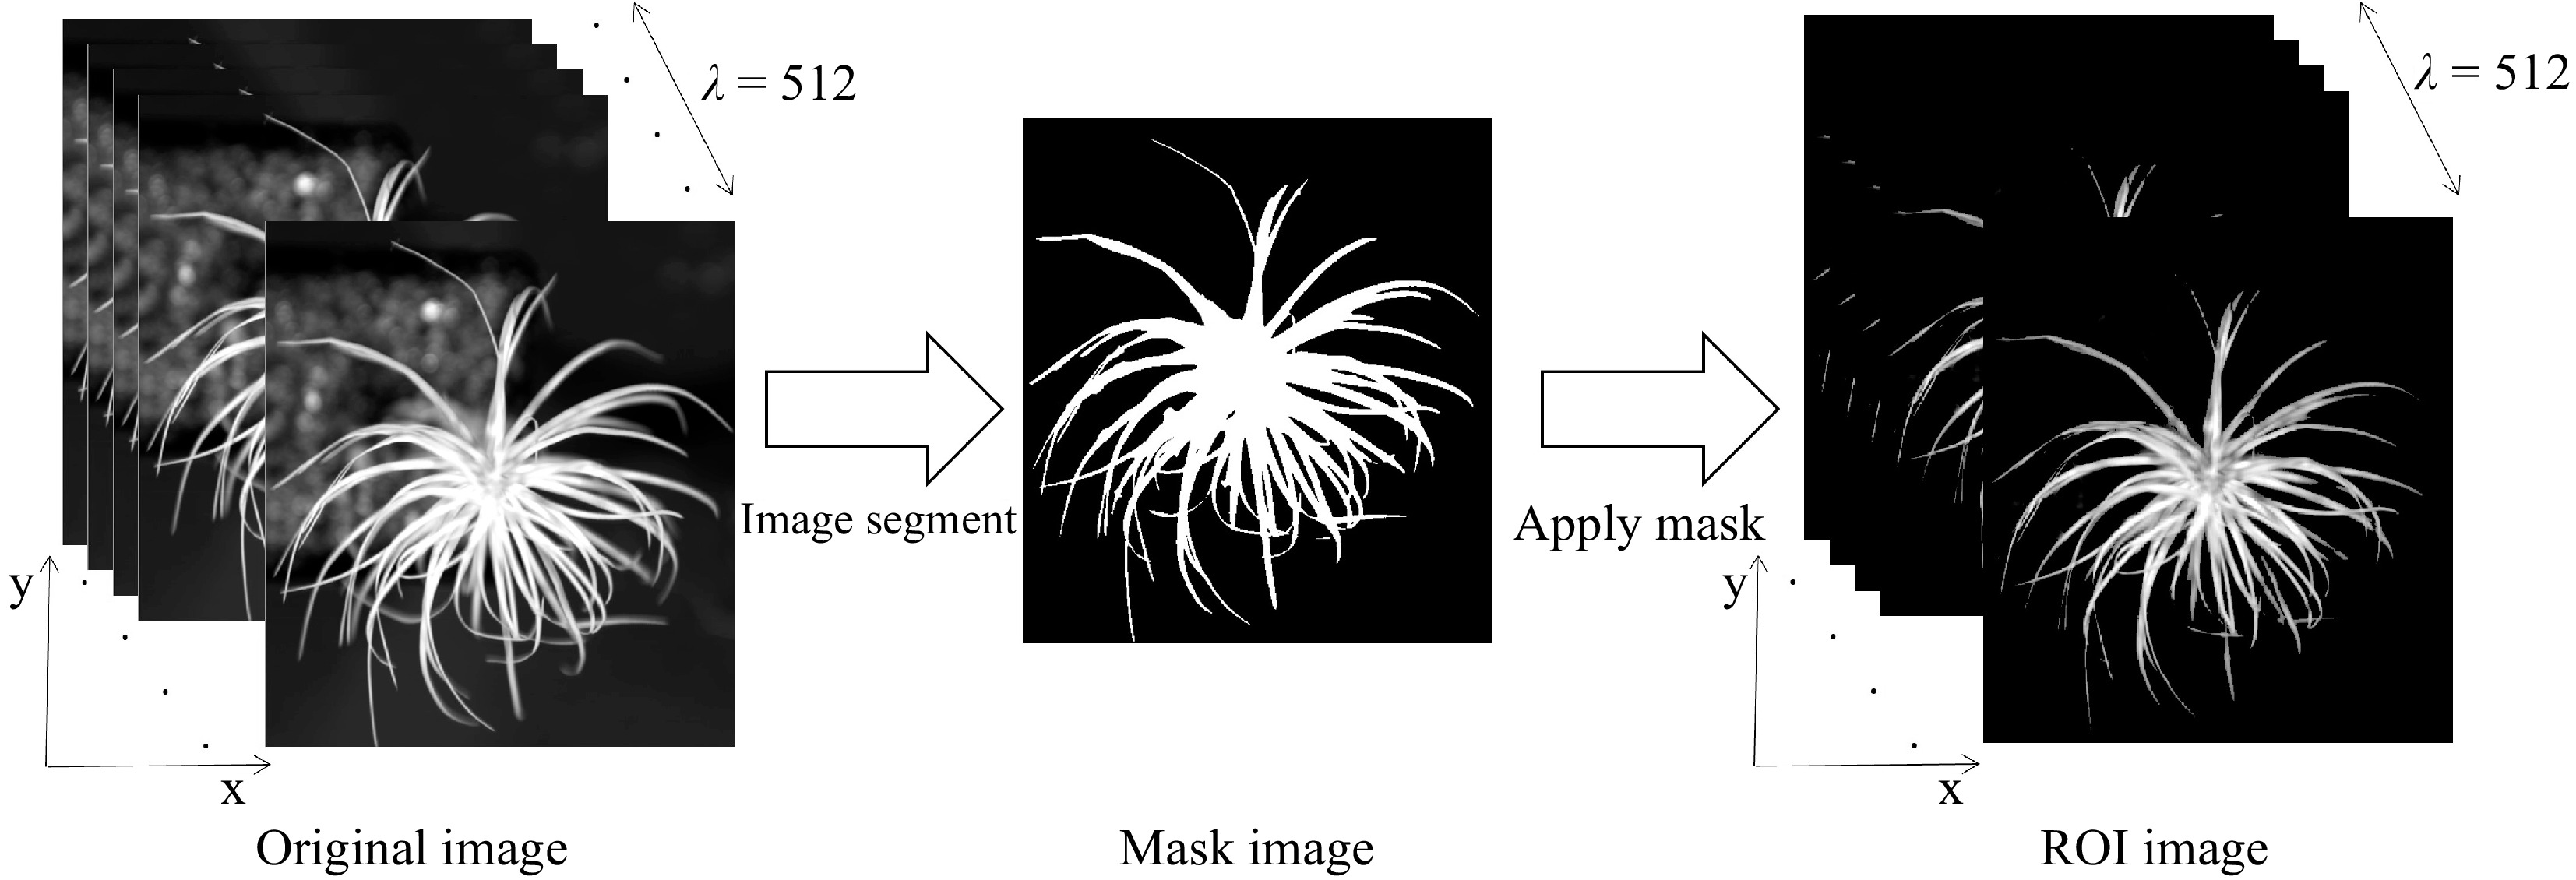
      Figure 3. 

      Flow chart of hyperspectral data extraction from NIR hyperspectral images.

    • The data acquired from the NIR spectrometer contains background information and noise, in addition to sample information. To ensure reliable, accurate, and stable calibration models, it is necessary to preprocess the spectral data before modeling. In the present study, three preprocessing methods were compared and utilized: Savitzky-Golay (SG) smoothing[28], standard normal variate (SNV)[29], and multiplicative scatter correction (MSC)[30]. The aim was to select the most optimal approach for preprocessing the spectral data.

    • SPA is a variable-selection method for multivariate calibration, which utilizes projection operations to select a subset of variables with minimum multi-collinearity[31]. In the SPA method, multiple linear regression models are created by considering different subsets of the wavelength vector. The wavelengths that result in the lowest Root Mean Square Error (RMSE) are considered the most significant wavelengths[32].

    • CARS, an effective strategy for selecting an optimal combination of key wavelengths present in the full spectrum, is developed based on the principle of 'survival of the fittest' from Darwin's Theory of Evolution[33]. Briefly, CARS achieves wavelength selection by establishing PLS models on N (N = 50 in this study) feature subsets generated through the Monte-Carlo (MC) sampling method. Subsequently, the combination of variables with the lowest RMSE during model cross-validation is chosen as the optimal selection[34,35]. CARS follows a four-step process in each sampling run: (1) Model sampling using Monte Carlo method; (2) Enforced wavelength selection using an exponentially decreasing function (EDF); (3) Wavelength selection through adaptive reweighted sampling (ARS); (4) Evaluation of the subset through ten-fold cross-validation.

    • PLSR is a widely used methodology in the fields of remote sensing, chemometrics, and spectral data processing. It is particularly useful for handling large datasets that have complex relationships between variables. PLSR is distinguished as a comprehensive full-spectrum approach, leveraging information spanning the entirety of wavelengths within the original spectrum to construct a refined calibration algorithm[36].

    • SVM is a widely used and powerful machine learning algorithm that can be applied to both classification and regression tasks[37]. Its main principle is to find the optimal hyperplane that can separate data points of different classes in a high-dimensional space[38]. This hyperplane is determined through the selection of support vectors, which are the data points closest to the decision boundary. The primary goal of SVM is to maximize the margin, which is the distance between the decision boundary and the nearest data points from both classes. By employing techniques like the kernel trick, SVM can effectively handle nonlinear data by mapping them to a higher-dimensional space to achieve linear separability. This makes SVM a robust and adaptable model that can handle complex datasets.

    • Figure 4 demonstrates the structure of the ANN model, comprising three essential layers: input, hidden, and output layers. The input layer plays a crucial role in seamlessly integrating with external systems, assimilating external data for a harmonious connection. On the other hand, the output layer disperses the predictive results of the model into the external environment, with its neuron count being intricately linked to the specific task under consideration. In contrast, the often disregarded hidden layer acts as a mediator, bridging the gap between the input and output layers. Neurons within this layer incorporate activation functions, to introduce nonlinear dynamics during the transmission of information. This intermediary layer assumes pivotal responsibility within the overall model, enabling sophisticated abstraction and subtle feature extraction through progressive refinement and transformation of input data. The fundamental principle of hierarchical transmission and processing empowers neural networks to meticulously capture inherent data correlations, resulting in improved accuracy in predictive and analytical results[39].
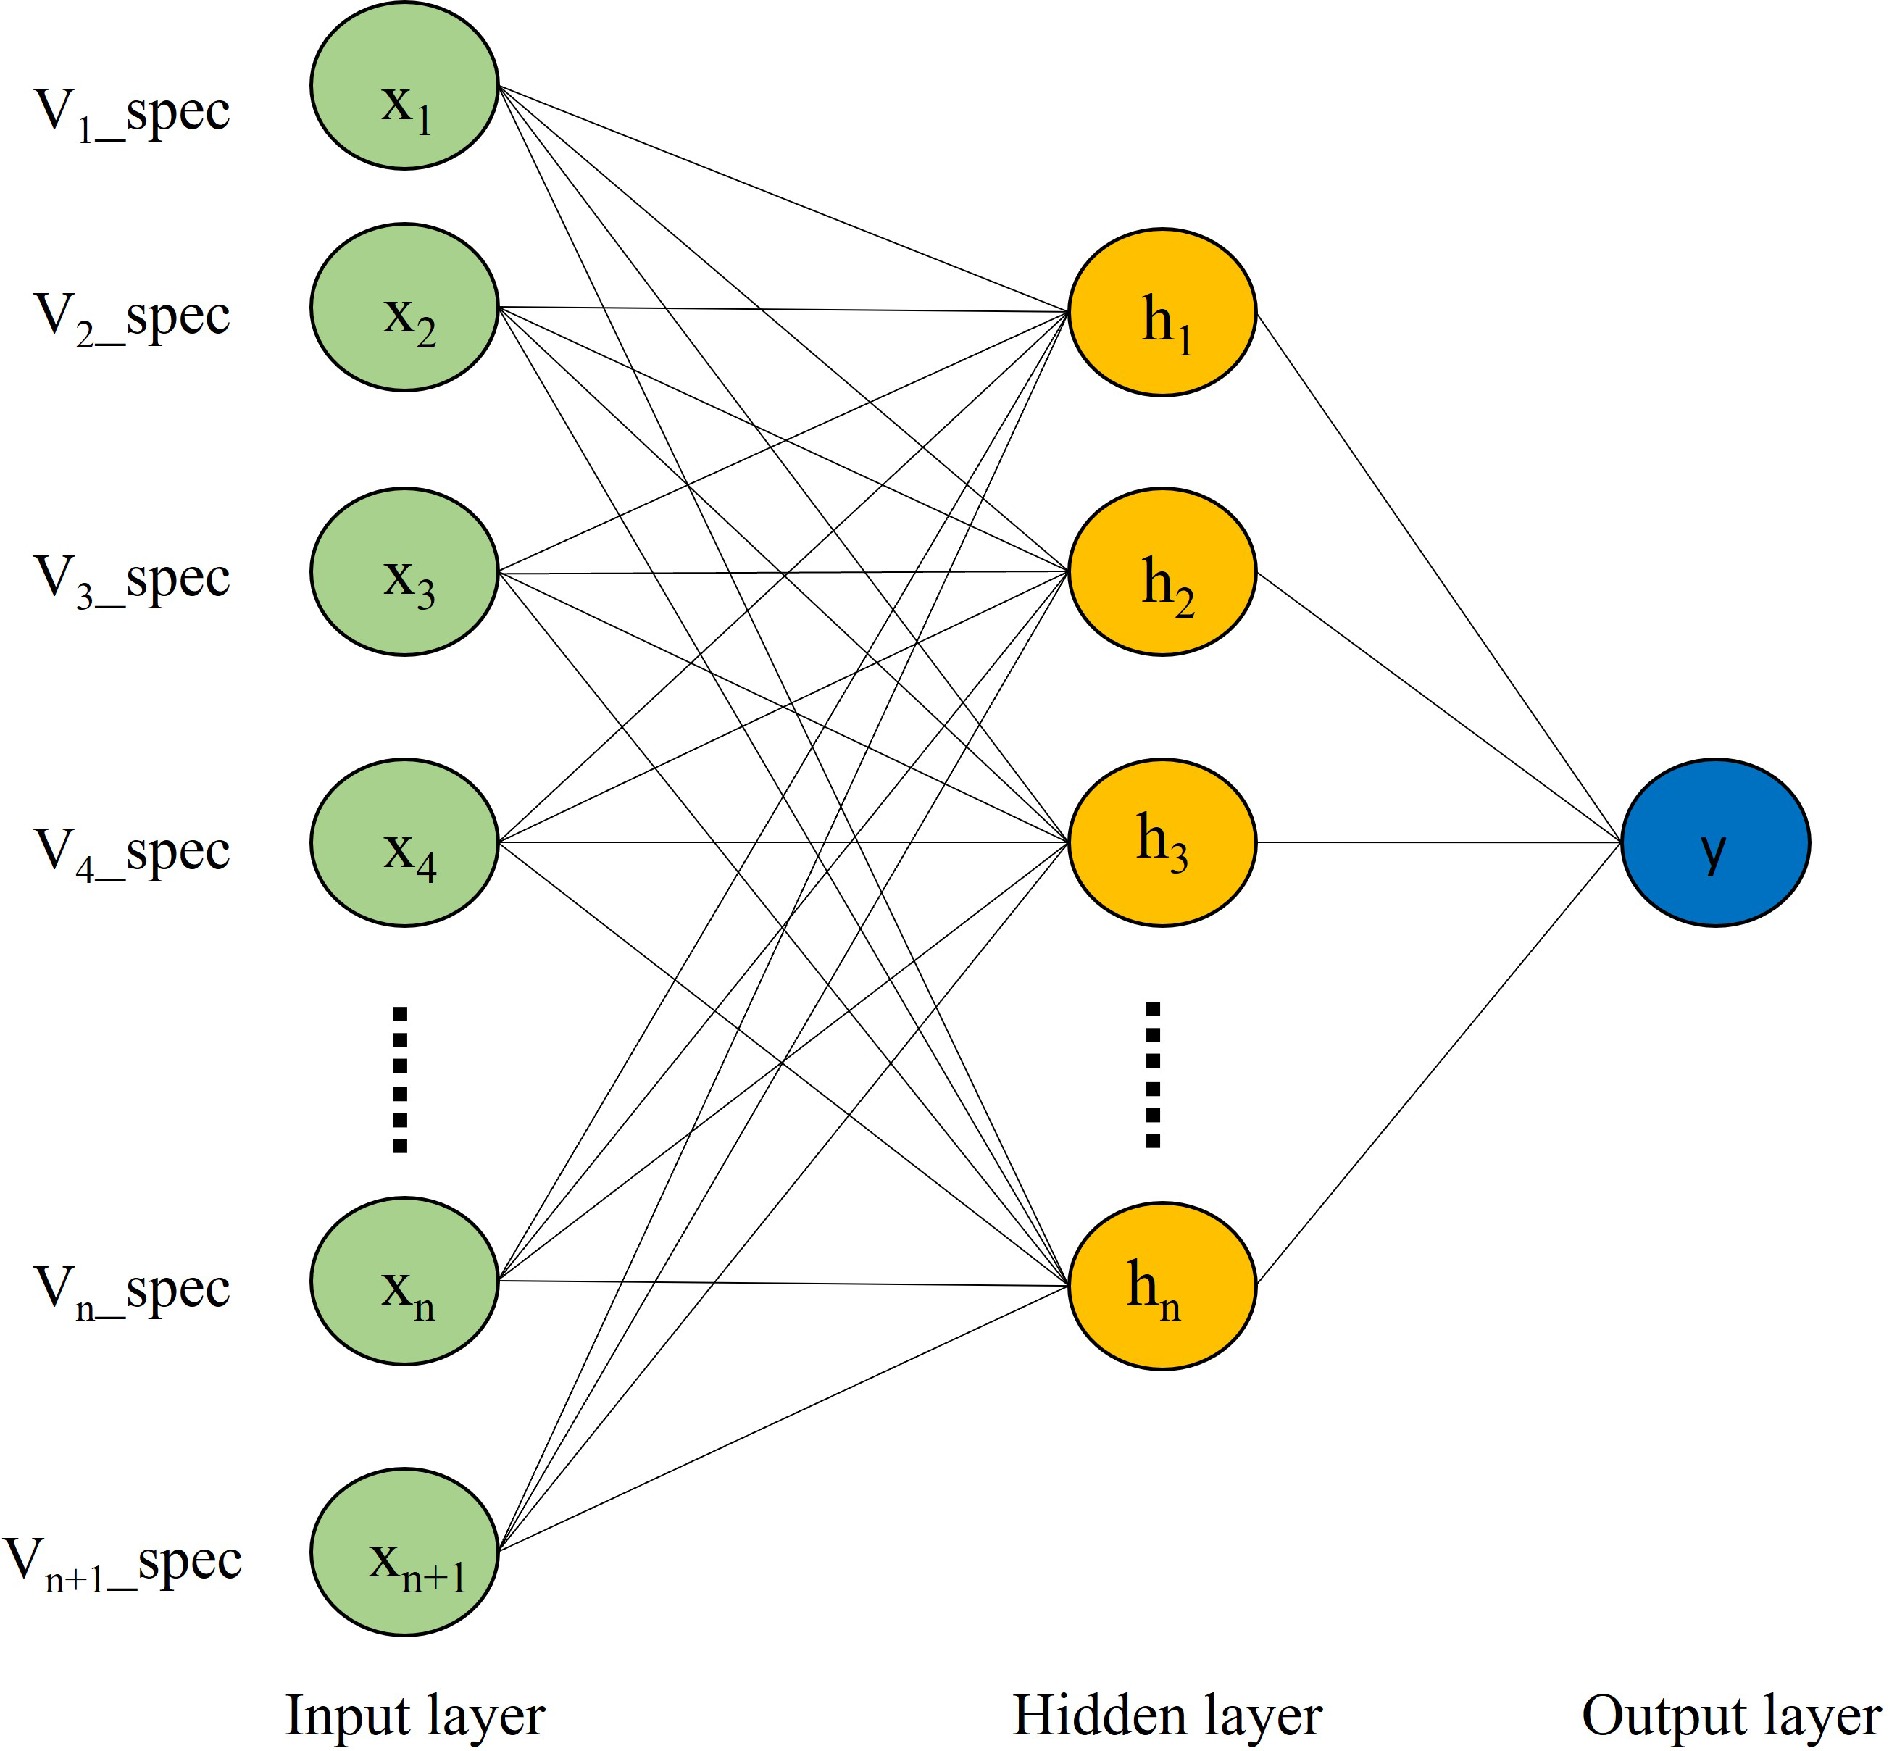
      Figure 4. 

      ANNs structure.

    • By employing r-squared of the calibration set (R2C), r-squared of the prediction set (R2P), root mean square error of the calibration set (RMSEC) and root mean square error of the prediction set (RMSEP), the evaluation of the model's predictive capability was conducted. Through a thorough examination of both the modeling and validation accuracies, the most optimal prediction model can be determined. The calculation formulas for R2 and RMSE can be defined as follows:

      R2=1ni(yiˆyi)2ni(yi¯yi)2 (7)
      RMSE=ni=1(yiˆyi)2n (8)

      Where, yi and ˆyi are the measured and predicted values, respectively. ¯yi is the average of the measured value, n is the total number of sample test data sets.

    • After capturing the hyperspectral images, the LCC and LWC of Chinese fir seedlings were destructively determined immediately. As shown in Fig. 5, the LCC and LWC gradually decreased with the extension of drought time, and significant differences were observed between different drought treatments. The average LCC of seedlings in D0 was 2.4 mg/g, while in D56 it was only 0.1 mg/g (Fig. 5a). Similarly, the average LWC of seedlings in D0 was 68%, whereas in D56 it was only 9% (Fig. 5b). These measured data were used as the ground truth for model training and validation.
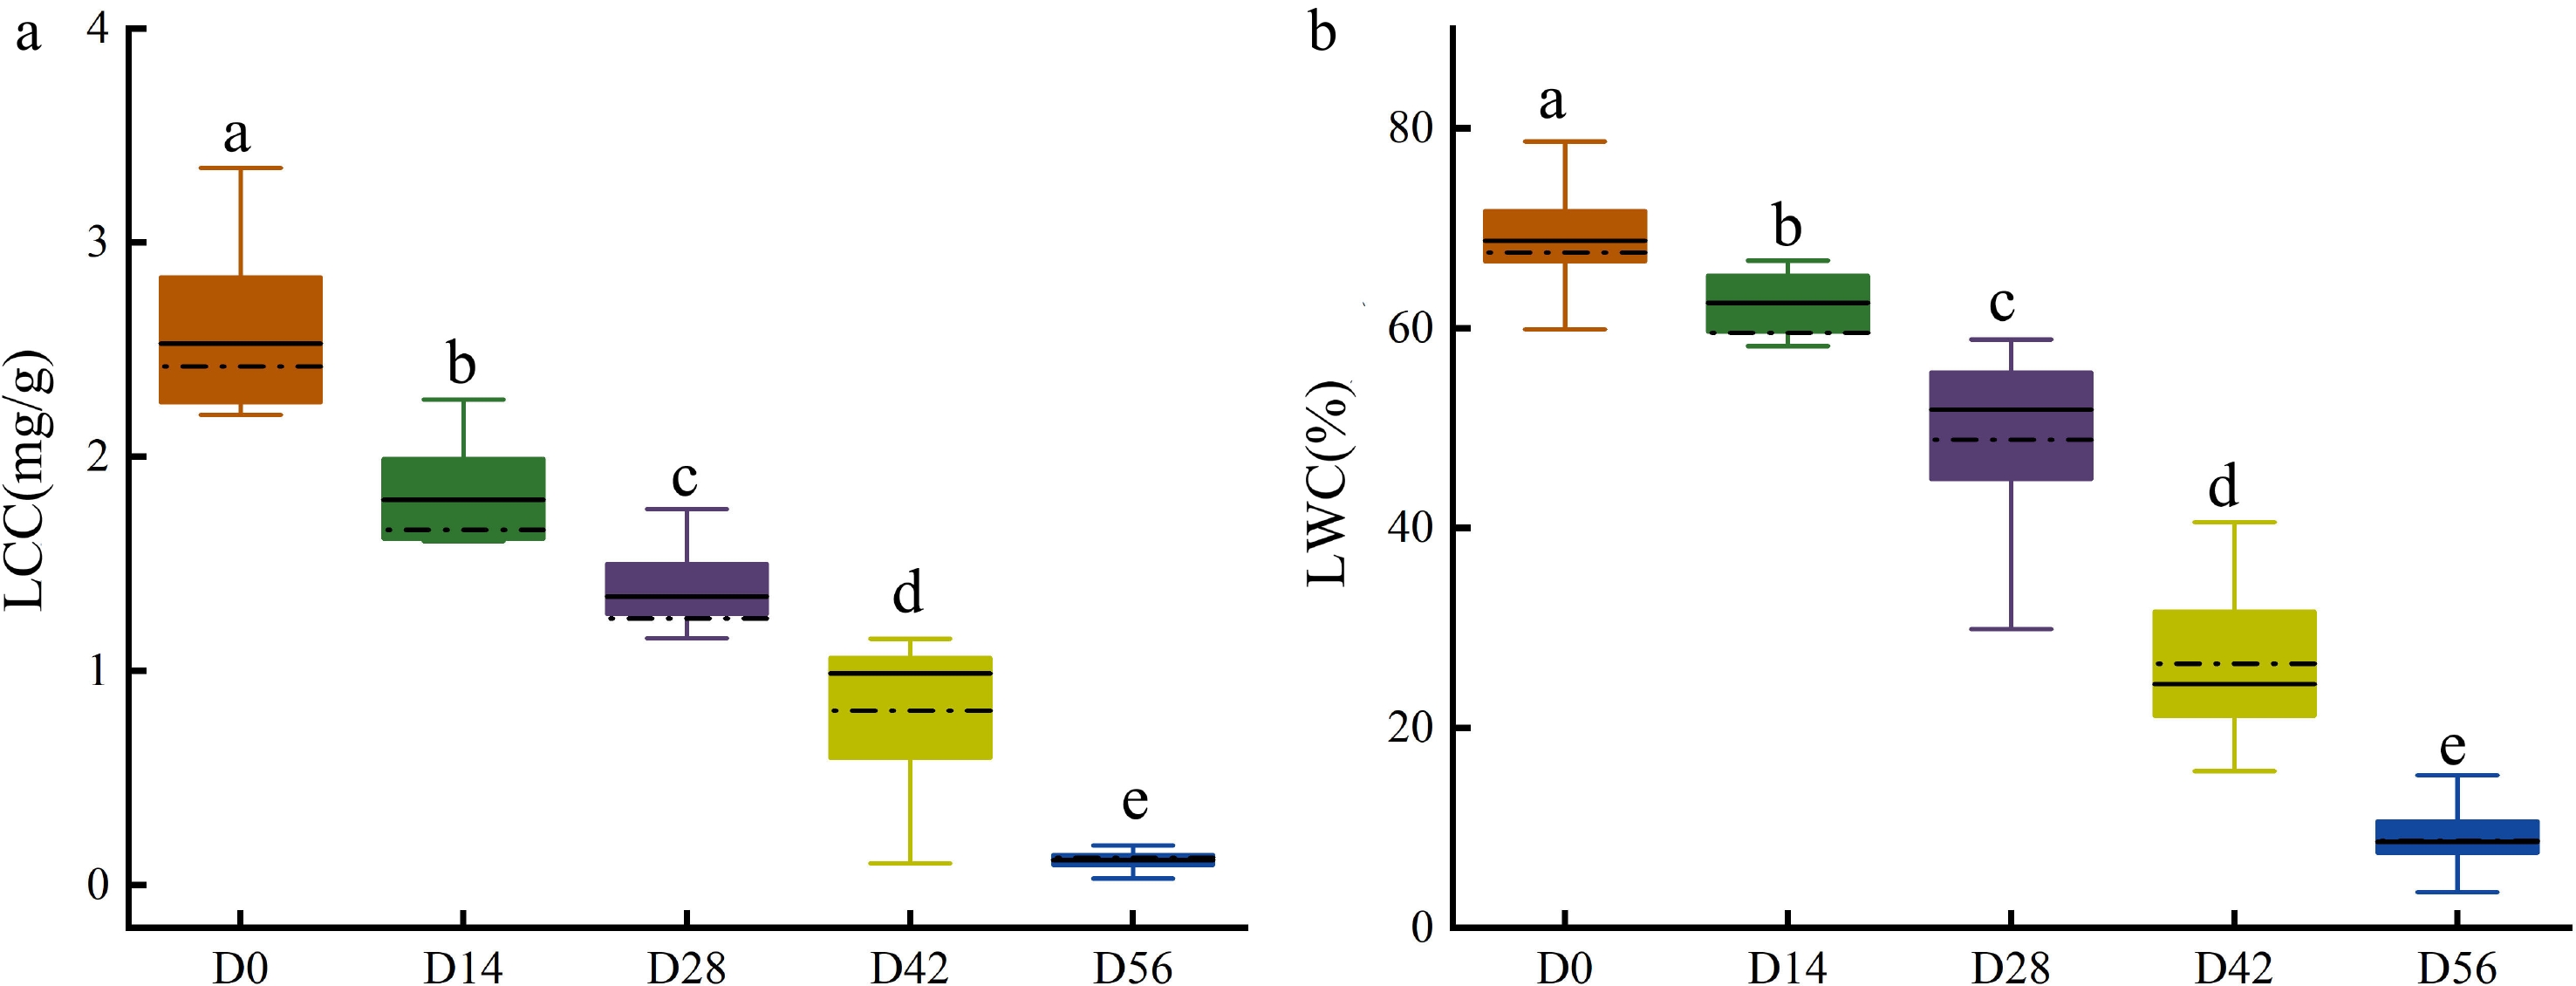
      Figure 5. 

      Measured (a) LCC and (b) LWC in Chinese fir seedlings of the five drought treatment groups.

    • The raw and average reflectance spectral curves for seedlings with different LCC and LWC were shown in Fig. 6a & b, respectively. As can be seen in the figure, the spectral curves of all seedlings showed a similar pattern (Fig. 6a), while the spectral data was sensitive to the changes in LCC and LWC, resulting in fluctuating reflectance with the changes of LCC and LWC (Fig. 6b). The absorption peaks around 1,450 and 970 nm were observed in all datasets (Fig. 6b), which are related to the O–H first and second overtones of water, respectively[4043]. Similarly, an absorption peak near 1,100 nm appeared in all samples is associated with the second overtone of N-H in chlorophyll[44]. Additionally, a broad absorption peak near 1,190 nm caused by the C-H stretching vibration of CH3[5]. The variation in this spectral reflectance could potentially help discriminate the physiochemical properties between samples[45].
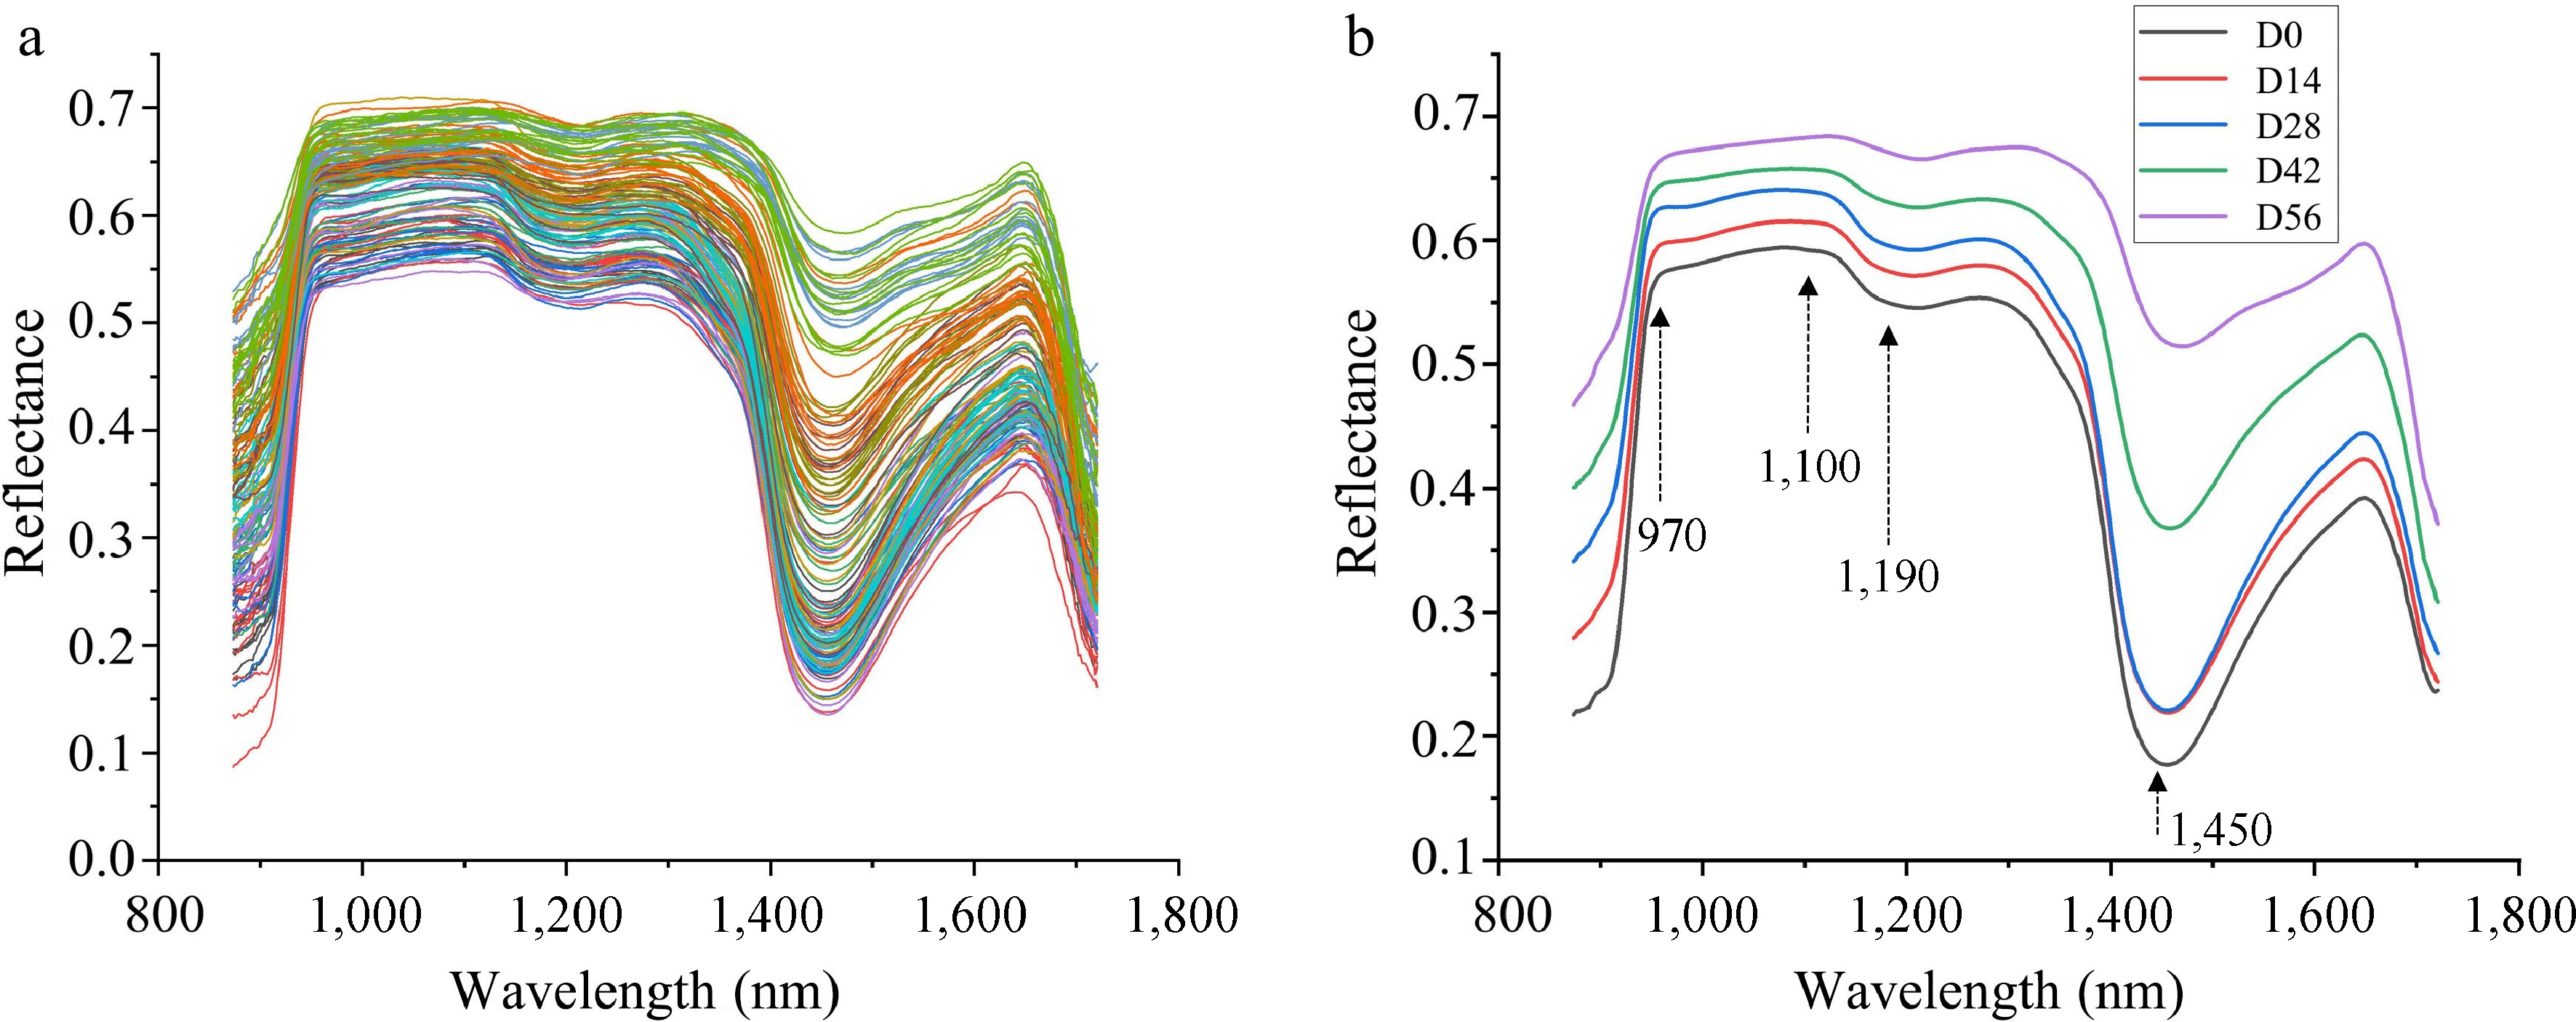
      Figure 6. 

      (a) Raw reflectance curves and (b) average reflectance curves of Chinese fir seedlings with different LCC and LWC.

    • It is necessary to perform spectral preprocessing to remove noise and invalid information introduced by environmental factors and instrument noise[46]. Many spectral preprocessing methods have been reported, and the choice of preprocessing method depends on the nature of the spectrum and the component features that need to be predicted[47]. In the present study, the raw hyperspectral data were pre-processed using SG, MSC and SNV, respectively. As shown in Fig. 7, SG could effectively eliminate spectral deviation caused by different scattering levels and retain the spectral characteristics (Fig. 7a), while the MSC and SNV changed the spectral curves by removing many spectral information (Fig. 7b & c). Further evaluation on these pre-processed data was also performed by employing the partial least squares discriminant analysis (PLS-DA) to develop the multivariate models. As shown in Table 1, the SG derivative exhibited the best results for predicting LCC with an R2C of 0.9166, RMSEC of 0.2587, R2P of 0.8616, and RMSEP of 0.3547. Furthermore, the SG derivative-PLS-DA model also achieved the best results for LWC prediction with an R2C of 0.9350, RMSEC of 0.0552, R2P of 0.9048, and RMSEP of 0.0661. These results indicated that SG pre-processing could enhance the correlation between spectrum and measured data. Based on these findings, the SG pre-processed spectral data were chosen as the optimal datasets for subsequent prediction analysis.
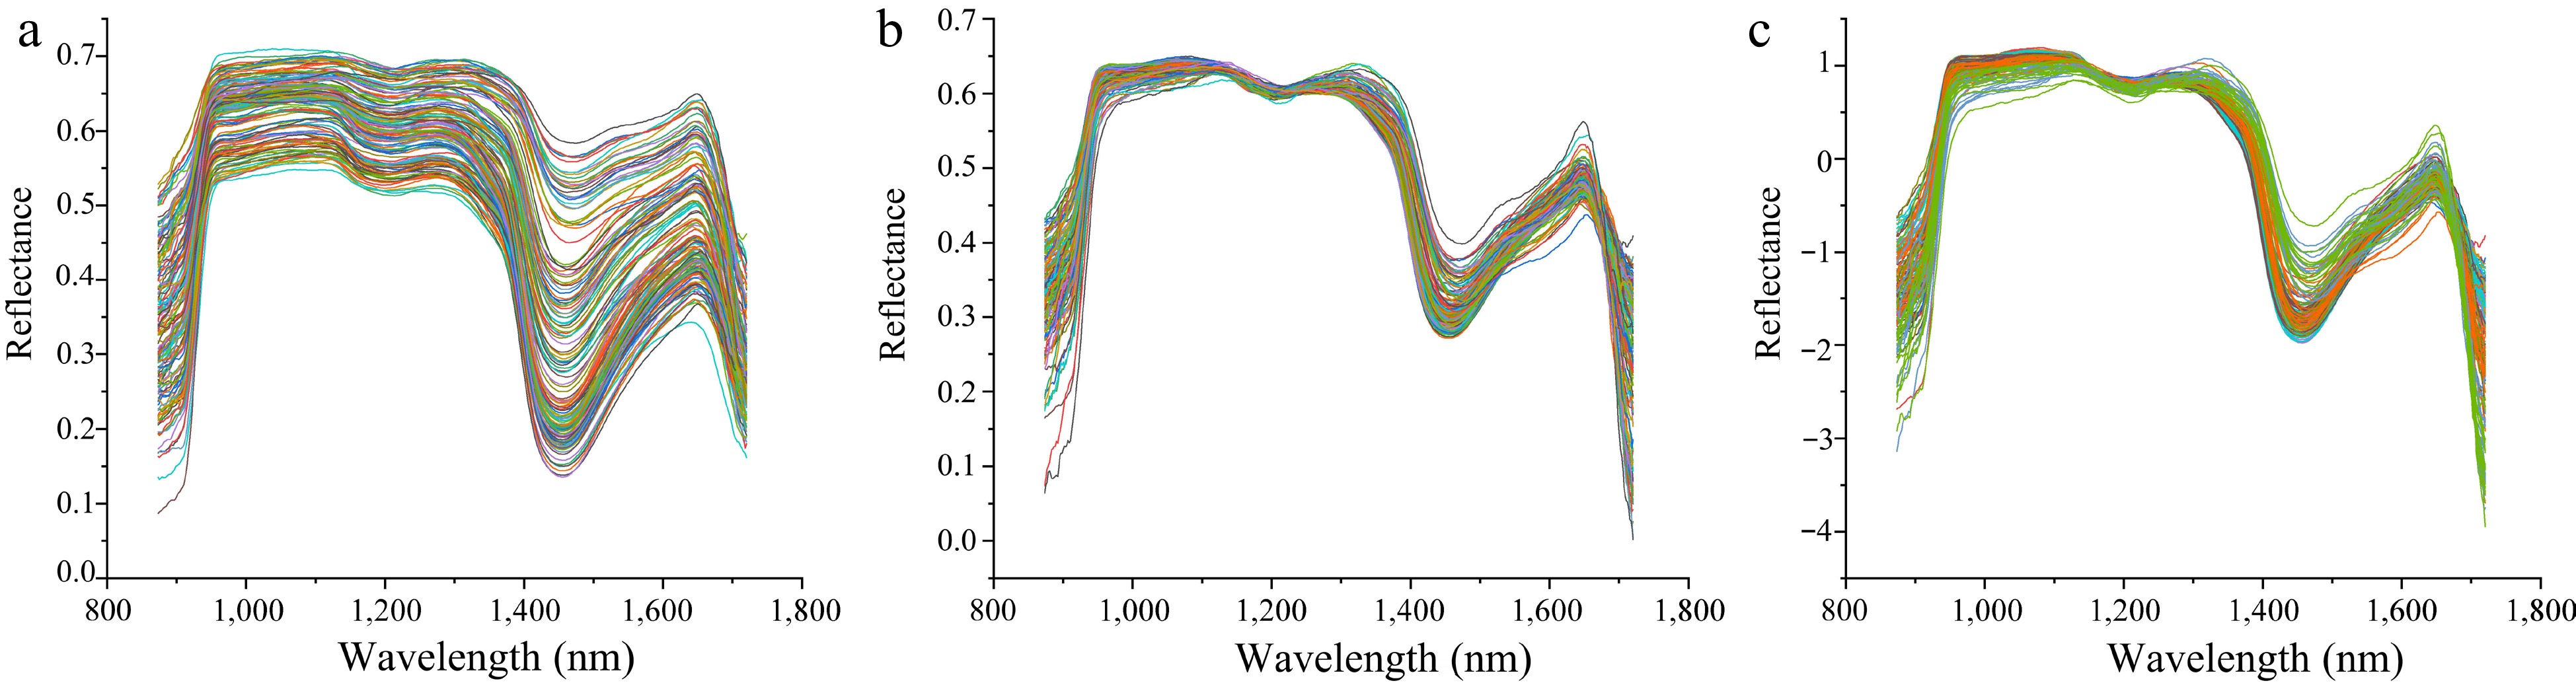
      Figure 7. 

      Comparison of different preprocessing methods for hyperspectral data. (a) Hyperspectral data preprocessed by SG. (b) Hyperspectral data preprocessed by MSC. (c) Hyperspectral data preprocessed by SNV.

      Table 1.  Influence of different preprocessing methods on LCC and LWC prediction.

      Index Preprocessing Calibration set Prediction set
      R2C RMSEC R2P RMSEP
      LCC None 0.8943 0.2835 0. 8198 0.3268
      MSC 0.8140 0.3654 0.7756 0.4405
      SG 0.9166 0.2587 0.8616 0.3547
      SNV 0.8322 0.3491 0.7135 0.5053
      LWC None 0.9023 0.0540 0.8904 0.0771
      MSC 0.8983 0.0694 0.7832 0.1027
      SG 0.9350> 0.0552 0.9048 0.0661
      SNV 0.9120 0.0459 0.8714 0.1073
    • To improve the prediction performance of the model and reduce redundancy and collinearity in the spectral data, the SPA and CARS selection algorithms were utilized to extract characteristic wavelengths from the SG preprocessed spectra. Figure 8 illustrates the results of the SPA algorithm for wavelength selection in LCC and LWC prediction. The variation of RMSE relative to the number of wavelengths is depicted in Fig. 8a & c. It can be observed that the RMSE decreased as the number of included variables increased. This decreasing trend continued until the number of included wavelengths reached 10 (RMSE = 0.33266) for LCC prediction and 13 (RMSE = 0.07103) for LWC prediction, respectively. Therefore, 10 and 13 characteristic wavelengths were selected for LCC and LWC prediction, respectively. Figure 8b & d shows the distribution of the selected characteristic wavelengths.
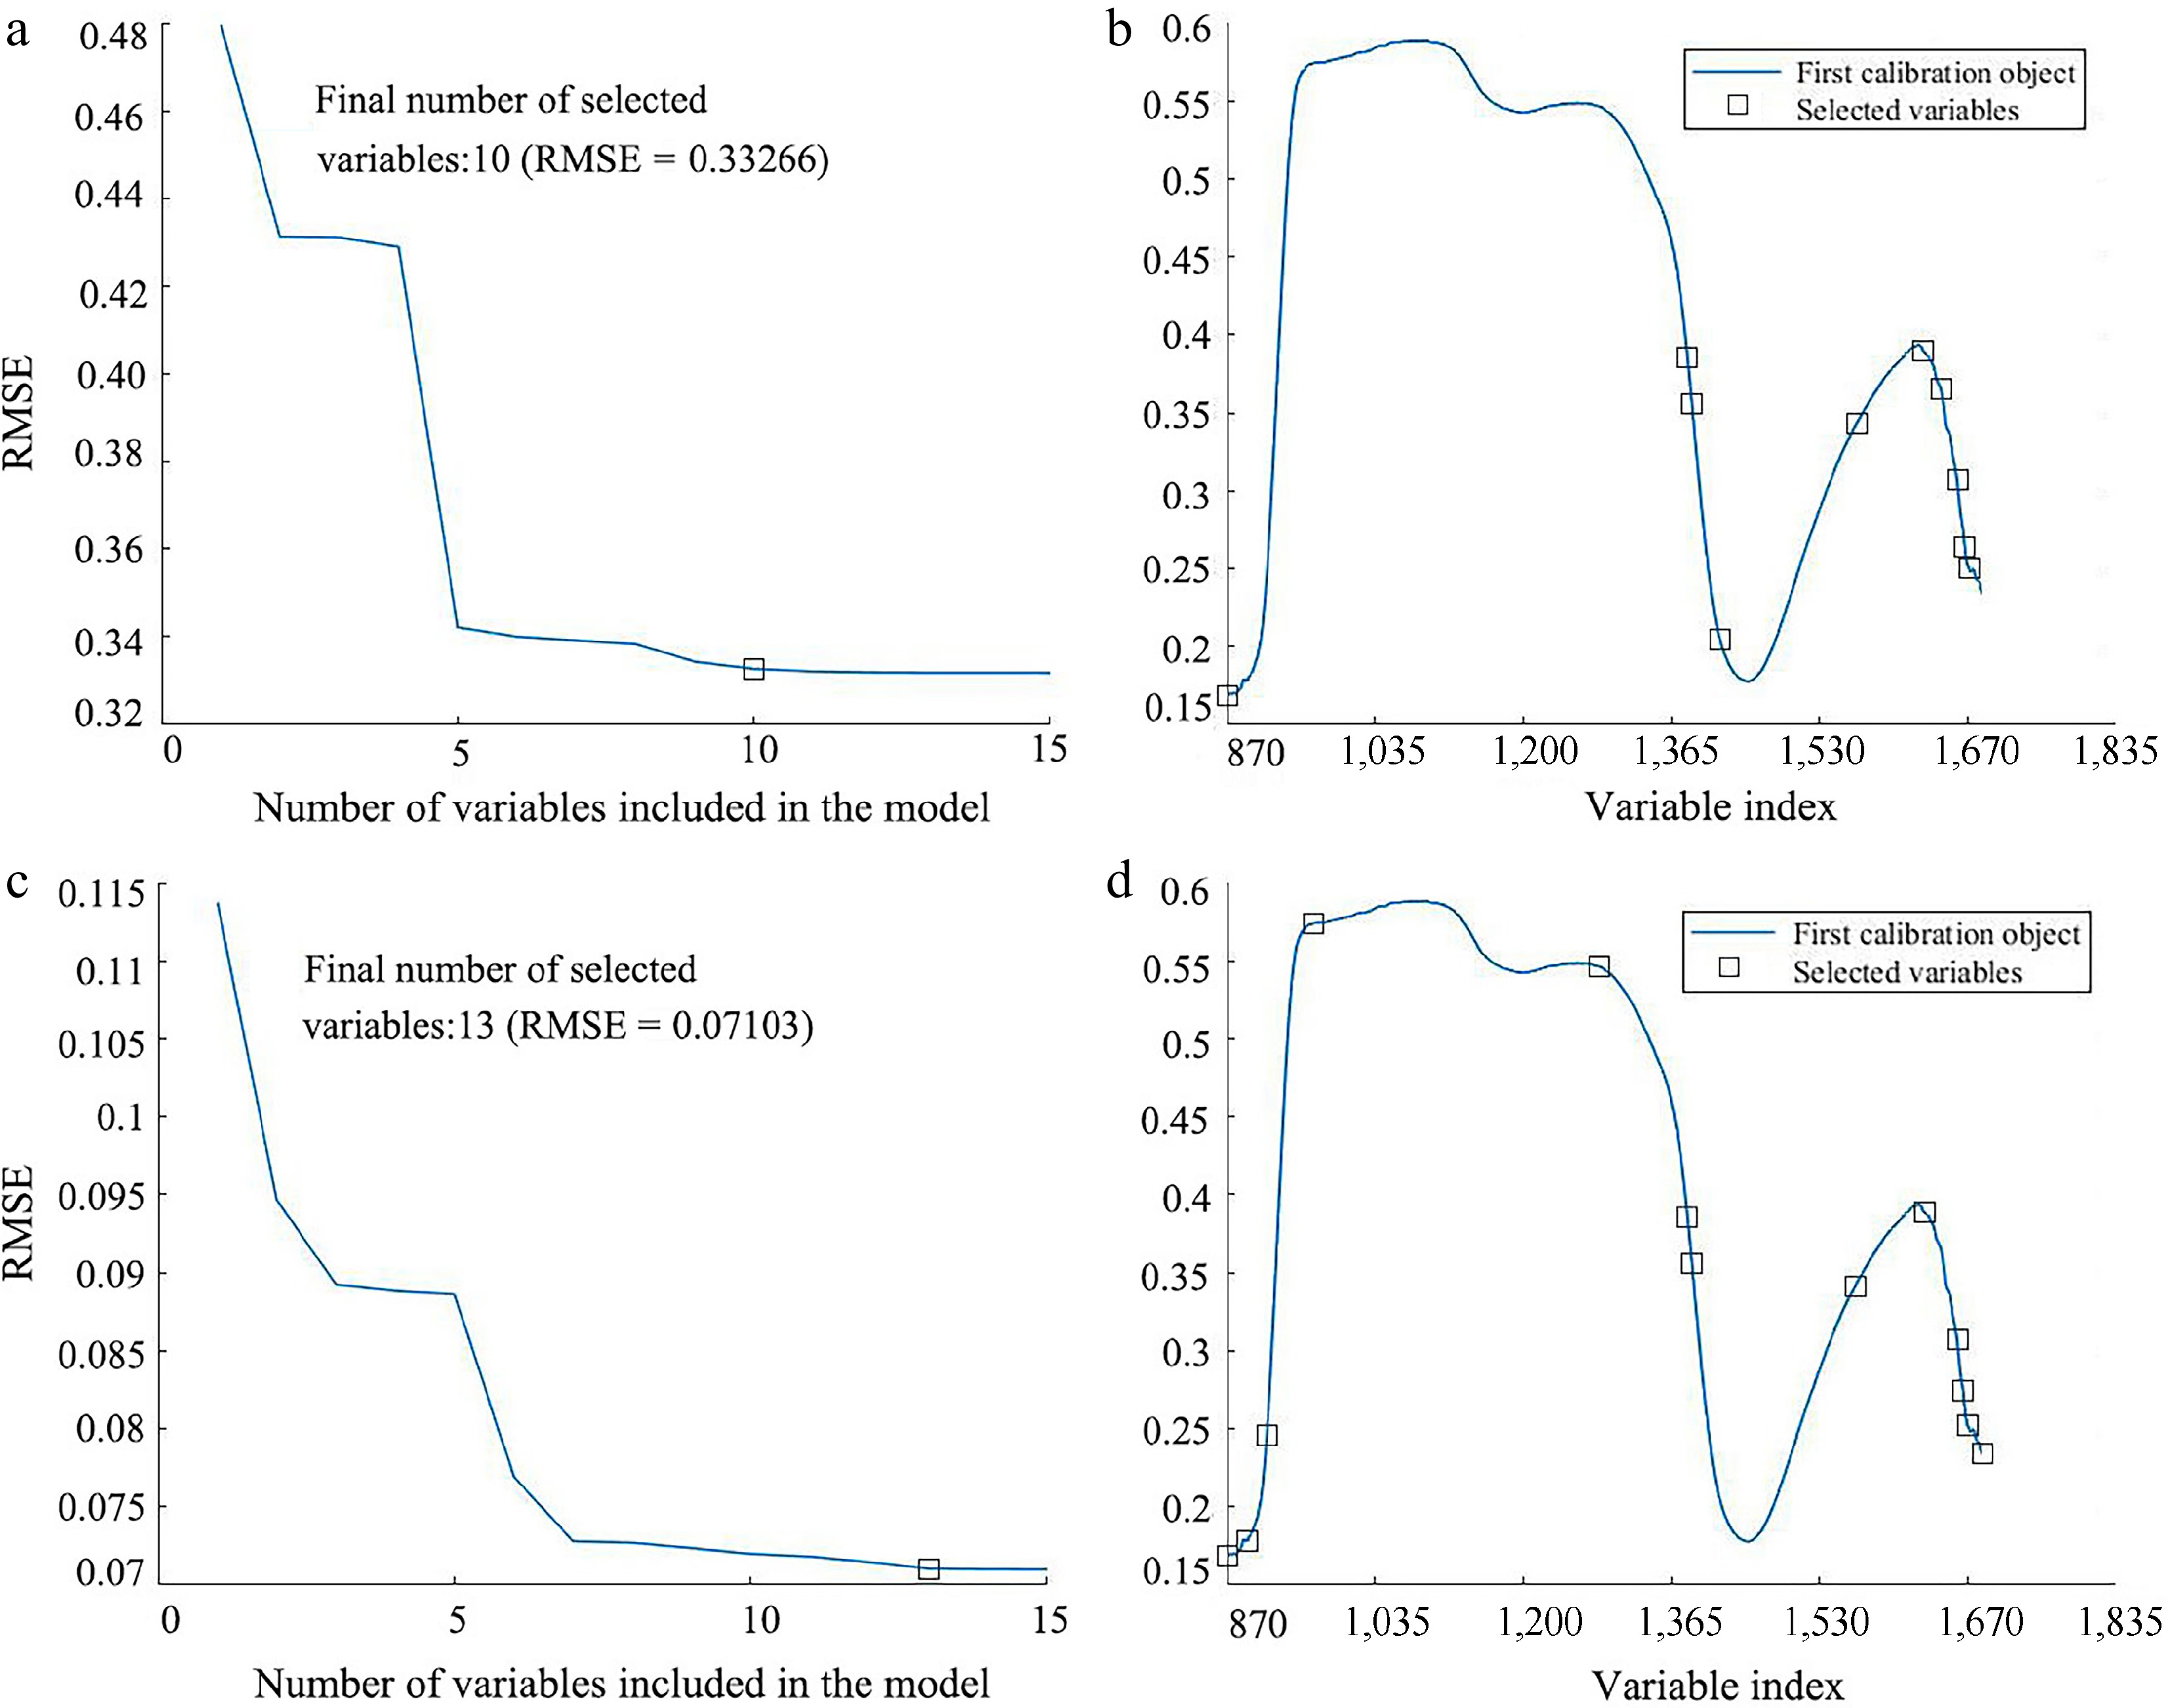
      Figure 8. 

      Result of applying SPA wavelength selection on the SG pre-processed spectrum for predicting LCC and LWC. (a) Variation of RMSE vs the number of wavelengths, and (b) the selected wavelengths for LCC prediction. (c) Variation of RMSE vs the number of wavelengths, and (d) the selected wavelengths for LWC prediction.

      The CARS algorithm was also reported as an effective wavelength selection method in various studies[4850]. The processes of applying the CARS algorithm on the SG preprocessed data for LCC and LWC prediction are presented in Fig. 9. As shown in Fig. 9a, it can be seen that the number of sampled wavelengths decreased rapidly during the initial step of MC sampling. However, the decreasing trend became milder after the first sharp fall during the refined selection, which can be attributed to the exponentially decreasing function (EDF) in feature selection. The variations of the RMSE value of tenfold cross-validation are shown in Fig. 9b. The RMSE value decreased quickly until the sampling run of 21, after which it increased again. The optimal number of wavelengths, indicated by the vertical star line in Fig. 9c, was 53 out of the 512 wavelengths (approximately 10.35%). A similar process was followed for the prediction of LWC using CARS (Fig. 9df). As shown in Fig. 9f, at the 26th sampling run, 29 characteristic wavelengths (approximately 5.66% of 512 bands) were obtained.
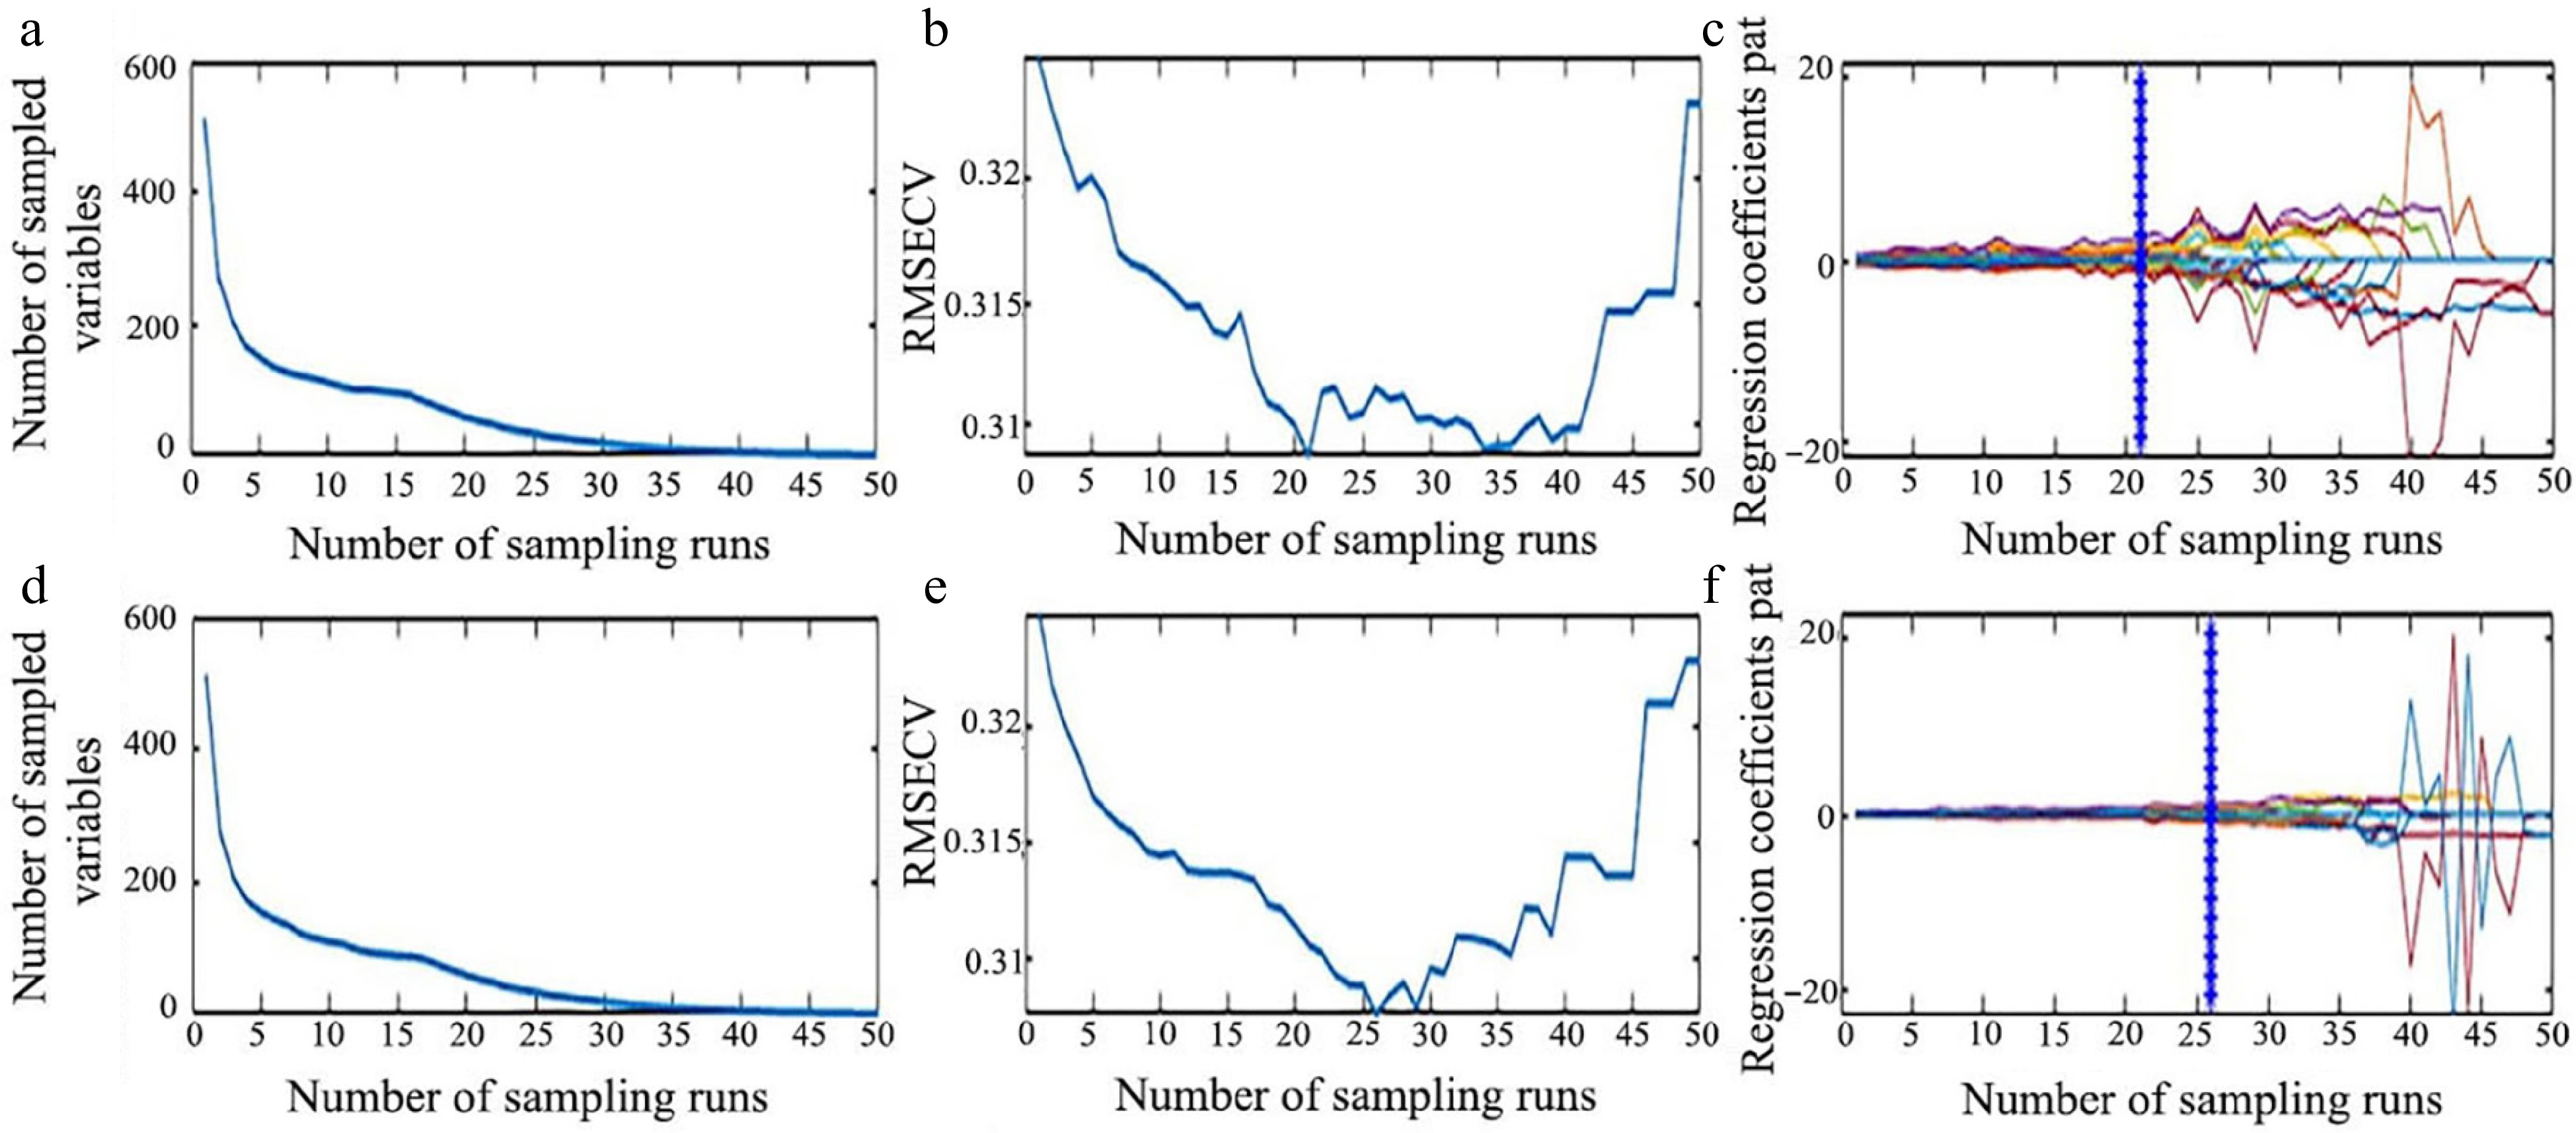
      Figure 9. 

      Process of extracting characteristic wavelength by CARS. (a) Number of preferred characteristic wavelength variables, (b) the root mean square error of cross-validation variation, and (c) regression coefficient path map for LCC. (d) Number of preferred characteristic wavelength variables, (e) the root mean square error of cross-validation variation, and (f) regression coefficient path map for LWC.

      The wavelengths selected by SPA and CARS algorithms for the prediction of LCC and LWC in this study are listed in Table 2. For LCC, the characteristic wavelengths are mostly concentrated in the band range of 870−960, 1,100−1,200, and 1,400−1,700 nm (Table 2). Among the selected wavelengths, the wavelengths distributed between 1,425−1,440 and 1,600−1,700 nm are similar to the characteristic wavelengths of 1,420 and 1,694 nm for LCC in Toona sinensis samples[26]. Additionally, the selected wavelengths from 1,100−1,200 nm have shown associations with the vibrations of the C-H and N-H groups found in chlorophyll[51]. As for the LWC, the chosen wavelengths of 873.5, 881.9, 885.3, 895.3, 1,289.9, 1,389.3, 1,440.5, 1,549.4, 1,575.7, 1,580.7, 1,676.1, 1,689.2, and 1,702.3 nm display similarities to the characteristic wavelengths of 871.61, 880.42, 893.5, 1,285.05, 1,395.19, 1,587.44, 1,662.2, and 1,703.41 nm for water content in tea needle leaves[52]. The chosen wavelength of 968.8 nm is associated with the O-H stretching overtones, including the first, second, and third overtones[53]. The chosen wavelengths of 1,213.6, 1,394.2, and 1,653, 1,664.6 nm show similarity to the wavelengths of 1,213.69, 1,395.72, 1,659.36, and 1,662.5 nm reported by Song et al. for LWC in rice samples[54].

      Table 2.  Characteristic wavelengths selected by SPA and CARS.

      Selection method Index Number of feature bands Selected wavelengths (nm)
      SPA LCC 10 873.5, 1,387.6, 1,394.2, 1,425.7, 1,577.4, 1,651.4, 1,671.1, 1,689.2, 1,697.4, 1,702.3
      LWC 13 873.5, 895.3, 917, 968.8, 1,289.9, 1,389.3, 1,394.2, 1,575.7, 1,653, 1,689.2, 1,695.8, 1,700.7, 1,702.3
      CARS LCC 53 880.2, 881.9, 883.6, 885.3, 890.3, 953.8, 955.5, 957.1, 958.8, 962.2, 967.2, 1,137.2, 1,138.8, 1,142.2, 1,152.2, 1,153.8, 1,158.8, 1,162.1, 1,213.6, 1,225.3, 1,231.9, 1,233.6, 1,424, 1,430.6, 1,432.3, 1,433.9, 1,435.6, 1,542.8, 1,544.4, 1,546.1, 1,547.7, 1,549.4, 1,552.7, 1,557.6, 1,559.3, 1,560.9, 1,565.9, 1,567.5, 1,574.1, 1,580.7, 1,662.9, 1,664.6, 1,666.2, 1,669.5, 1,671.1, 1,672.8, 1,674.4, 1,676.1, 1,677.7, 1,684.3, 1,699, 1,700.7, 1,702.3
      LWC 29 881.9, 883.6, 885.3, 958.8, 1,213.6, 1,231.9, 1,233.6, 1,427.3, 1,433.9, 1,435.6, 1,440.5, 1,549.4, 1,552.7, 1,554.3, 1,556, 1,557.6, 1,560.9, 1,562.6, 1,565.9, 1,567.5, 1,580.7, 1,664.6, 1,669.5, 1,671.1, 1,672.8, 1,674.4, 1,676.1, 1,700.7, 1,702.3
    • Previous studies have shown the great potential of machine learning models in predicting chlorophyll content and water content of different plant samples[55,56]. In this study, full wavelengths and characteristic wavelengths selected by SPA and CARS were utilized to establish prediction models, respectively. The prediction models were thus built using three machine learning algorithms: PLSR, SVM, and ANNs. The regression results of the established models were evaluated based on the determination coefficient (R2) and RMSE. As shown in Table 3, the models based on wavelengths selected by SPA and CARS exhibited better performance compared to those based on full-band spectral data. This indicates that SPA and CARS can reduce the redundancy of input variables in the model and help improve its accuracy.

      Table 3.  The prediction results of LCC and LWC by PLSR, SVM and ANNs models full and selected wavelengths.

      Index Model Number
      of bands
      Calibration set Prediction set
      R2C RMSEC R2P RMSEP
      LCC Full-PLSR 512 0.797 0.363 0.839 0.359
      SPA-PLSR 10 0.804 0.360 0.842 0.354
      CARS -PLSR 53 0.805 0.358 0.843 0.353
      Full-SVM 512 0.830 0.350 0.820 0.392
      SPA-SVM 10 0.812 0.380 0.770 0.450
      CARS-SVM 53 0.830 0.360 0.820 0.397
      Full-ANNs 512 0.930 0.240 0.870 0.349
      SPA-ANNs 10 0.920 0.267 0.924 0.300
      CARS-ANNs 53 0.932 0.224 0.969 0.157
      LWC Full-PLSR 512 0.856 0.070 0.901 0.082
      SPA-PLSR 13 0.804 0.360 0.842 0.354
      CARS -PLSR 29 0.858 0.072 0.901 0.079
      Full-SVM 512 0.873 0.079 0.930 0.060
      SPA-SVM 13 0.850 0.090 0.920 0.062
      CARS-SVM 29 0.858 0.078 0.929 0.063
      Full-ANNs 512 0.954 0.187 0.873 0.348
      SPA-ANNs 13 0.952 0.049 0.948 0.051
      CARS-ANNs 29 0.952 0.050 0.940 0.058

      For LCC prediction, it is obvious that the CARS-ANNs model, using 53 characteristic wavelengths as input has achieved the best performance with the values of R²C and R²P reaching 0.932 and 0.969, and RMSEC and RMSEP are 0.224 and 0.157, respectively (Table 3). Meanwhile, the SPA-ANNs model, requiring 13 feature wavelengths exhibited the most accurate prediction for LWC, and the obtained R²C, RMSEC, and R²P and RMSEP were 0.952, 0.049, and 0.948, 0.051, respectively (Table 3). Furthermore, the performances of the CARS-ANNs and SPA-ANNs models were verified by correlation analysis. The result also showed high prediction accuracy of both models for LCC and LWC, respectively (Fig. 10). In summary, the use of wavelength selection techniques significantly enhanced the prediction accuracy of LWC and LCC. On the other hand, among all the established models, ANN-based models achieved better performance than SVM and PLSR (Table 3). This suggests the great potential of ANN in the phenotypic evaluation of plants[44,57].
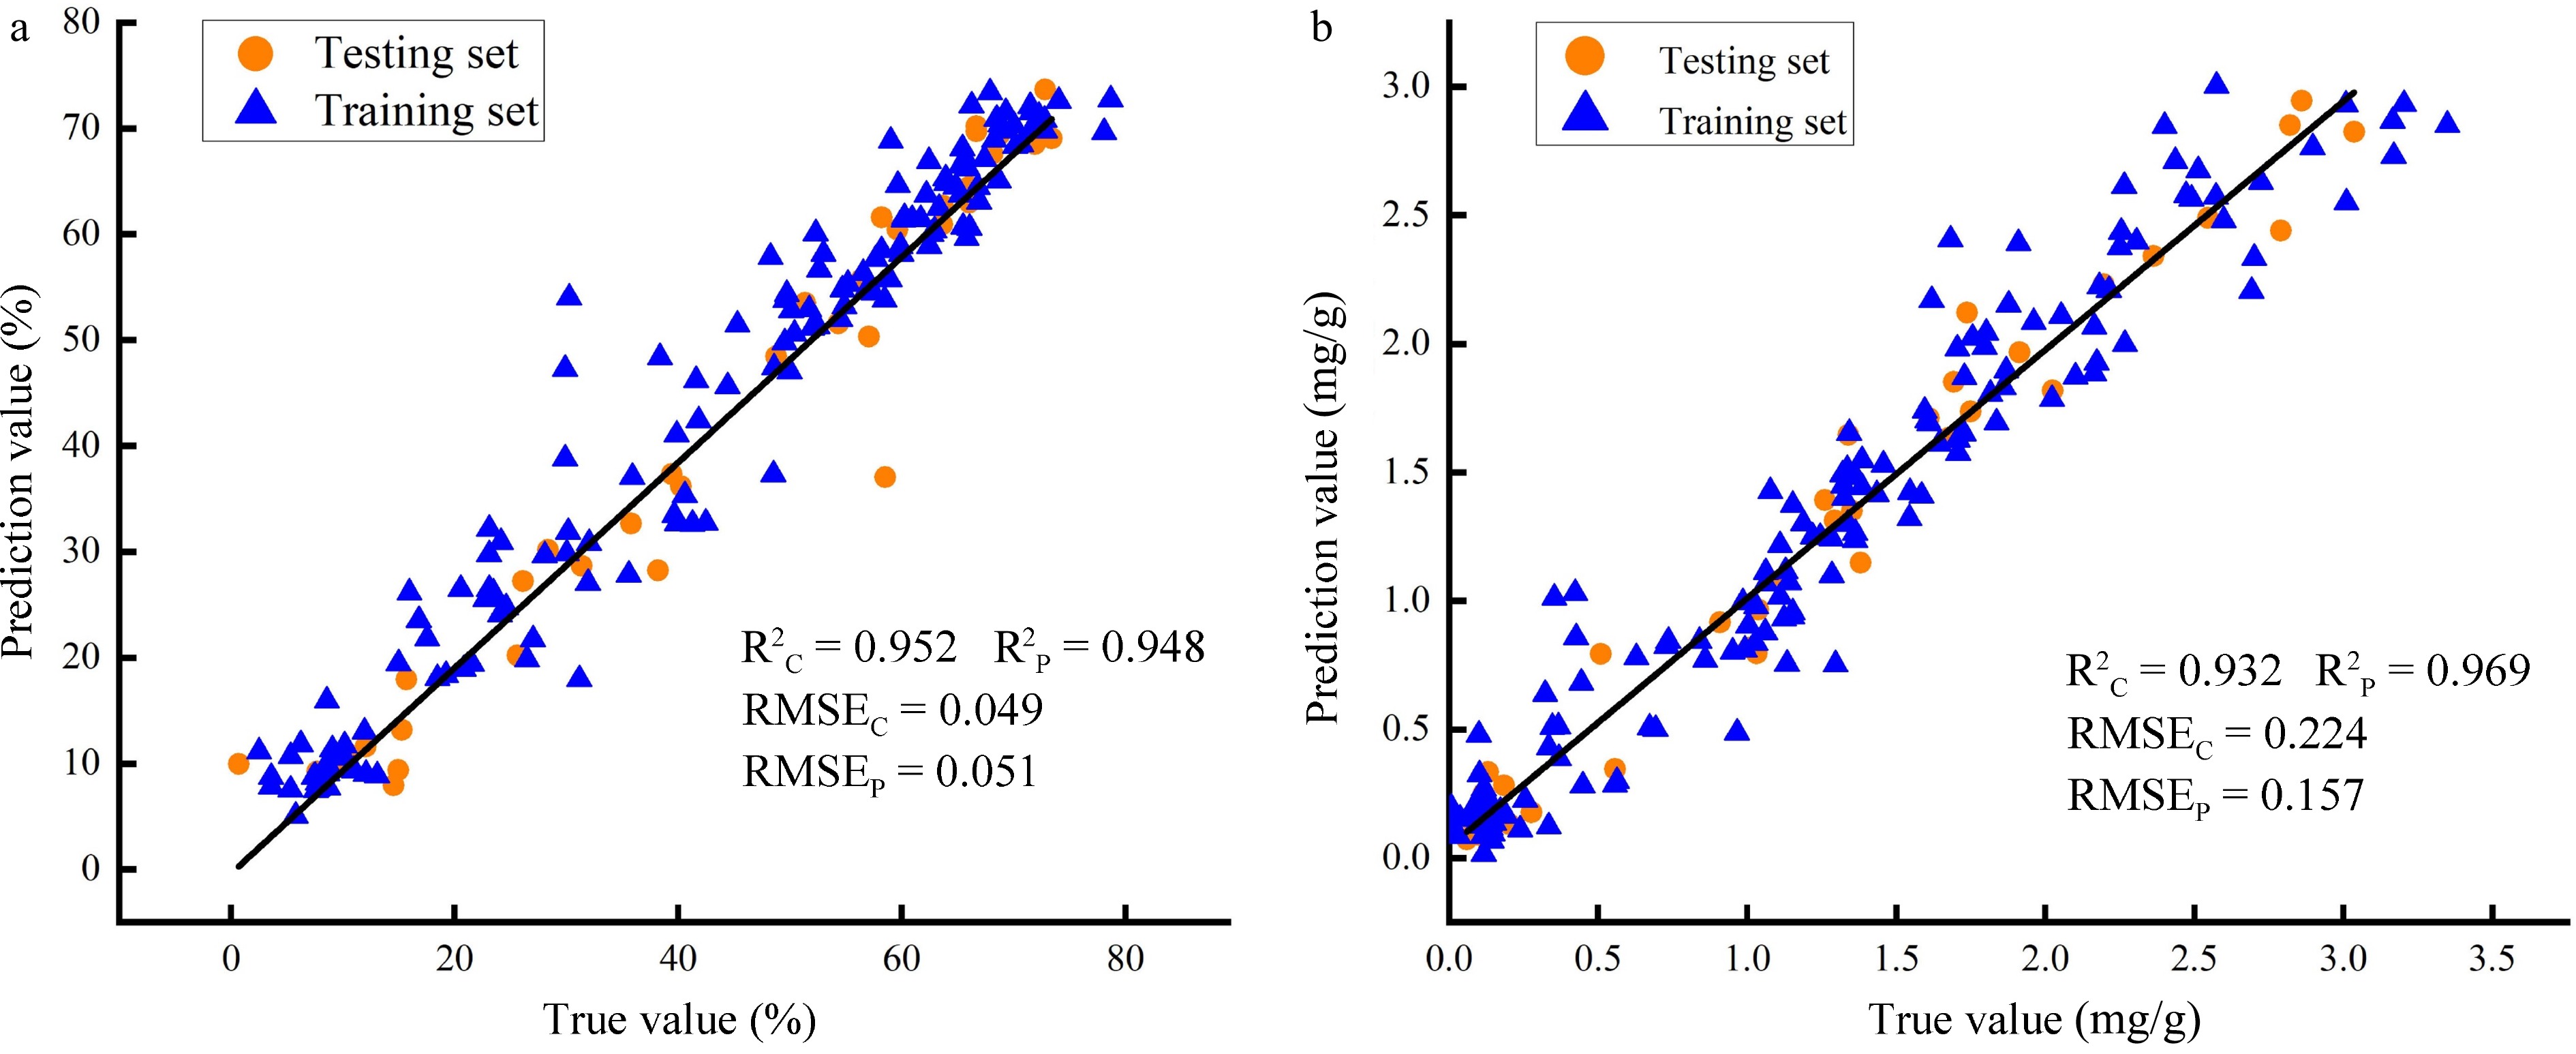
      Figure 10. 

      Correlation analysis between true and prediction values. (a) Prediction accuracy of SPA-ANNs model for LWC; (b) Prediction accuracy of CARS-ANNs model for LCC.

    • This study aimed to investigate the application of hyperspectral imaging in predicting the needle leaf chlorophyll content (LCC) and needle leaf water content (LWC) of Chinese fir seedlings. Reflectance images were captured from seedlings with varying levels of LCC and LWC. Various spectral data preprocessing algorithms were applied, followed by two wavelength selection methods, to prepare the necessary variables for establishing prediction models. The results showed that the Savitzky-Golay (SG) preprocessing method was the most effective at removing background noise and interference factors. Additionally, the wavelengths selected by the Successive Projections Algorithm (SPA) were identified to be the optimal features for predicting LWC, while the wavelengths selected by the Competitive Adaptive Reweighted Sampling (CARS) method were the most suitable variables for predicting LCC. Eventually, the CARS-ANNs model achieved the highest performance in predicting LCC, with an R2P value of 0.941 and RMSEP value of 0.240. On the other hand, the SPA-ANNs model showed the best performance in predicting LWC, with an R2P value of 0.952 and RMSEP value of 0.049. These results suggest that combining hyperspectral imaging with machine learning models enables the fast, non-destructive, and highly accurate detection of LCC and LWC in Chinese fir seedlings. This study introduces a new method for rapidly and non-destructively evaluating physiological traits for the phenotyping, breeding, and cultivation of conifers like Chinese fir.

    • The authors confirm contribution to the paper as follows: study conception: Xing D, Sun P, Lin E; data collection: Xing D, Jiang M, Sun P; data curation: Wang Y, Miao S, Liu W; writing code, conducting and designing experiments: Xing D, Sun P; writing original manuscript: Sun P, Huang H, Lin E. All authors reviewed the results and approved the final version of the manuscript.

    • The datasets generated during and/or analyzed during the current study are available from the corresponding author on reasonable request.

      • This research was supported by the Key research and development project of Zhejiang Province (2021C02054), Zhejiang Science and Technology Major Program on Agricultural New Variety Breeding (2021C02070-8) and the Zhejiang Provincial Academy Cooperation Forestry Science and Technology Project (2023SY14).

      • The authors declare that they have no conflict of interest.

      • # Authors contributed equally: Dong Xing, Penghui Sun

      • Copyright: © 2024 by the author(s). Published by Maximum Academic Press, Fayetteville, GA. This article is an open access article distributed under Creative Commons Attribution License (CC BY 4.0), visit https://creativecommons.org/licenses/by/4.0/.
    Figure (10)  Table (3) References (57)
  • About this article
    Cite this article
    Xing D, Sun P, Wang Y, Jiang M, Miao S, et al. 2024. Non-destructive estimation of needle leaf chlorophyll and water contents in Chinese fir seedlings based on hyperspectral reflectance spectra. Forestry Research 4: e024 doi: 10.48130/forres-0024-0021
    Xing D, Sun P, Wang Y, Jiang M, Miao S, et al. 2024. Non-destructive estimation of needle leaf chlorophyll and water contents in Chinese fir seedlings based on hyperspectral reflectance spectra. Forestry Research 4: e024 doi: 10.48130/forres-0024-0021

Catalog

  • About this article

/

DownLoad:  Full-Size Img  PowerPoint
Return
Return