-
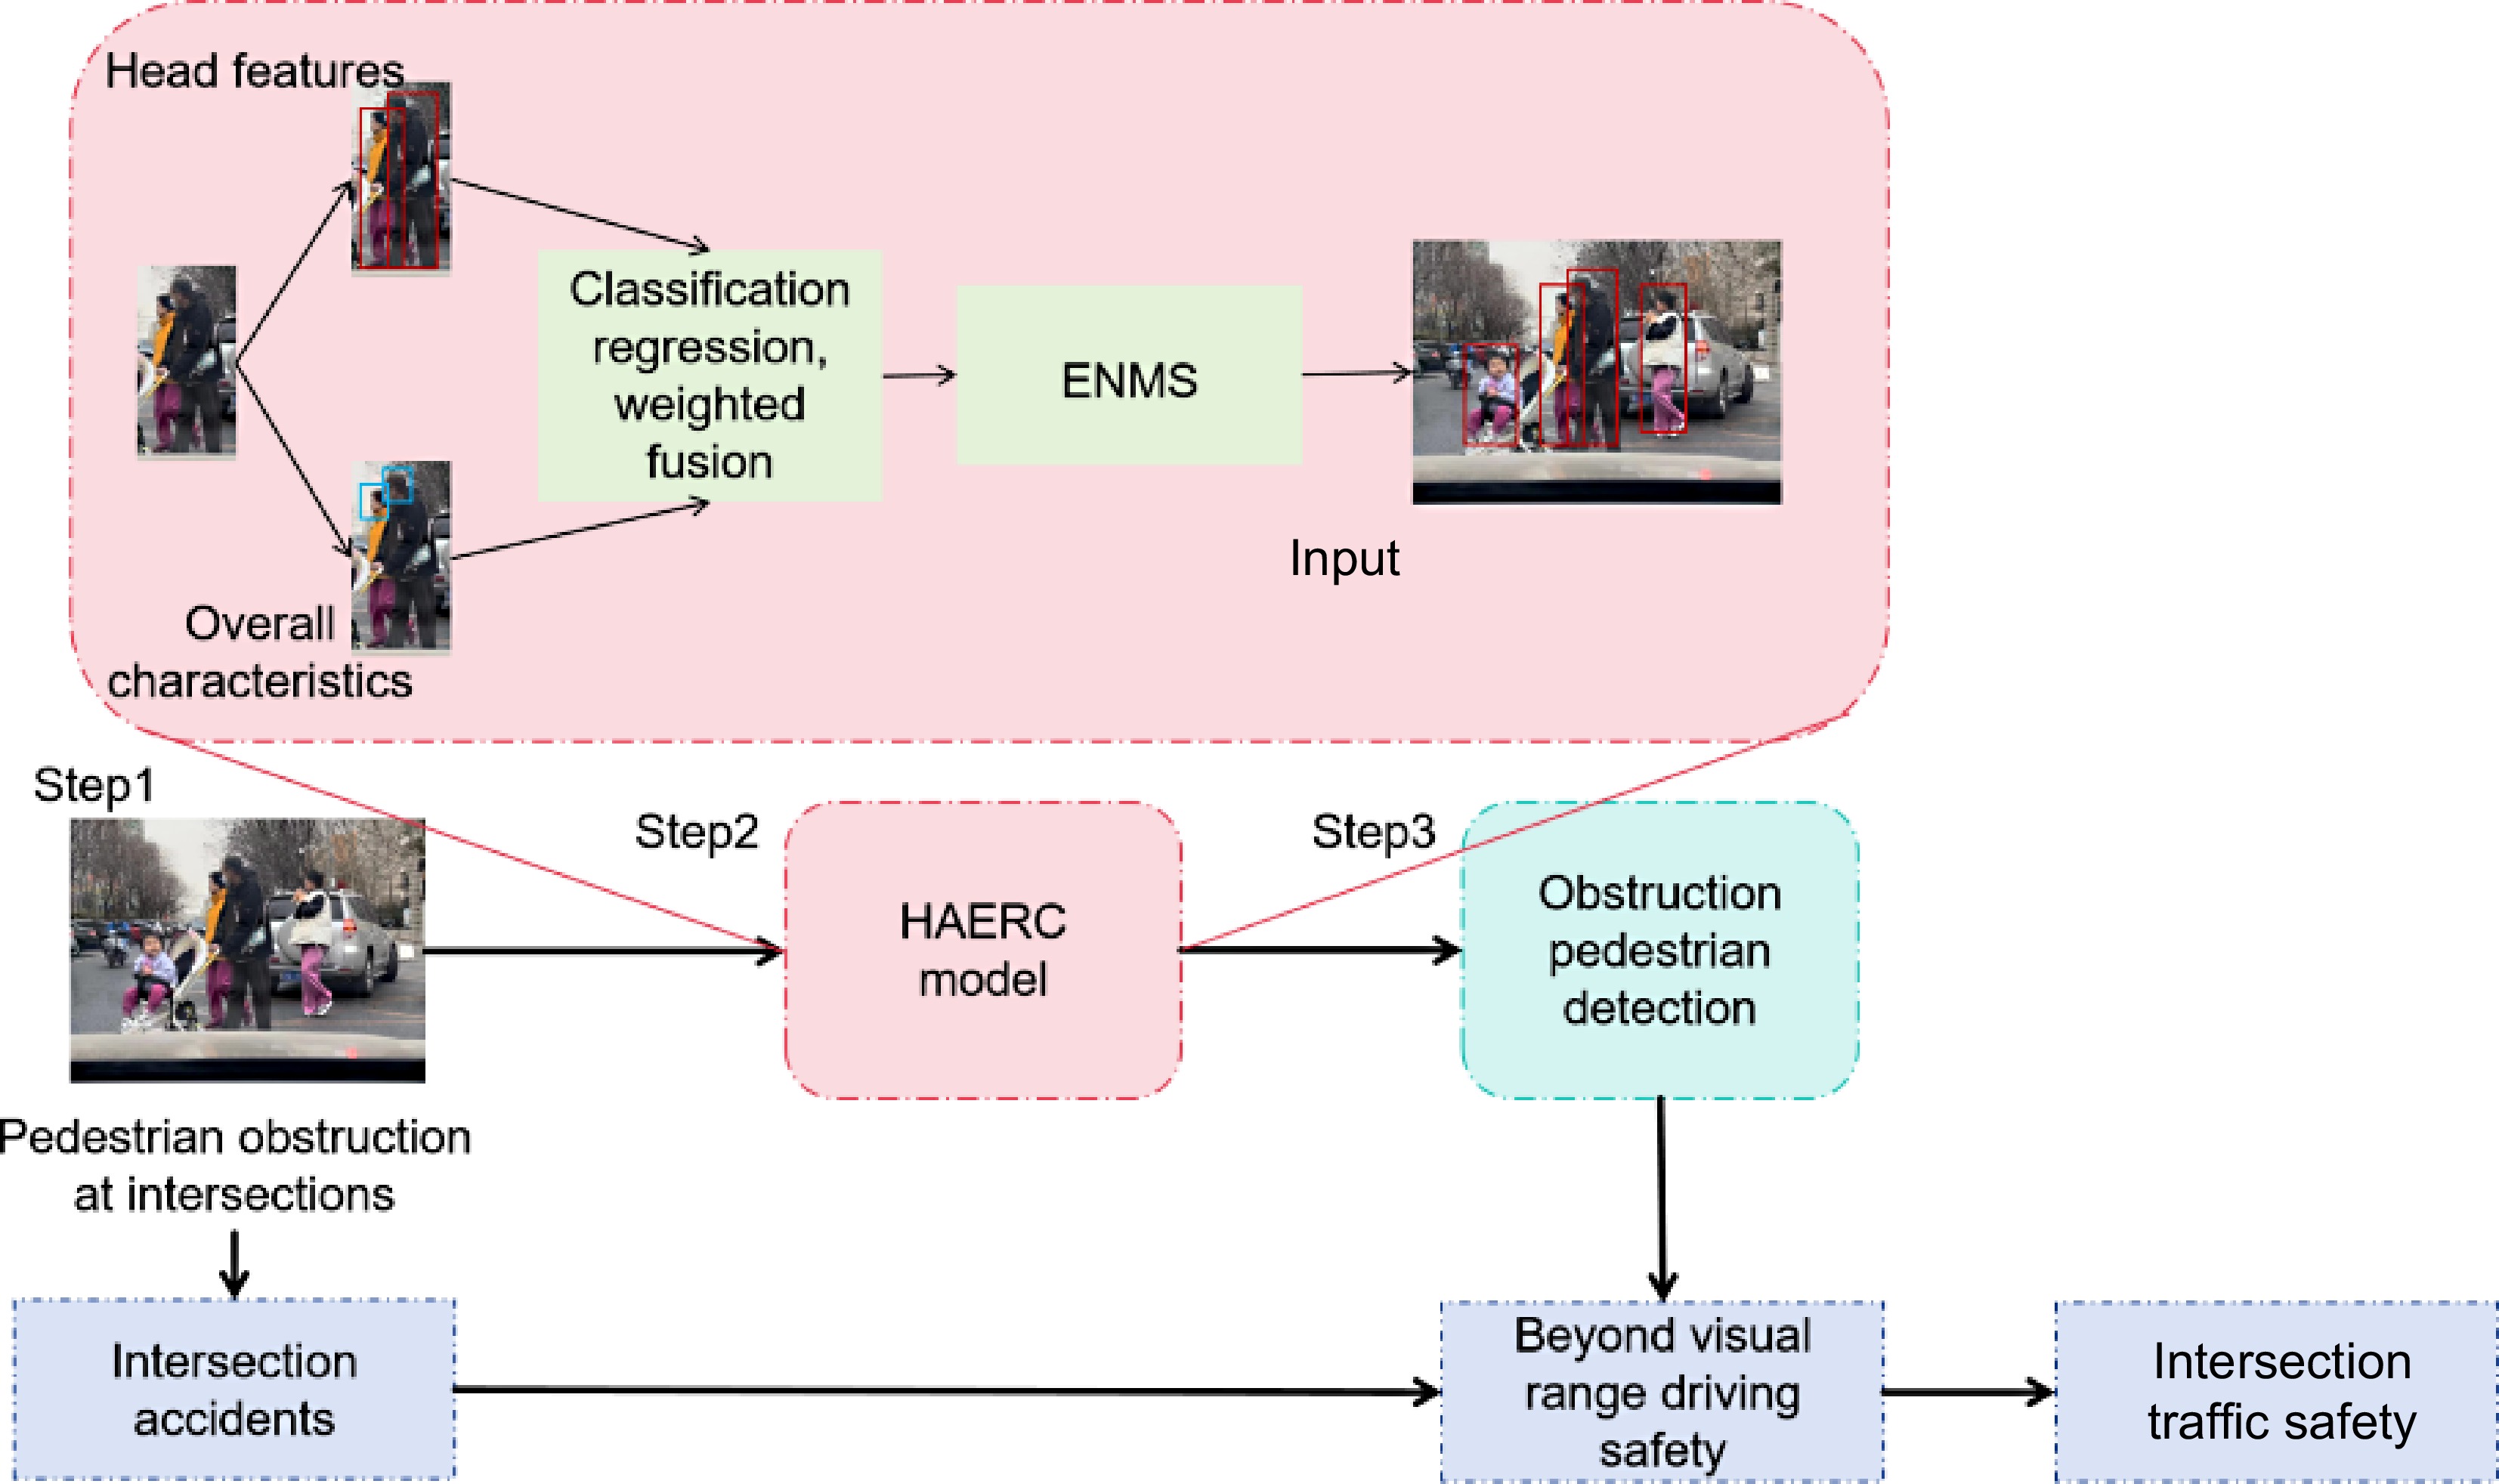
Figure 1.
Overall framework of the study.
-
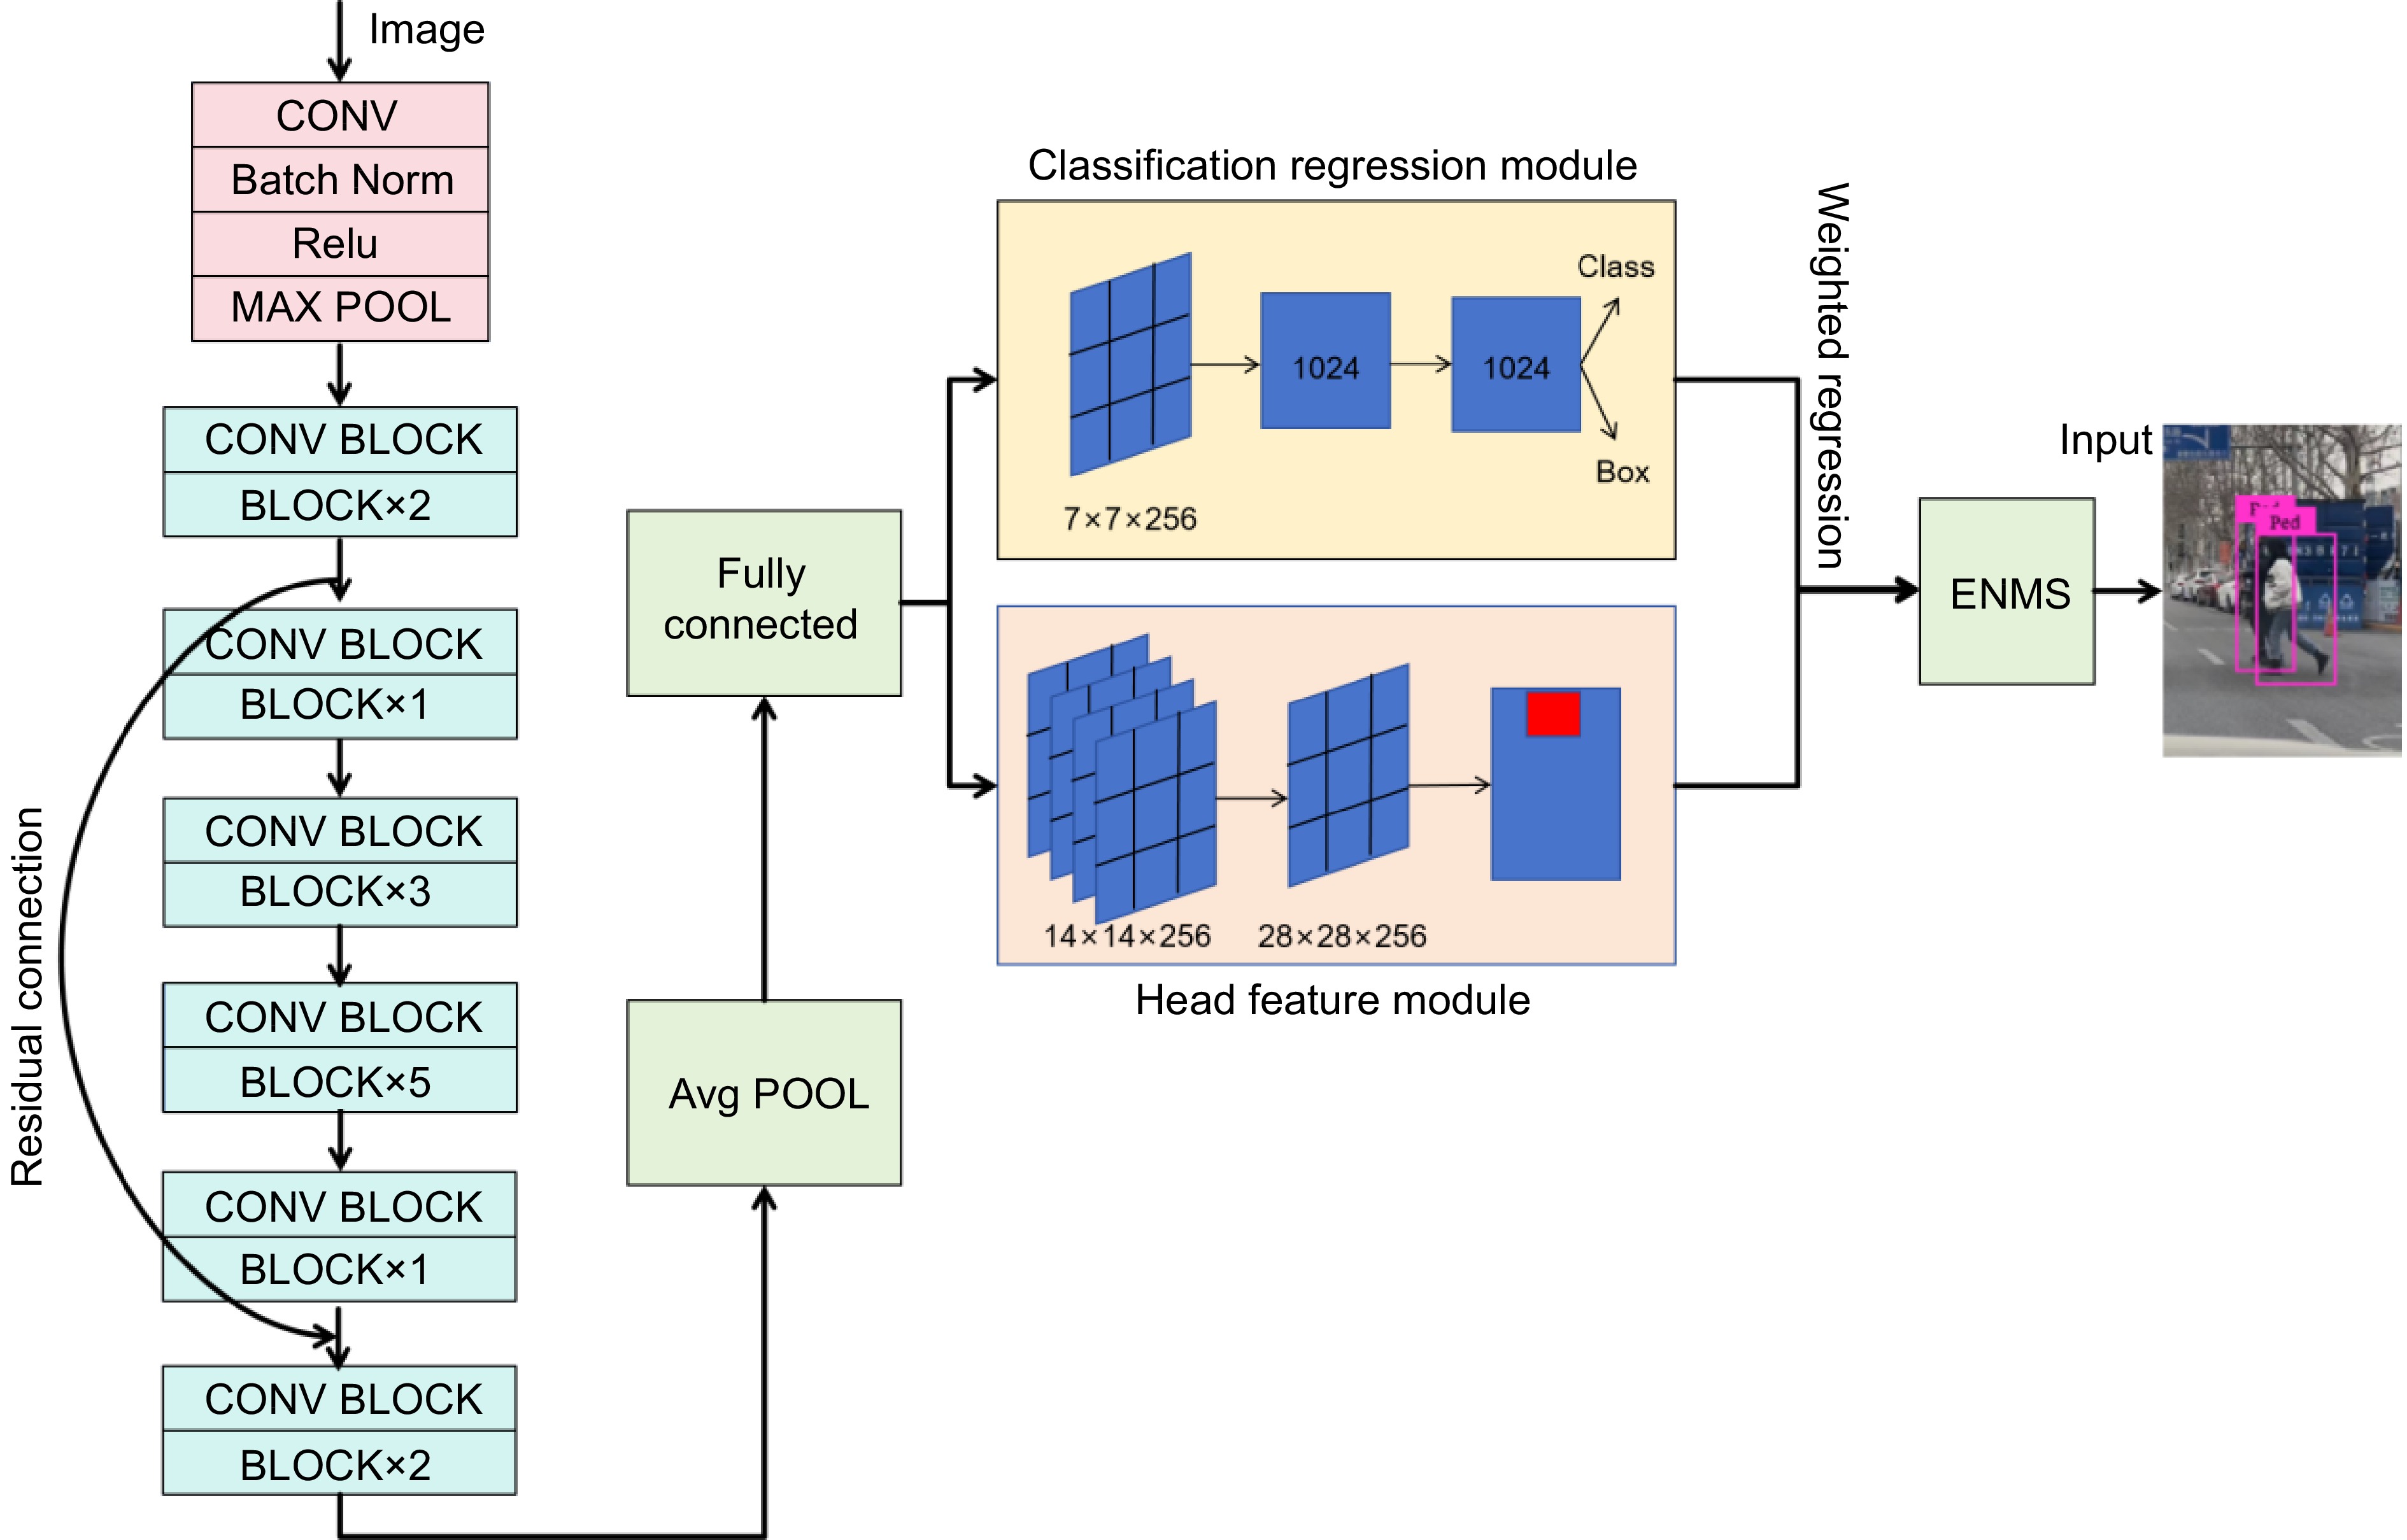
Figure 2.
HAERC model framework.
-
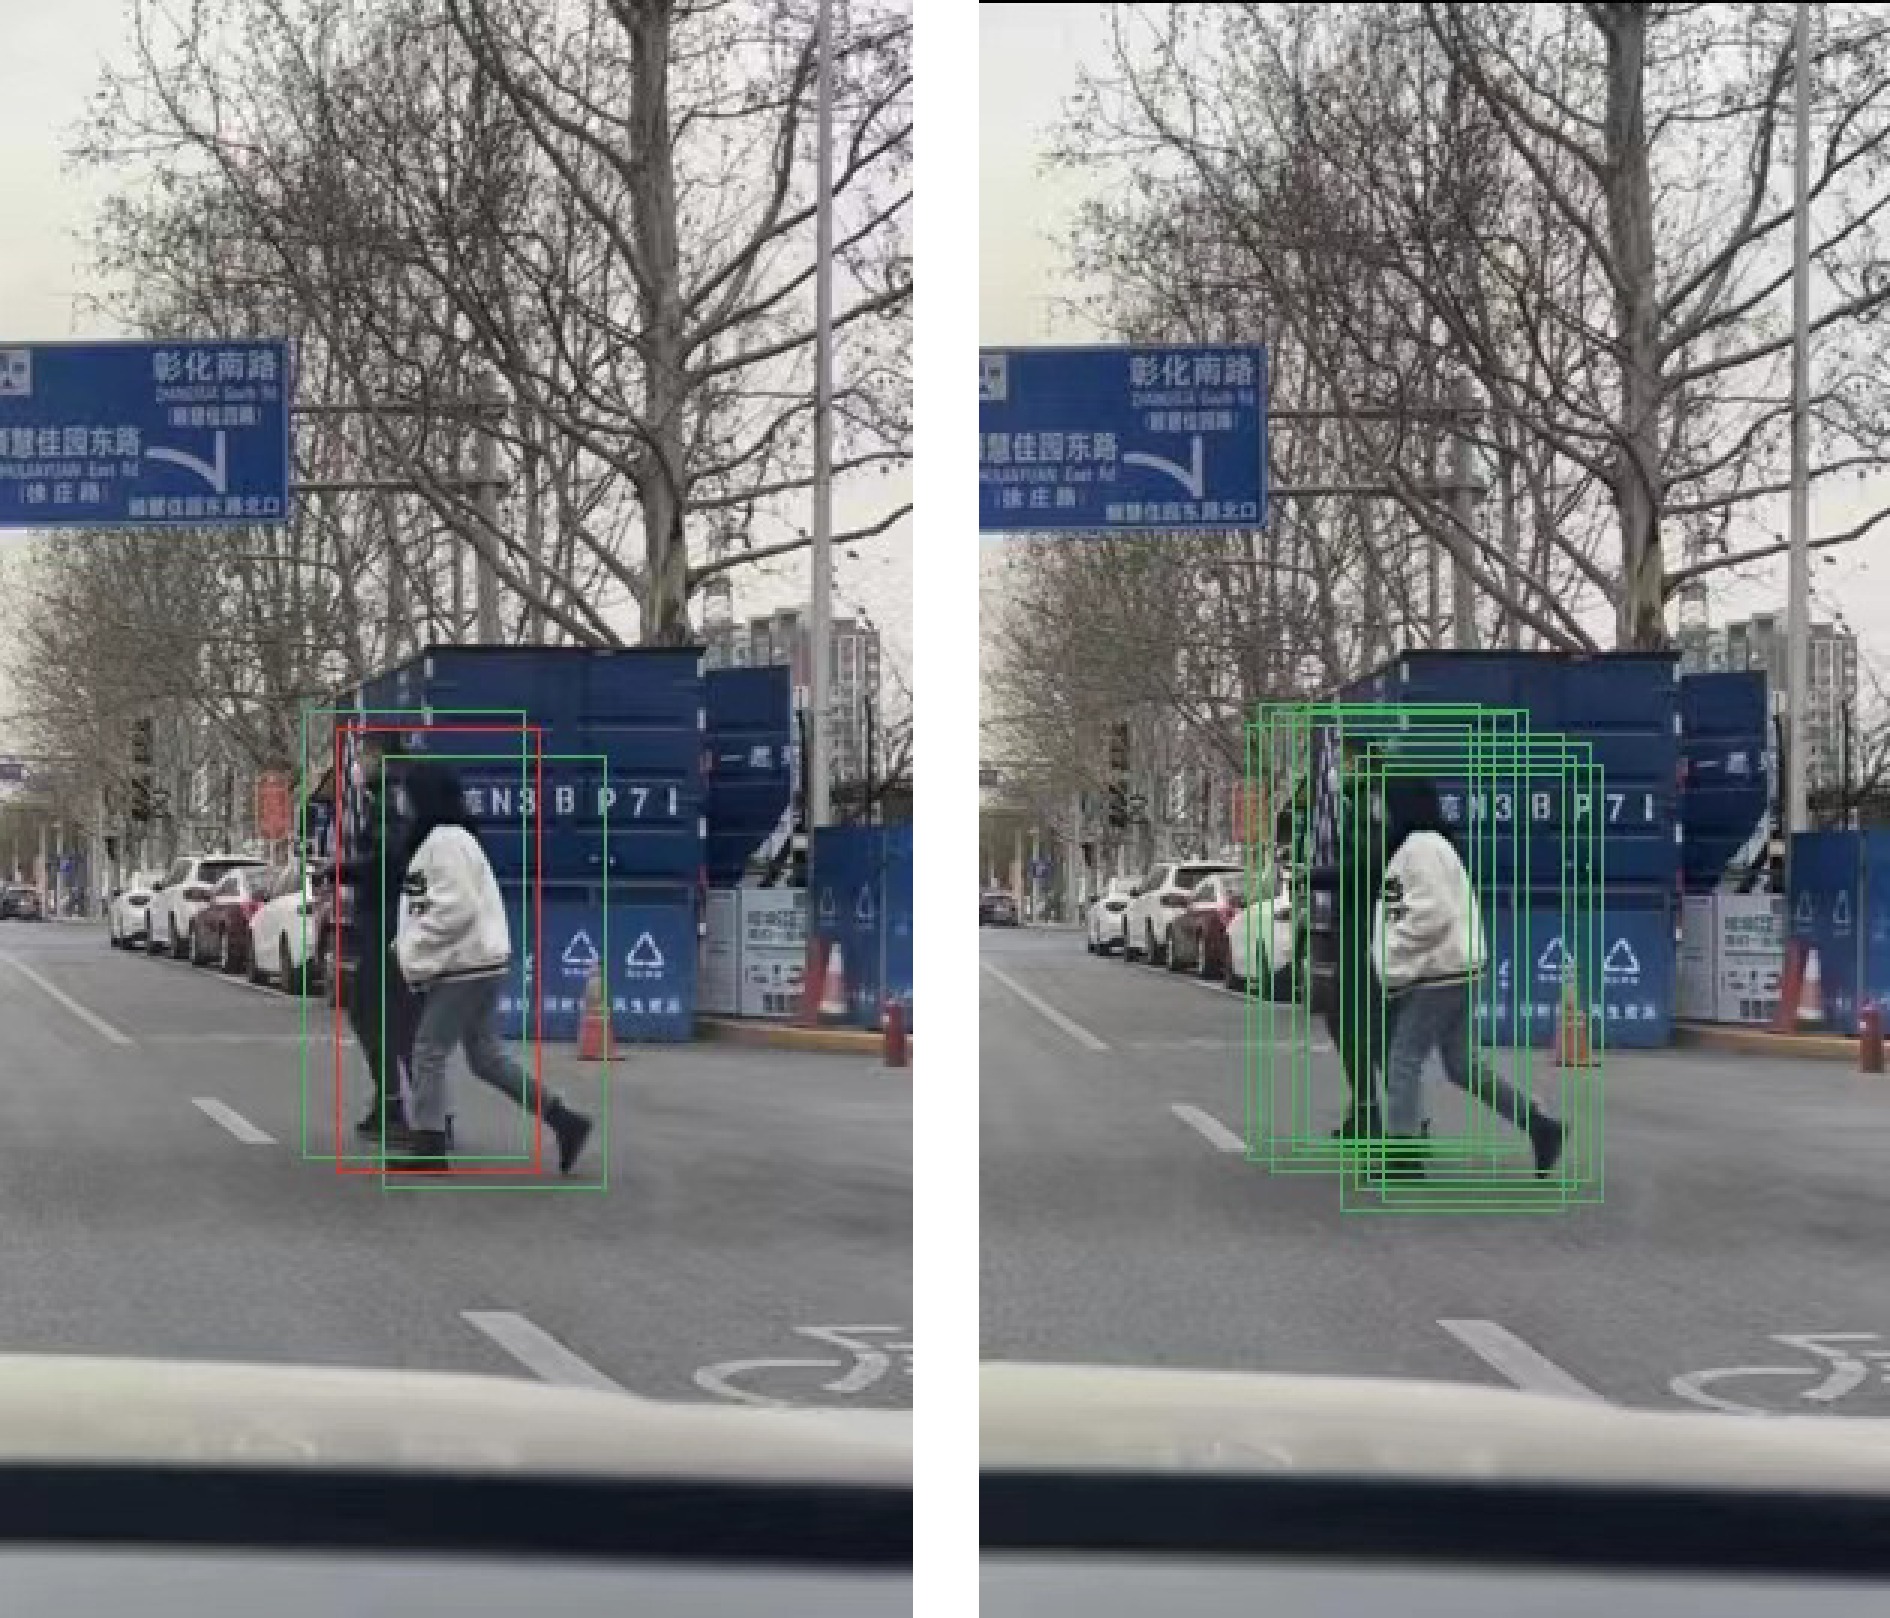
Figure 3.
Comparison of classification processes between NMS and ENMS.
-
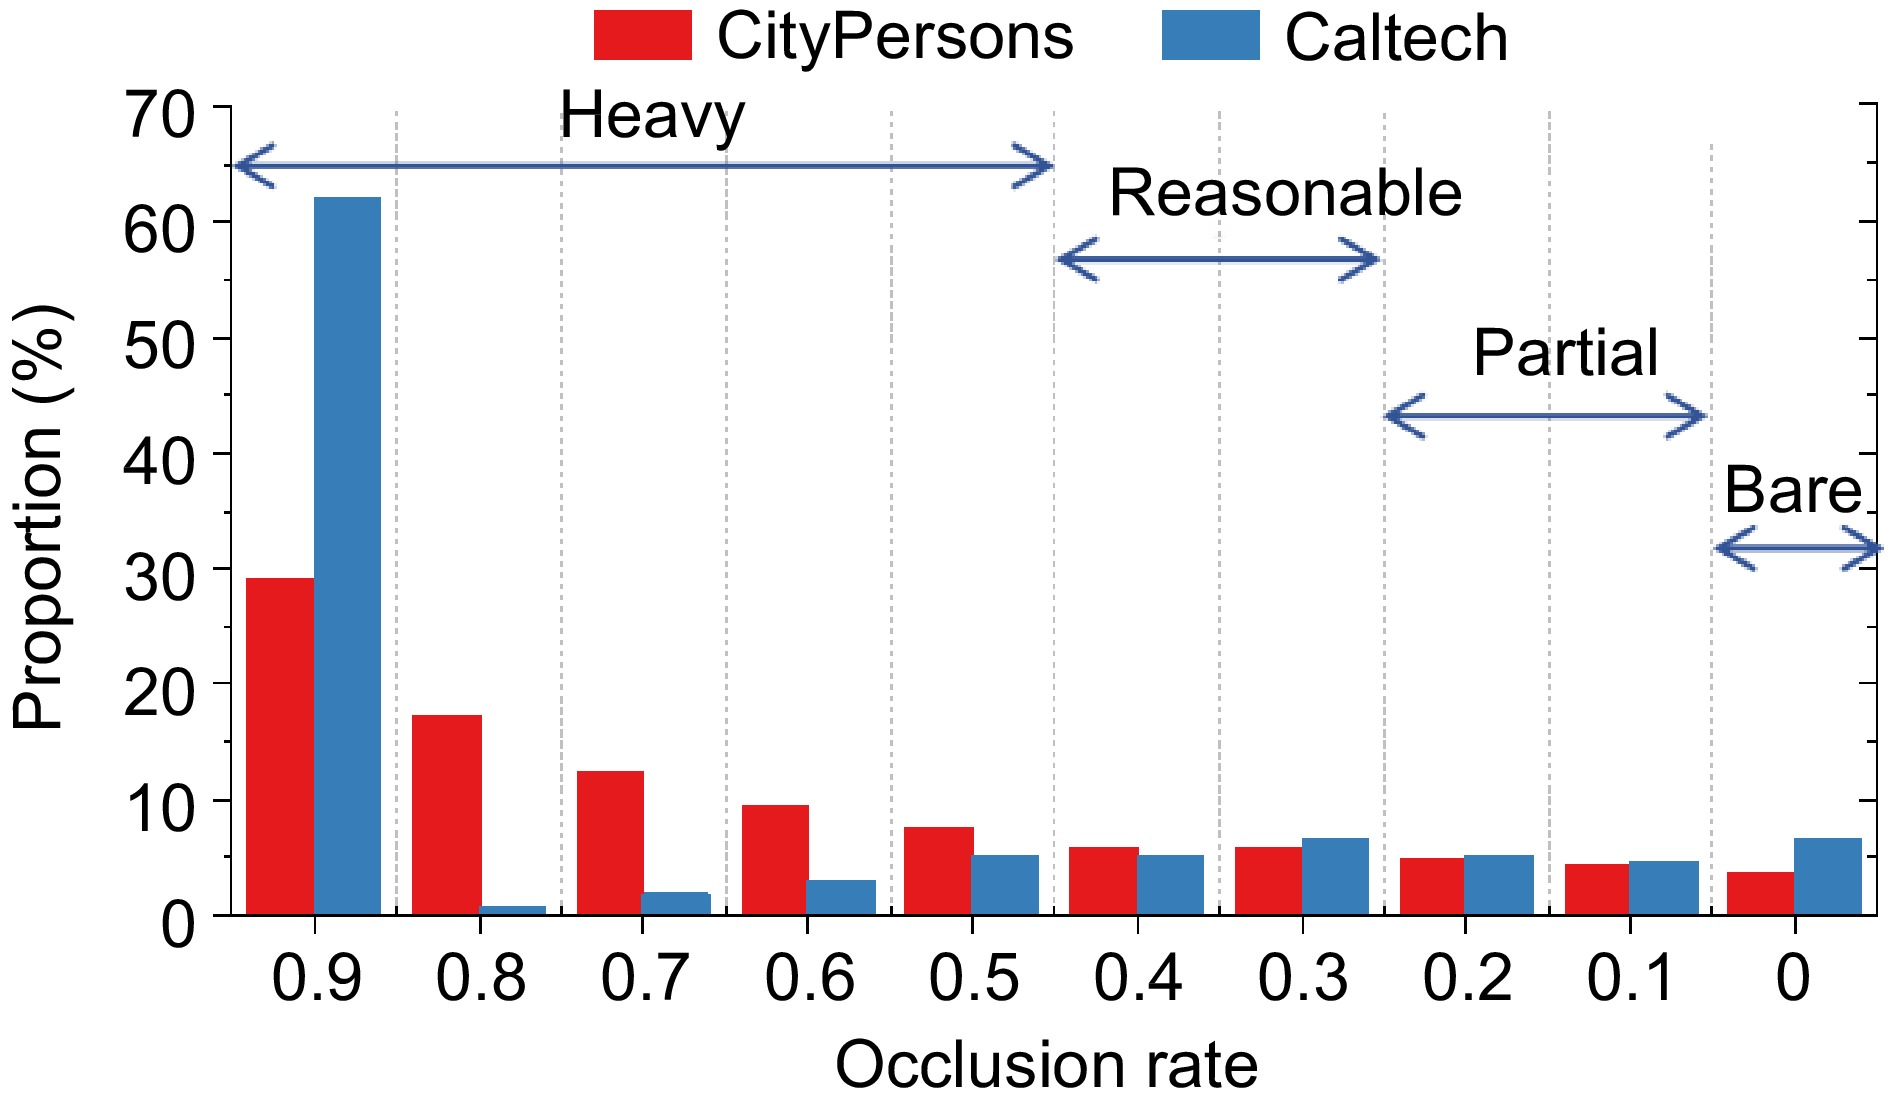
Figure 4.
Distribution of occlusion ratio in the pedestrian dataset.
-
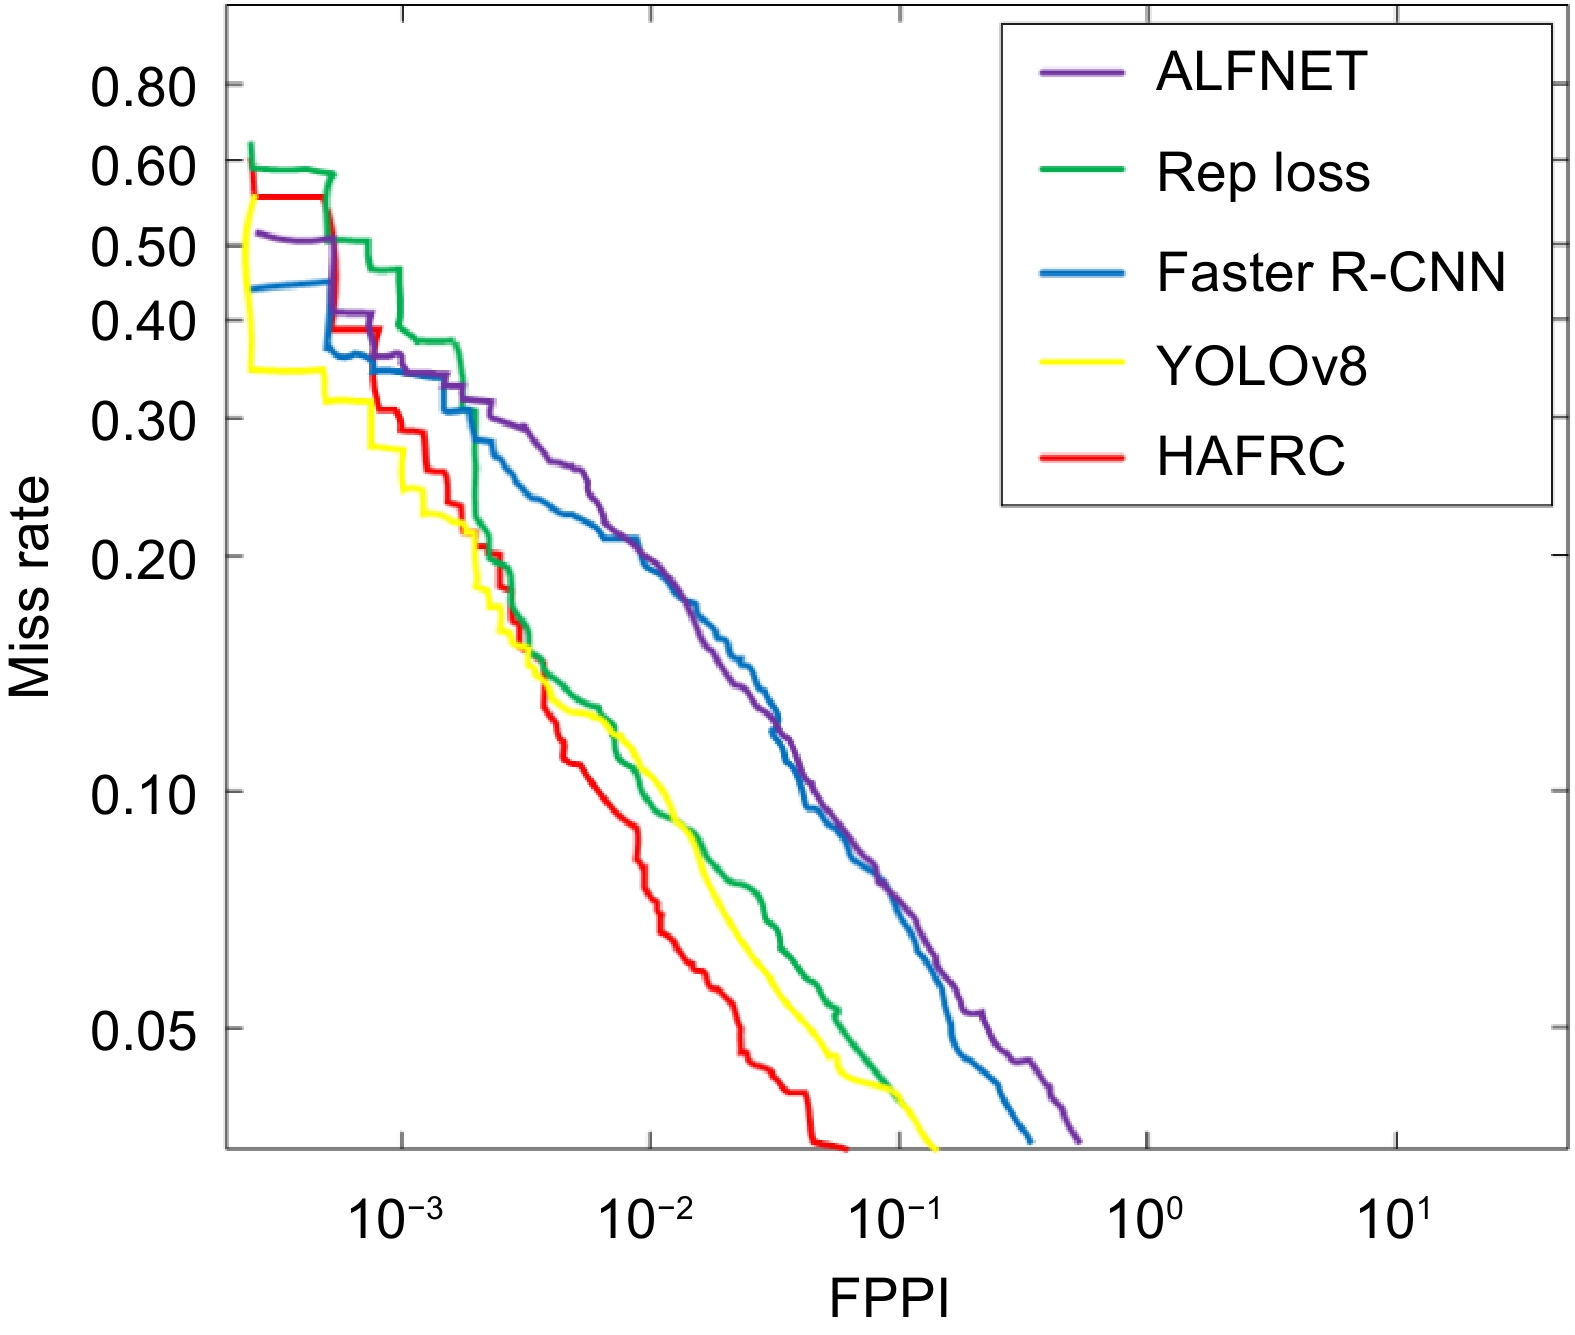
Figure 5.
FPPI Miss rate image.
-
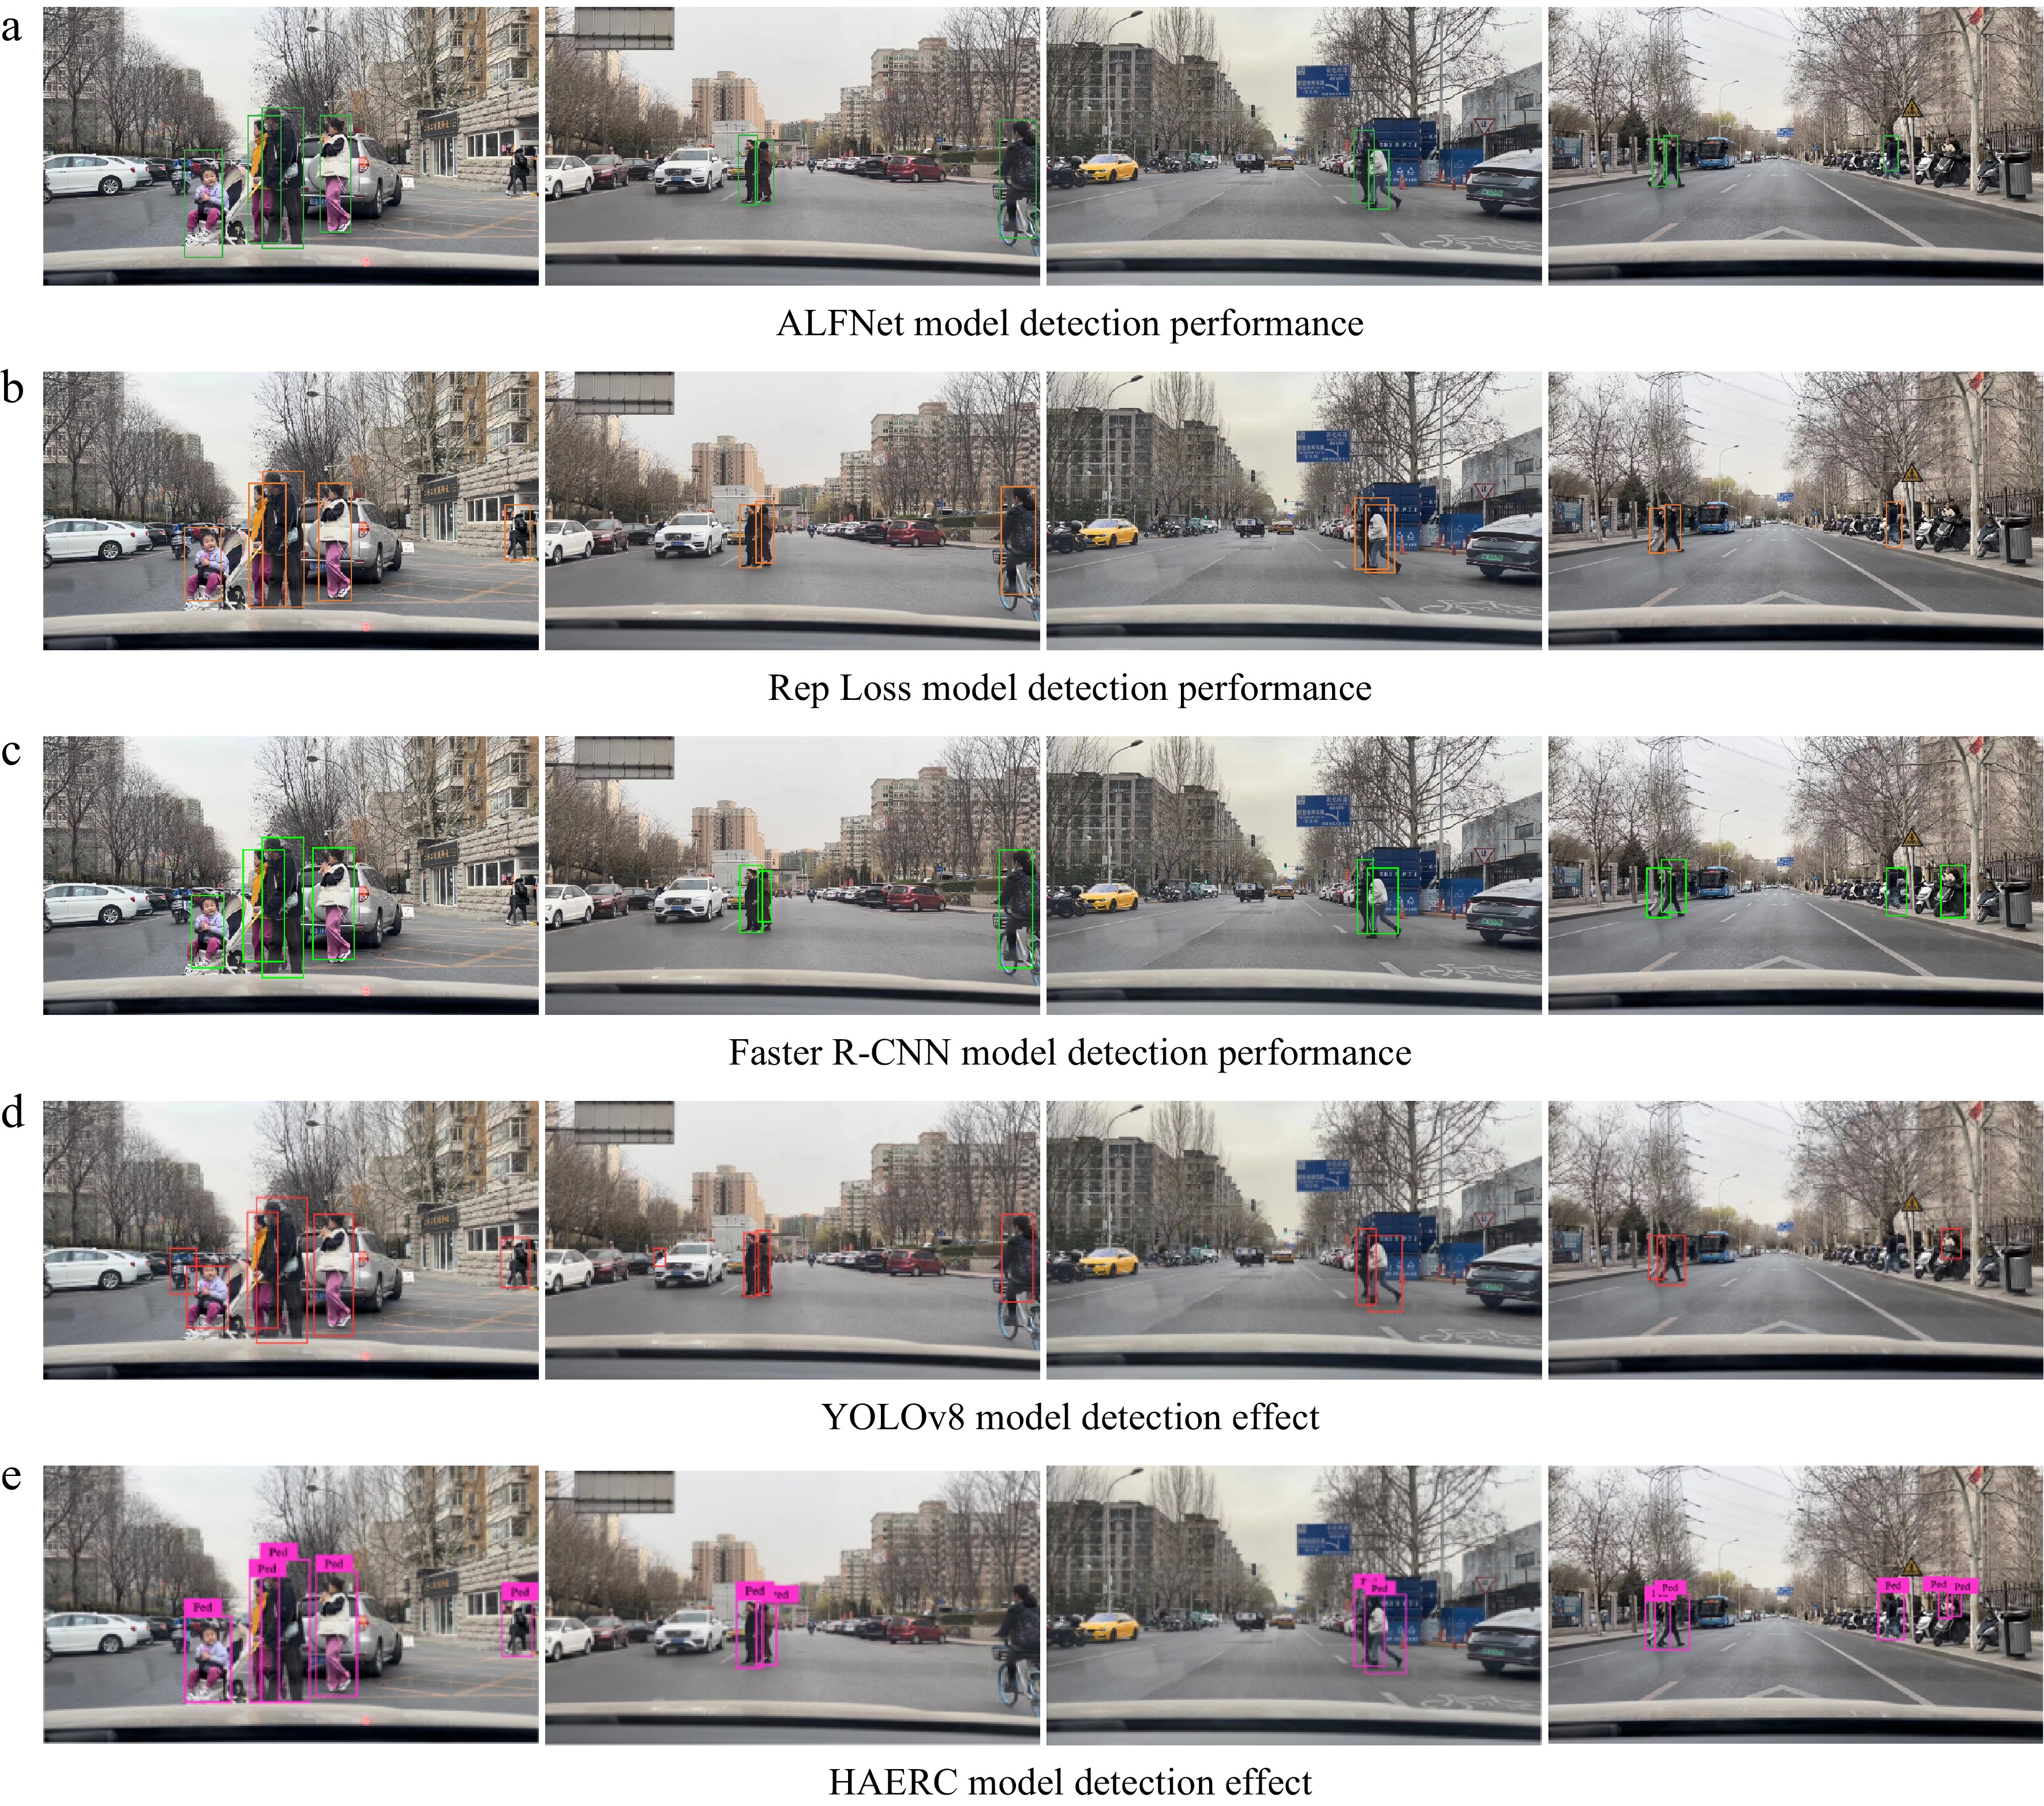
Figure 6.
Detection performance of different models.
-
Heavy Reasonable Accuracy Recall F1 score FPPI Accuracy Recall F1 score FPPI ALFNet 57.34% 63.70% 65.49% 51.90% 70.81% 64.12% 70.87% 12% Rep Loss 55.26% 62.31% 55.00% 64.12% 68.24% 62.04% 68.71% 13.20% Faster R-CNN 56.36% 54.00% 65.51% 55.67% 66.45% 62.35% 67.97% 14.37% YOLOv8 57.70% 63.53% 66.59% 44.24% 72.05% 61.12% 68.59% 12.07% HAERC 60.68% 63.70% 68.09% 46.64% 73.33% 62.40% 69.83% 9.59% Partial Bare Accuracy Recall F1 score FPPI Accuracy Recall F1 score FPPI ALFNet 74.39% 60.94% 69.73% 11.40% 74.82% 60.94% 69.86% 8.40% Rep Loss 69.99% 59.88% 67.34% 16.80% 75.51% 60.28% 69.56% 7.60% Faster R-CNN 70.74% 59.47% 67.30% 15.84% 74.92% 60.56% 69.39% 8.13% YOLOv8 75.10% 61.32% 70.25% 9.86% 76.54% 60.83% 70.31% 7.45% HAERC 75.91% 61.05% 70.30% 9.43% 77.16% 60.51% 70.24% 6.78% The bold part indicates that the optimality can be strengthened. Table 1.
Performance comparison with other occlusion models.
-
Model ENMS Head feature
moduleBackbone Heavy Reasonable HAERC1 √ ResNet-50 49.74 11.67 HAERC2 √ ResNet-50 47.3 10.74 HAERC √ √ ResNet-50 46.64 9.59 Table 2.
Results of ablation experiments.
Figures
(6)
Tables
(2)