-
Unsignalized intersections represent accident-prone areas within urban road networks, where the primary collision type involves conflicts between motor vehicles and pedestrians[1,2]. For drivers, limited visibility at unsignalized intersections results in their inability to anticipate pedestrians crossing within their line of sight triangle. Driver misjudgment of pedestrians is a leading cause of accidents at unsignalized intersections[3,4]. Detecting pedestrians at these intersections enables drivers to promptly perceive their complex situations, yield to them in a timely manner, enhance intersection safety and reduce accidents caused by driver misjudgment[5−7].
Computer vision methods offer effective means for detecting pedestrians crossing at unsignalized intersections. Early approaches such as YOLO models detect road conditions ahead from the driver's perspective, effectively recognizing pedestrians[8]. However, the complex environments of urban unsignalized intersections and pedestrians crossing in groups often lead to occlusions, rendering computer vision algorithms incapable of precise detection[9,10].
To address these challenges, Dalal & Triggs[11] proposed a method using Histogram of Oriented Gradients (HOG) combined with Support Vector Machine (SVM) and sliding window technique. This approach scans the entire image with fixed-size windows and performs binary classification for foreground and background in each window to detect occluded pedestrians. However, HOG features primarily capture edge and shape information of objects, lacking effective representation of appearance information, making it difficult to handle occlusion. Moreover, due to the nature of gradients, this feature is sensitive to noise. To tackle these issues, Dollár et al.[12] introduced Integral Channel Features (ICF), employing AdaBoost classifier with a soft cascade in a cascaded manner. Different classifiers of varying scales were trained to detect pedestrians of different sizes, and for pedestrians of other scales, predictions from these typical scale classifiers were interpolated to approximate the detection of occluded targets. However, these methods rely on feature expansion for detection. Conversely, Ruan & Zhang[13] and others shifted their focus by using Generative Adversarial Networks (GANs) to enhance images, thereby achieving clarity of targets. They then utilized object detection algorithms for occluded pedestrian detection. This detection method based on visual enhancement effectively mitigates the problem of occlusion-induced missed detections. However, when the occlusion rate exceeds 50%, information loss poses a challenge even for visual enhancement methods[14,15].
In response to this situation, Ouyang & Wang[16] proposed a method of overall target detection using body parts. They trained a convolutional neural network pedestrian classifier using the Caltech Pedestrian Database, categorizing different parts of pedestrians for classification to enhance the detection probability of occluded pedestrians. Building upon this, Li et al.[17] proposed an SA-FastRCNN model, which performs hierarchical detection of different features of pedestrians to achieve detection of overall occluded targets. Additionally, Tian et al.[18] devised a part-based detection scheme called DeepParts, dedicated to solving occlusion issues. This approach divides the human body into multiple parts for individual detection and then combines the results to detect occluded targets.
This method, based on the detection of human body parts, can accurately detect occluded targets. However, for the problem of detecting occluded pedestrians at signal-free intersections, a faster inference speed is required. The methods proposed by scholars for part-based detection often face challenges in achieving fast inference speeds due to their computational complexity. In tasks such as pedestrian detection at signal-free intersections, it is necessary to reduce the computational complexity based on part detection. Therefore, This paper proposes a target detection model called HAERC (Head feature And ENMS fusion Residual connection For CNN) to address the phenomenon of occluded pedestrians at signal-free intersections. The model focuses on the singular feature of pedestrian heads and utilizes a two-stage object detection approach. It merges the head feature with the overall pedestrian feature through regression fusion to detect occluded targets. Furthermore, to mitigate errors caused by overlap between candidate boxes and to address suboptimal selections due to excessively large Intersection over Union (IoU) values between candidate boxes, this paper introduces a scalable Enhanced Non-Maximum Suppression (ENMS) algorithm. By adjusting the IoU threshold, ENMS optimizes the selection of candidate boxes, thereby enhancing the model's detection accuracy, facilitating the detection of occluded pedestrians at signal-free intersections, and improving long-range driving safety.
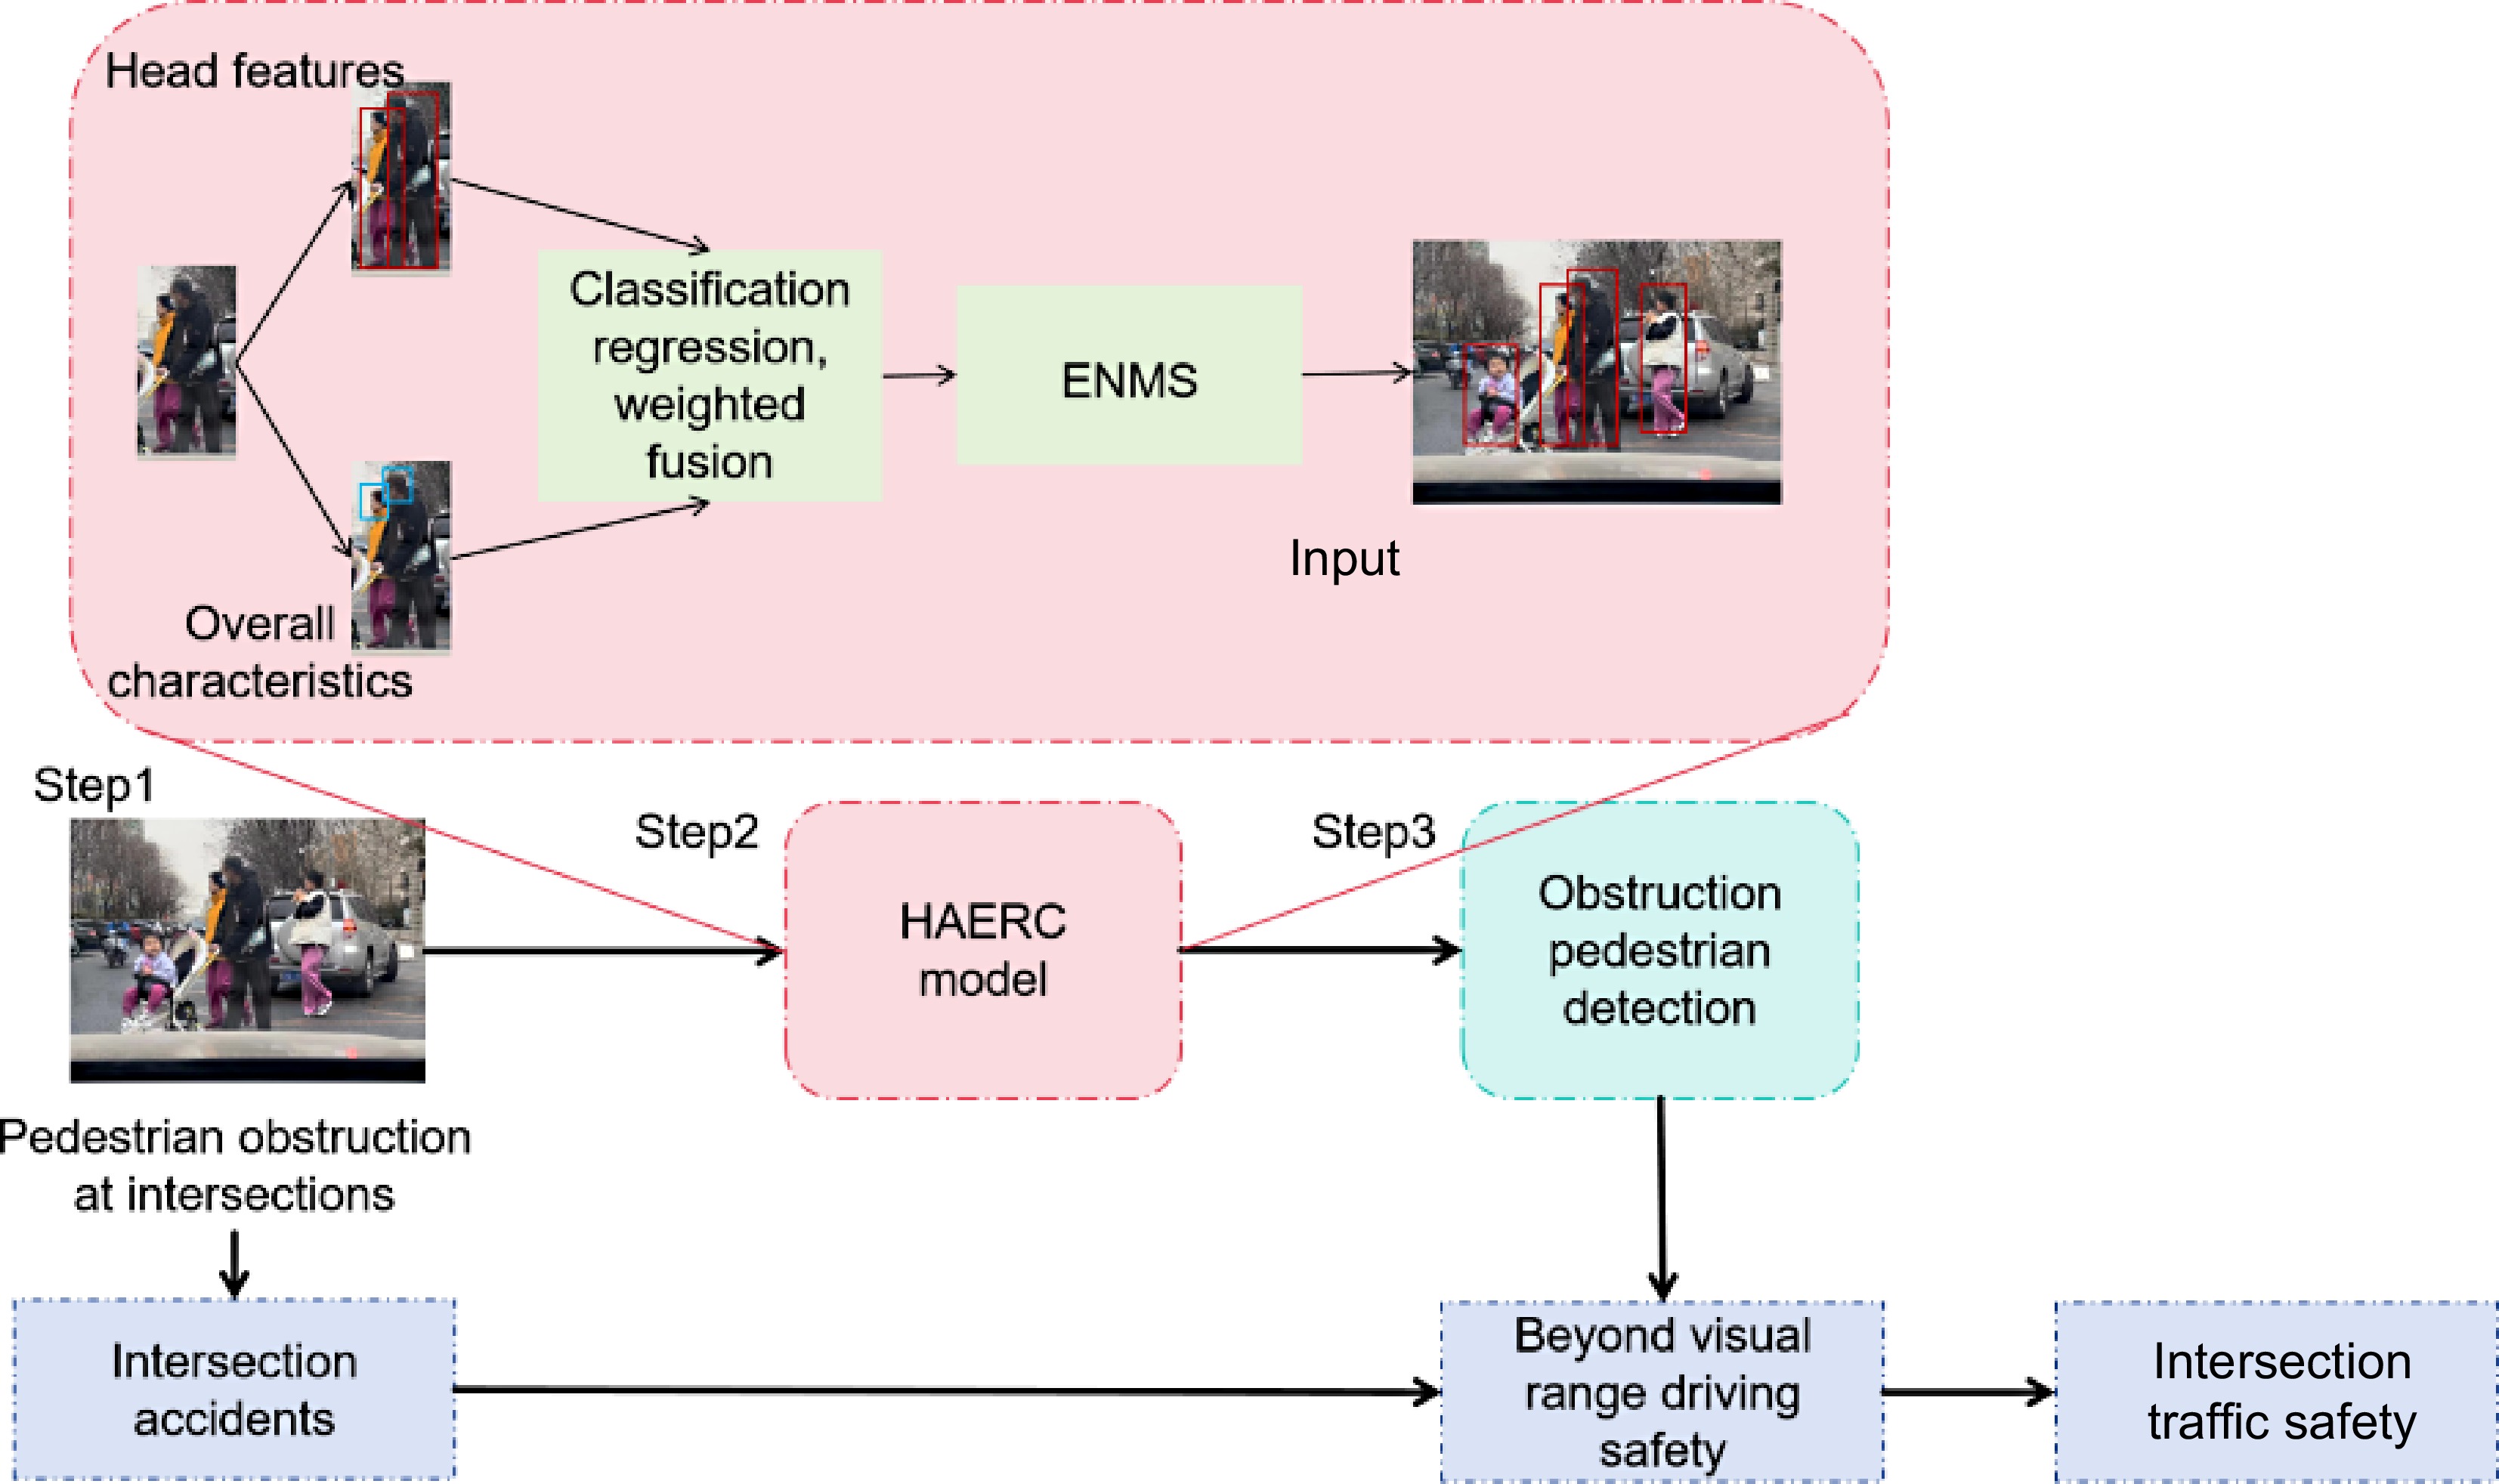
The technical roadmap studied in this article is shown in Fig. 1, and the main contributions of this article are as follows:
(1) To mitigate accidents between motor vehicles and pedestrians caused by visibility issues at urban unsignalized intersections, this paper addresses the complex occlusion scenarios of pedestrians at such intersections and proposes an occluded pedestrian recognition model, HAERC, demonstrating its superiority through empirical validation.
(2) To achieve detection of occluded targets while avoiding the slowdown in model inference speed caused by complex computations, a novel object detection method is proposed in this paper. This method considers pedestrian head features and integrates them with overall target features to achieve precise identification of occluded targets, thus overcoming the challenges posed by occlusion without compromising computational efficiency.
(3) Considering the selection errors caused by overlap between candidate boxes in two-stage object detection algorithms, as well as suboptimal choices resulting from excessively high Intersection over Union (IoU) thresholds, this paper proposes an Extended Non-Maximum Suppression Classifier (ENMS). This approach readjusts IoU thresholds to optimize candidate box selection and improve the performance of object detection algorithms.
-
For the detection of occluded targets, scholars have extensively utilized the detection of key body parts. In the research by Pavlakos et al.[19], they partitioned the human body into different trunk segments and detected key points, enabling inference of pedestrian positions considering occlusions and unobstructed areas. Similarly, Li et al.[20] employed this method by incorporating an attention mechanism during the division of human body trunk segments, enhancing the weighting of exposed trunk parts. This approach significantly improved the accuracy of occluded target detection and strengthened recognition of occluded targets. Similar methods have been utilized in the studies by Pishchulin et al.[21] and Bulat & Tzimiropoulos[22]. However, as mentioned in the study by xx, while the method of inferring partial trunk and overall target can significantly enhance the accuracy of occluded target detection, it increases the complexity of the model and computational load, resulting in prolonged inference speed[23]. In pedestrian detection at intersections, real-time detection is required. Therefore, this paper, based on scholars' consideration of partial trunk, selects the head as the target. On the one hand, it reduces the number of trunks to improve the model's inference speed, while on the other hand, it maintains a high level of accuracy.
Evolution of NMS improvement
-
NMS, or Non-Maximum Suppression classifier, is an algorithm used in computer vision models for optimizing the selection of candidate boxes. In object detection algorithms generating multiple candidate boxes for detection targets, NMS typically selects the candidate box with the highest score. However, during the scoring process for different detection boxes, NMSs selection of the optimal box may not always yield optimal results due to occlusion recognition factors[24]. This process is limited by the threshold of Intersection over Union (IoU). Therefore, in the study by Tang et al.[25], a weighted NMS for different class detection boxes was proposed, using the classification regression results of multiple targets to filter IoU thresholds. This method effectively improved NMS's ability to achieve optimal candidate boxes for occluded targets. However, this weighted NMS method, suitable for regression selection of optimal candidate boxes for pedestrian trunks and overall bodies also increase the computational complexity of the model, resulting in reduced inference speed[26].
To address this, Gidaris & Komodakis[27] proposed a novel approach where multiple candidate boxes are generated by the object model. Utilizing a candidate box sliding mechanism near the image, composite candidate boxes generate scores during the sliding process. This approach's advantage lies in its ability to utilize the candidate box sliding mechanism to select high-precision candidate boxes while effectively reducing the computational complexity required for scoring each candidate box individually, thus improving detection efficiency.
Therefore, in this paper, while employing this candidate box selection method, we propose an extended IoU threshold selection mechanism to address the limitations of self-scoring IoU. On one hand, the sliding of candidate boxes is utilized to reduce computational efficiency, and on the other hand, the model's computational accuracy is improved through the use of extended IoU thresholds.
-
In pedestrian detection research, typically, a pedestrian is considered occluded if the occluded area exceeds 10%. If occlusion is caused by other pedestrians of the same category, i.e., intra-class occlusion or crowd occlusion, the occlusion degree of the pedestrian is more significant. To measure the degree of occlusion, the Intersection over Union (IoU) metric is commonly used to quantify the occlusion between two objects. This is done by calculating the ratio of the intersection area to the union area of two objects to assess their overlapping degree and evaluate their occlusion status. IoU is a widely used metric for computing the overlap between targets; if the IoU between two pedestrians is less than a specific threshold, they are considered to be mutually occluded. When dealing with intra-class occlusion, multiple detection boxes are used to detect the same target, and these detection boxes are merged to restore the complete pedestrian bounding box.
During pedestrian traversal through unsignalized intersections, two primary categories of occlusion exist: occlusion between individuals and occlusion between objects and individuals. Pedestrian occlusion can be regarded as a specialized form of occlusion, but its level of difficulty in handling surpasses that of typical occlusion scenarios. This is primarily due to several reasons:
When pedestrians are partially occluded, the occluded parts they receive may cause deformation or distortion[28]. When pedestrians are occluded by other objects, information in the occluded area is lost, leading the detector to inaccurately detect the position and pose of pedestrians[29]. When pedestrians are occluded by multiple objects, the occluded area becomes more complex, potentially containing the contours and edges of multiple objects, making it difficult for the detector to extract features. When pedestrians are occluded, the degree of occlusion may vary, such as different areas of occlusion for each hand. In such cases, the detector needs to identify varying degrees of occlusion.
Regarding the pedestrian detection problem in the context of this study, there are two main issues: Firstly, there is information loss caused by pedestrian occlusion, resulting in undetected regions in detection boxes. Secondly, there may be difficulty in identifying candidate boxes when the true boundary boxes of the target pedestrian are close to those of other pedestrians, leading to detection offsets. Therefore, in the task of pedestrian detection under occlusion conditions, it is necessary both to avoid information loss caused by occlusion and to discern ambiguous candidate boxes to determine the optimal detection results.
-
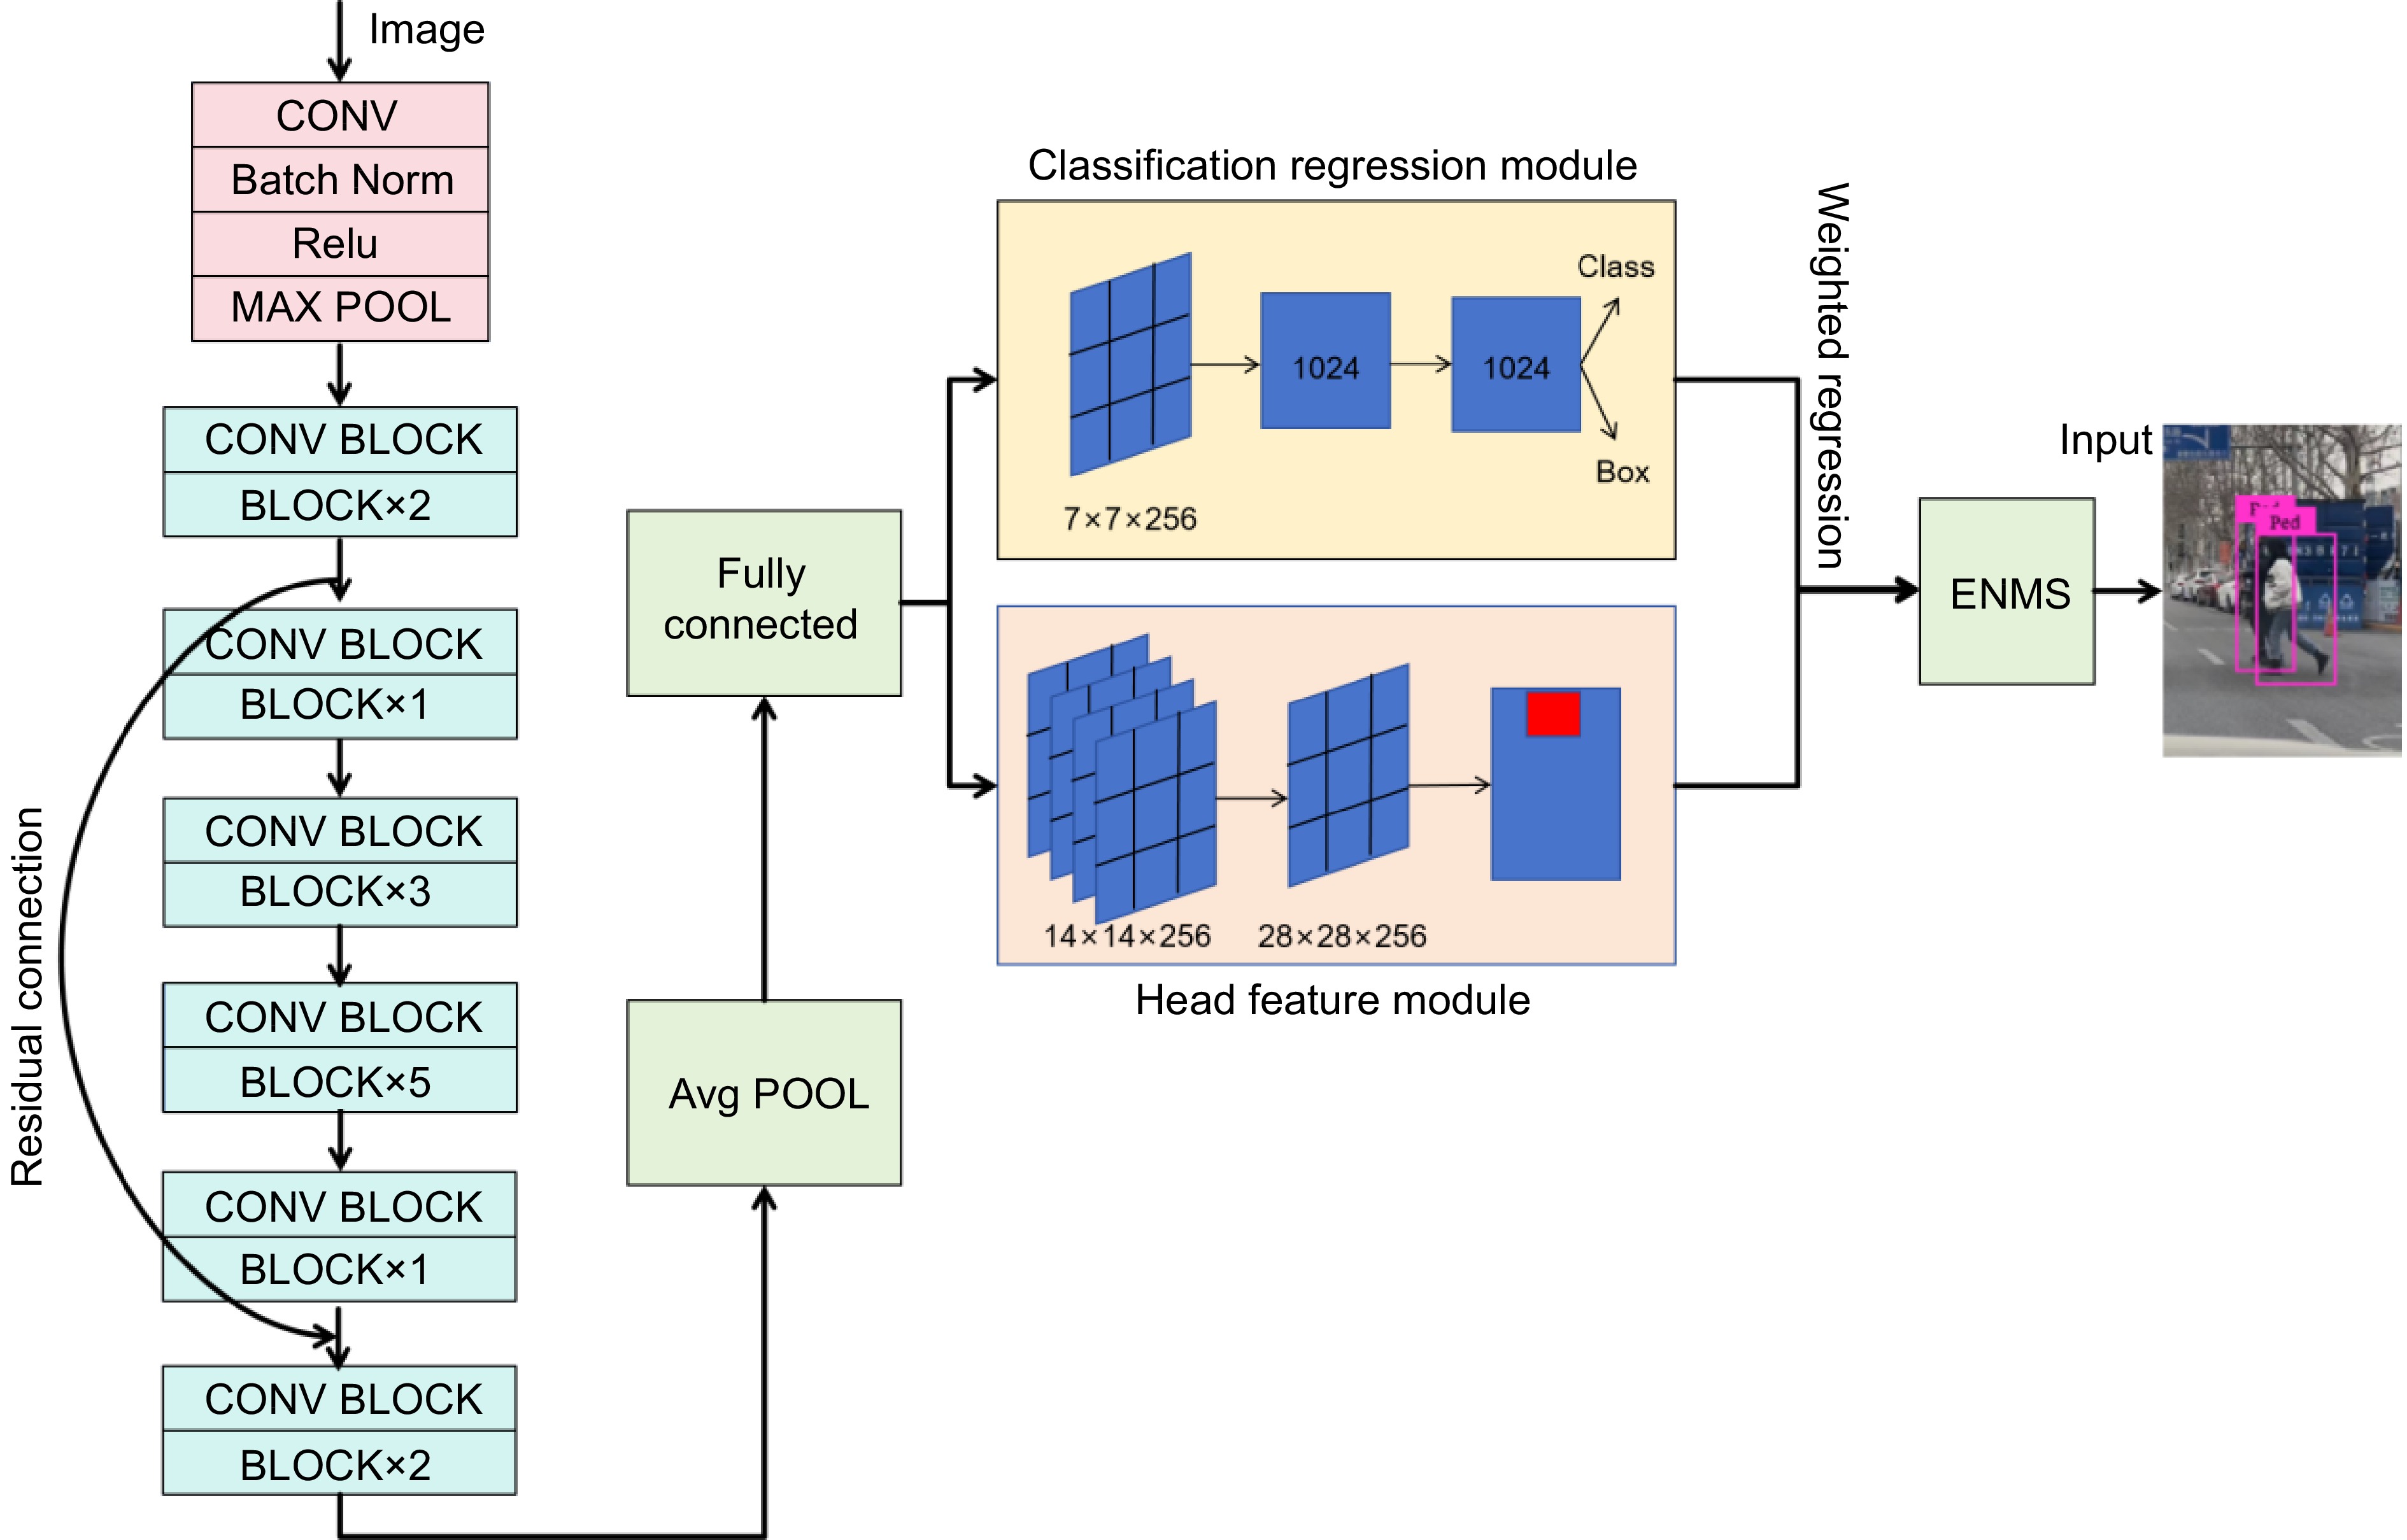
In response to the challenges identified in the previous section regarding occluded pedestrian recognition, this study presents a two-stage object detection model named HAERC (Head feature And ENMS fusion Residual connection For CNN), which integrates pedestrian head features with an Extended Non-Maximum Suppression (ENMS) algorithm. Specifically, to comprehensively capture information about occluded targets, the study considers the pedestrian's head as a secondary feature for recognition. By weighting the detection box of the pedestrian's head and the overall target detection box, occluded targets can be detected effectively. Additionally, to address issues arising from overlapping candidate boxes, an Extended Non-Maximum Suppression Classifier (ENMS) is proposed, which extends the IoU threshold for optimal selection of candidate boxes, as depicted in Fig. 2.
HAERC backbone network
-
In the backbone network section of the model, traditional two-stage object detection algorithms are utilized as the core framework of the HAERC model. Additionally, to reduce computational complexity, the residual connection method inspired by ResNet[30] is adopted within the backbone network of HAERC.
For the two-stage object detection method, the key component is the Region Proposal Network (RPN), which generates candidate object boxes. This is achieved through a fully convolutional network that slides over the input image to generate multiple candidate object boxes at different positions. The input to the RPN network is the feature map extracted from the input image and the output consists of scores and coordinate offsets for each candidate box. The design of the RPN network primarily involves the concept of anchor boxes, which are a set of pre-defined bounding boxes containing a center point and various aspect ratios. The RPN network slides these anchor boxes over the feature map, performing classification and regression for each anchor box to obtain a set of candidate object boxes.
Compared to existing object detection algorithms, the RPN algorithm can effectively generate fewer and higher-quality candidate regions. The RPN network scans the final feature map using 3 × 3 convolutions to generate nine anchor boxes. These anchor boxes, representing various sizes and shapes, are utilized to detect and classify objects at different scales, thereby enhancing detection accuracy. Multiple anchor boxes of different sizes and aspect ratios are generated at each position of the feature map, with each position serving as the anchor point. For each anchor box, a candidate box is generated on the original image based on its position and dimensions.
Regarding residual connections, multiple residual blocks are typically employed in the backbone network for connectivity. In the residual structure, two 1 × 1 convolutional layers are introduced to simplify the complexity of the 3 × 3 convolutional layers.
For all ground truth (GT) objects, each prior box is traversed to find the maximum IoU (Intersection over Union) prior box, which is labeled as a positive sample. Then, for all prior boxes, each ground truth object is traversed, and if the IoU between the prior box and any ground truth object is greater than 0.7, the prior box is labeled as a positive sample. If the IoU between the prior box and all ground truth objects is less than 0.3, the prior box is labeled as a negative sample. In terms of the loss function, which includes both RPN and detection components, it comprises two main components: classification loss and bounding box regression loss, with each component encompassing the aforementioned two types of losses. The computation is as follows:
$ L\left(\left\{{p}_{i}\right\},\left\{{t}_{i}\right\}\right)=\dfrac{1}{{N}_{cls}}\sum _{i}{L}_{cls}\left({p}_{i},{p}_{i}^{\ast }\right)+\lambda \dfrac{1}{{N}_{reg}}\sum _{i}{p}_{i}^{\ast }{L}_{reg}\left({t}_{i},{t}_{i}^{\ast }\right) $ (1) The classification loss for each prior box, denoted as i is computed using cross-entropy. Here, pi represents the predicted probability value p* = { 0,1} of class p for the prior box i. If the prior box is a positive sample, the value is 1; if it is a negative sample, the value is 0. The computation is as follows:
The regression loss, denoted as
$ \lambda $ $ p_i^ * $ $ {t_x} = \left( {x - {x_a}} \right)/{w_a}\quad {t_y} = \left( {y - {y_a}} \right)/{h_a} $ (2) $ {t_w} = \log \left( {w/{w_a}} \right)\quad {t_h} = \log \left( {h/{h_a}} \right) $ (3) According to Eqns (2) and (3), the coordinates of the predicted boxes can be computed. In these coordinates, ha represents the coordinates of the samples, xa,ya,wa,ha denotes the coordinates of the anchors, and x*,y*,w*,h* signifies the coordinates of the ground truth (GT).
Pedestrian head feature module
-
In densely crowded environments, detecting pedestrians efficiently using CNNs can be challenging due to the extensive occlusion between pedestrians. CNNs, after multiple convolutional layers, may easily lead to target confusion. Therefore, utilizing more discriminative features for pedestrian detection is crucial. As the head is typically unobstructed and located at the highest point of a person's body, it tends to exhibit higher stability compared to other body parts[31,32]. Leveraging this information, the head region of pedestrians can be employed as additional cues to assist neural networks in learning distinctive features for occluded pedestrians. Introducing a head feature module alongside classification and regression modules, working in parallel, aid in predicting head masks. The model architecture, as depicted in Fig. 2, comprises four layers of 3 × 3 convolutional layers with a size of 14 × 14 × 256, followed by deconvolutional layers of size 28 × 28 × 256, a 1 × 1 convolutional layer, and a pixel-wise sigmoid function for predicting binary head masks.
Building upon this premise, a head feature module is introduced to work in parallel with the classification and regression modules to predict head masks. The model architecture, as depicted in Fig. 2, includes four layers of 3 × 3 convolutional layers with dimensions 14 × 14 × 256, followed by deconvolutional layers with dimensions 28 × 28 × 256, a 1 × 1 convolutional layer, and a pixel-wise sigmoid function. These components collectively predict binary head masks for each pedestrian.
This approach proves effective in recognizing pedestrians in complex crowd scenarios. It eliminates the need for additional data and only requires the inclusion of a head region within pedestrian information. Furthermore, this method does not incur any additional computational overhead. By leveraging information from the head portion of pedestrians, neural networks are better equipped to extract features. Consequently, this approach enhances the ability to distinguish between different pedestrian targets in crowded scenes, thereby improving detection accuracy.
Extended non-maximum suppression classifier
-
For two-stage object detection models like the Faster R-CNN[33] model, the first stage involves fuzzy detection of objects, generating multiple candidate boxes. Non-Maximum Suppression (NMS) is commonly used within these candidate boxes to effectively remove redundant detection results. However, situations arise where candidate boxes overlap significantly or entirely. In such cases, NMS is employed to select neighboring boxes with higher scores while filtering out those with lower scores.
Although the NMS classifier has been widely applied in practice, it still encounters several issues. One is when two detection boxes have very close IoU values, but their bounding box regression results differ significantly. In such cases, NMS may select the wrong detection box, leading to a decrease in accuracy[34]. Another issue is that the optimal IoU threshold may vary across different datasets and tasks, increasing the difficulty of algorithm tuning[35]. To address these challenges, this study proposes an extensible Non-Maximum Suppression algorithm, termed the ENMS classifier.
(1) The IoU threshold for HAERC is increased from 0.5 to 0.75 to further enhance HAERC's recognition accuracy of positive samples. This adjustment implies that only candidate boxes highly overlapping with the ground truth bounding boxes will be considered positive samples, while those with lower overlap will be filtered out or labeled as negative samples.
(2) Increasing the IoU threshold will significantly reduce the number of positive samples, leading to class imbalance. To address this issue, a method is introduced that utilizes the ground truth bounding boxes (GT) to make multiple adjustments to the position within a short period
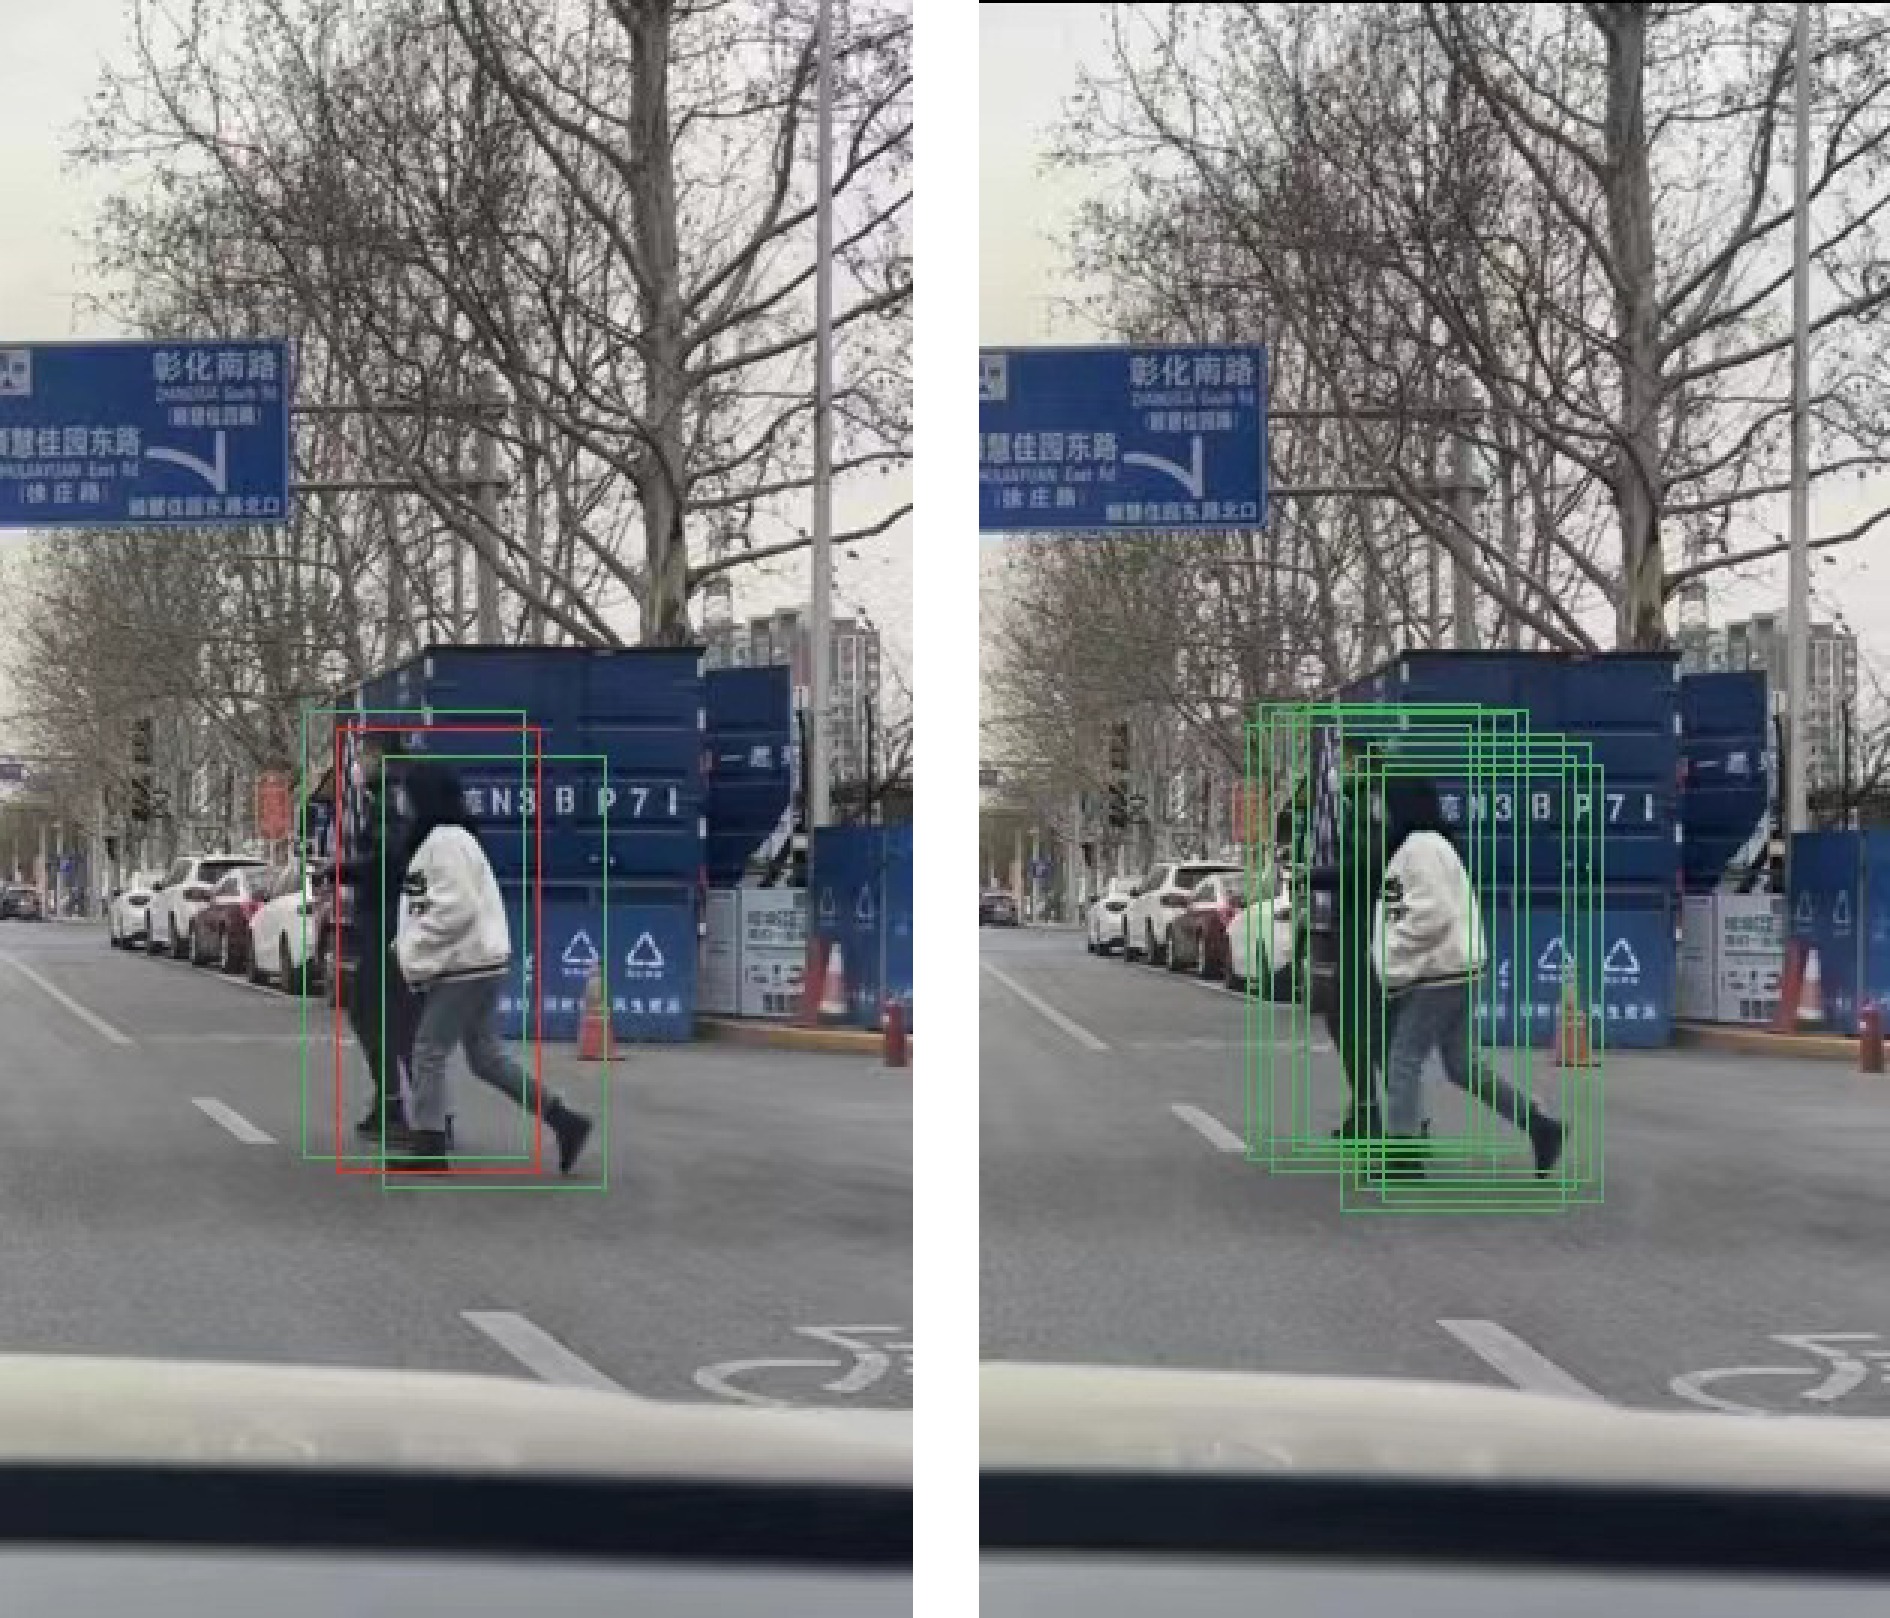
$ [ {{\delta _{x1}},{\delta _{y1}},{\delta _{x2}},{\delta _{y{\text{2}}}}} ] $ $ {\delta _{x1}},{\delta _{x2}} \sim Uniform( - 0.2w,0.2w) $ $ {\delta _{y1}},{\delta _{y2}} \sim Uniform( - 0.2h,0.2h), $ The final results are depicted in Fig. 3. The left image illustrates the classification process using NMS, where the green boxes represent true positive candidate boxes, and the red boxes denote false positive candidate boxes. It can be observed that the overlapping true positive candidate boxes do not effectively restrict the false positive candidate boxes. On the right side is the classification process using ENMS, which significantly improves the quality of true positive samples and effectively reduces the number of false positive candidate boxes observed on the left side.
-
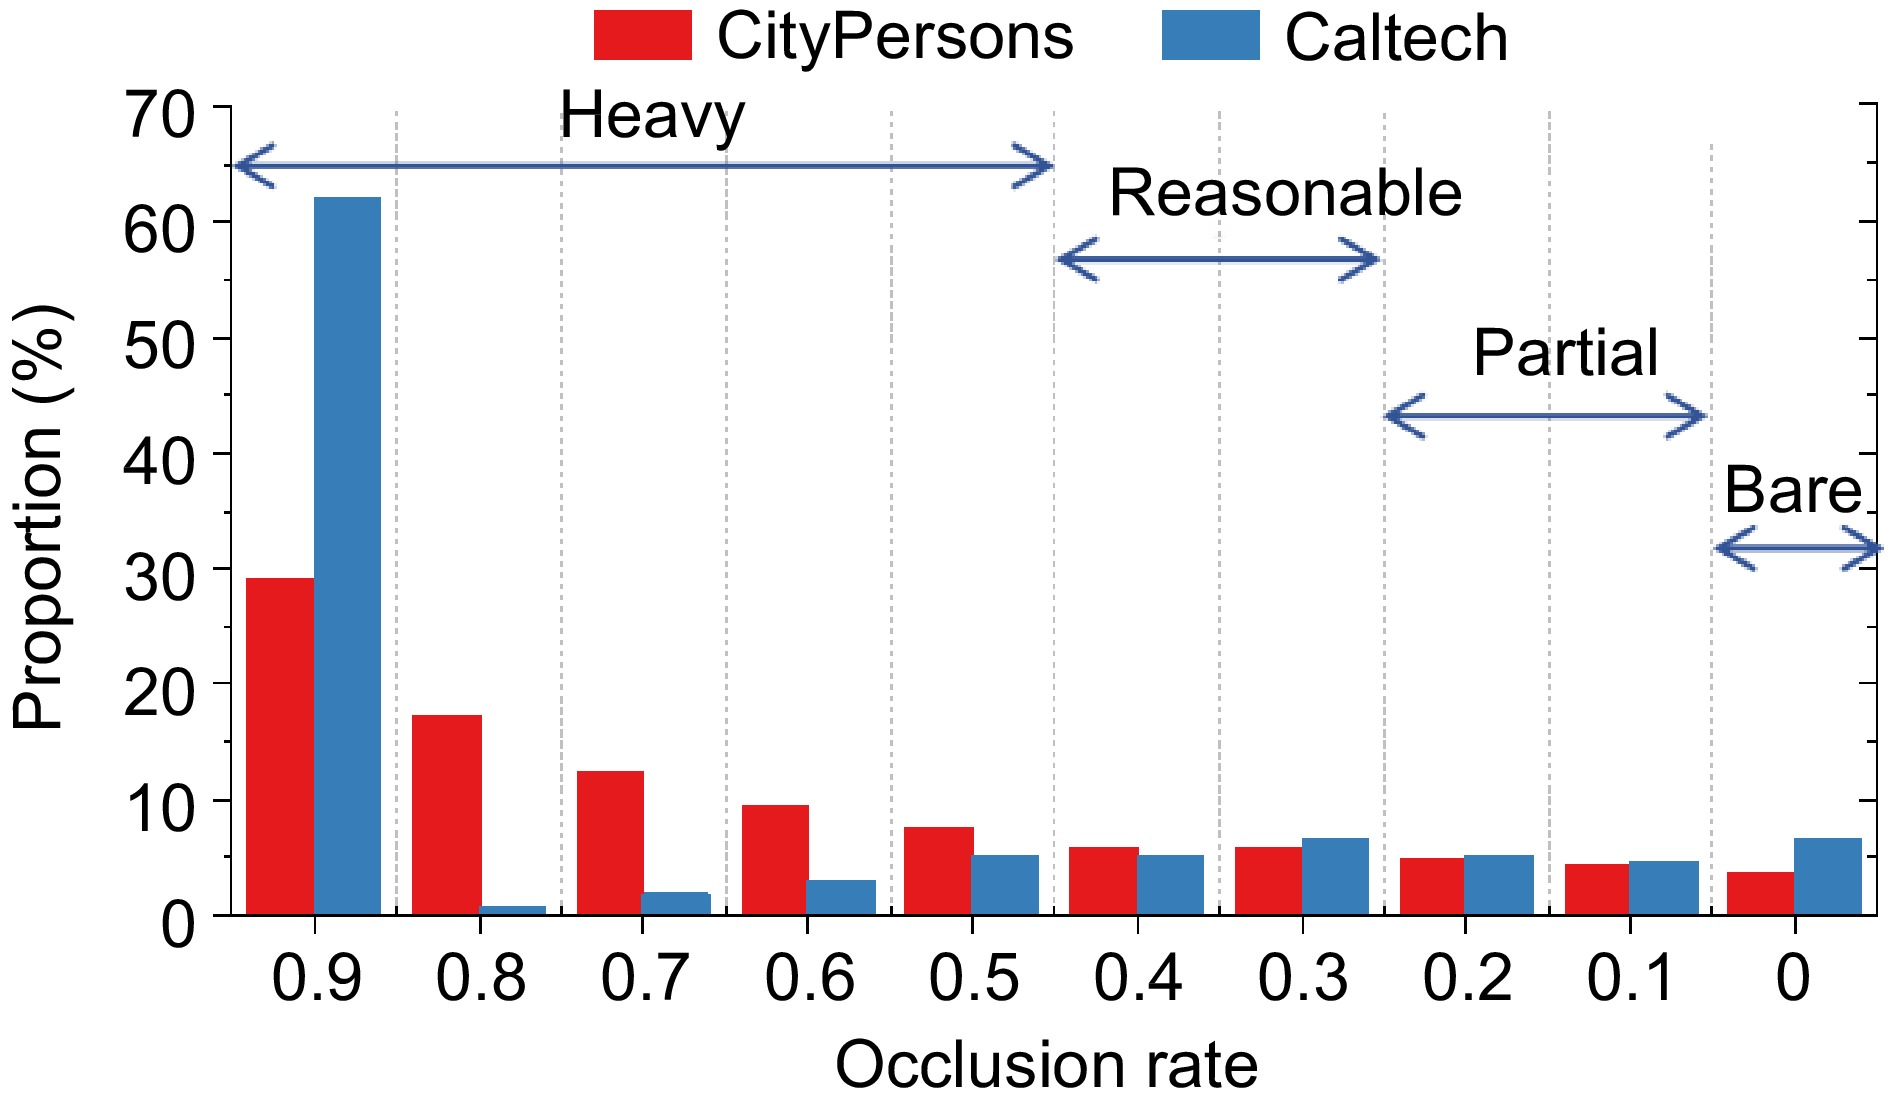
The dataset chosen for this study is the CityPersons dataset[36], a subset of CityScape focusing on pedestrian detection. Through statistical analysis, it is found that the dataset encompasses 18 cities from three different countries and spans across three seasons. On average, each image contains seven pedestrian samples. A comparison was made between the CityPersons dataset and the Caltech dataset, which is widely used in pedestrian detection tasks (as depicted in Fig. 1). The comparison results confirmed the advantages of CityPersons in the tasks undertaken in this study.
Figure 4 illustrates that the distribution of samples in the 'Reasonable' category is highly imbalanced, with 80% of the samples being unoccluded data. Conversely, the sample distribution in the CityPersons dataset is relatively balanced. Therefore, CityPersons was chosen as the experimental dataset for this research.
The CityPersons dataset includes labels such as 'rider' and 'ignore', which bear resemblance to pedestrian appearances. In this study, the validation set of this dataset was chosen as the test set. The pedestrian head was utilized to assist in detecting obstructed pedestrians.
Evaluating indicator
-
In pedestrian detection tasks, one of the most common evaluation metrics is the False Positive Per Image (FPPI), also known as the Log-average Miss Rate. It is calculated by uniformly sampling nine points in the logarithmic interval [10−2, 100]. If the curve terminates prematurely, the miss rate value at the termination point is used. Then, the average miss rate of the nine points is computed as the final metric.
To evaluate the effectiveness of this method comprehensively, experiments will be conducted on multiple datasets to assess its performance across various scenarios. To compare the algorithm's performance under different occlusion conditions, the CityPersons dataset will be partitioned based on the occlusion rates of its samples. Regarding the subdivision of datasets, there are two perspectives. Du et al.[37] highlighted that the accuracy of object detection models drops significantly when the occlusion rate exceeds 50%. Conversely, Yang et al.[38] proposed that during pedestrian crossings at signal-free intersections, when the occlusion area exceeds 50%, it generally corresponds to high pedestrian traffic, making pedestrians easily observable. Therefore, the subsets are divided as follows:
'Heavy' occlusion subset: when the occlusion rate is greater than 50%.
'Reasonable' occlusion subset: when the occlusion rate is less than or equal to 50% but greater than 30%.
'Partial' occlusion subset: when the occlusion rate is less than or equal to 30% but greater than 10%.
'Bare' occlusion subset: when the occlusion rate is less than or equal to 10%.
Comparison with existing technology
-
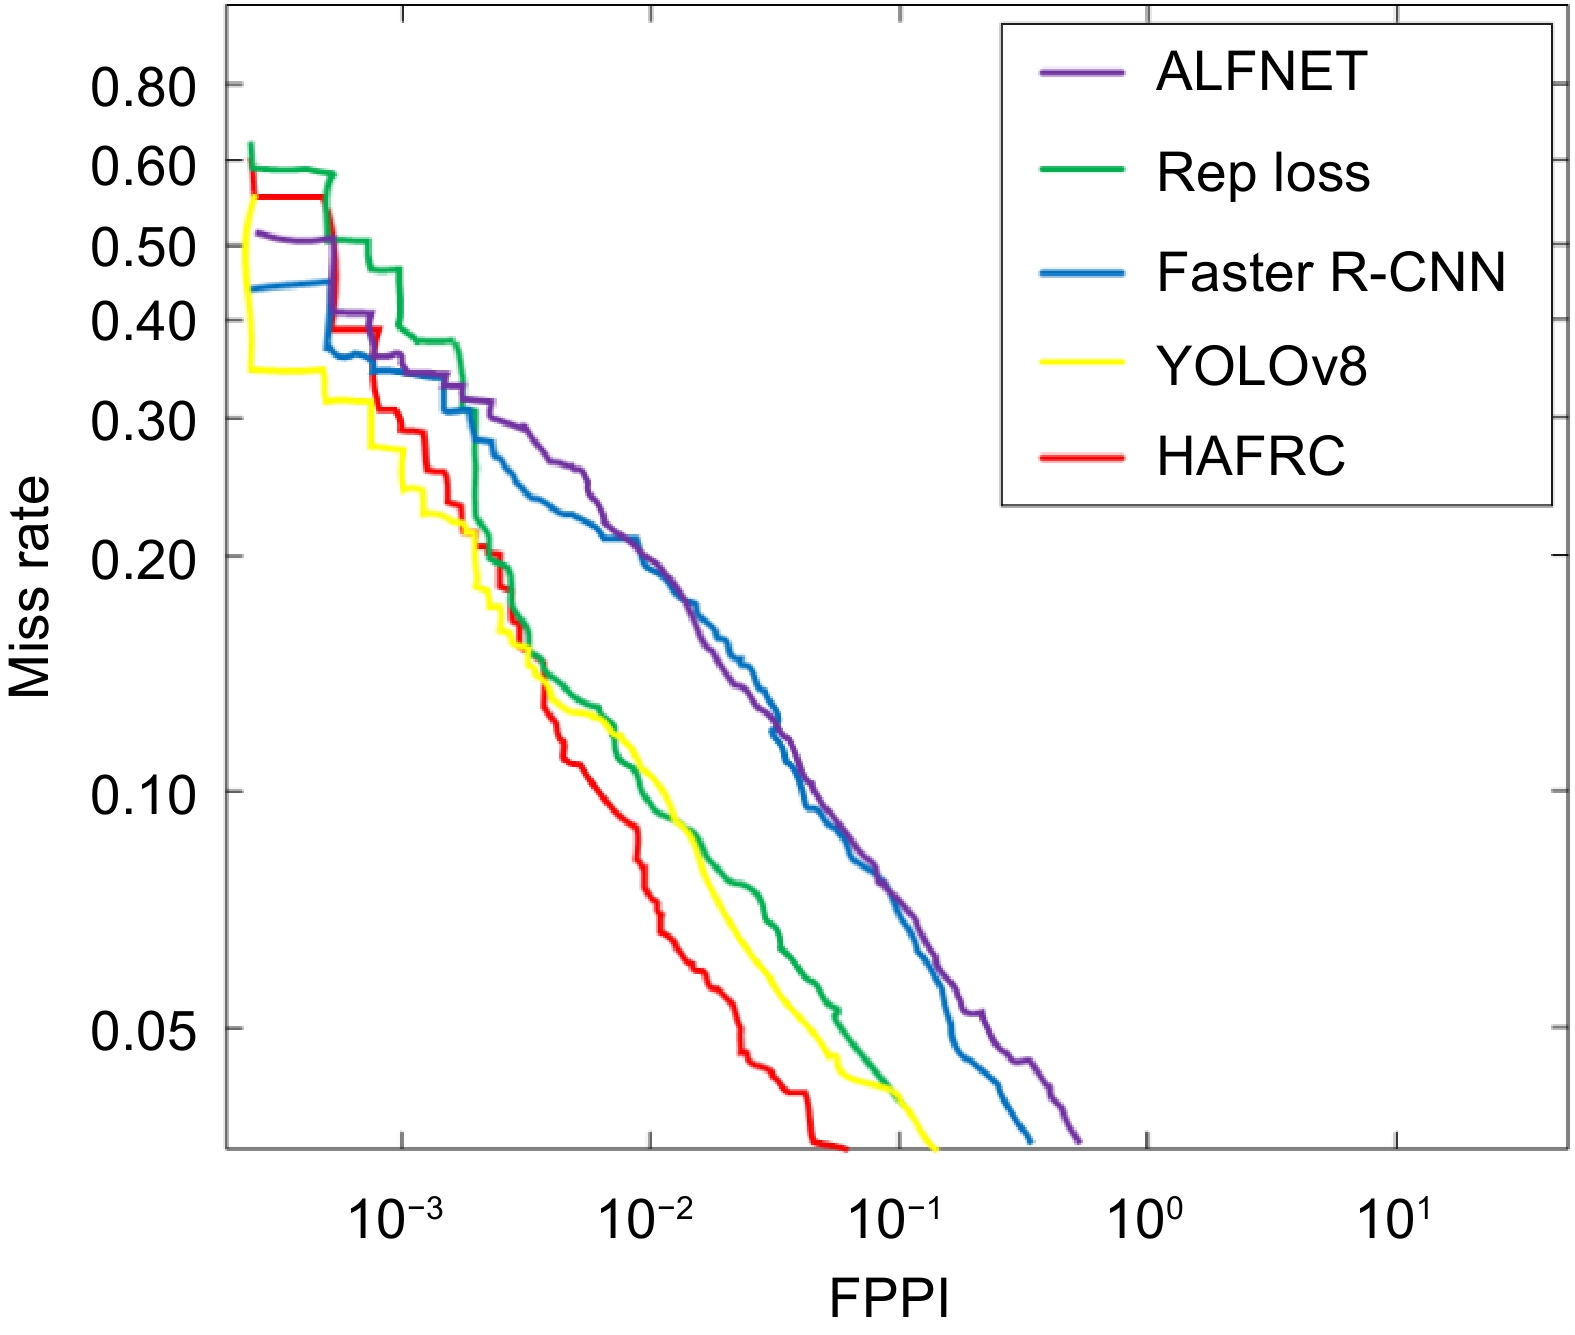
To validate the superiority of the model, four widely used object detection algorithms were selected for comparison with the proposed HAERC model. The evaluation was conducted using the four subsets constructed previously. The experimental results are presented in Table 1, and the FPPI-Miss rate curves for the five models are shown in Fig. 5.
Table 1. Performance comparison with other occlusion models.
Heavy Reasonable Accuracy Recall F1 score FPPI Accuracy Recall F1 score FPPI ALFNet 57.34% 63.70% 65.49% 51.90% 70.81% 64.12% 70.87% 12% Rep Loss 55.26% 62.31% 55.00% 64.12% 68.24% 62.04% 68.71% 13.20% Faster R-CNN 56.36% 54.00% 65.51% 55.67% 66.45% 62.35% 67.97% 14.37% YOLOv8 57.70% 63.53% 66.59% 44.24% 72.05% 61.12% 68.59% 12.07% HAERC 60.68% 63.70% 68.09% 46.64% 73.33% 62.40% 69.83% 9.59% Partial Bare Accuracy Recall F1 score FPPI Accuracy Recall F1 score FPPI ALFNet 74.39% 60.94% 69.73% 11.40% 74.82% 60.94% 69.86% 8.40% Rep Loss 69.99% 59.88% 67.34% 16.80% 75.51% 60.28% 69.56% 7.60% Faster R-CNN 70.74% 59.47% 67.30% 15.84% 74.92% 60.56% 69.39% 8.13% YOLOv8 75.10% 61.32% 70.25% 9.86% 76.54% 60.83% 70.31% 7.45% HAERC 75.91% 61.05% 70.30% 9.43% 77.16% 60.51% 70.24% 6.78% The bold part indicates that the optimality can be strengthened. The ALFNET model[39] utilizes VGG16 as its backbone network and employs a one-stage approach for recognition. The Rep Loss model[40] adopts a two-stage approach and incorporates residual connections in the backbone network. Faster R-CNN[33] employs a two-stage approach and enhances accuracy through dual-stage image classification, albeit slightly slower inference speed due to model complexity. YOLOv8[41] stands out as a powerful one-stage object detection algorithm, widely applied across various domains, showcasing impressive performance and broad recognition, The division result is shown in Fig. 4.
Figure 5 illustrates the FPPI-Miss rate curves for five models. It can be observed that, in comparison with the other four baseline models, the HAERC model exhibits overall strong occlusion resistance. However, in Heavy occlusion datasets, its FPPI is 46.64, slightly weaker than the YOLOv8 model's 44.24. Nonetheless, it outperforms the other three baseline models. This is speculated to be due to the HAERC model employing a two-stage approach, which entails higher computational complexity compared to the one-stage YOLOv8. In scenarios of extensive occlusion, the model's performance is compromised due to its computational intensity[42]. Although YOLOv8 yields relatively good results, its FPPI remains at 44.24, indicating that various models still struggle to achieve precise detection under occlusion rates exceeding 50%[15].
In the dataset with relatively weak occlusion, reasonably, the HAERC model achieves an FPPI of 9.59, outperforming the most powerful YOLOv8 model with an FPPI of 12.07. Moreover, the HAERC model surpasses all baseline models, demonstrating its superiority in Partial and Bare occlusion scenarios, with FPPIs of 9.43 and 6.78, respectively. These results confirm the outstanding performance of the HAERC model in occluded environment object detection.
To validate the detection accuracy of the proposed HAERC model, we compared its performance against four baseline models using accuracy as the metric. The comparison revealed that in the Heavy dataset, which involves severe occlusion, the HAERC model achieved an accuracy of 60.68%. While this indicates room for improvement, it significantly outperforms the Rep Loss model, which achieved an accuracy of 55.26%. Even the advanced YOLOv8 model had an accuracy of 57.70% in this subset, making the HAERC model's performance over 5% better, which is a notable improvement. In the other subsets with less severe occlusion (Reasonable, Partial, and Bare), the HAERC model demonstrated even stronger performance, with accuracies of 73.33%, 75.91%, and 77.16%, respectively. With an average accuracy exceeding 75%, these results clearly demonstrate the robustness and effectiveness of the HAERC model.
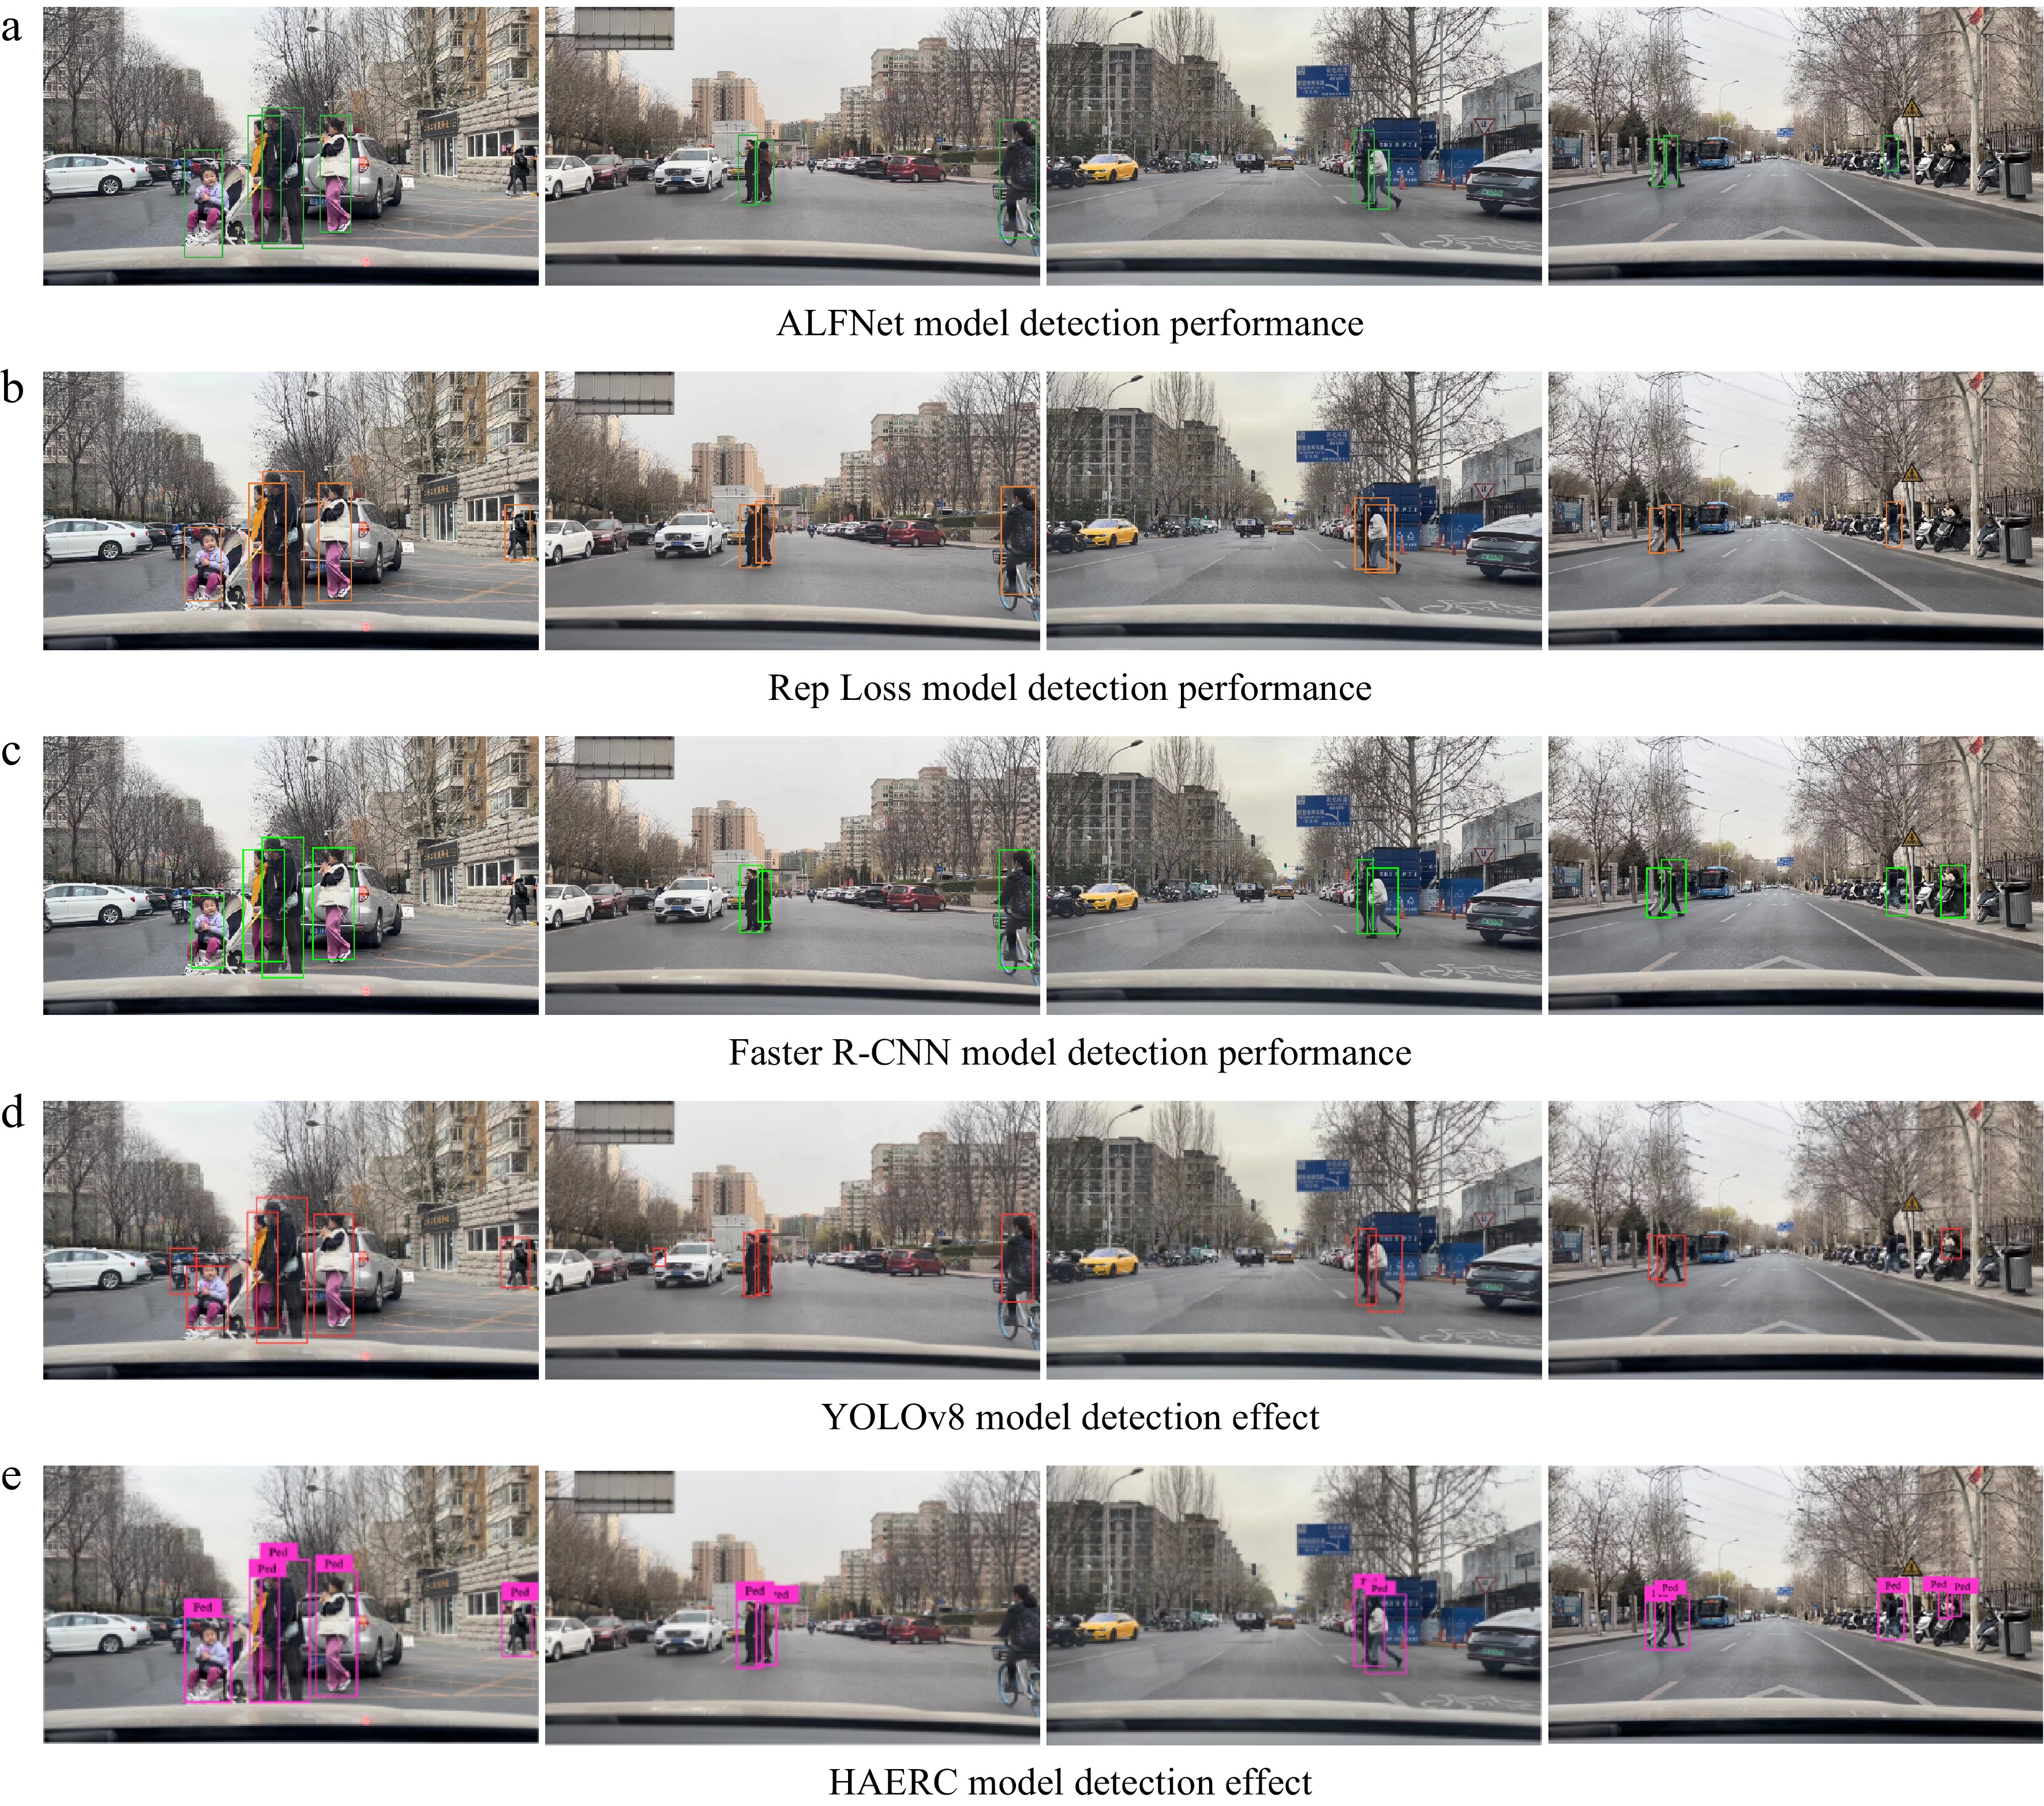
Furthermore, to validate the model's recognition of occluded pedestrians from a driver's perspective, experiments were conducted in a real driving scenario. Cameras were placed in vehicles to collect data while driving on city roads. Over a week, a total of 3 h of data were collected, and the proposed HAERC model was tested. The recognition effectiveness of the HAERC model for occluded pedestrians from a driver's perspective is illustrated in Fig. 6.
From the results shown in Fig. 6, it is evident that the model can accurately recognize pedestrians in both types of occlusion scenarios caused by interactions between people and objects. In Fig. 6e1, which illustrates complex occlusion caused by interactions between people directly in front, the HAERC model achieves precise recognition. Moreover, Fig 6e2 and 6e3 demonstrate that the HAERC model effectively identifies occluded pedestrians, even when they are small and at a distance, through its integration of pedestrian head features and ENMS classifier strategies. Furthermore, in Fig. 6e4, the occlusion caused by objects on the right side is also accurately identified by the HAERC model, leveraging pedestrian head features.
By comparing the detection performance of different models in Fig. 6, it is evident that the ALFNe and Rep Loss models depicted in Fig. 6a & b respectively do not achieve satisfactory results. In these models, there is a noticeable occurrence of missed detections, particularly for small occluded pedestrians in the images. However, there is a notable performance improvement observed in Faster R-CNN, YOLOv8, and the proposed HAERC model. When faced with occluded pedestrians, such as the occluded pedestrian on the right side of the fourth image, it is evident that the HAERC model exhibits superior performance in recognizing occluded targets. Regarding the missed detection phenomenon observed in the second image for the HAERC model, it can be attributed to the model's emphasis on pedestrian head features. In this particular image, the head features of the pedestrian are not prominent, leading to the occurrence of missed detections.
Ablation experiment
-
To assess the influence of different modules in the HAERC model on occlusion detection and to evaluate the scientific integrity of the model, we conducted ablation experiments by selectively removing modules to create two variants: HAERC1 and HAERC2. HAERC1 integrates only the pedestrian head feature module, while HAERC2 considers only the utilization of ENMS classification criteria. Subsequently, we performed comparative validation experiments on datasets with Heavy and Reasonable occlusion levels. The experimental results and model compositions are summarized in Table 2.
Table 2. Results of ablation experiments.
Model ENMS Head feature
moduleBackbone Heavy Reasonable HAERC1 √ ResNet-50 49.74 11.67 HAERC2 √ ResNet-50 47.3 10.74 HAERC √ √ ResNet-50 46.64 9.59 The comparison between HAERC and HAERC1 models reveals that HAERC achieves an FPPI of 46.64 and 9.59 on the Heavy and Reasonable datasets, respectively. In contrast, the HAERC1 model, which solely employs the head feature module, achieves FPPI values of 49.74 and 11.67 on the same datasets. These results effectively demonstrate that considering the pedestrian head feature module can significantly enhance pedestrian detection performance in occluded scenarios. Similarly, the HAERC2 model, which relies solely on the ENMS classifier, achieves FPPI values of 47.3 and 10.74 on the Heavy and Reasonable datasets, respectively, indicating weaker performance compared to HAERC. This confirms the superiority and scientific integrity of the HAERC model composition.
-
This study focuses on accurately identifying pedestrians in complex occlusion environments at urban signal-free intersections to enhance safety during long-range driving and reduce the probability of accidents. A pedestrian detection method called HAERC, considering pedestrian head features, was developed in this study. Specifically, the model's backbone network is based on a two-stage object detection algorithm, which simultaneously considers pedestrian head features and the overall target during target extraction, detecting occluded targets through weighted fusion. Moreover, to address the misjudgment issue during the optimal selection of candidate boxes in the two-stage method, this study proposed an Extended Non-Maximum Suppression (ENMS) classifier by extending the IoU threshold for candidate boxes. Finally, the performance of HAERC was validated using the CityPersons dataset, and comparisons were made with four baseline models. The results confirmed the superiority of the HAERC model in detecting occluded pedestrians at urban signal-free intersections, highlighting its robust performance. This study, through computer vision technology, aims to address the issue of false positives caused by pedestrian occlusion during pedestrian crossing at signal-free intersections. By integrating this method into vehicle auxiliary driving systems, vehicles can autonomously detect and avoid pedestrians crossing, mitigating driver blind spots, extending the visual range of vehicles at signal-free intersections, and enhancing intersection safety.
With the advancement of vehicle-to-everything (V2X) technology and the widespread application of future connected vehicle technology, utilizing traffic infrastructure to better address safety concerns becomes a paramount goal. This study solely considers detecting occluded pedestrians from the driver's perspective. In future research, a more accurate detection could be achieved by integrating monitoring cameras with in-vehicle cameras, enabling detection from multiple viewpoints.
-
The authors confirm contribution to the paper as follows: study conception and design: Qie K, Li Z, Wang Z; data collection: Qie K, Wang J; analysis and interpretation of results: Wang J, Luo W; draft manuscript preparation: Qie K, Wang J. All authors reviewed the results and approved the final version of the manuscript.
-
The data used to support the findings in this study are available from the corresponding authors upon request.
This paper was Supported by Beijing Natural Science Foundation (9234025) , National Social Science Fund Project of China (21FGLB014) and Humanity and Social Science Youth Foundation of Ministry of Education of China (21YJC630094).
-
The authors declare that they have no conflict of interest. Jianyu Wang and Wei Luo are the Editorial Board members of Digital Transportation and Safety who were blinded from reviewing or making decisions on the manuscript. The article was subject to the journal's standard procedures, with peer-review handled independently of these Editorial Board members and the research groups.
- Copyright: © 2024 by the author(s). Published by Maximum Academic Press, Fayetteville, GA. This article is an open access article distributed under Creative Commons Attribution License (CC BY 4.0), visit https://creativecommons.org/licenses/by/4.0/.
-
About this article
Cite this article
Qie K, Wang J, Li Z, Wang Z, Luo W. 2024. Recognition of occluded pedestrians from the driver's perspective for extending sight distance and ensuring driving safety at signal-free intersections. Digital Transportation and Safety 3(2): 65−74 doi: 10.48130/dts-0024-0007
Recognition of occluded pedestrians from the driver's perspective for extending sight distance and ensuring driving safety at signal-free intersections
- Received: 15 May 2024
- Revised: 11 June 2024
- Accepted: 12 June 2024
- Published online: 27 June 2024
Abstract: Urban intersections without traffic signals are prone to accidents involving motor vehicles and pedestrians. Utilizing computer vision technology to detect pedestrians crossing the street can effectively mitigate the occurrence of such accidents. Faced with the complex issue of pedestrian occlusion at signal-free intersections, this paper proposes a target detection model called Head feature And ENMS fusion Residual connection For CNN (HAERC). Specifically, the model includes a head feature module that detects occluded pedestrians by integrating their head features with the overall target. Additionally, to address the misselection caused by overlapping candidate boxes in two-stage target detection models, an Extended Non-Maximum Suppression classifier (ENMS) with expanded IoU thresholds is proposed. Finally, leveraging the CityPersons dataset and categorizing it into four classes based on occlusion levels (heavy, reasonable, partial, bare), the HAERC model is experimented on these classes and compared with baseline models. Experimental results demonstrate that HAERC achieves superior False Positives Per Image (FPPI) values of 46.64%, 9.59%, 9.43%, and 6.78% respectively for the four classes, outperforming all baseline models. The study concludes that the HAERC model effectively identifies occluded pedestrians in the complex environment of urban intersections without traffic signals, thereby enhancing safety for long-range driving at such intersections.
-
Key words:
- Traffic safety /
- Signal-free intersections /
- Pedestrian crossing /
- Occlusion recognition /
- HAERC /
- ENMS


