-
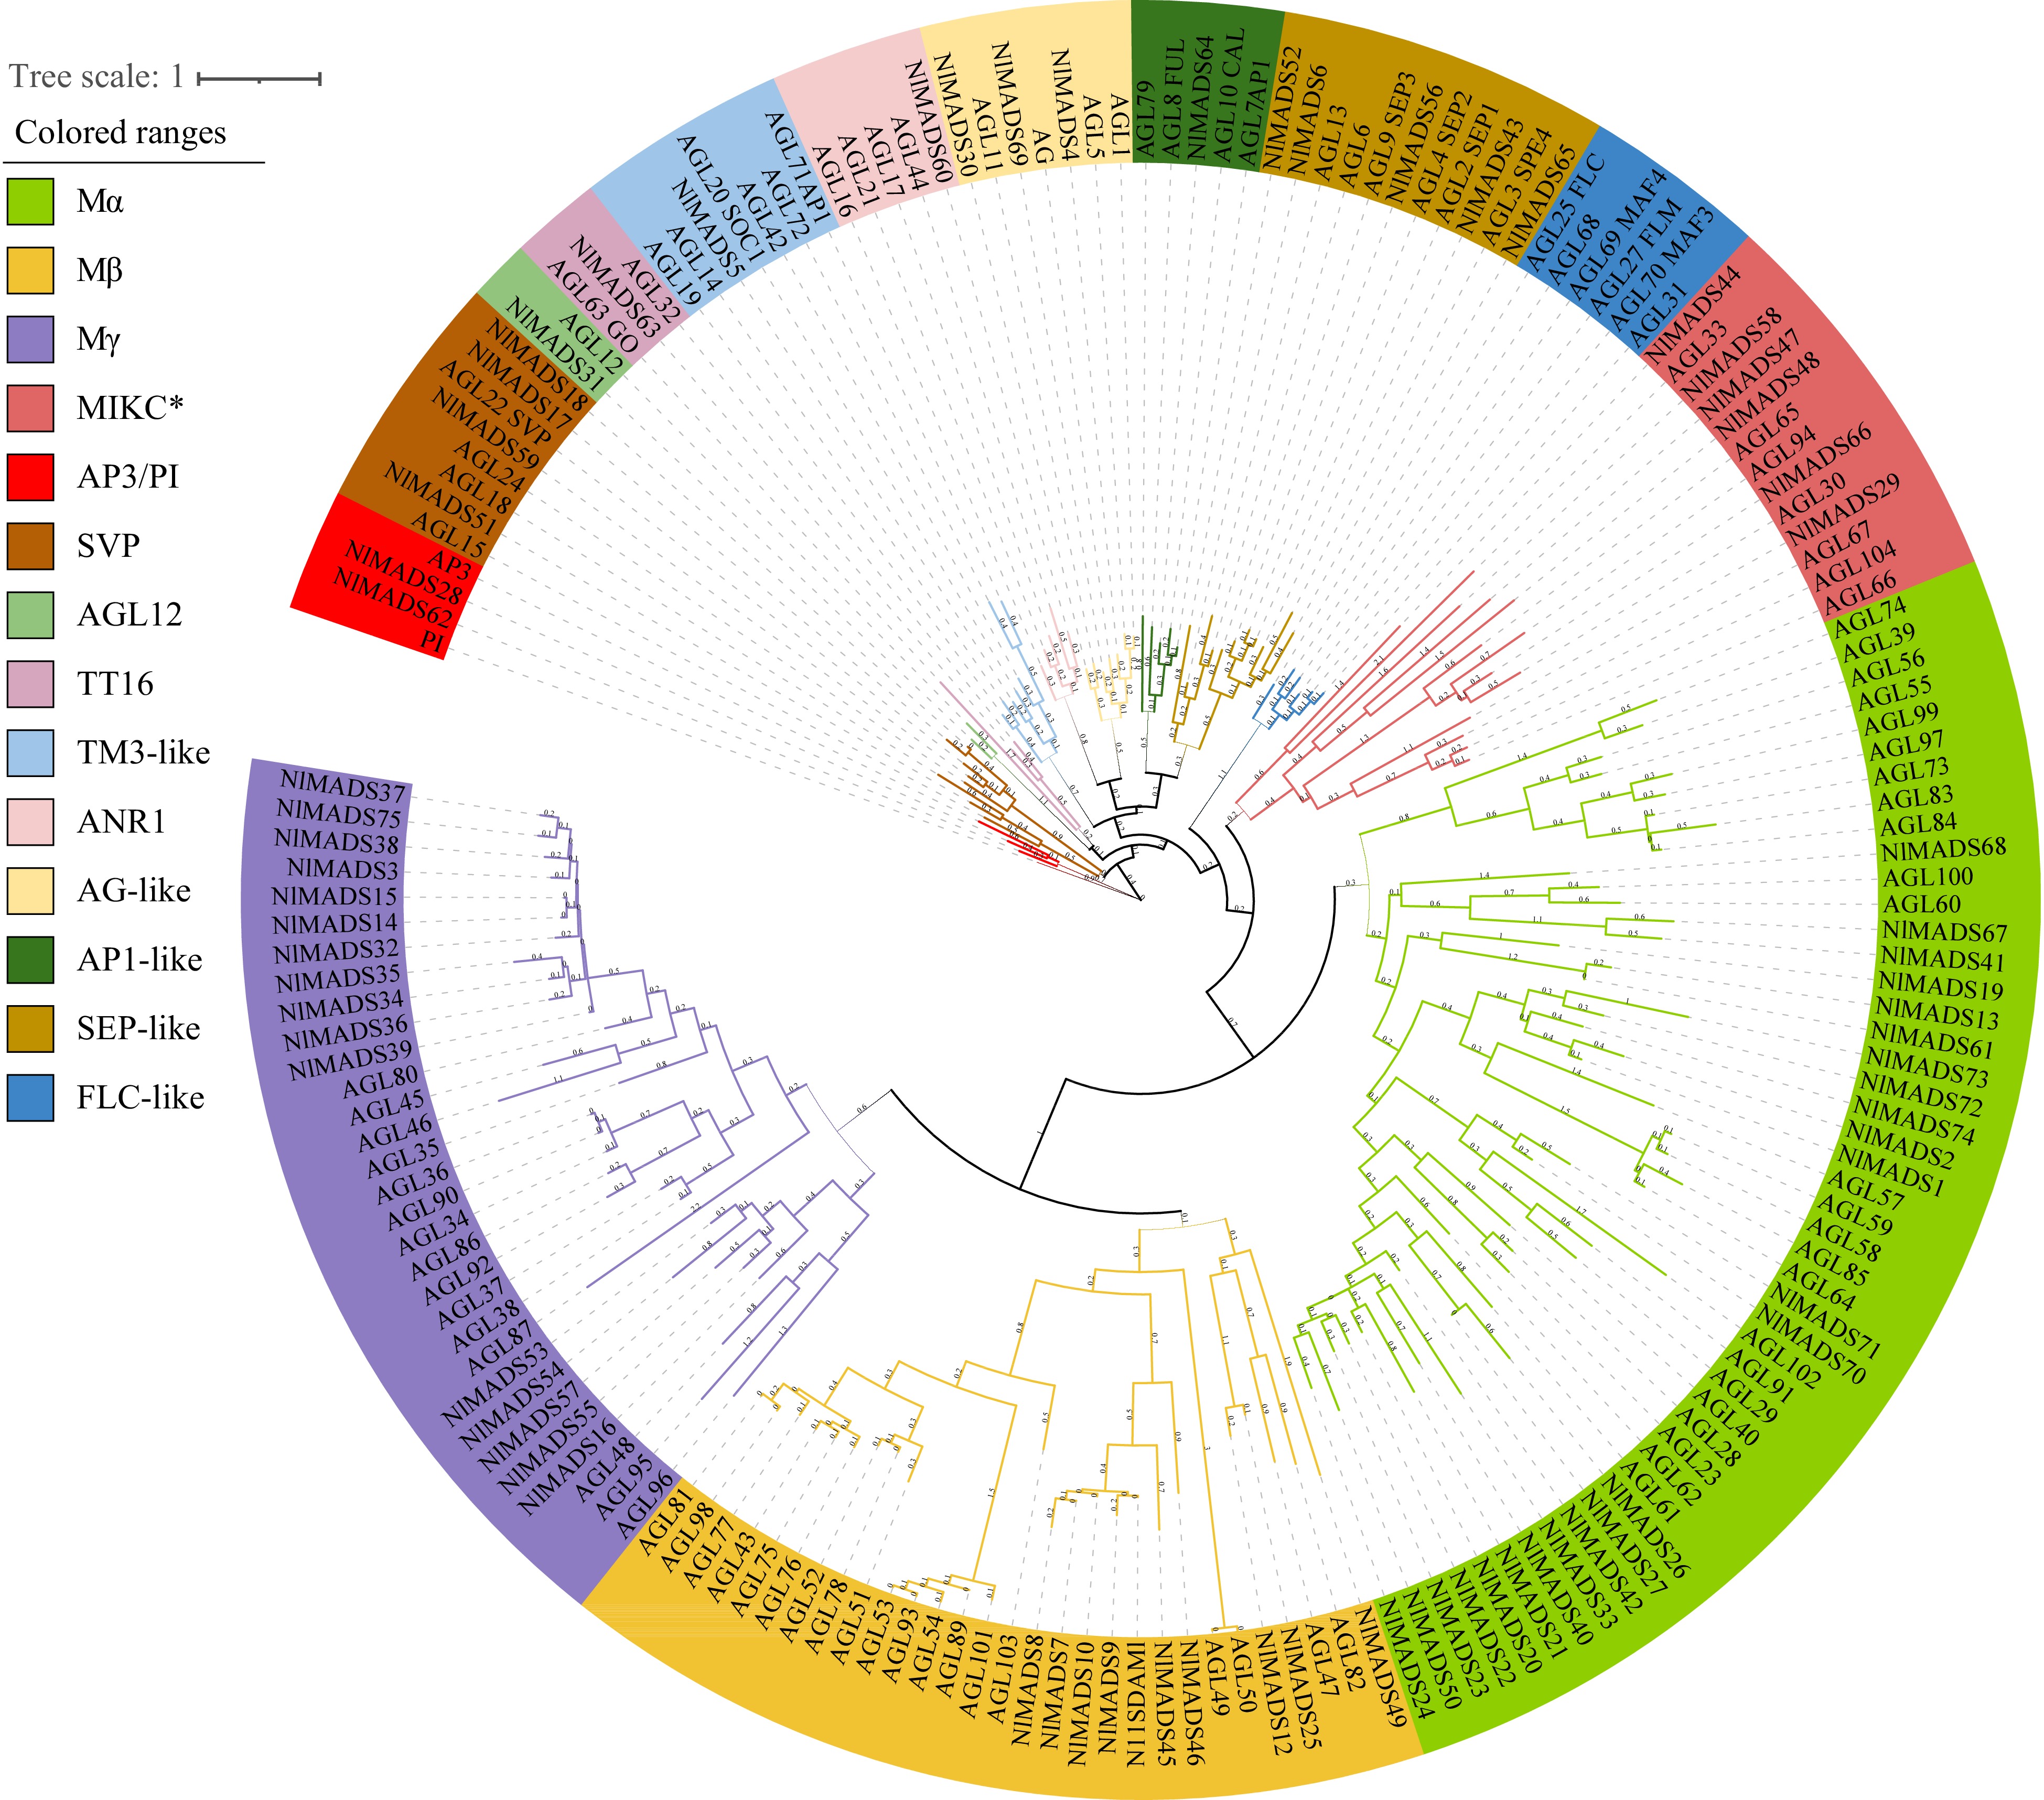
Figure 1.
Phylogenetic analysis of the MADS-box genes from Arabidopsis, rice and rambutan. Different colors represent different subfamilies.
-
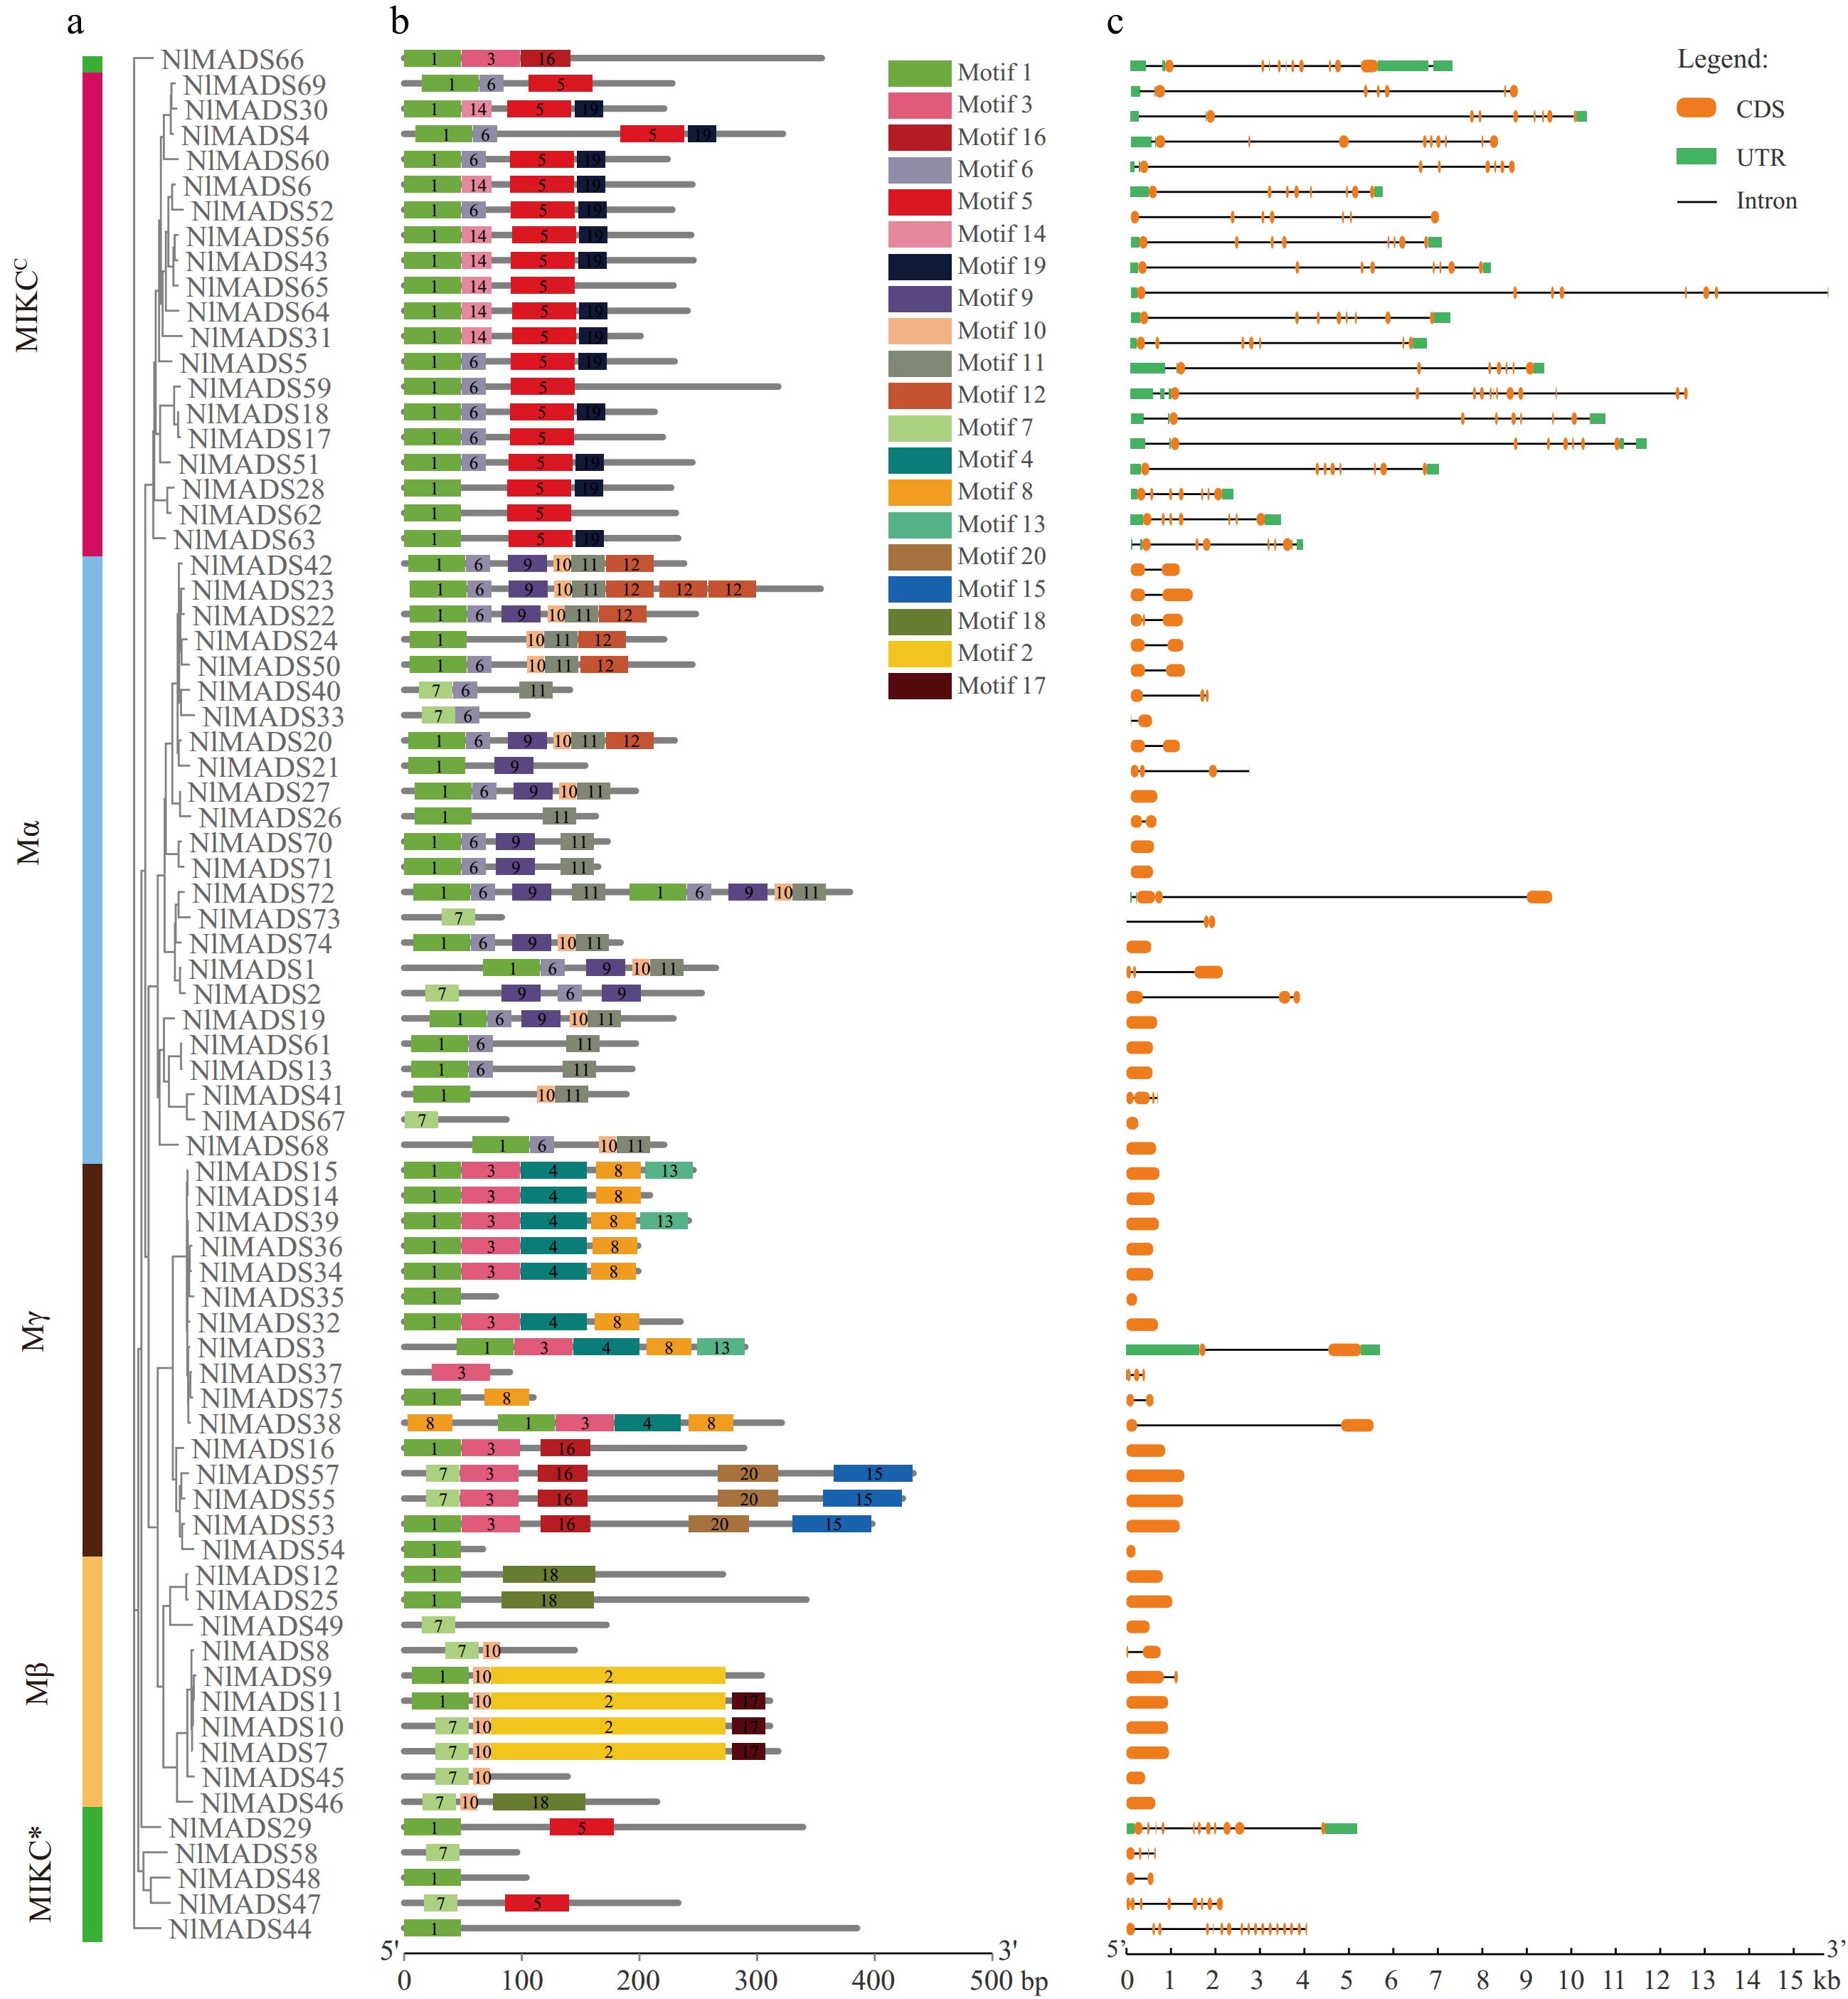
Figure 2.
(a) Phylogenetic relationships, (b) architecture of conserved protein motifs and (c) gene structure in MADS-box genes from rambutan. Conserved motifs were identified based on phylogenetic relationships via MEME program. The different colors represent the 20 conserved motifs. The yellow and green rectangles represent CDs and UTRs respectively, and the blank lines represent introns.
-
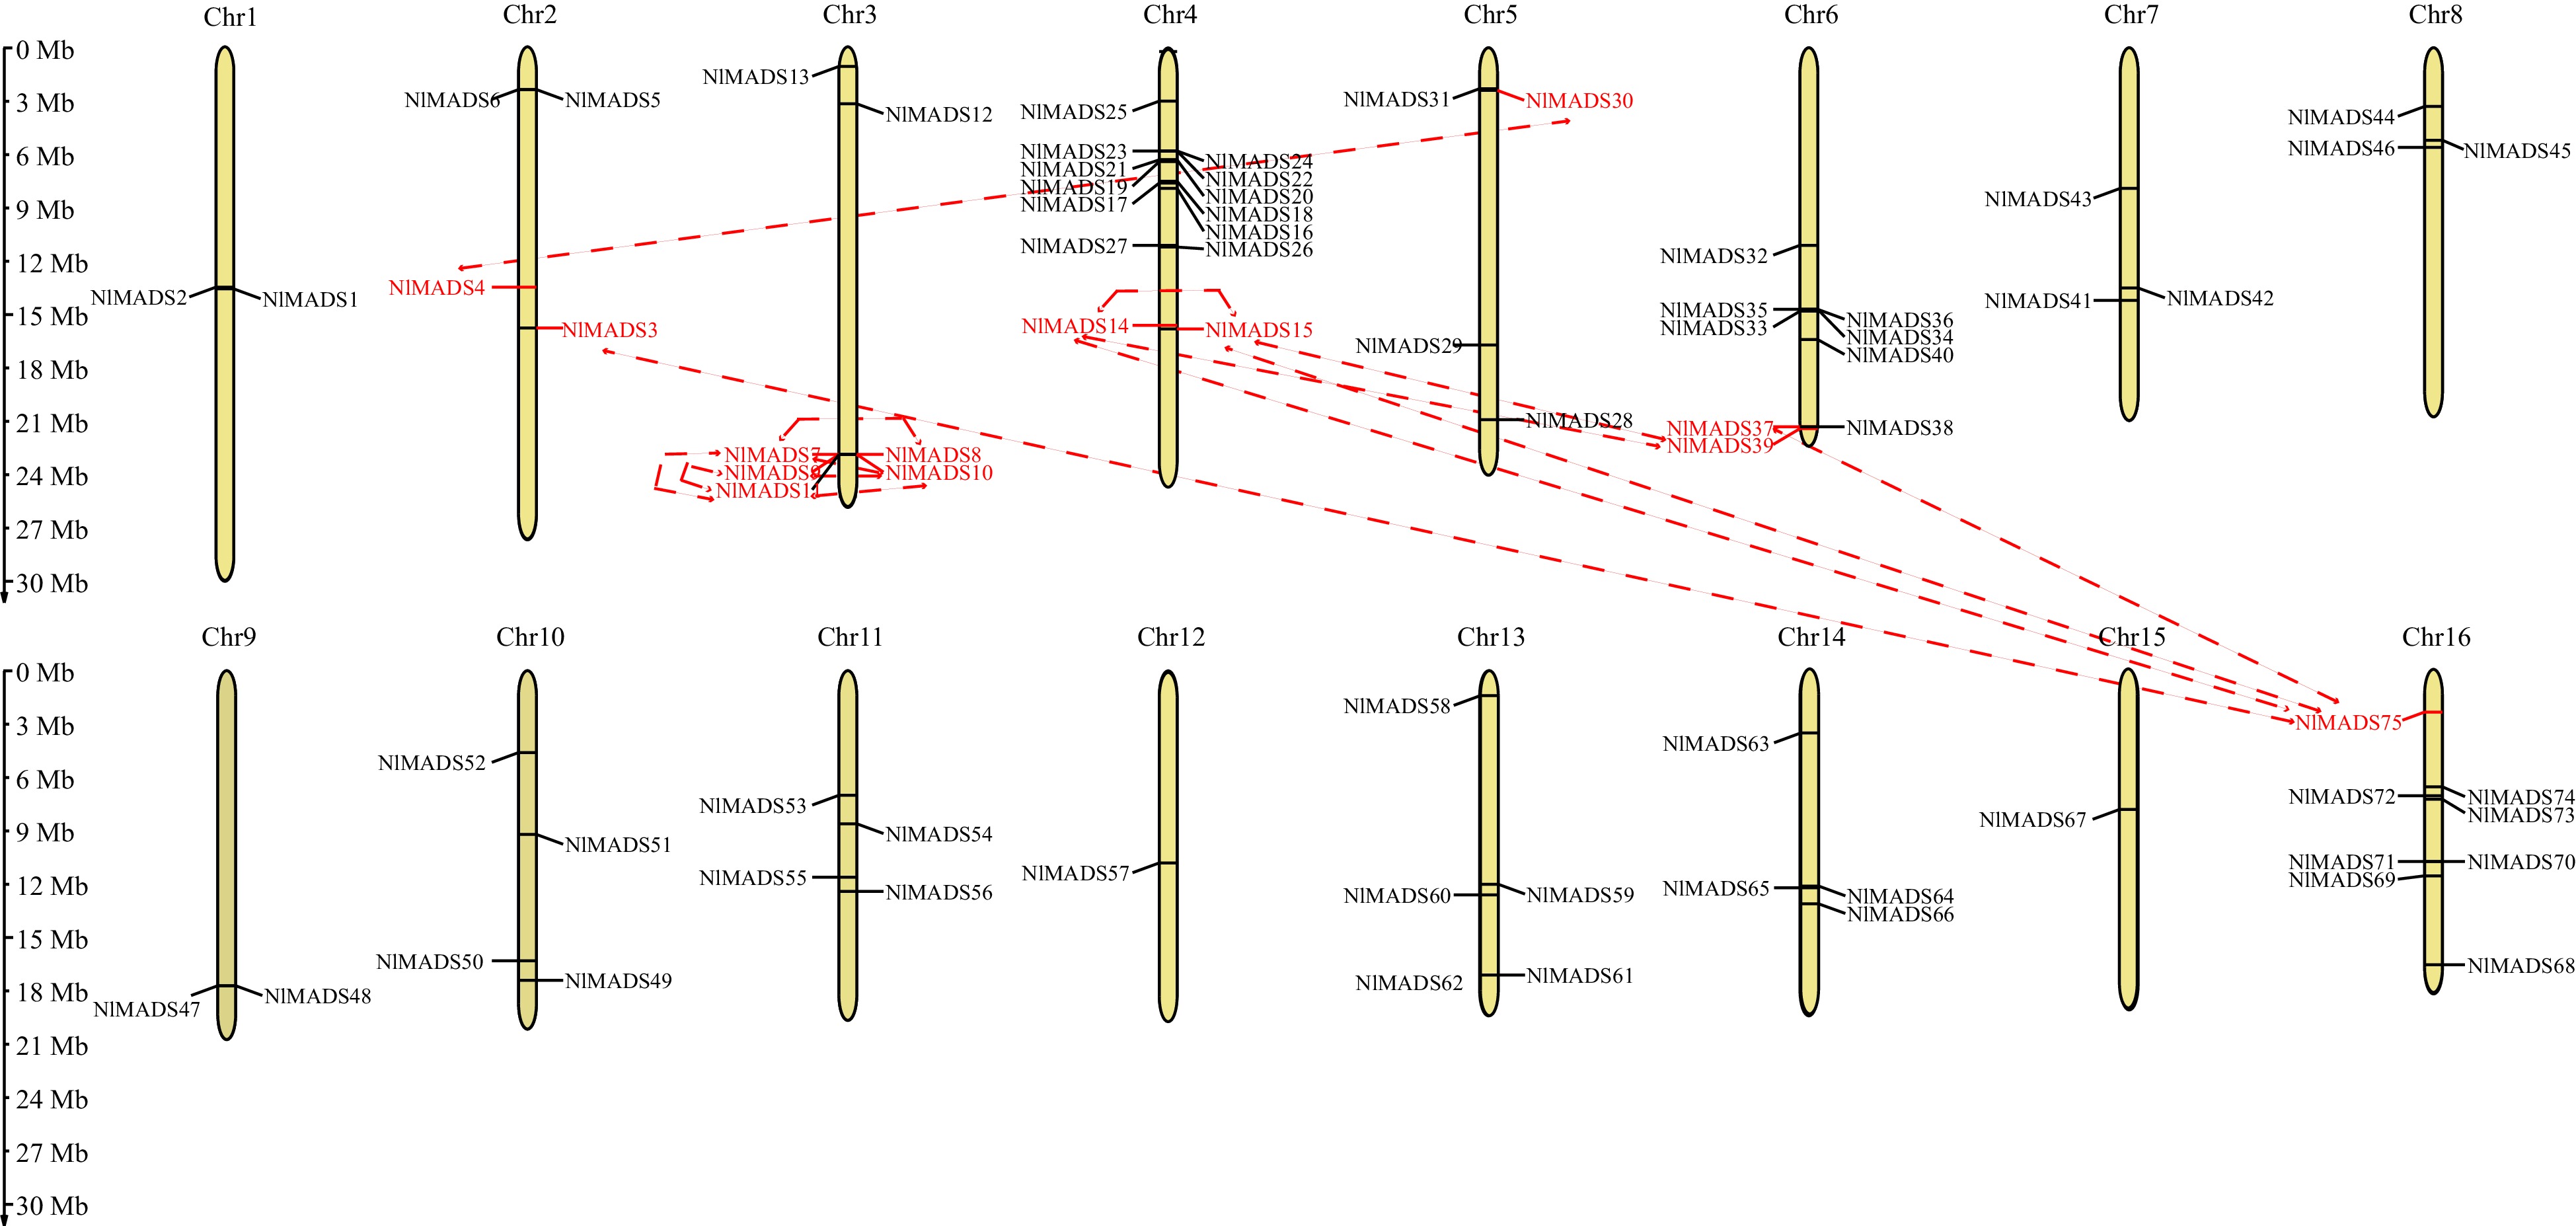
Figure 3.
Distribution of the identified 75 NlMADS genes across the rambutan genome. The dotted lines connected between the two genes represent the duplication events of genes.
-
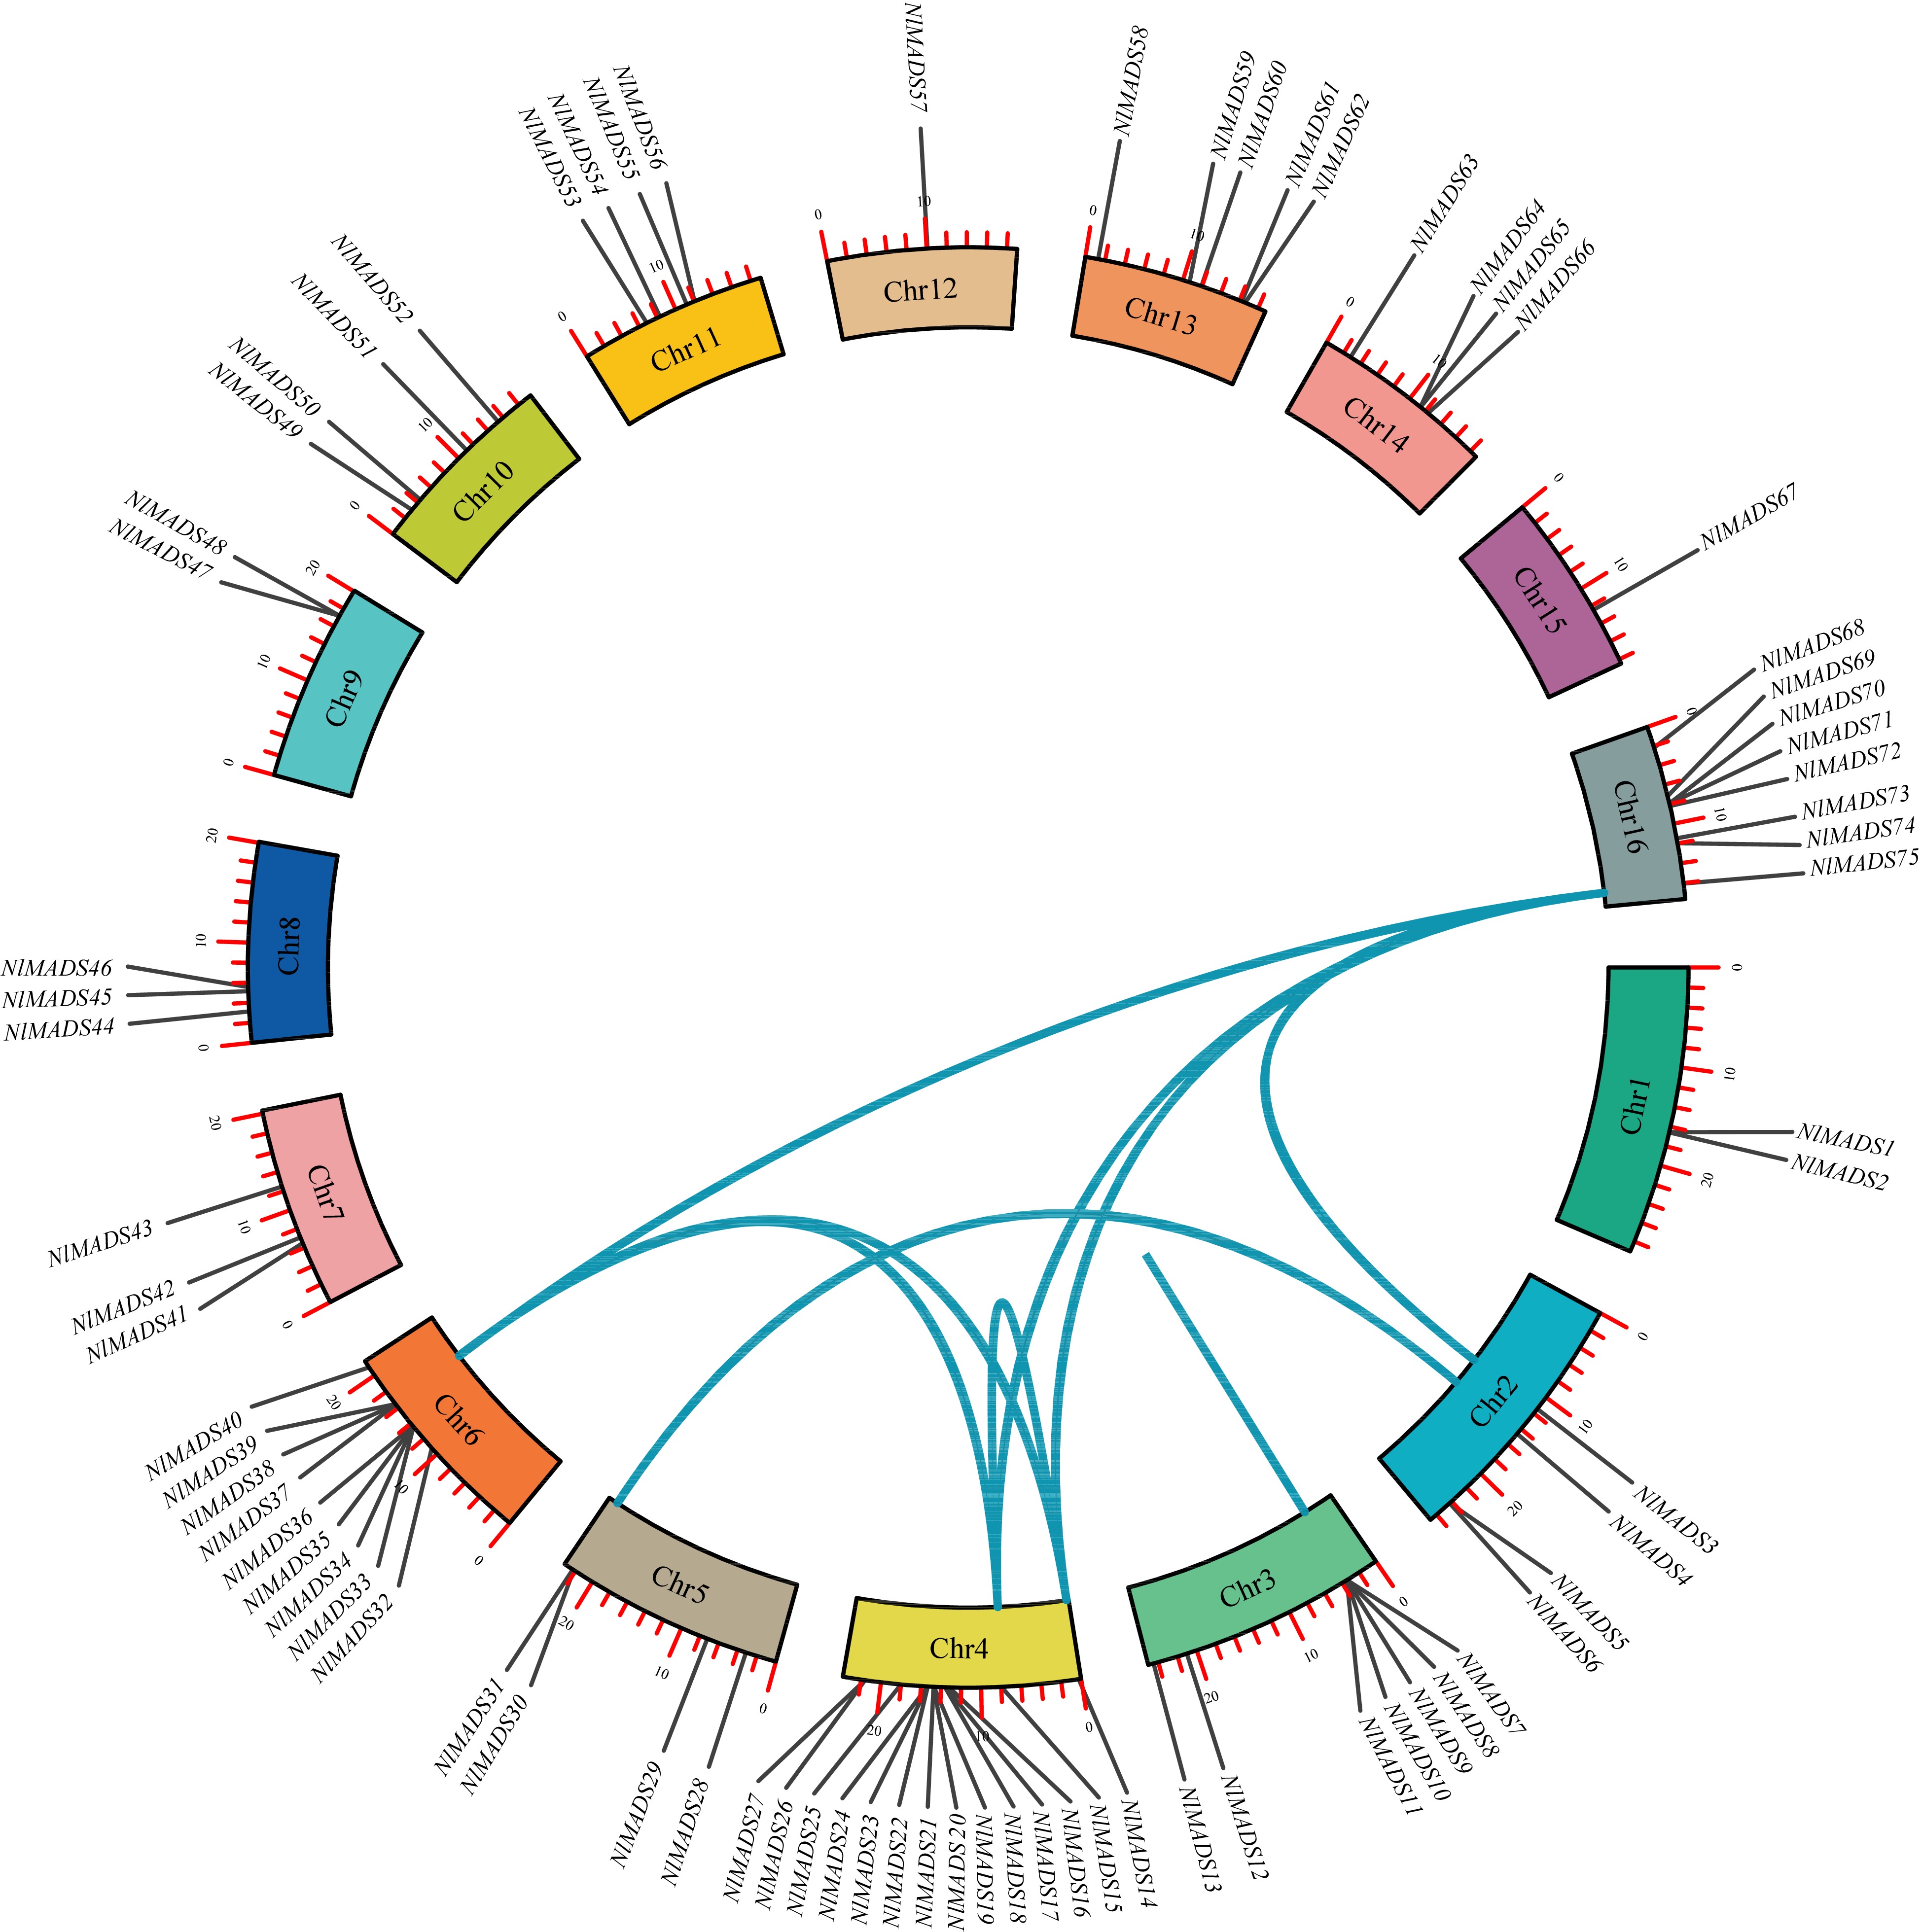
Figure 4.
The synteny analysis of MADS-box family in rambutan. The blue lines connect homologous genes. The different colors represent chromosomes.
-
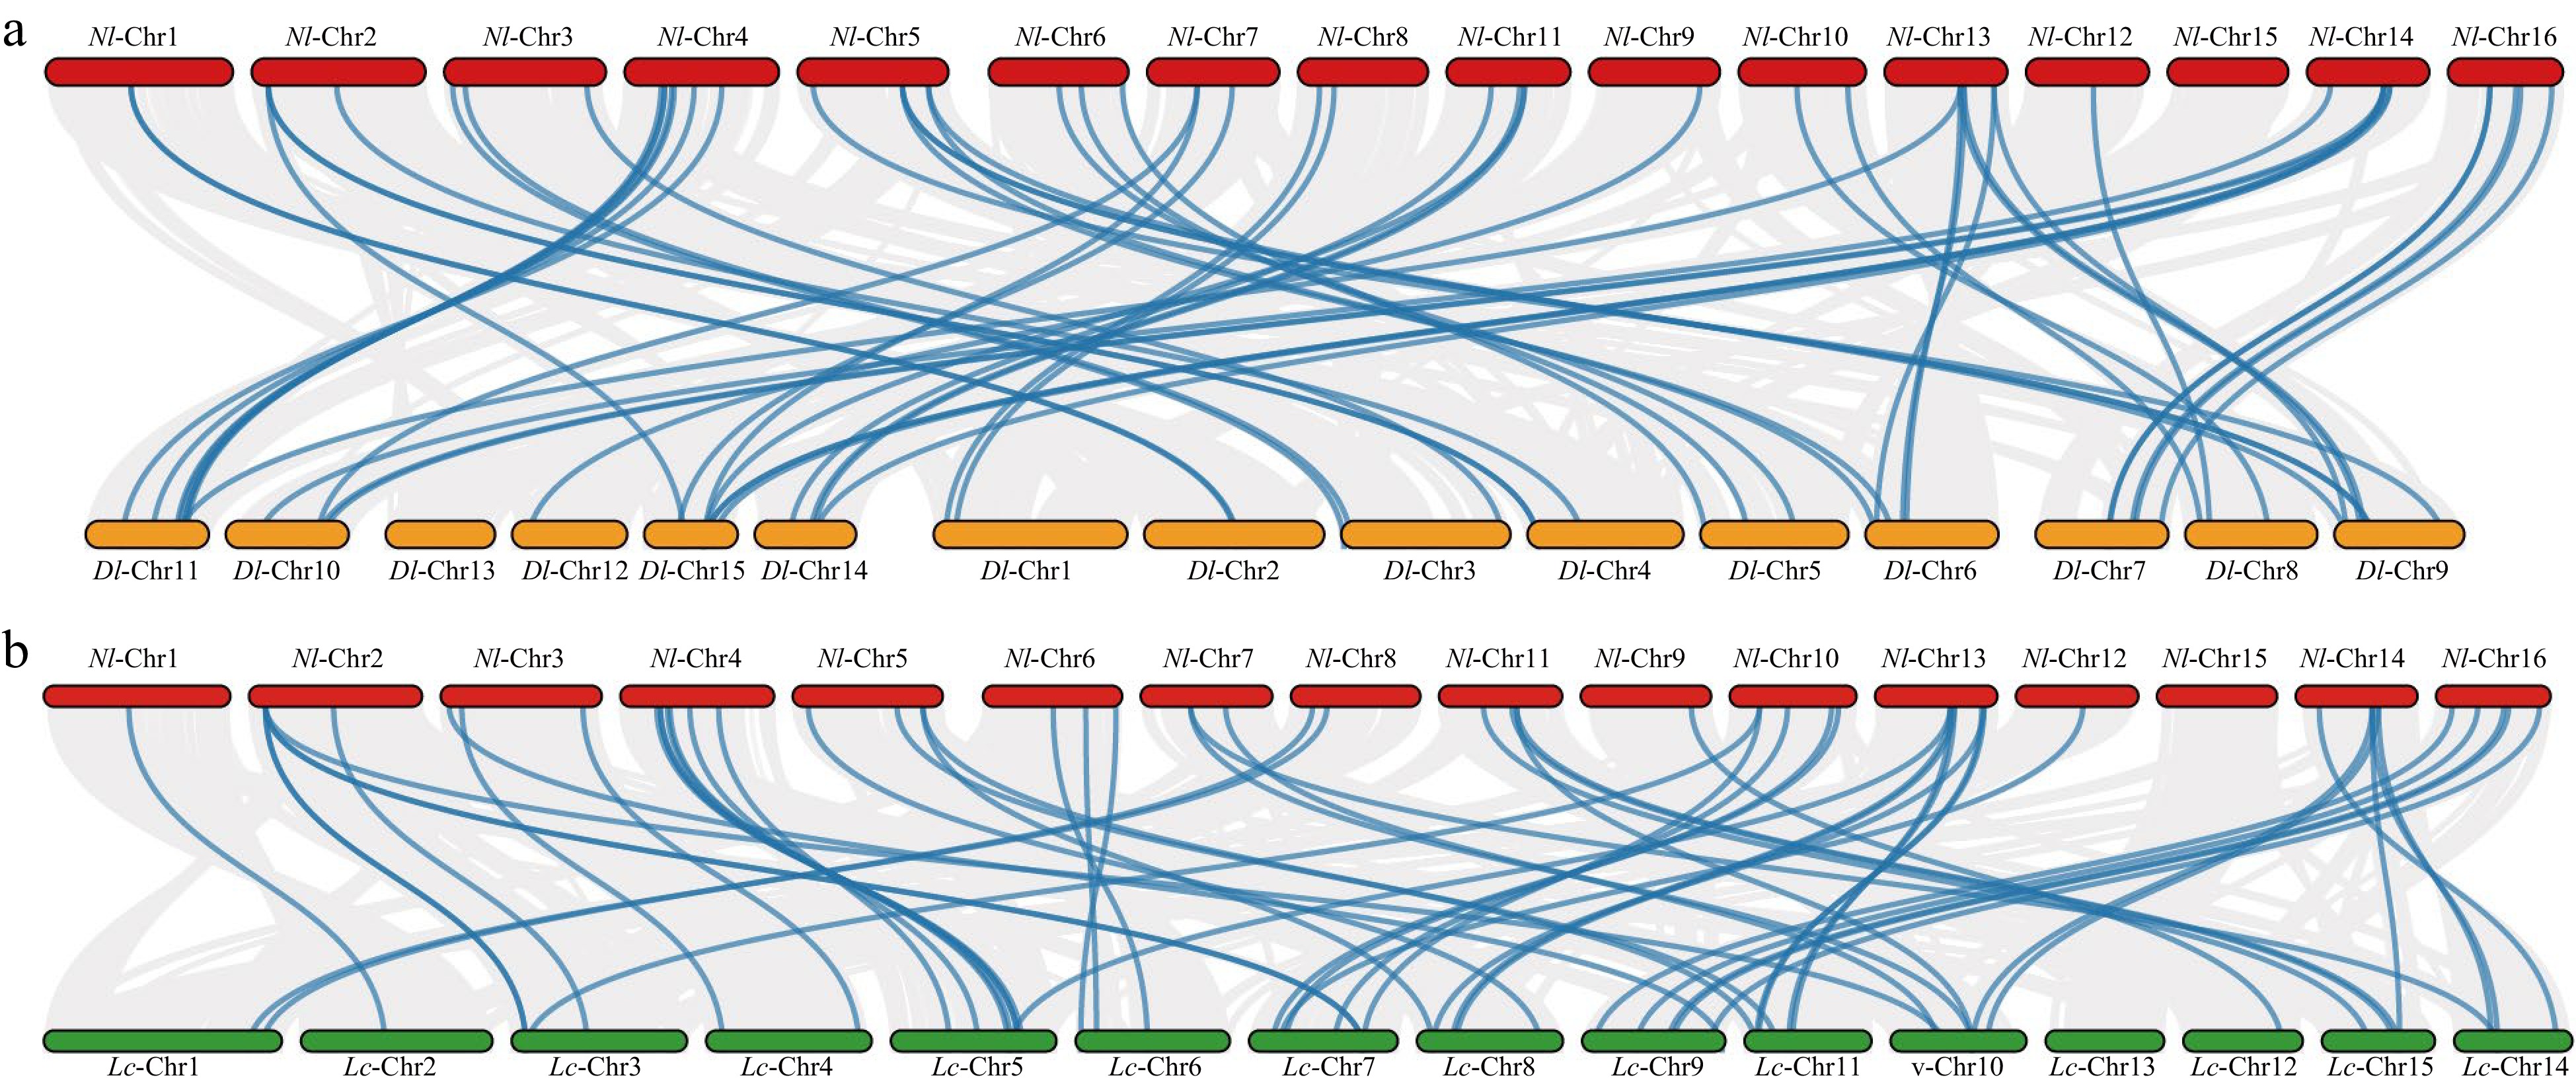
Figure 5.
(a) Synteny analysis of MADS-box family between rambutan and logan. (b) Synteny analysis of MADS-box family between rambutan and lychee. The blue lines connect homologous genes and the gray lines indicate all synteny blocks. The red, yellow and green colors represent the chromosomes of rambutan, logan and lychee, respectively.
-
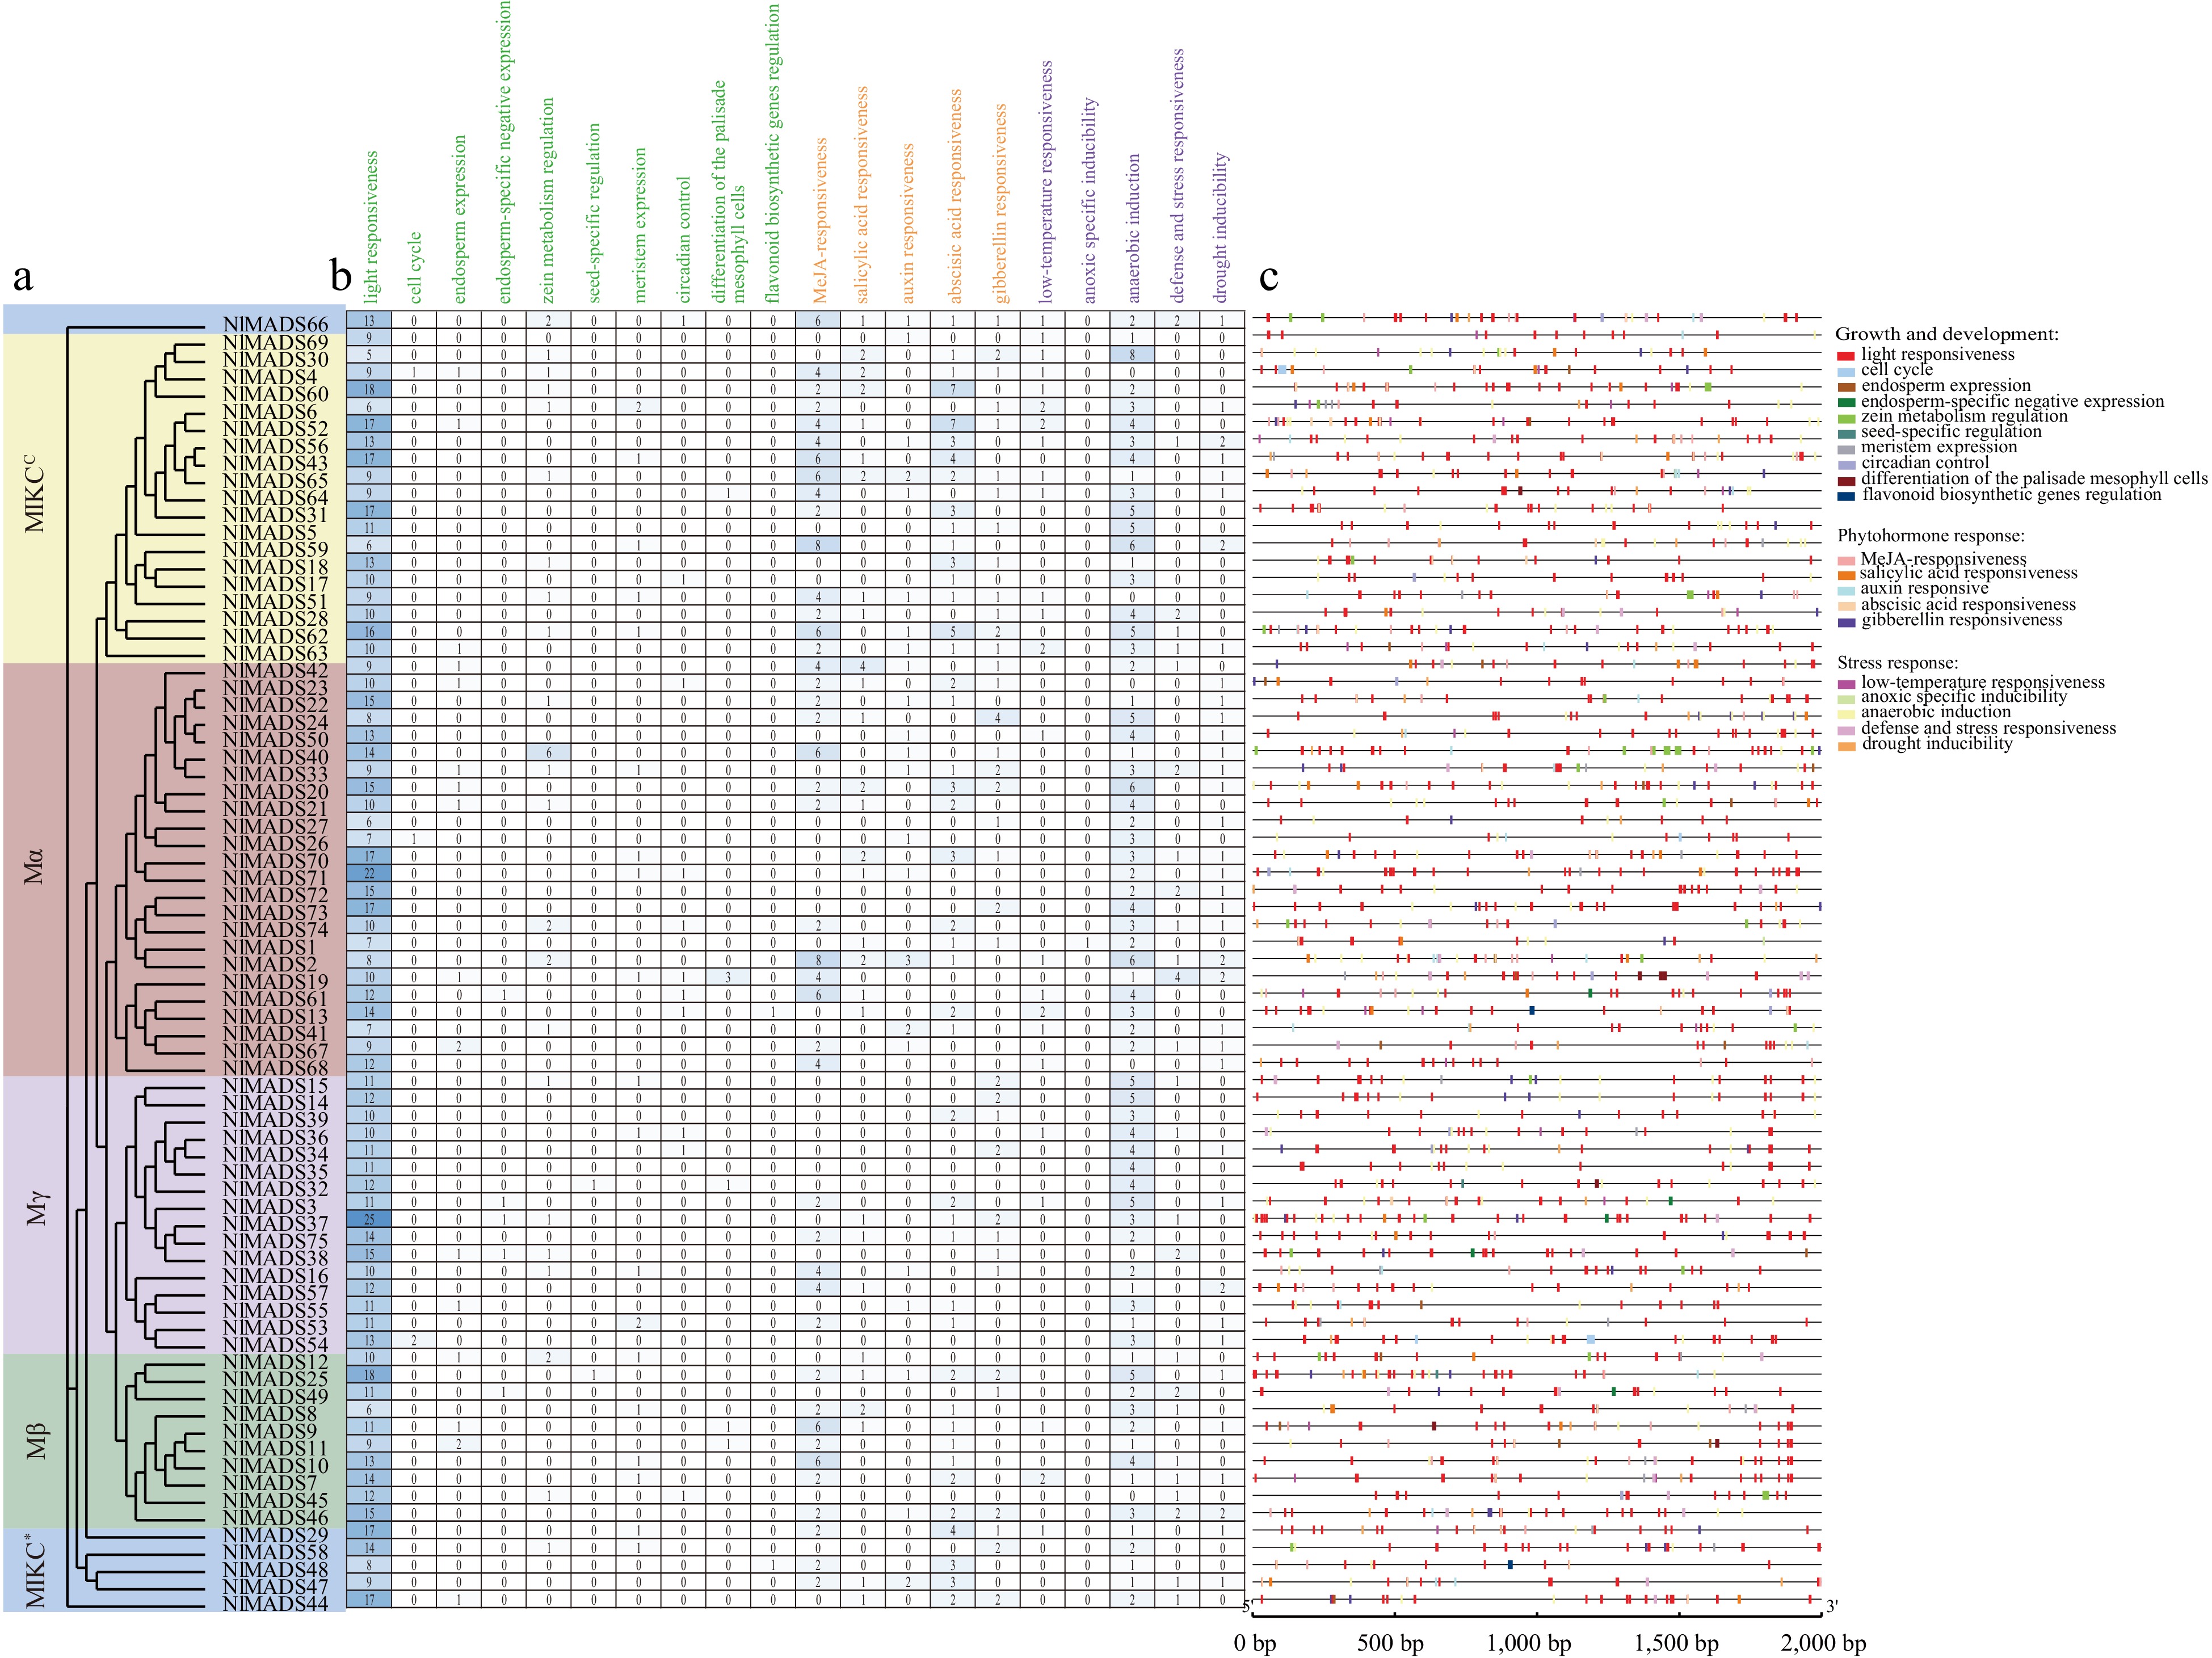
Figure 6.
Cis-elements analysis in rambutan promoters. (a) Phylogenetic relationships. (b) The number of cis-elements. (c) The distribution of cis-elements of promoter sequences (2,000 bp) of NlMADS genes.
-
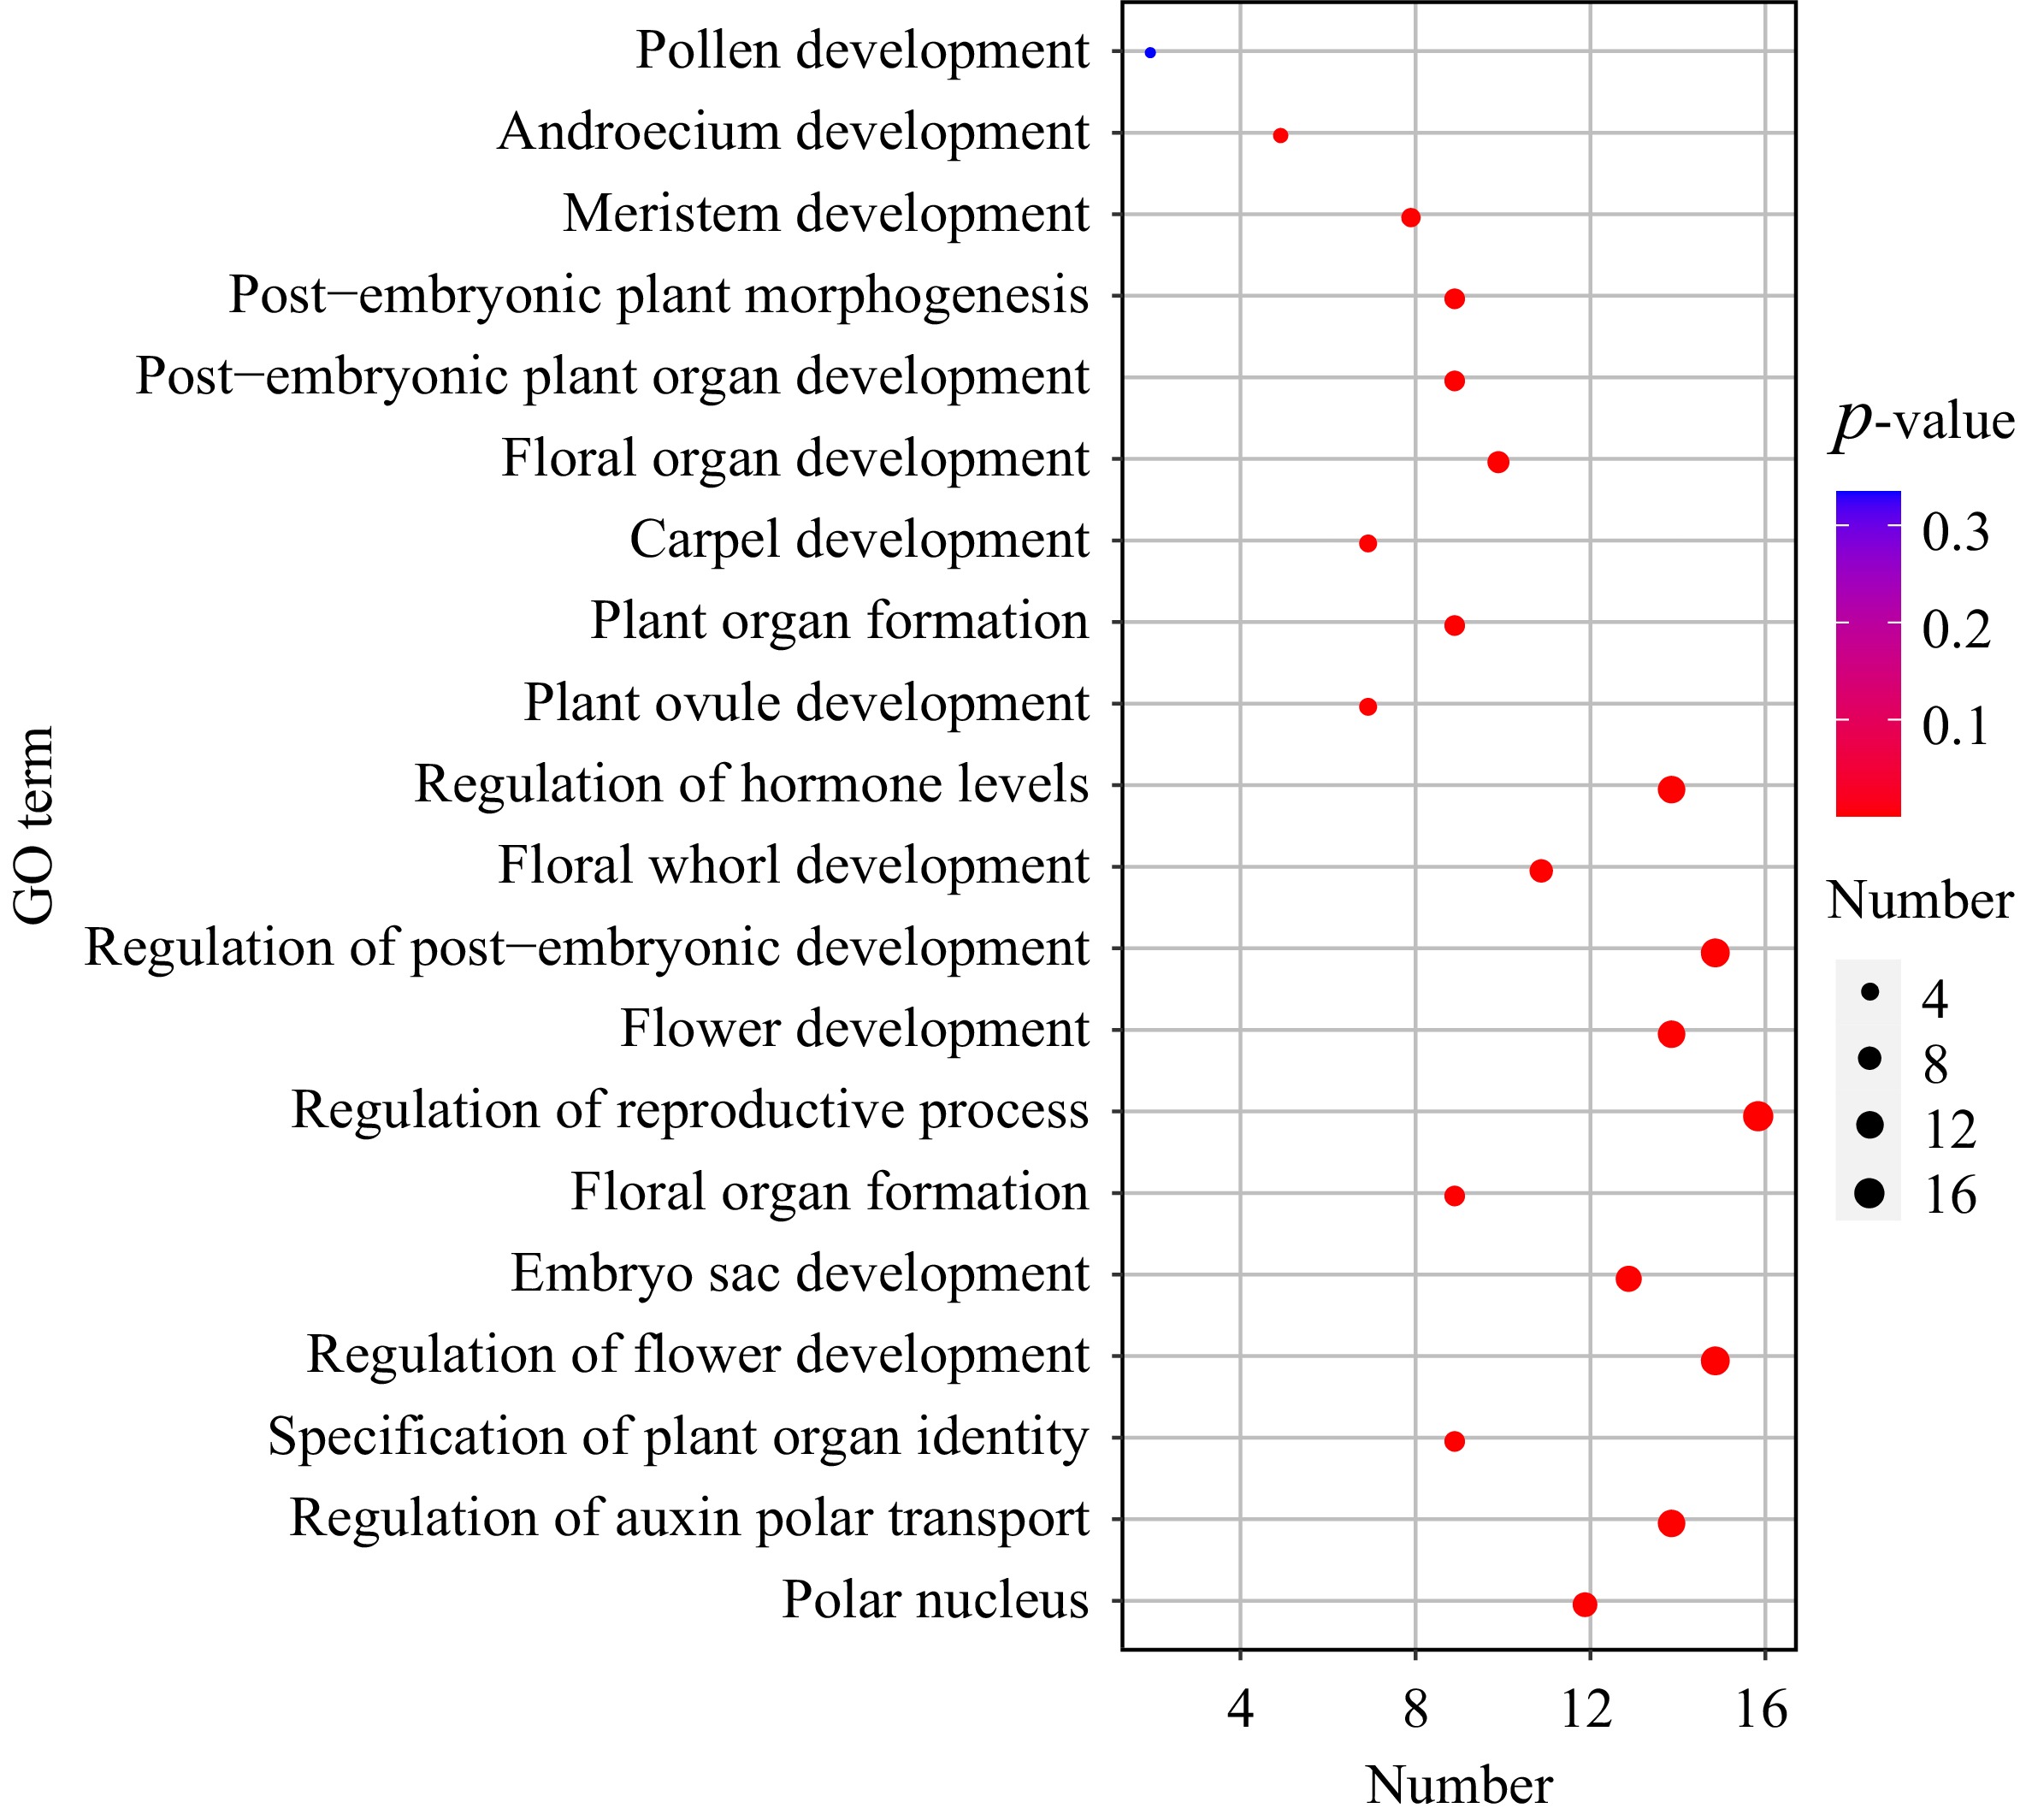
Figure 7.
GO enrichment analysis of NlMADS genes in rambutan.
-
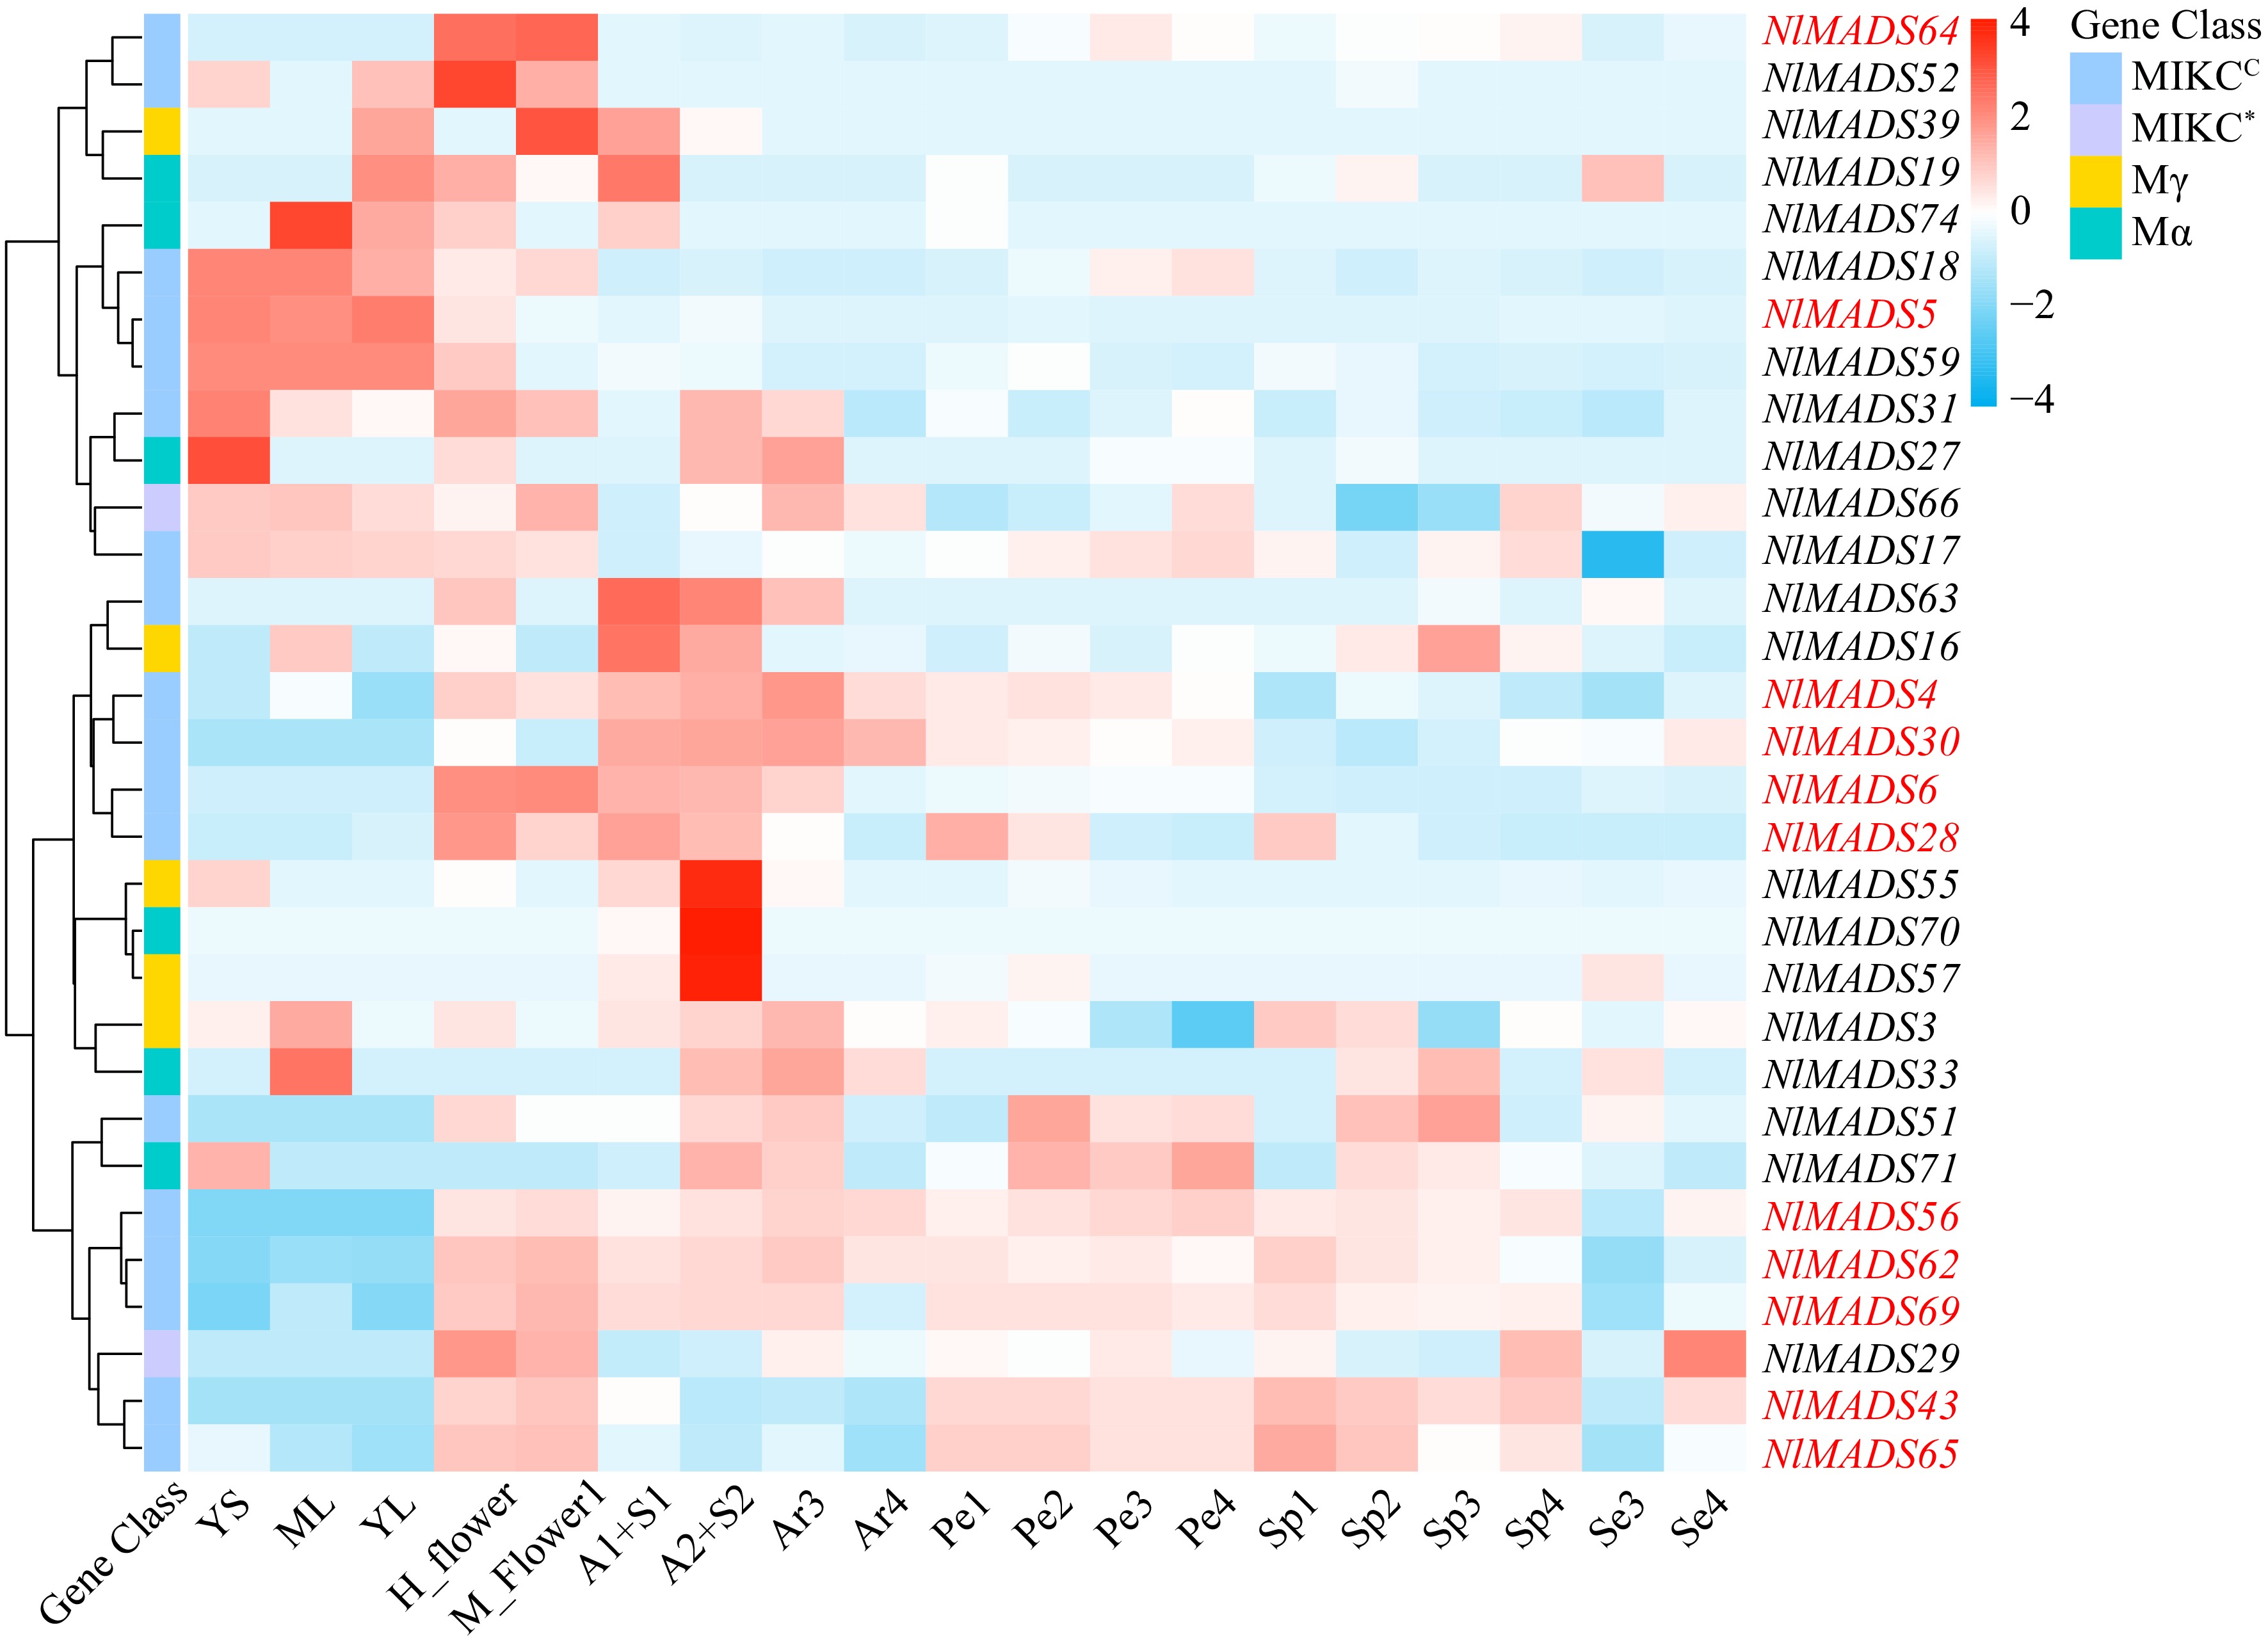
Figure 8.
The expression profile of NlMADS genes. Thirty one genes (FPKM > 3) were selected for expression visualization. Red-marked genes (FPKM > 100) are expressed at higher levels at some stages. YS, ML, YL, H_flower and M_flower represented young stems, mature leaves, young leaves, hermaphroditic flowers, male flowers respectively. A1+S1 represented the sample mixed with aril stage1 and seed stage1, and A2+S2 indicated the sample mixed with aril stage 2 and seed stage 2. Se3 and Se4 represented seed development. Ar3 and Ar4 indicated the development of the aril from thin to thick. Pe1, Pe2, Pe3, and Pe4 represented pericarp development, and Sp1, Sp2, Sp3, and Sp4, represented spine development.
-
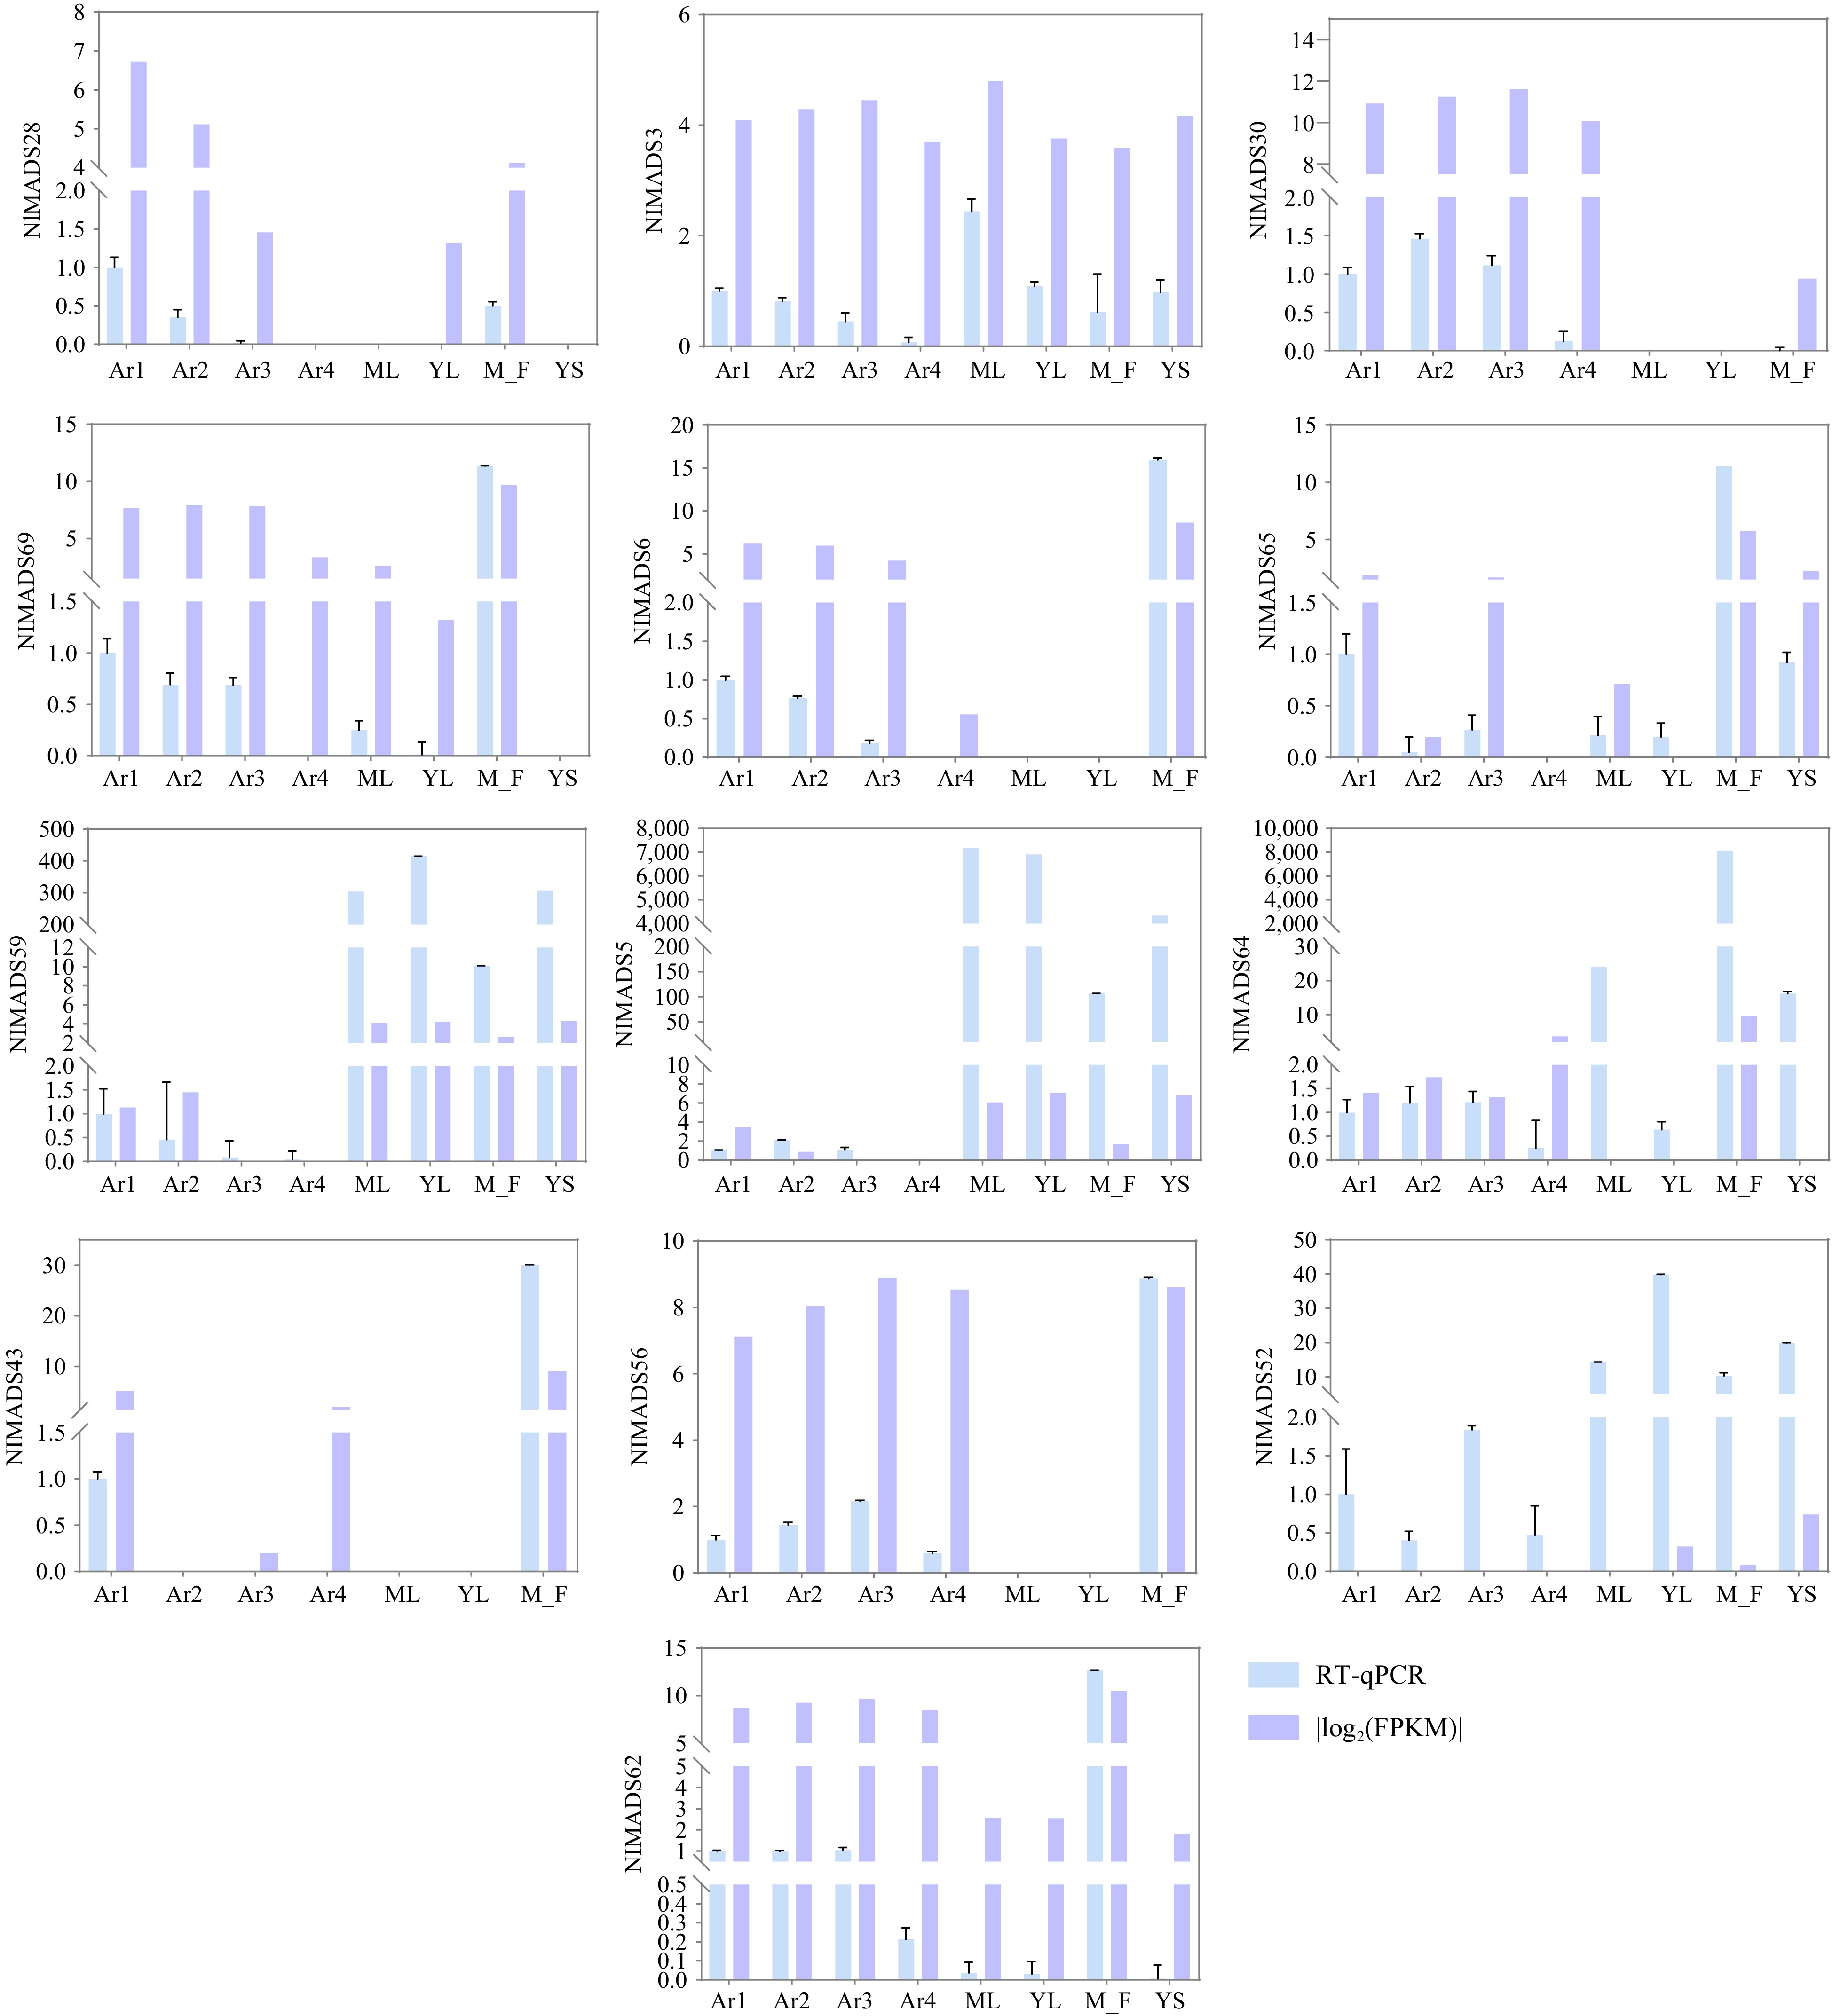
Figure 9.
Relative expression levels of NlMADS genes by RT-qPCR. Blue rectangles represent relative expression from RT-qPCR. Purple rectangles were |log2(FPKM)|.
-
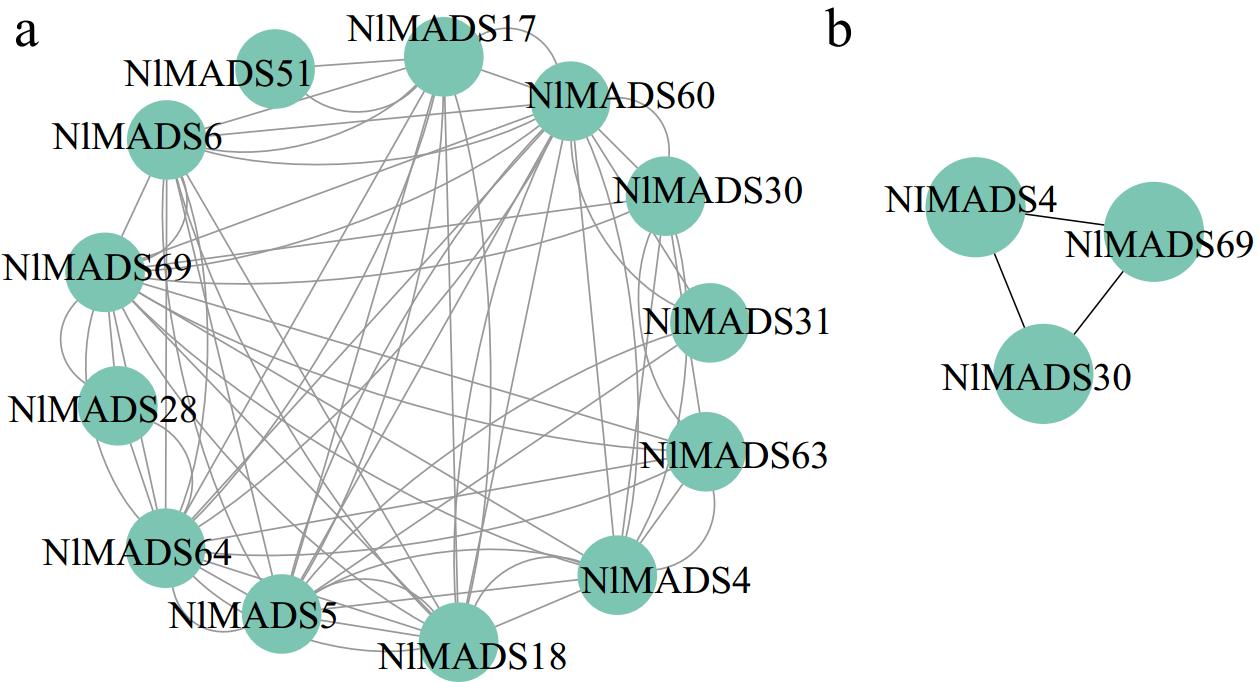
Figure 10.
Protein–protein interaction network of NlMADS MIKCC-type proteins based on their orthologs in A. thaliana.
Figures
(10)
Tables
(0)