-
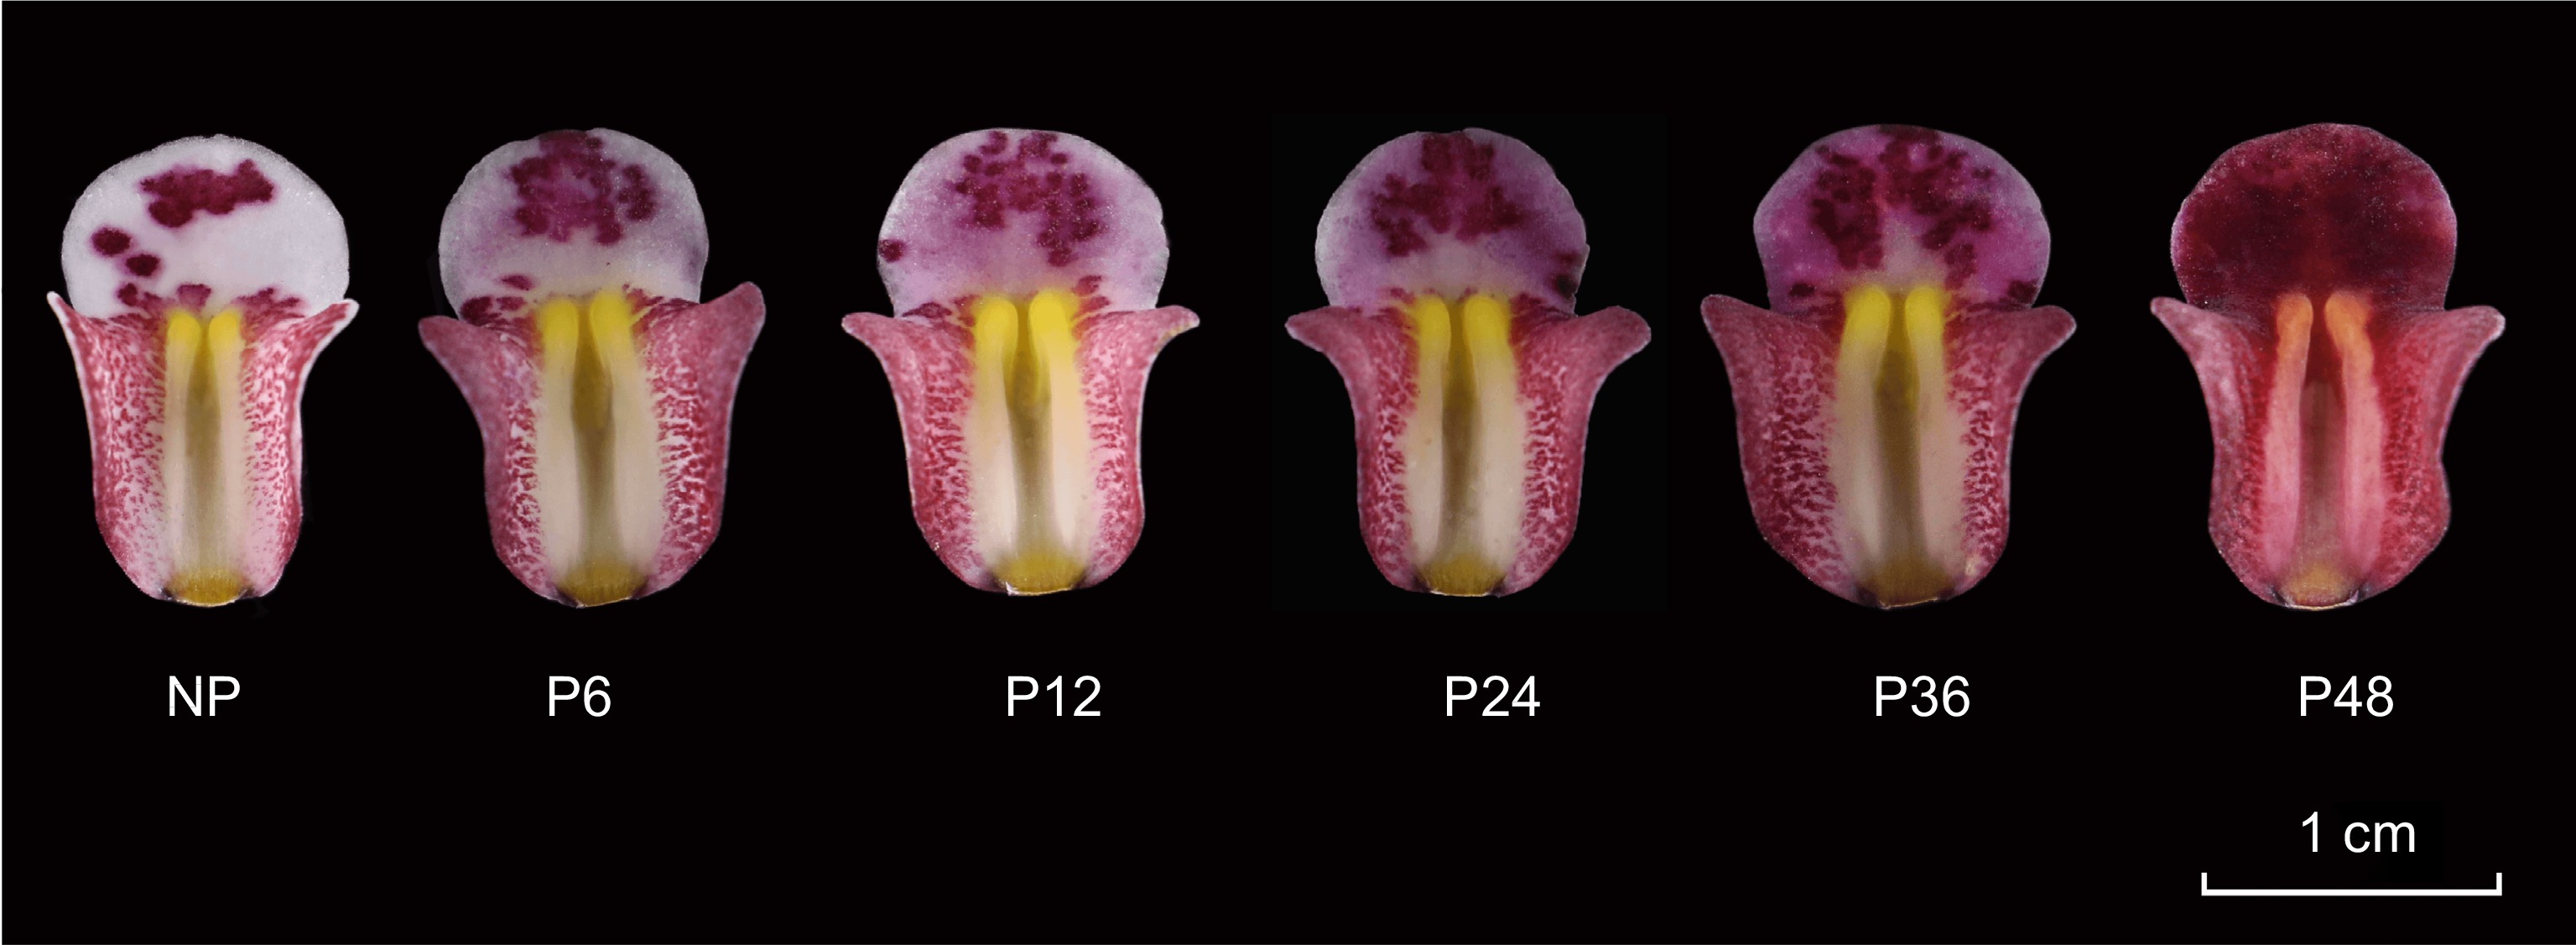
Figure 1.
Color change process of Cymbidium floribundum lip before and after pollination. NP, before pollination. P6, 6 h after pollination. P12, 12 h after pollination. P24, 24 h after pollination. P36, 36 h after pollination. P48, 48 h after pollination.
-
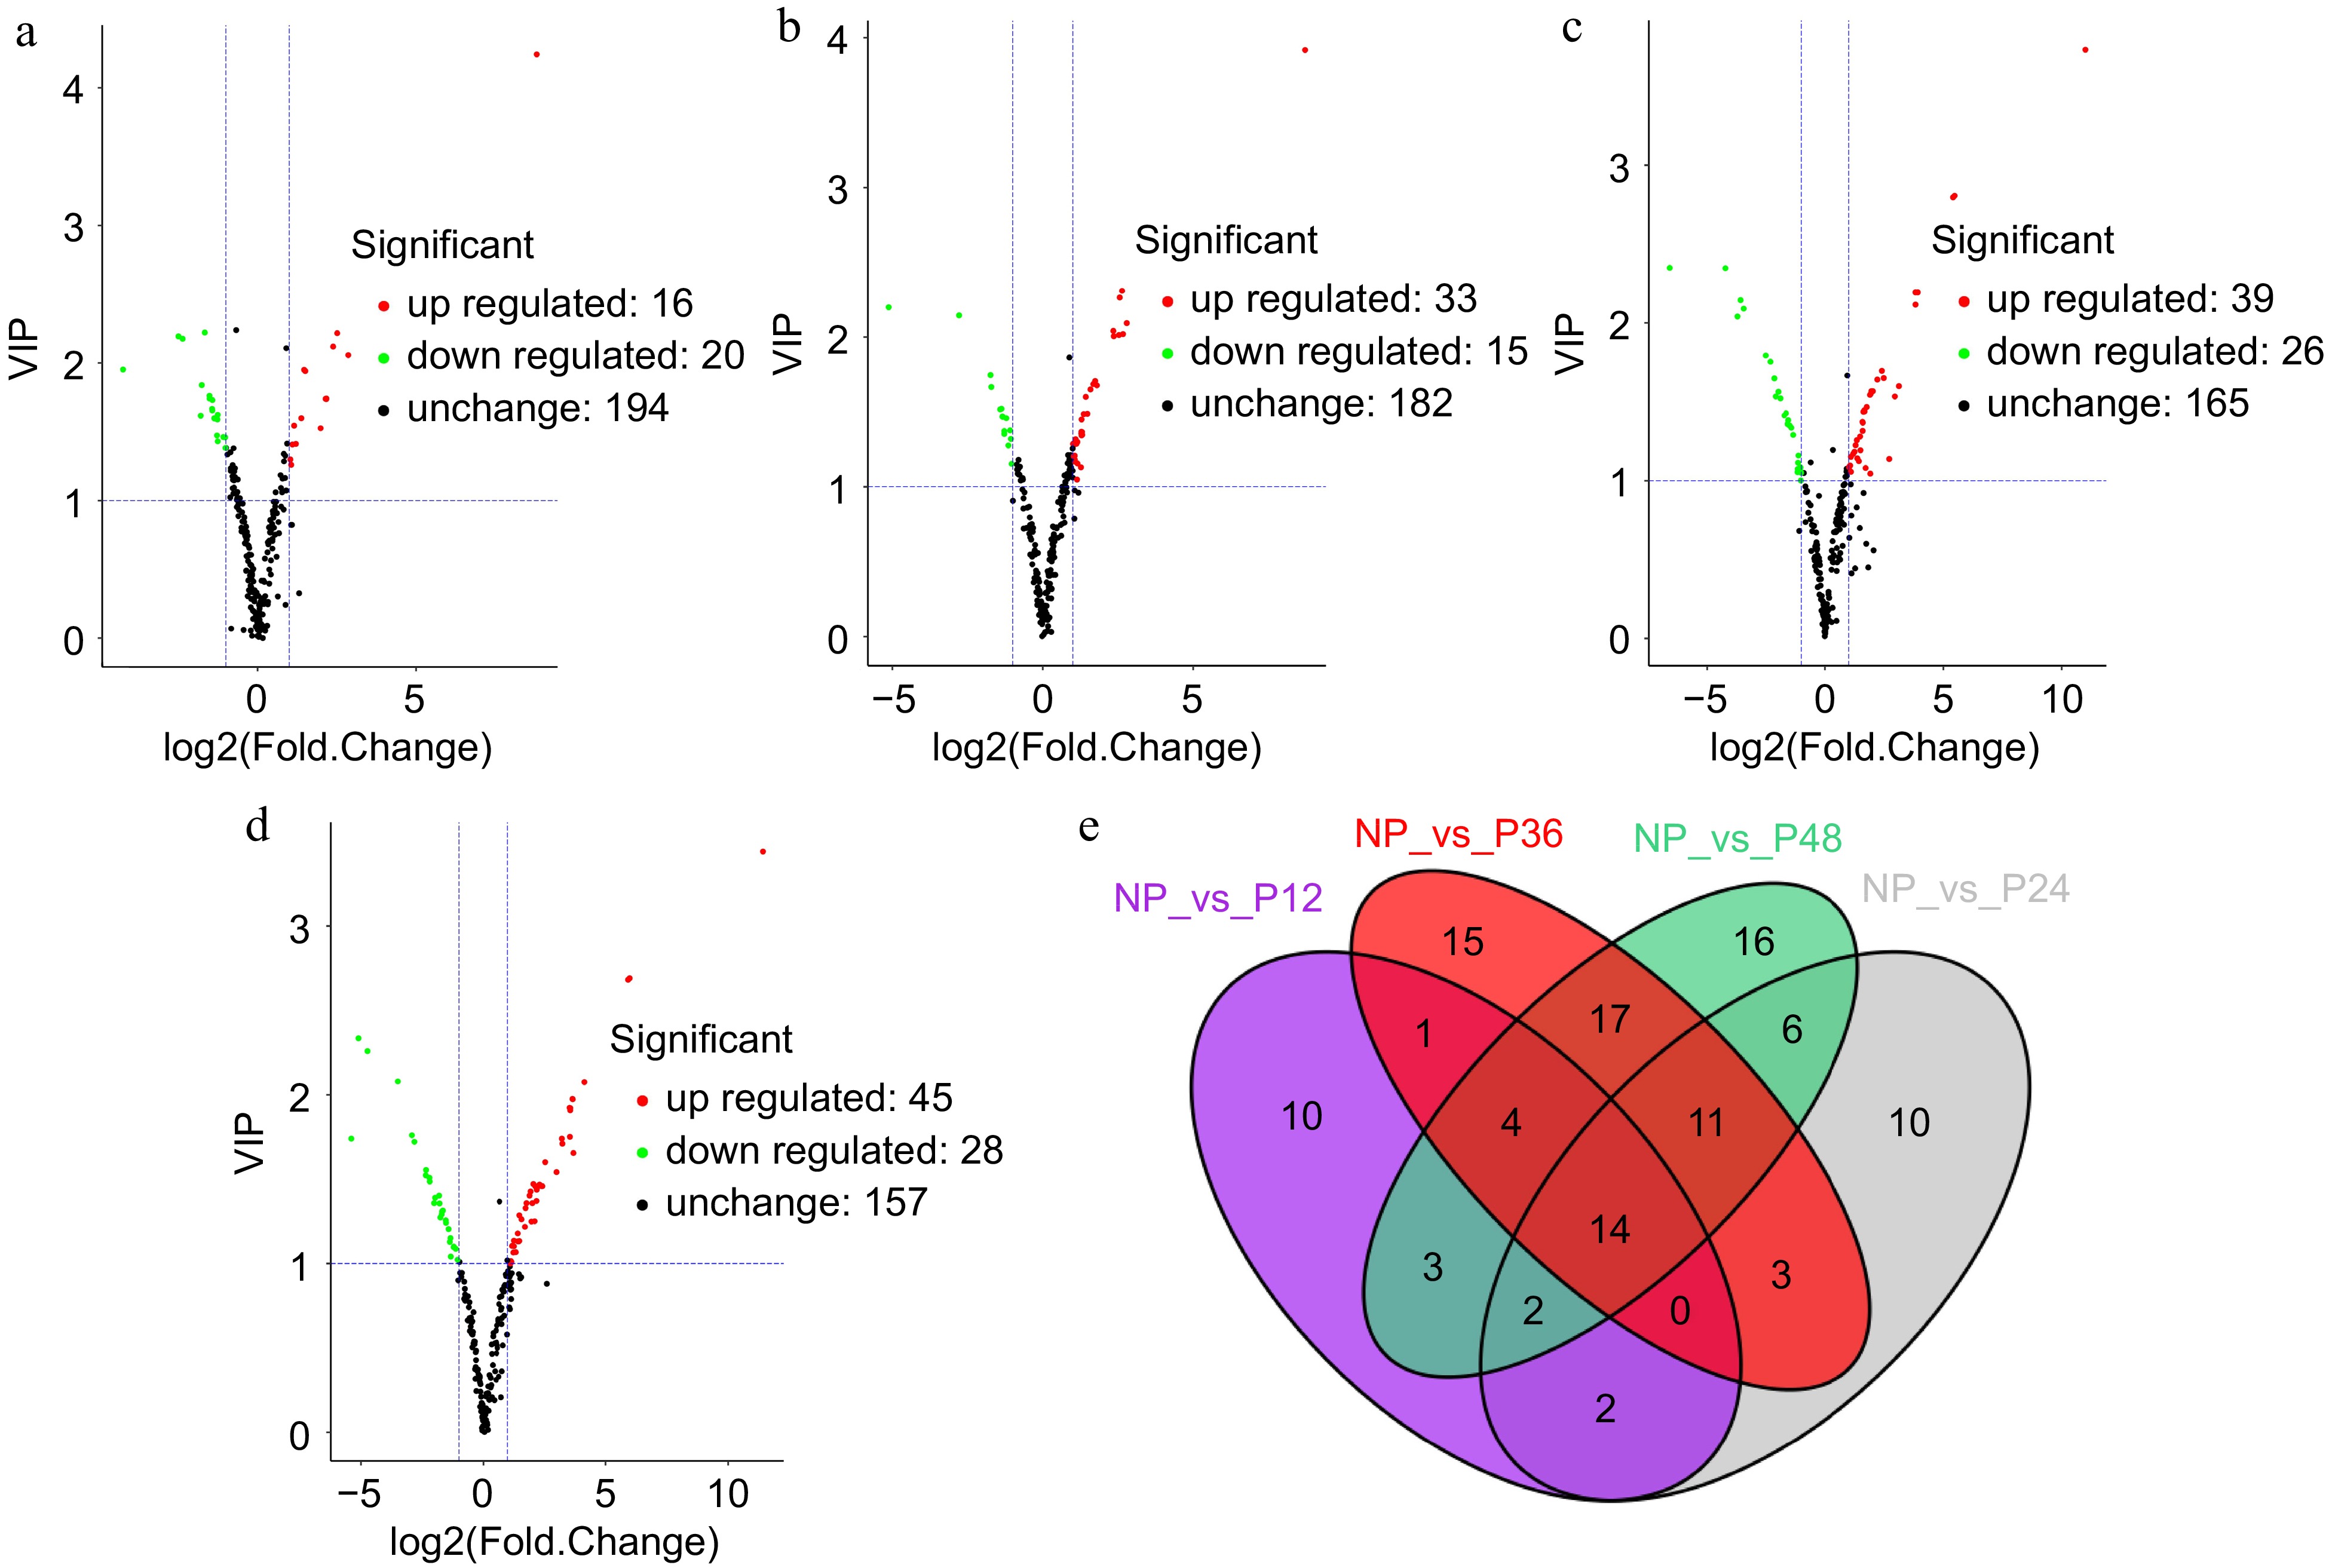
Figure 2.
Volcano plot and venn diagram of different metabolites. (a) NP and P12, (b) NP and P24, (c) NP and P36, and (d) NP and P48. (e) Venn diagram showing the shared and specific metabolites between the four compared groups.
-
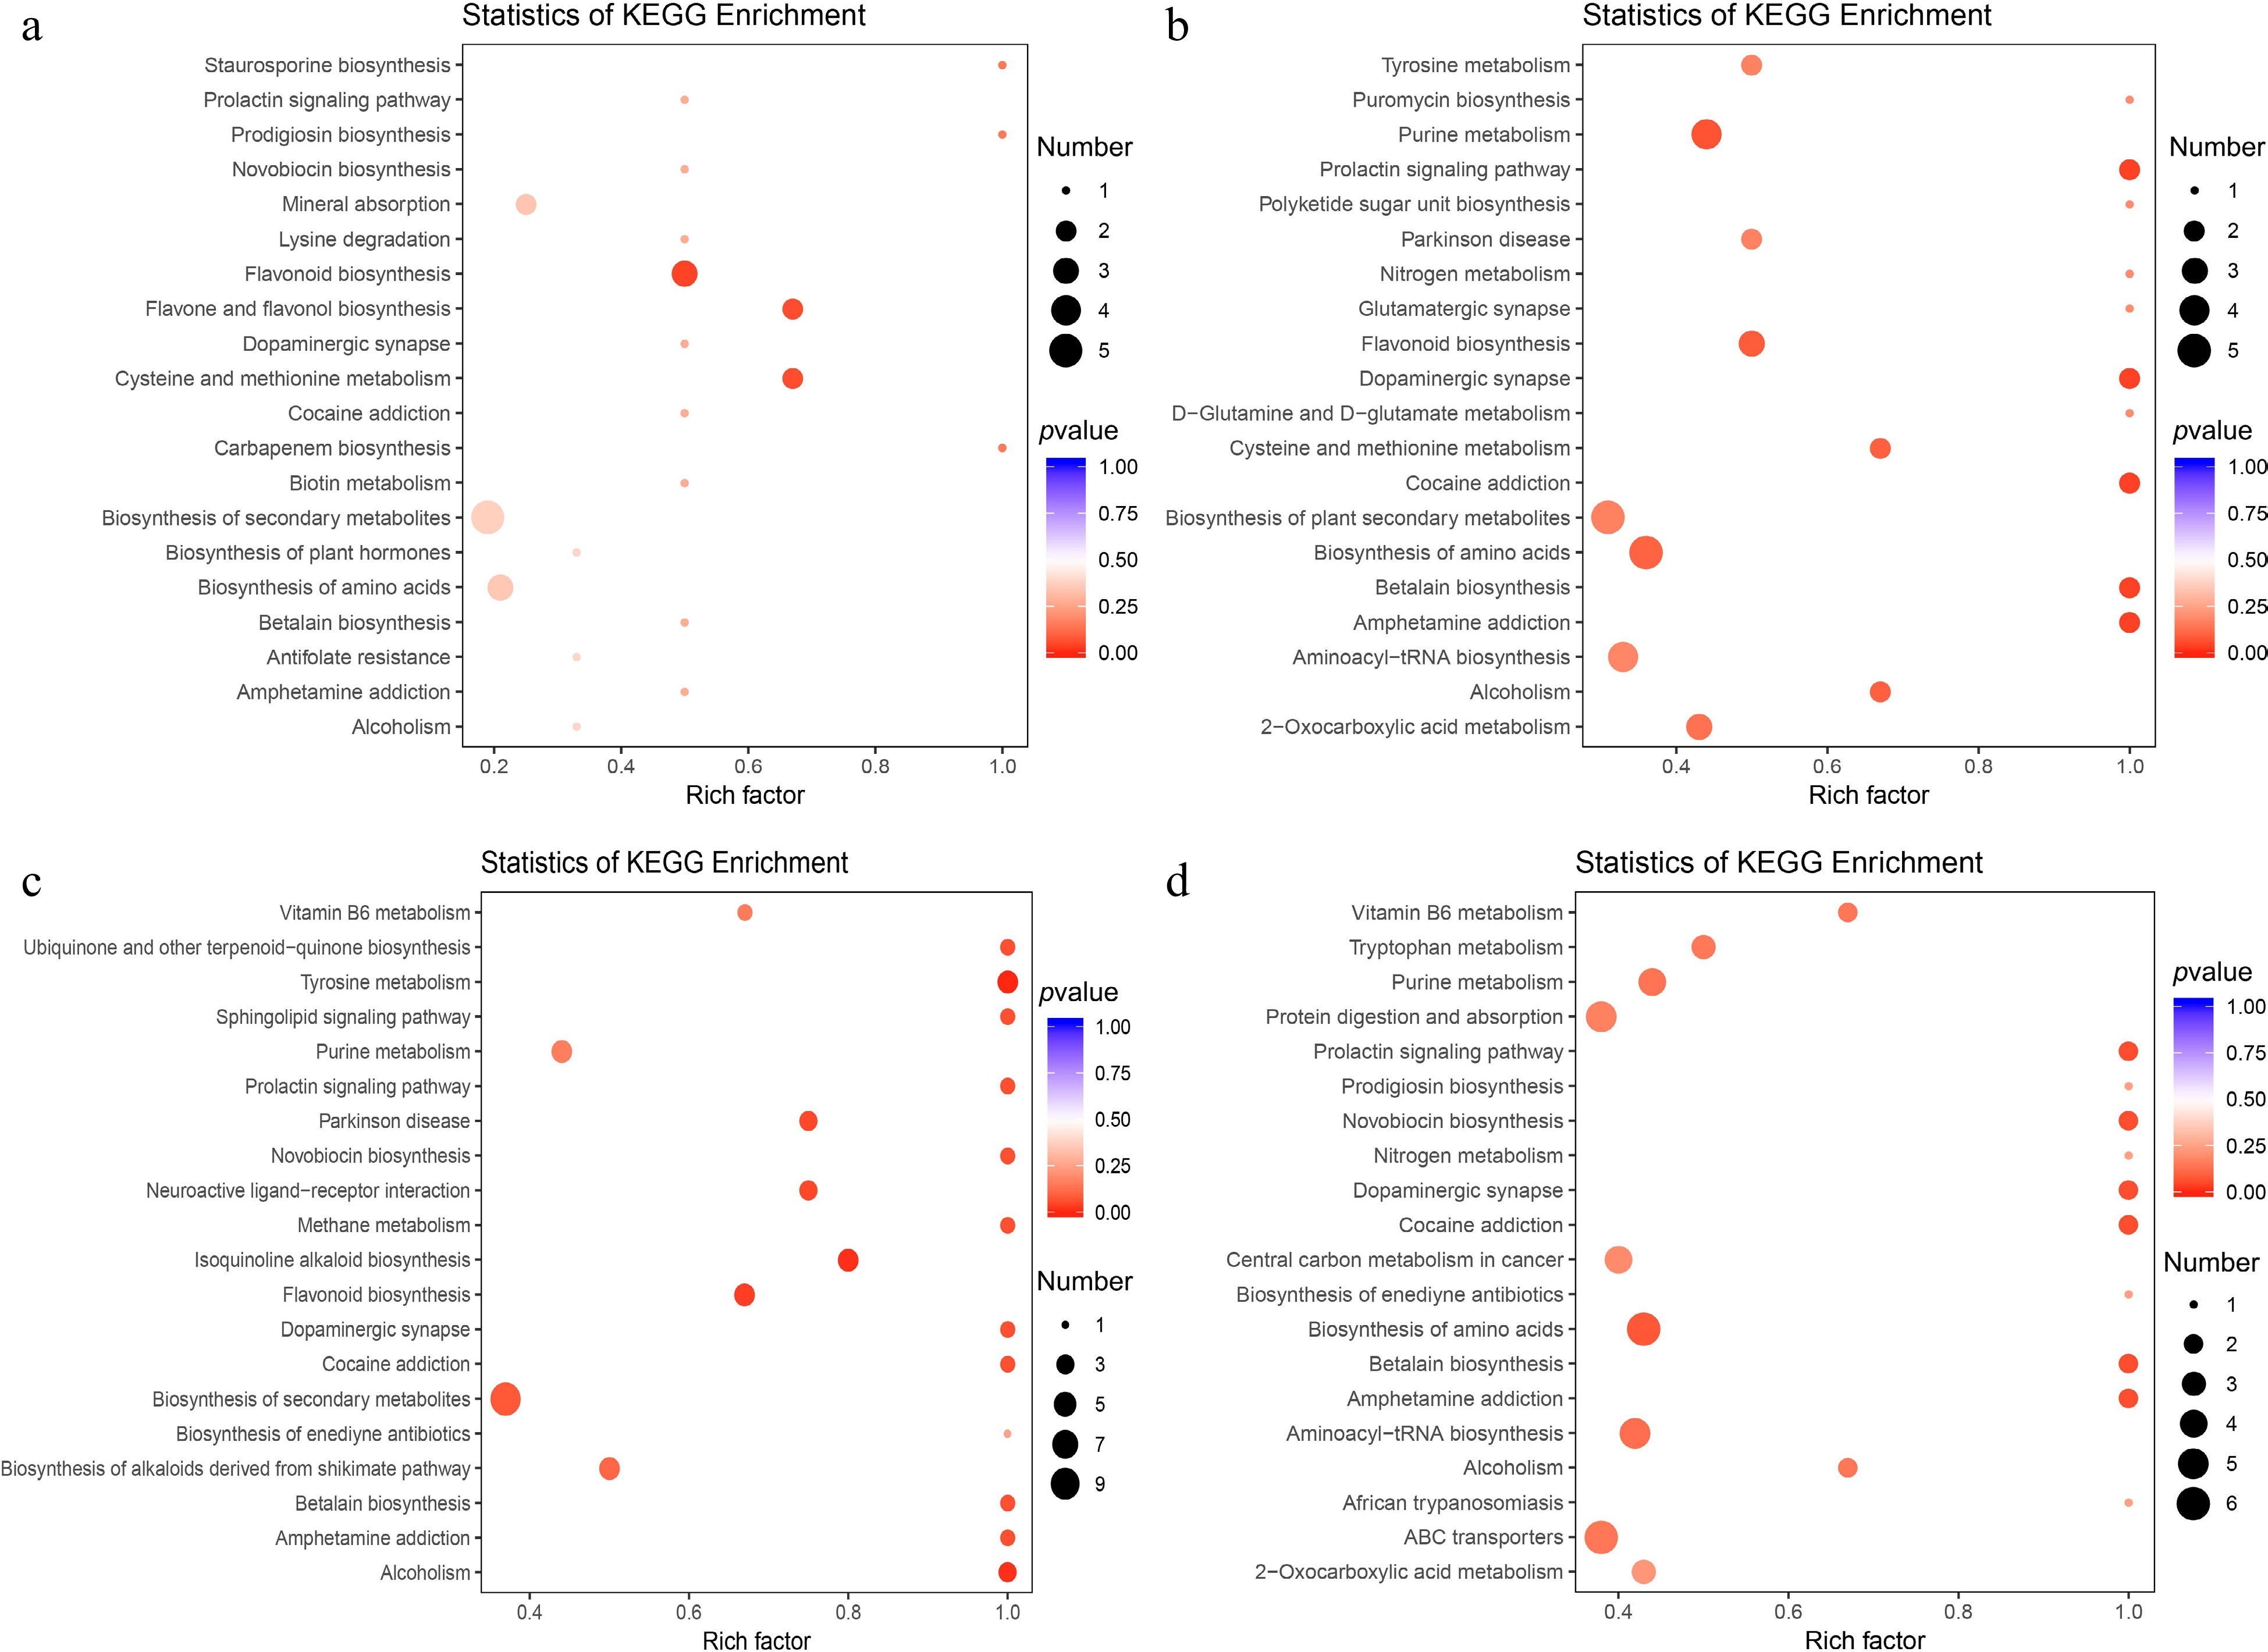
Figure 3.
KEGG pathway enrichment analysis of the differential metabolites between: (a) NP and P12, (b) NP and P24, (c) NP and P36, and (d) NP and P48.
-
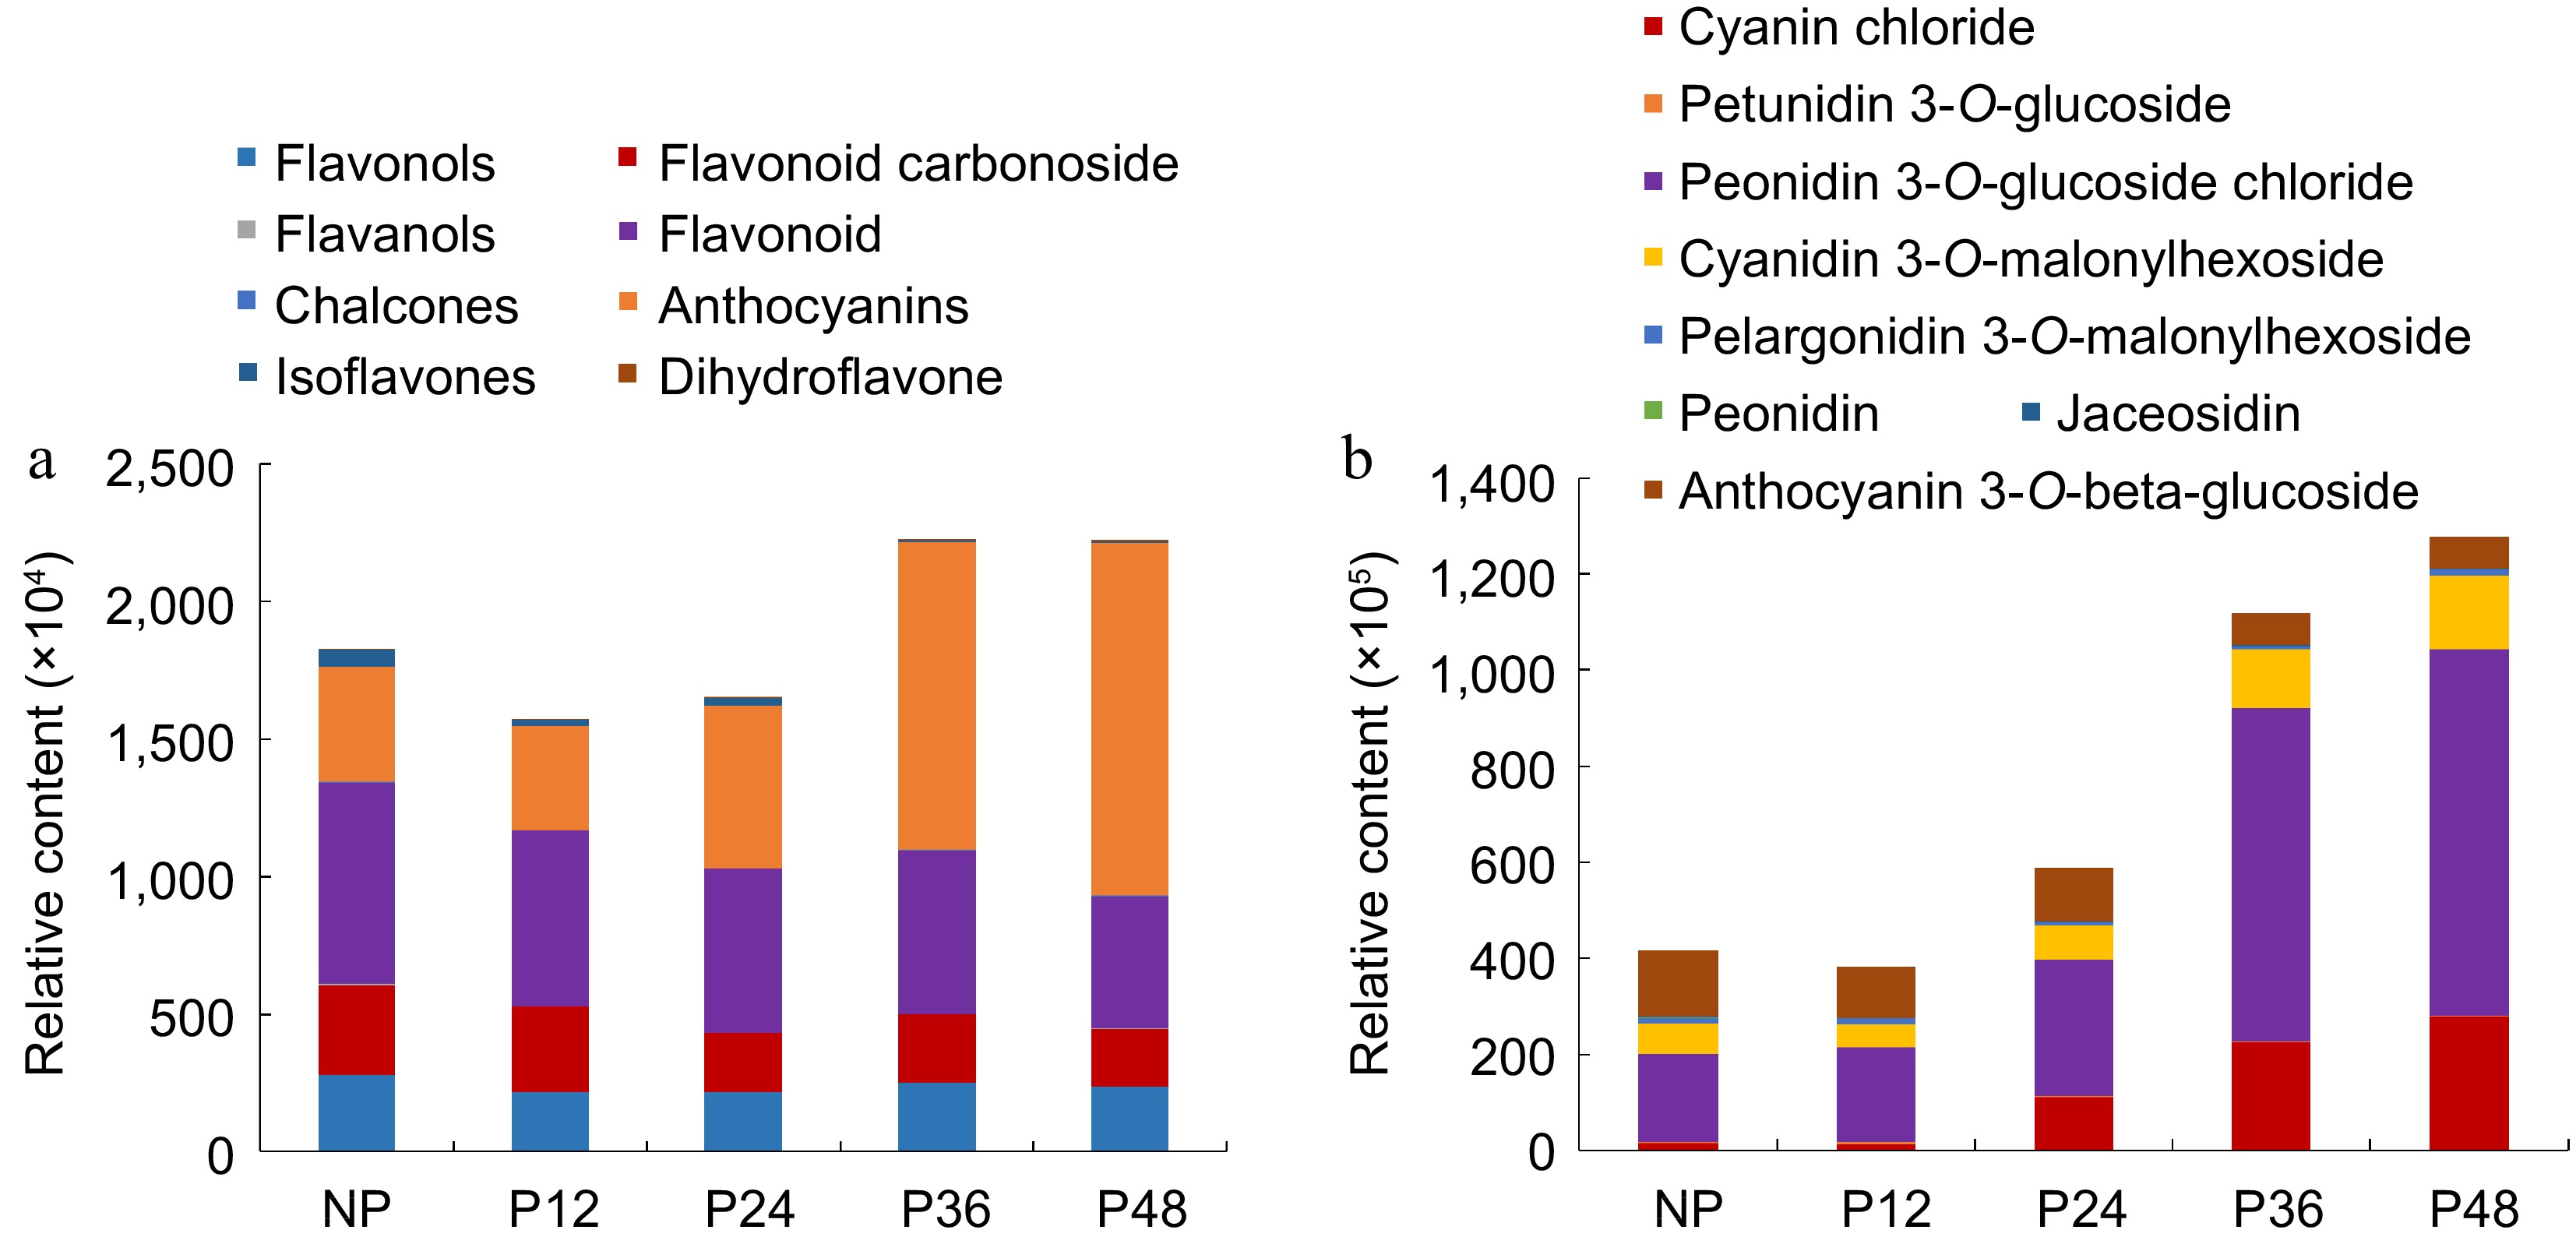
Figure 4.
The relative content of flavonoids and anthocyanins in the lips at various stages. (a) Eight kinds of flavonoids. (b) Eight kinds of anthocyanins.
-
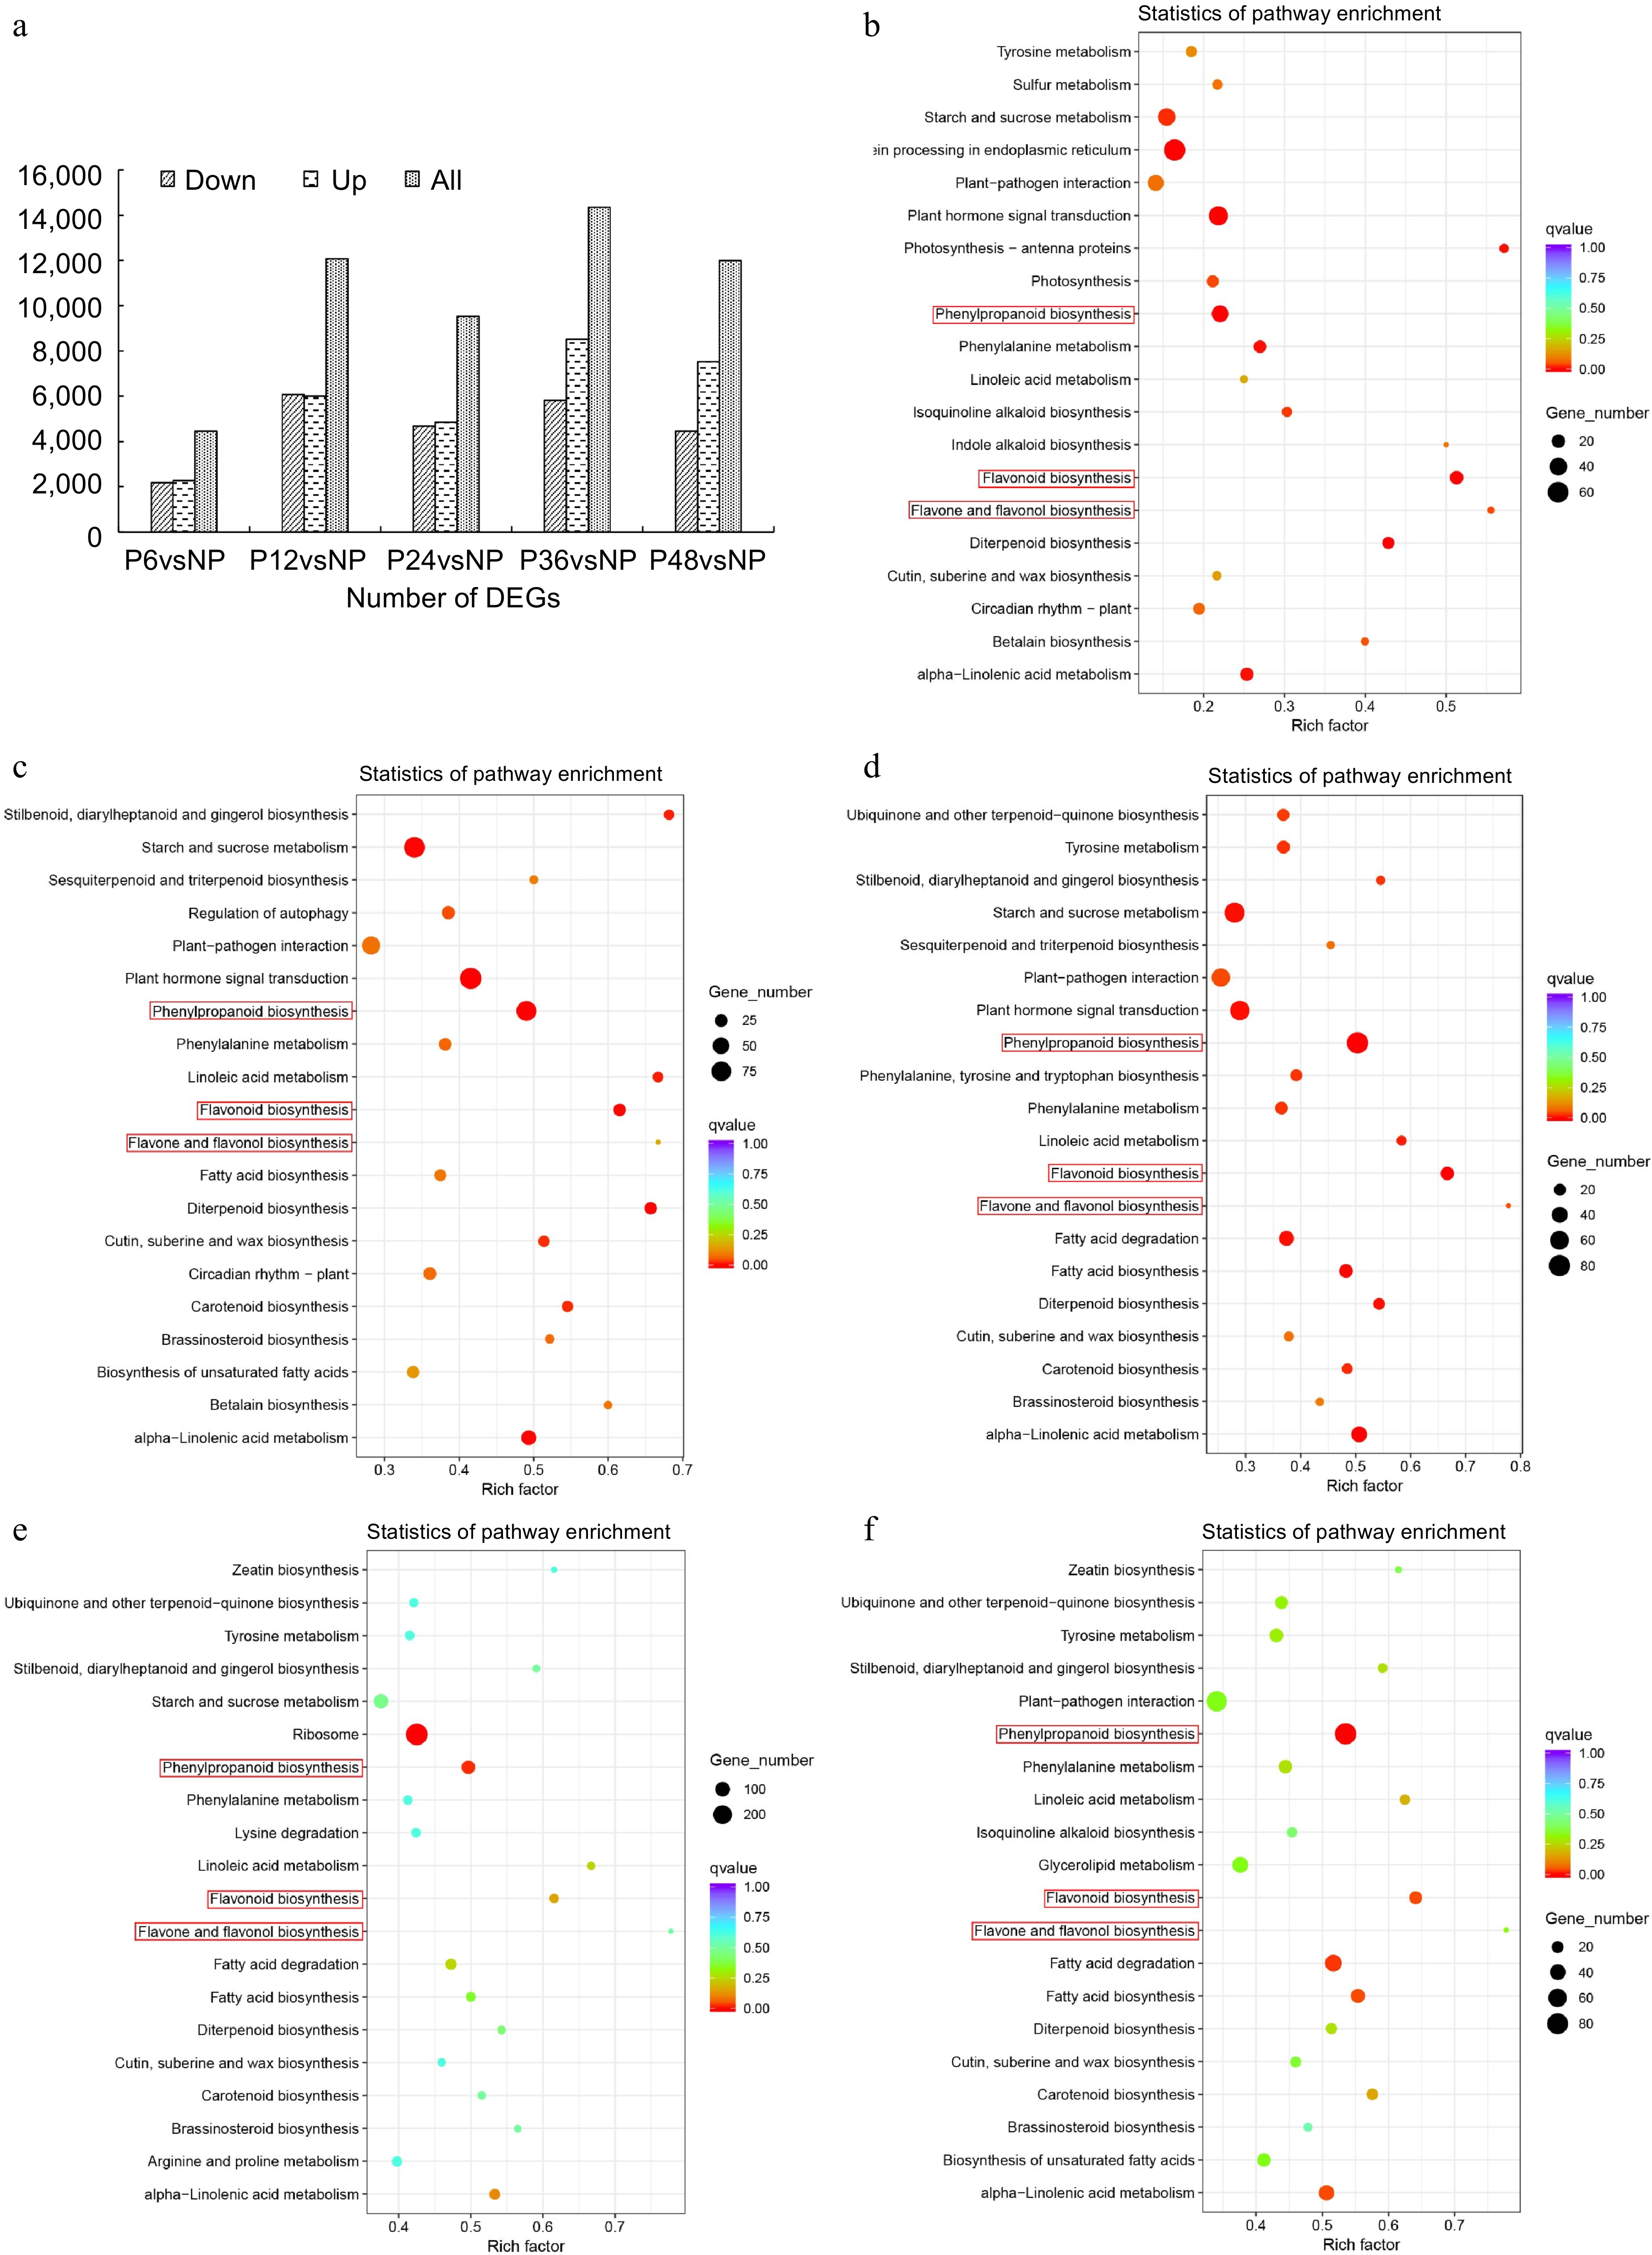
Figure 5.
Transcriptome analysis of lips before and after pollination in C. floribundum. (a) Number of DEGs among all comparison groups. KEGG pathway enrichment analysis of the DEGs between (b) NP and P12, (c) NP and P24, (d) NP and P36, (e) NP and P12, (f) NP and P48.
-
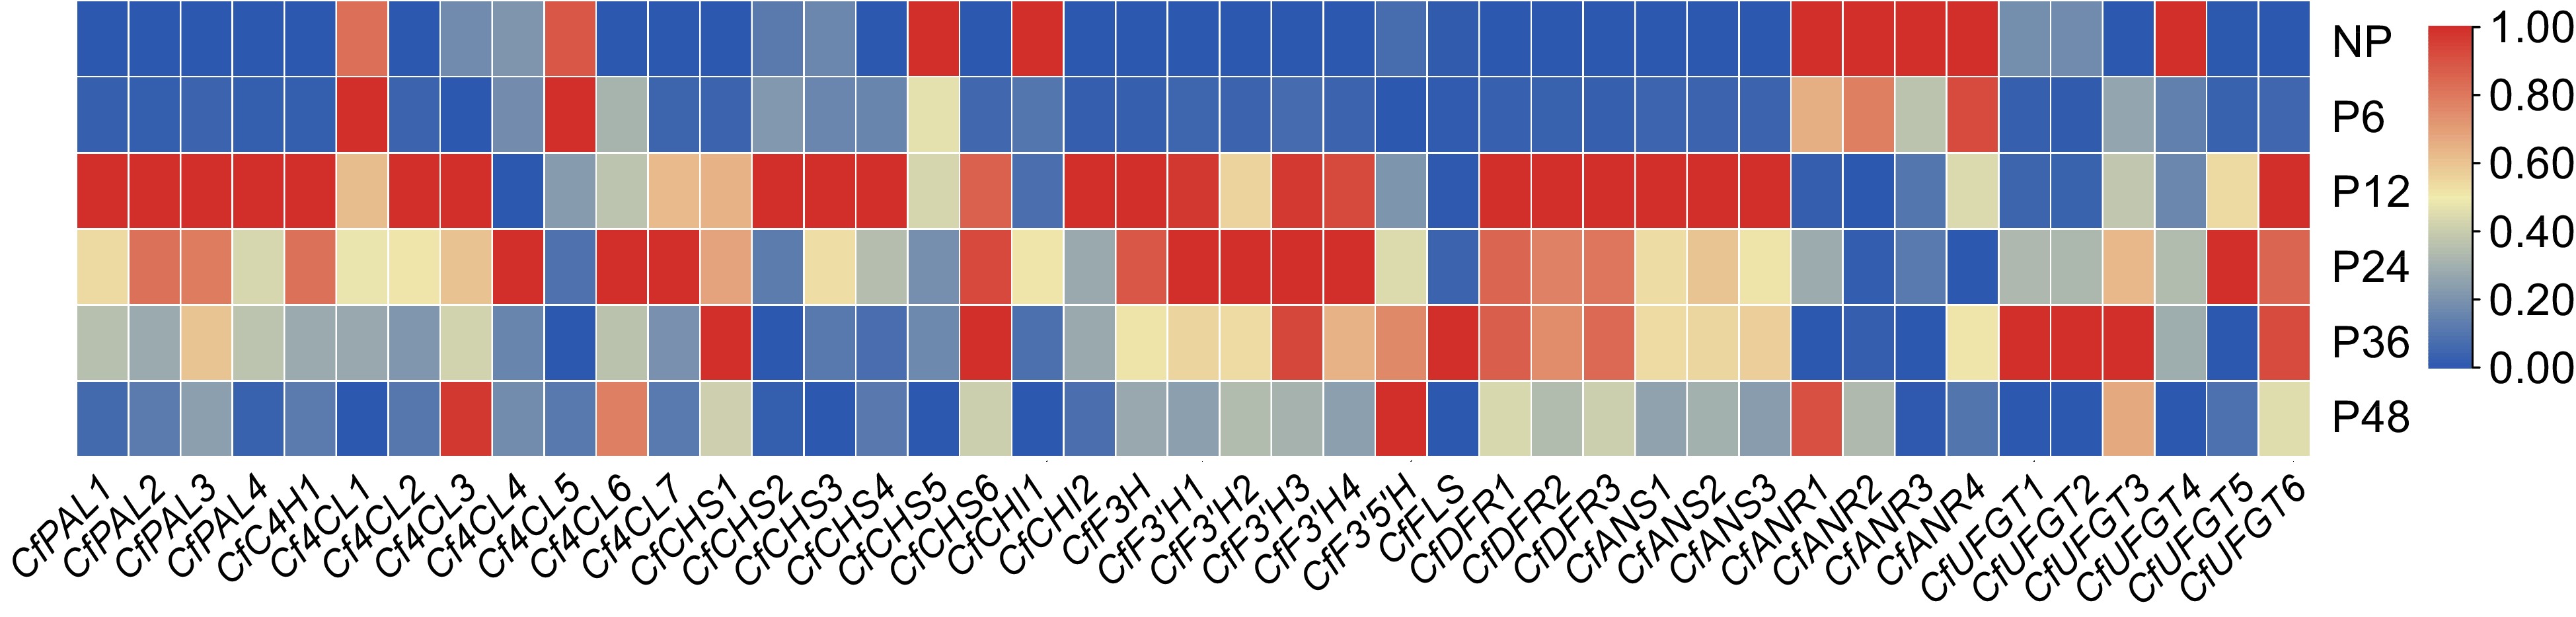
Figure 6.
Heat map of gene expression related to the anthocyanin biosynthesis pathway. A color bar is presented at the top right. Blue indicates low expression, and red indicates high expression.
-
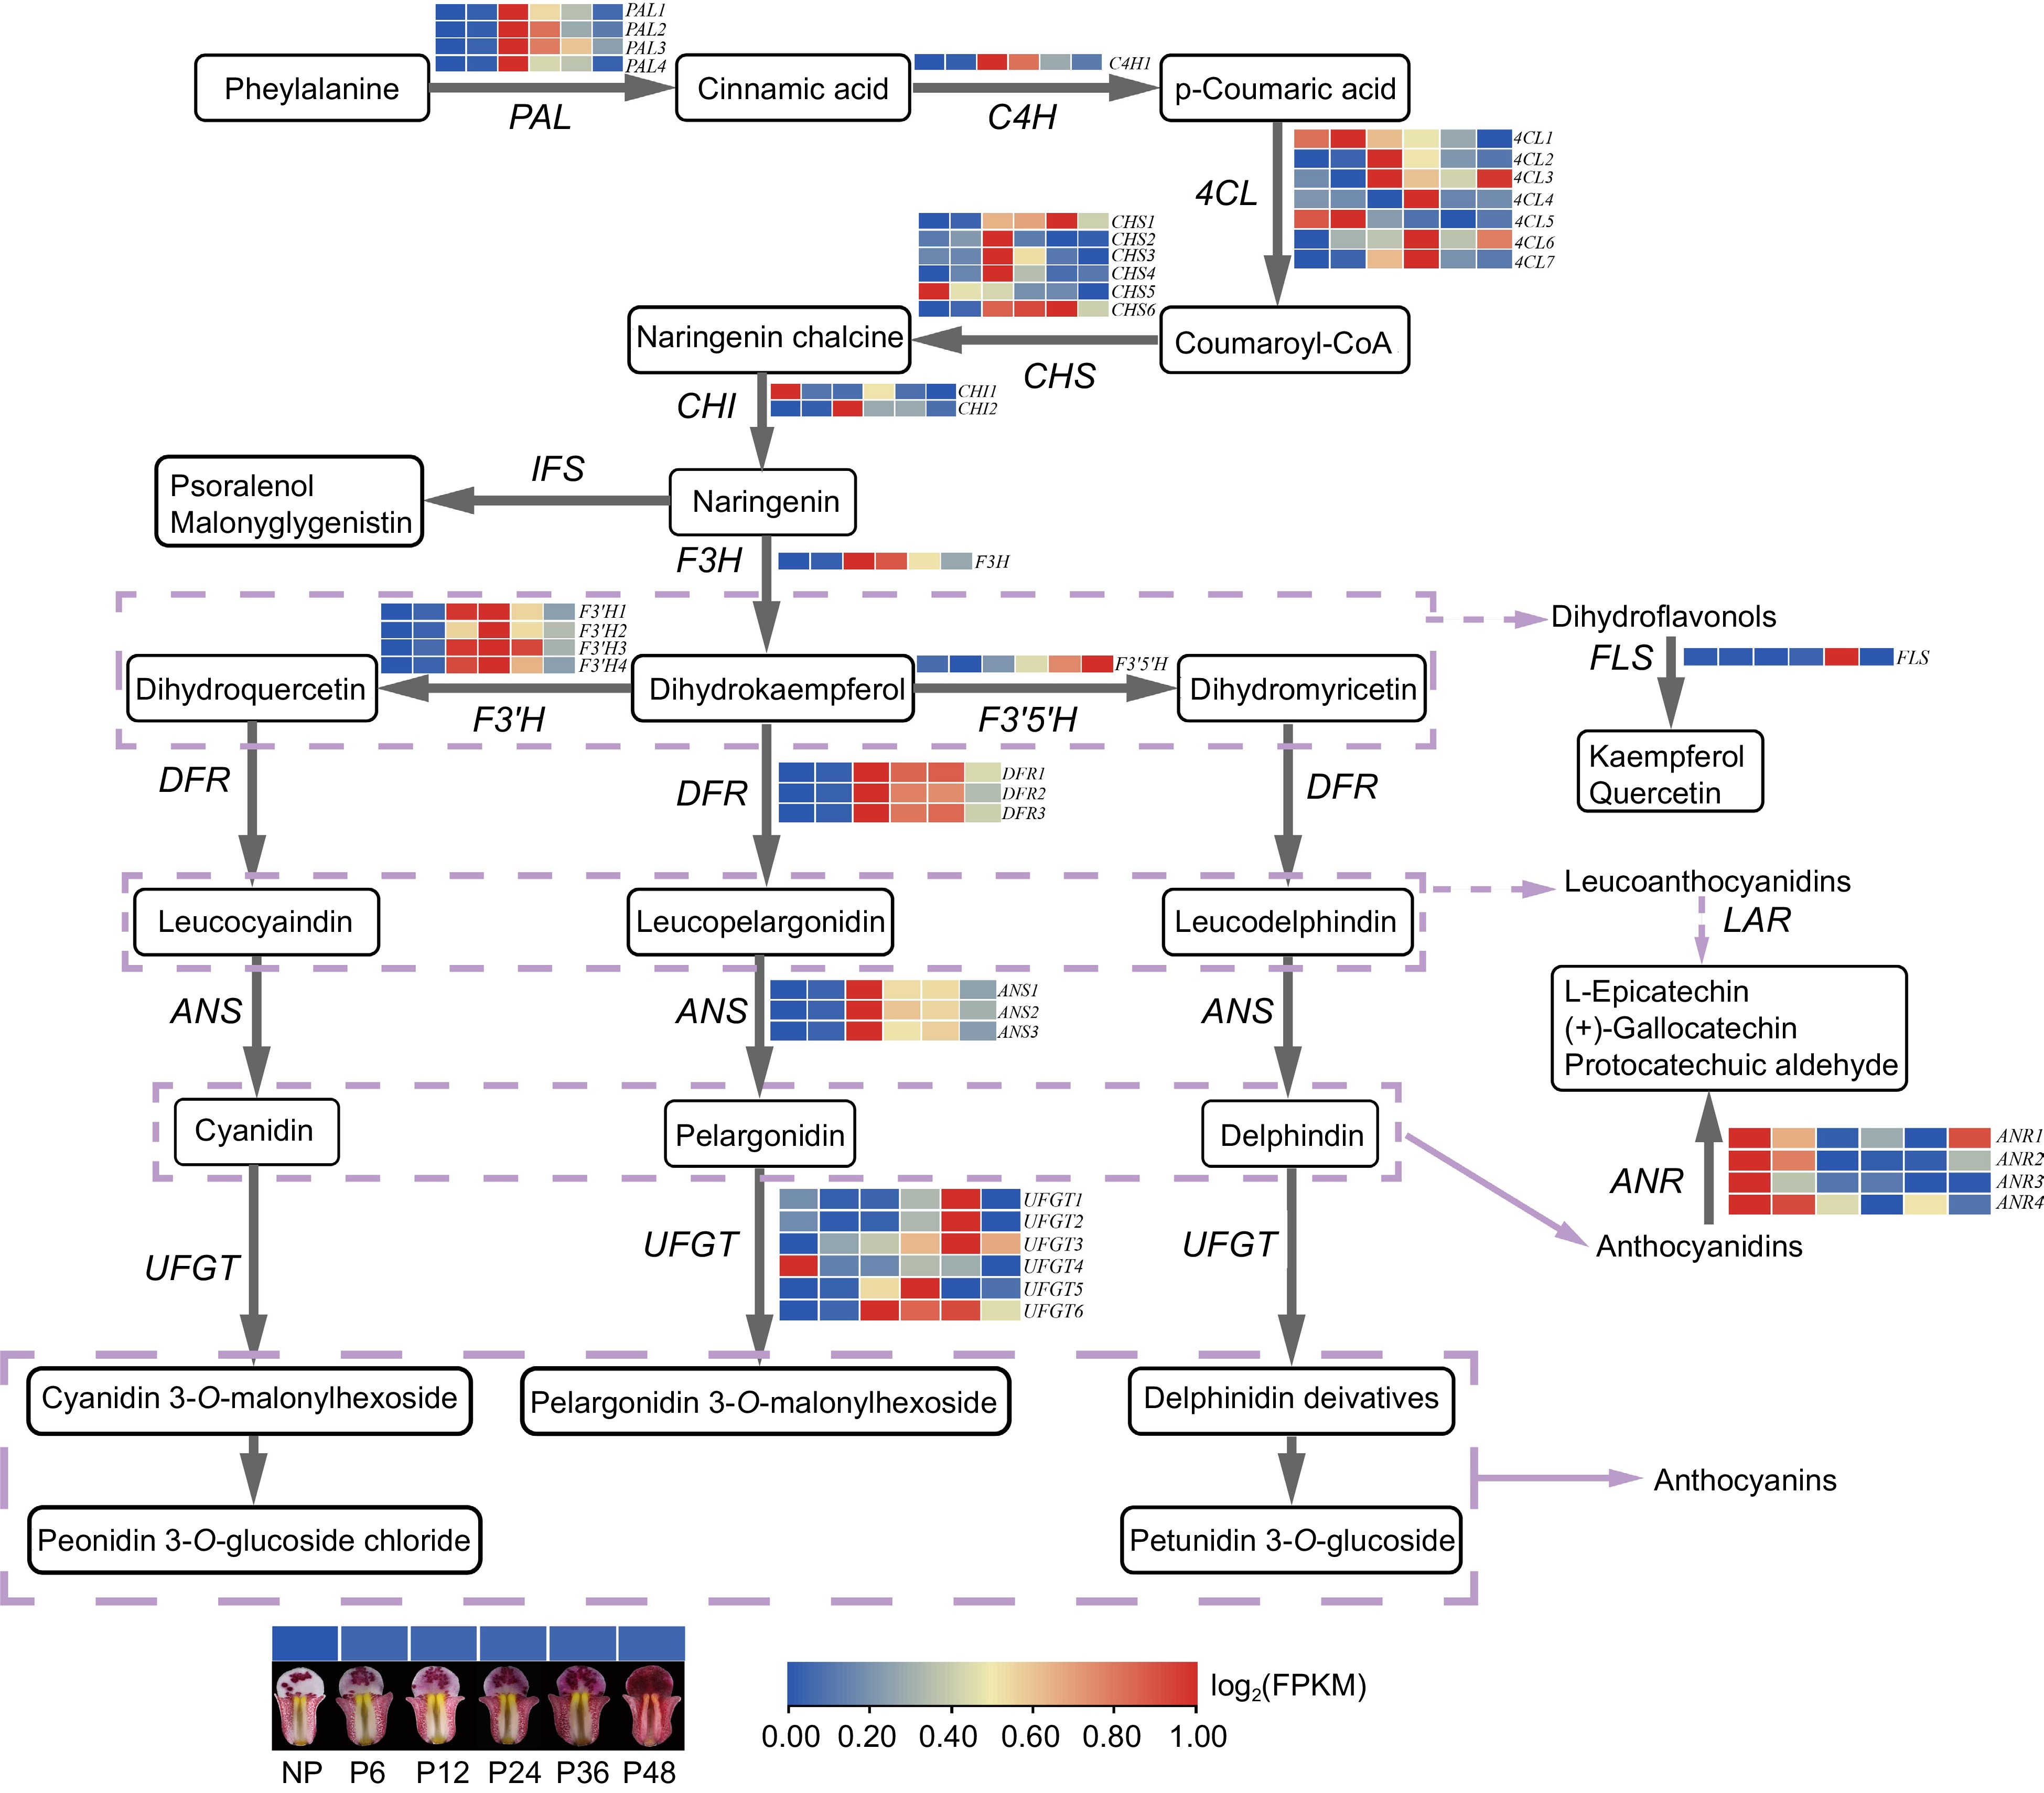
Figure 7.
The regulatory network of anthocyanin biosynthesis in lips before and after pollination in C. floribundum. PAL (phenylalanine ammonia-lyase); C4H (phenylalanine ammonia-lyase); 4CL (4-coumarate-CoA ligase); CHS (chalcone synthase); CHI (chalcone isomerase); F3H (flavanone 3-hydroxylase); F3'H (flavonoid 3'-hydroxylase); F3'5'H (flavonoid-3',5'-hydroxylase); FLS (flavonol synthase); DFR (dihydroflavonolreductase); ANS (anthocyanidinsynthase); UFGT (UDP-glucose: flavonoid-3-O-glycosyltranferase).
-
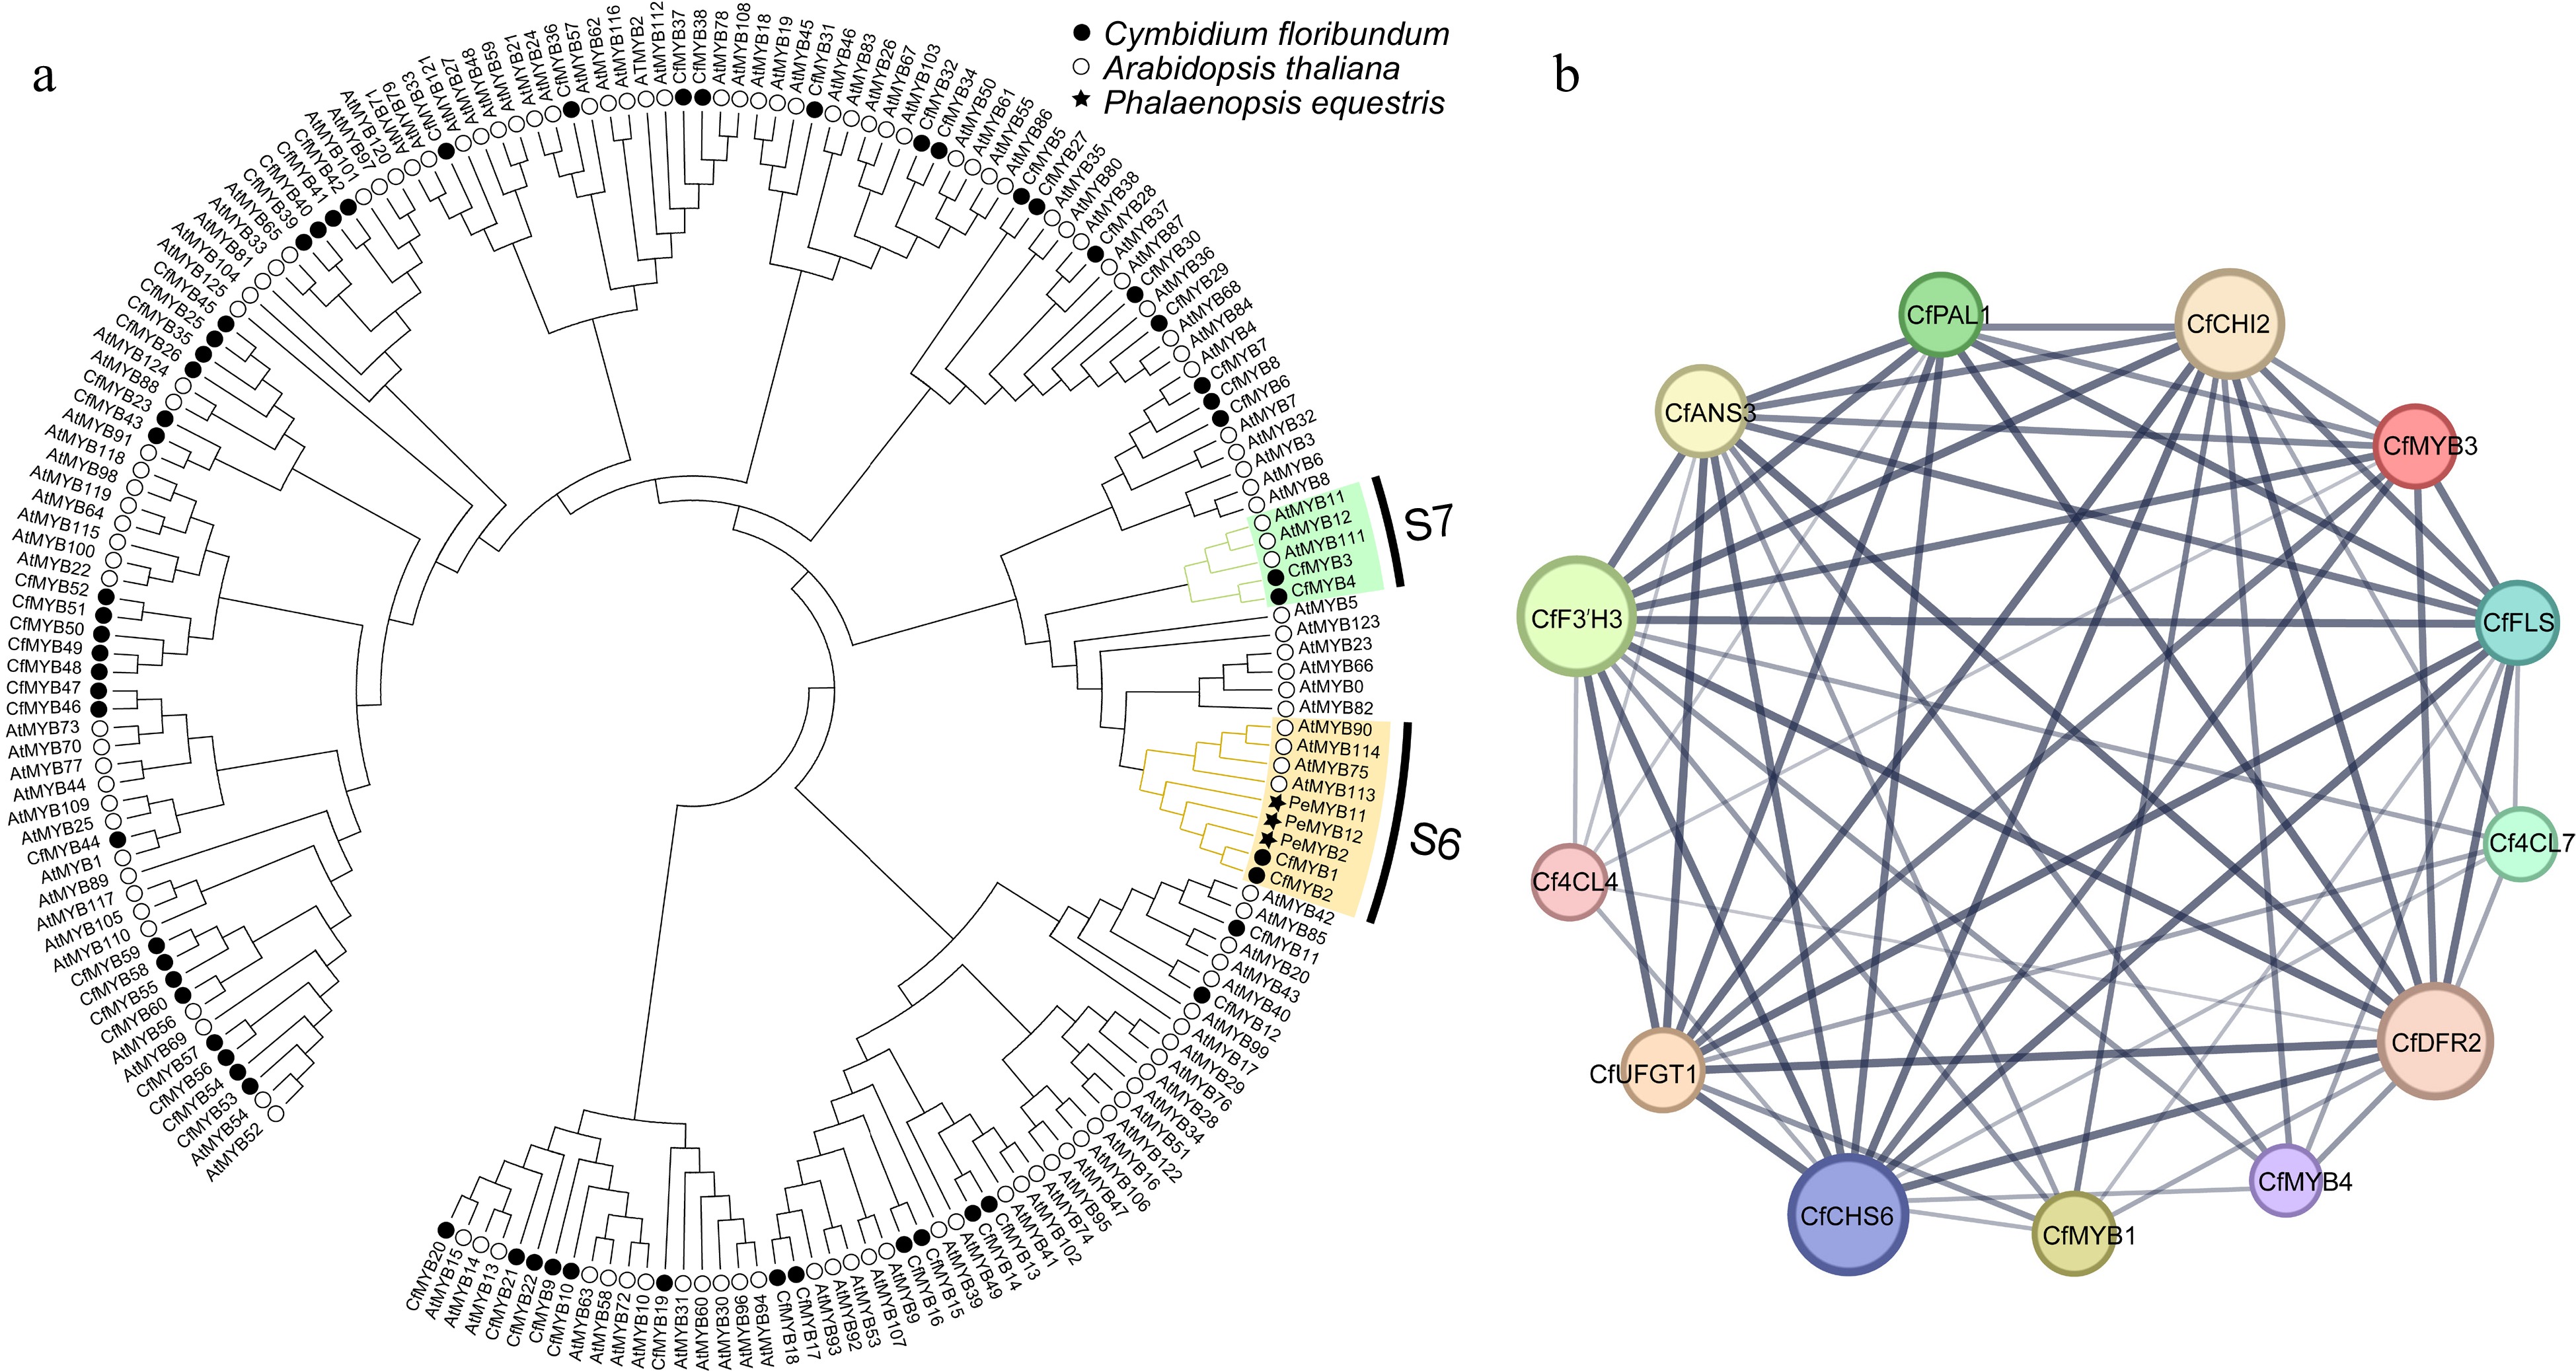
Figure 8.
Phylogenetic tree and co-expression network map of R2R3-MYB in C. floribundum. (a) NJ phylogenetic of R2R3-MYB protein sequence of C. floribundum. (b) The co-expression network interaction map between R2R3-MYB TFs and ABP genes. Circles represent different node genes. The straight lines represent the regulatory relationship between genes; the larger the circle, the greater the number of genes co-expressed with the gene.
-
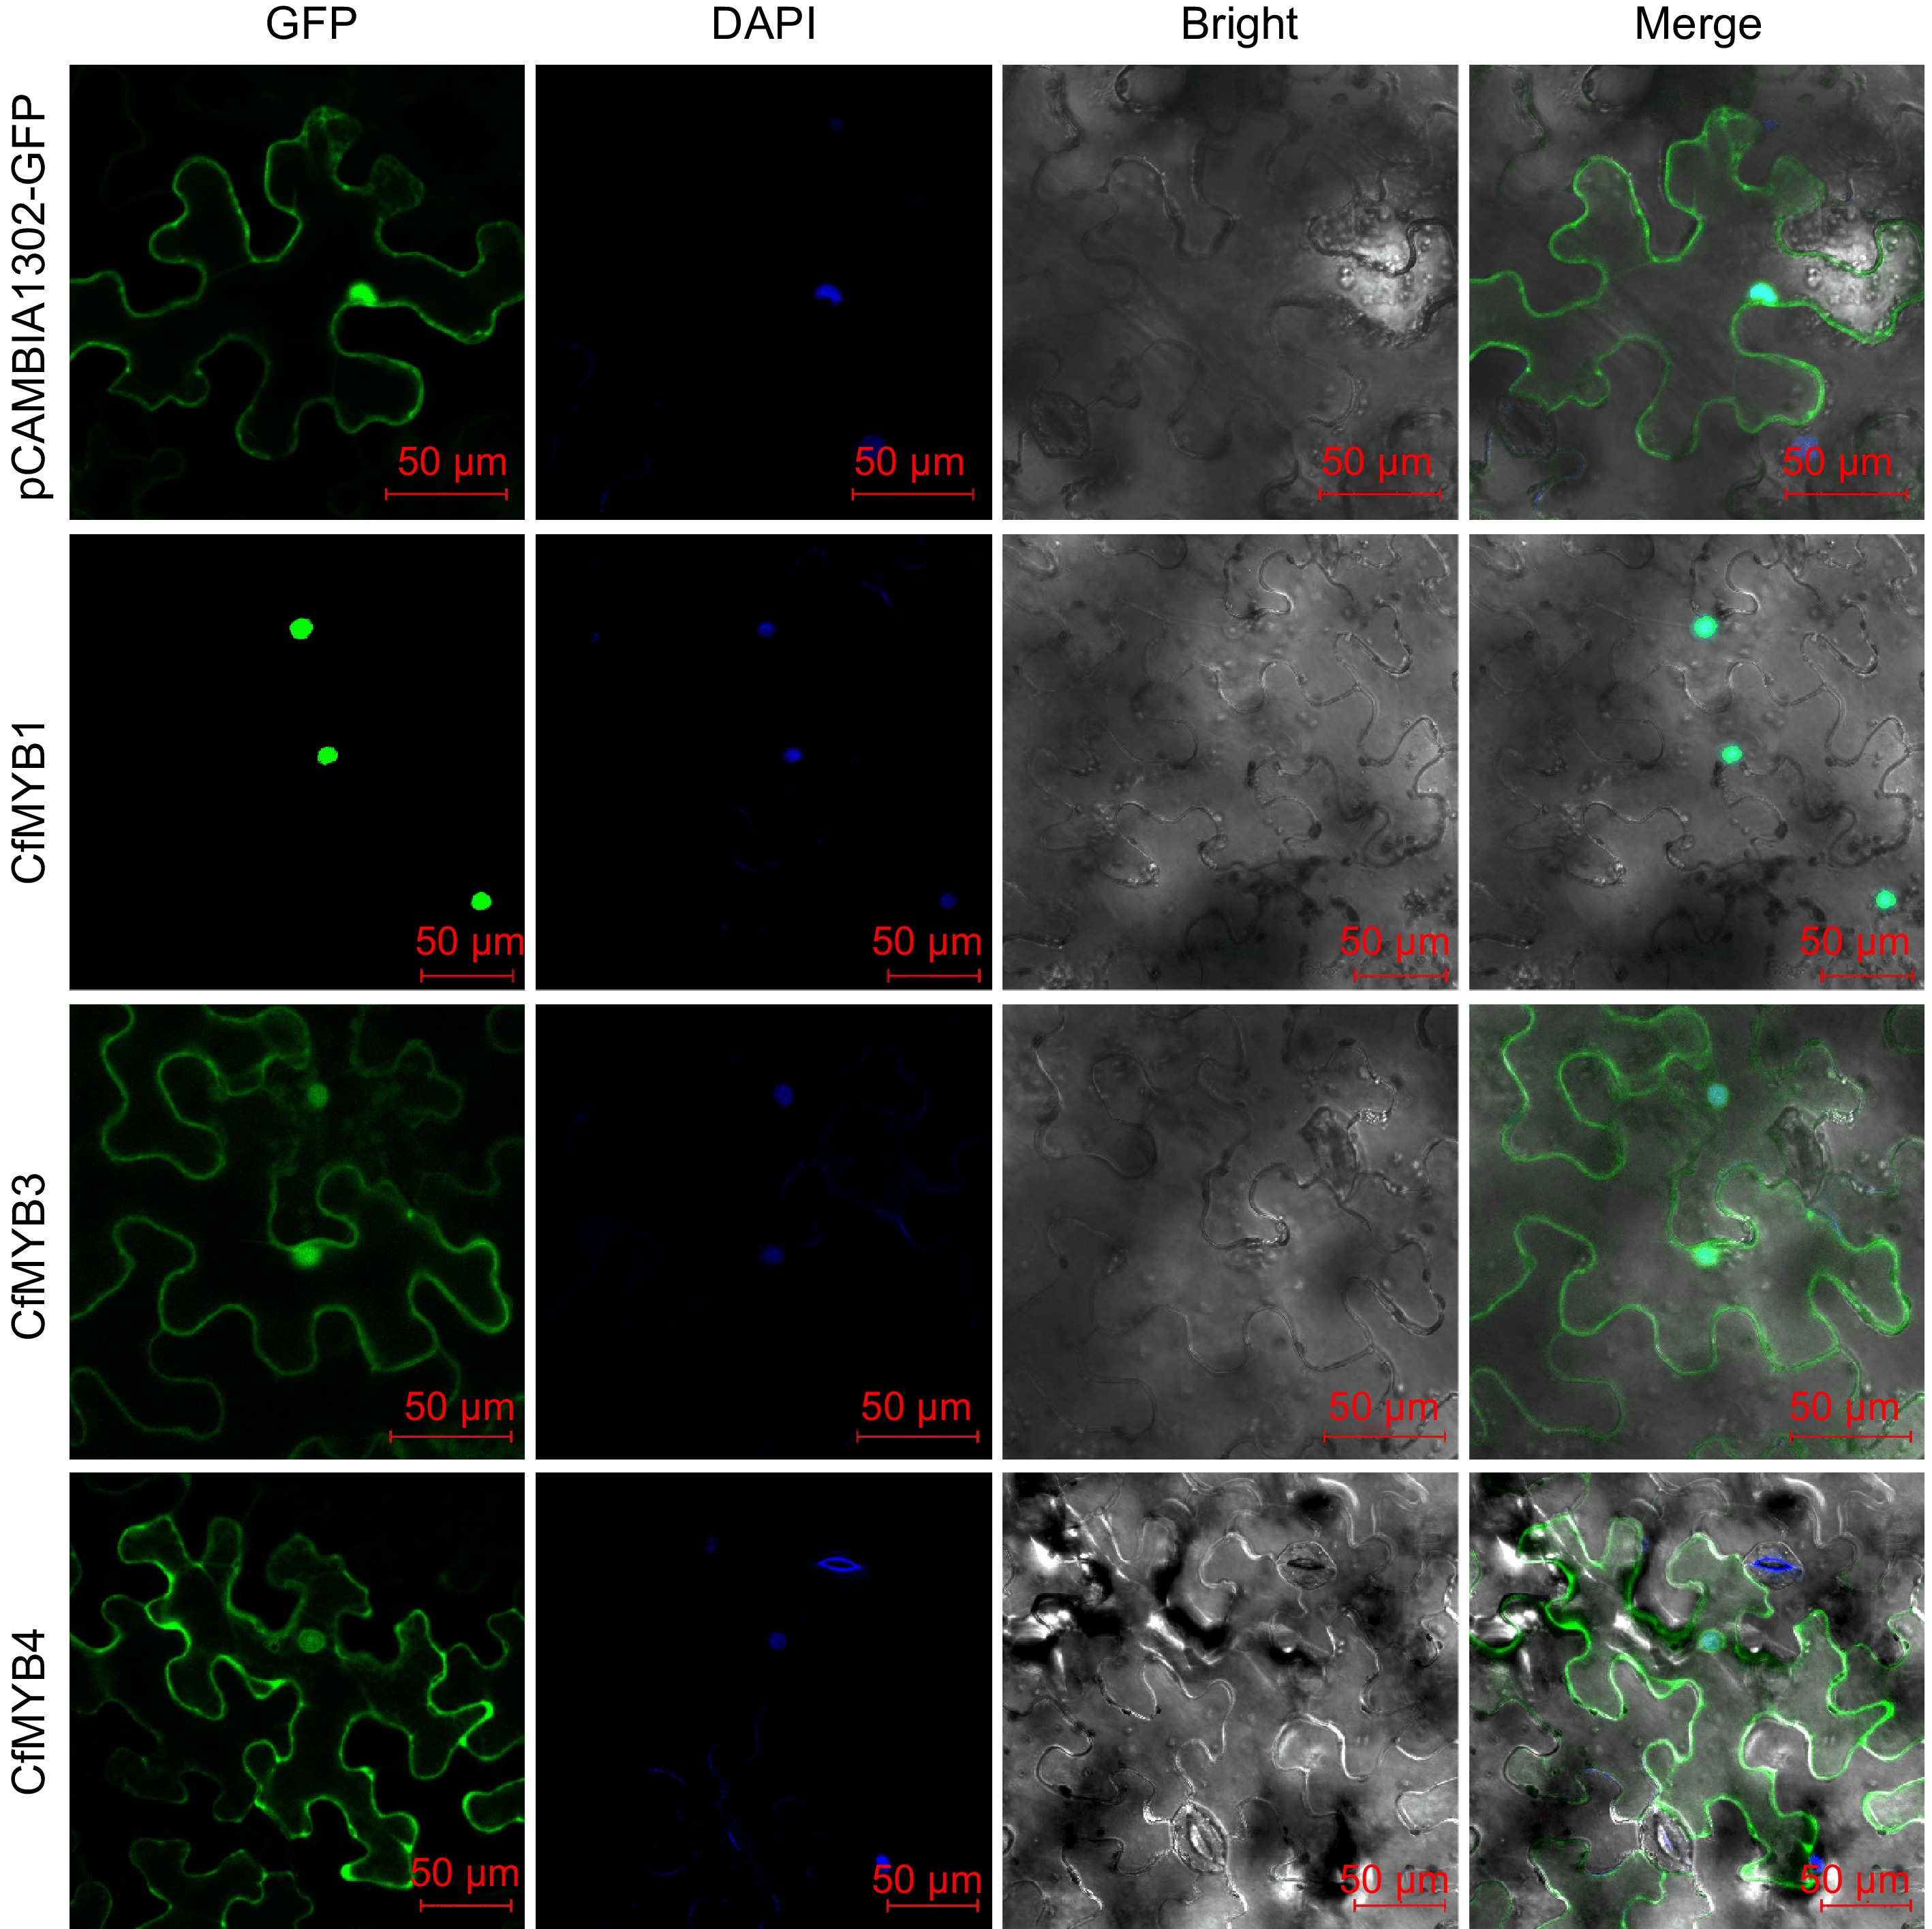
Figure 9.
Subcellular localization of CfMYB1, CfMYB3, and CfMYB4 proteins. GFP is green fluorescent protein. DAPI is blue fluorescent dye that can penetrate cell membrane. Bright is bright field. Merge is the superposition field of green fluorescence, bright field and blue fluorescent field of cell membrane.
-
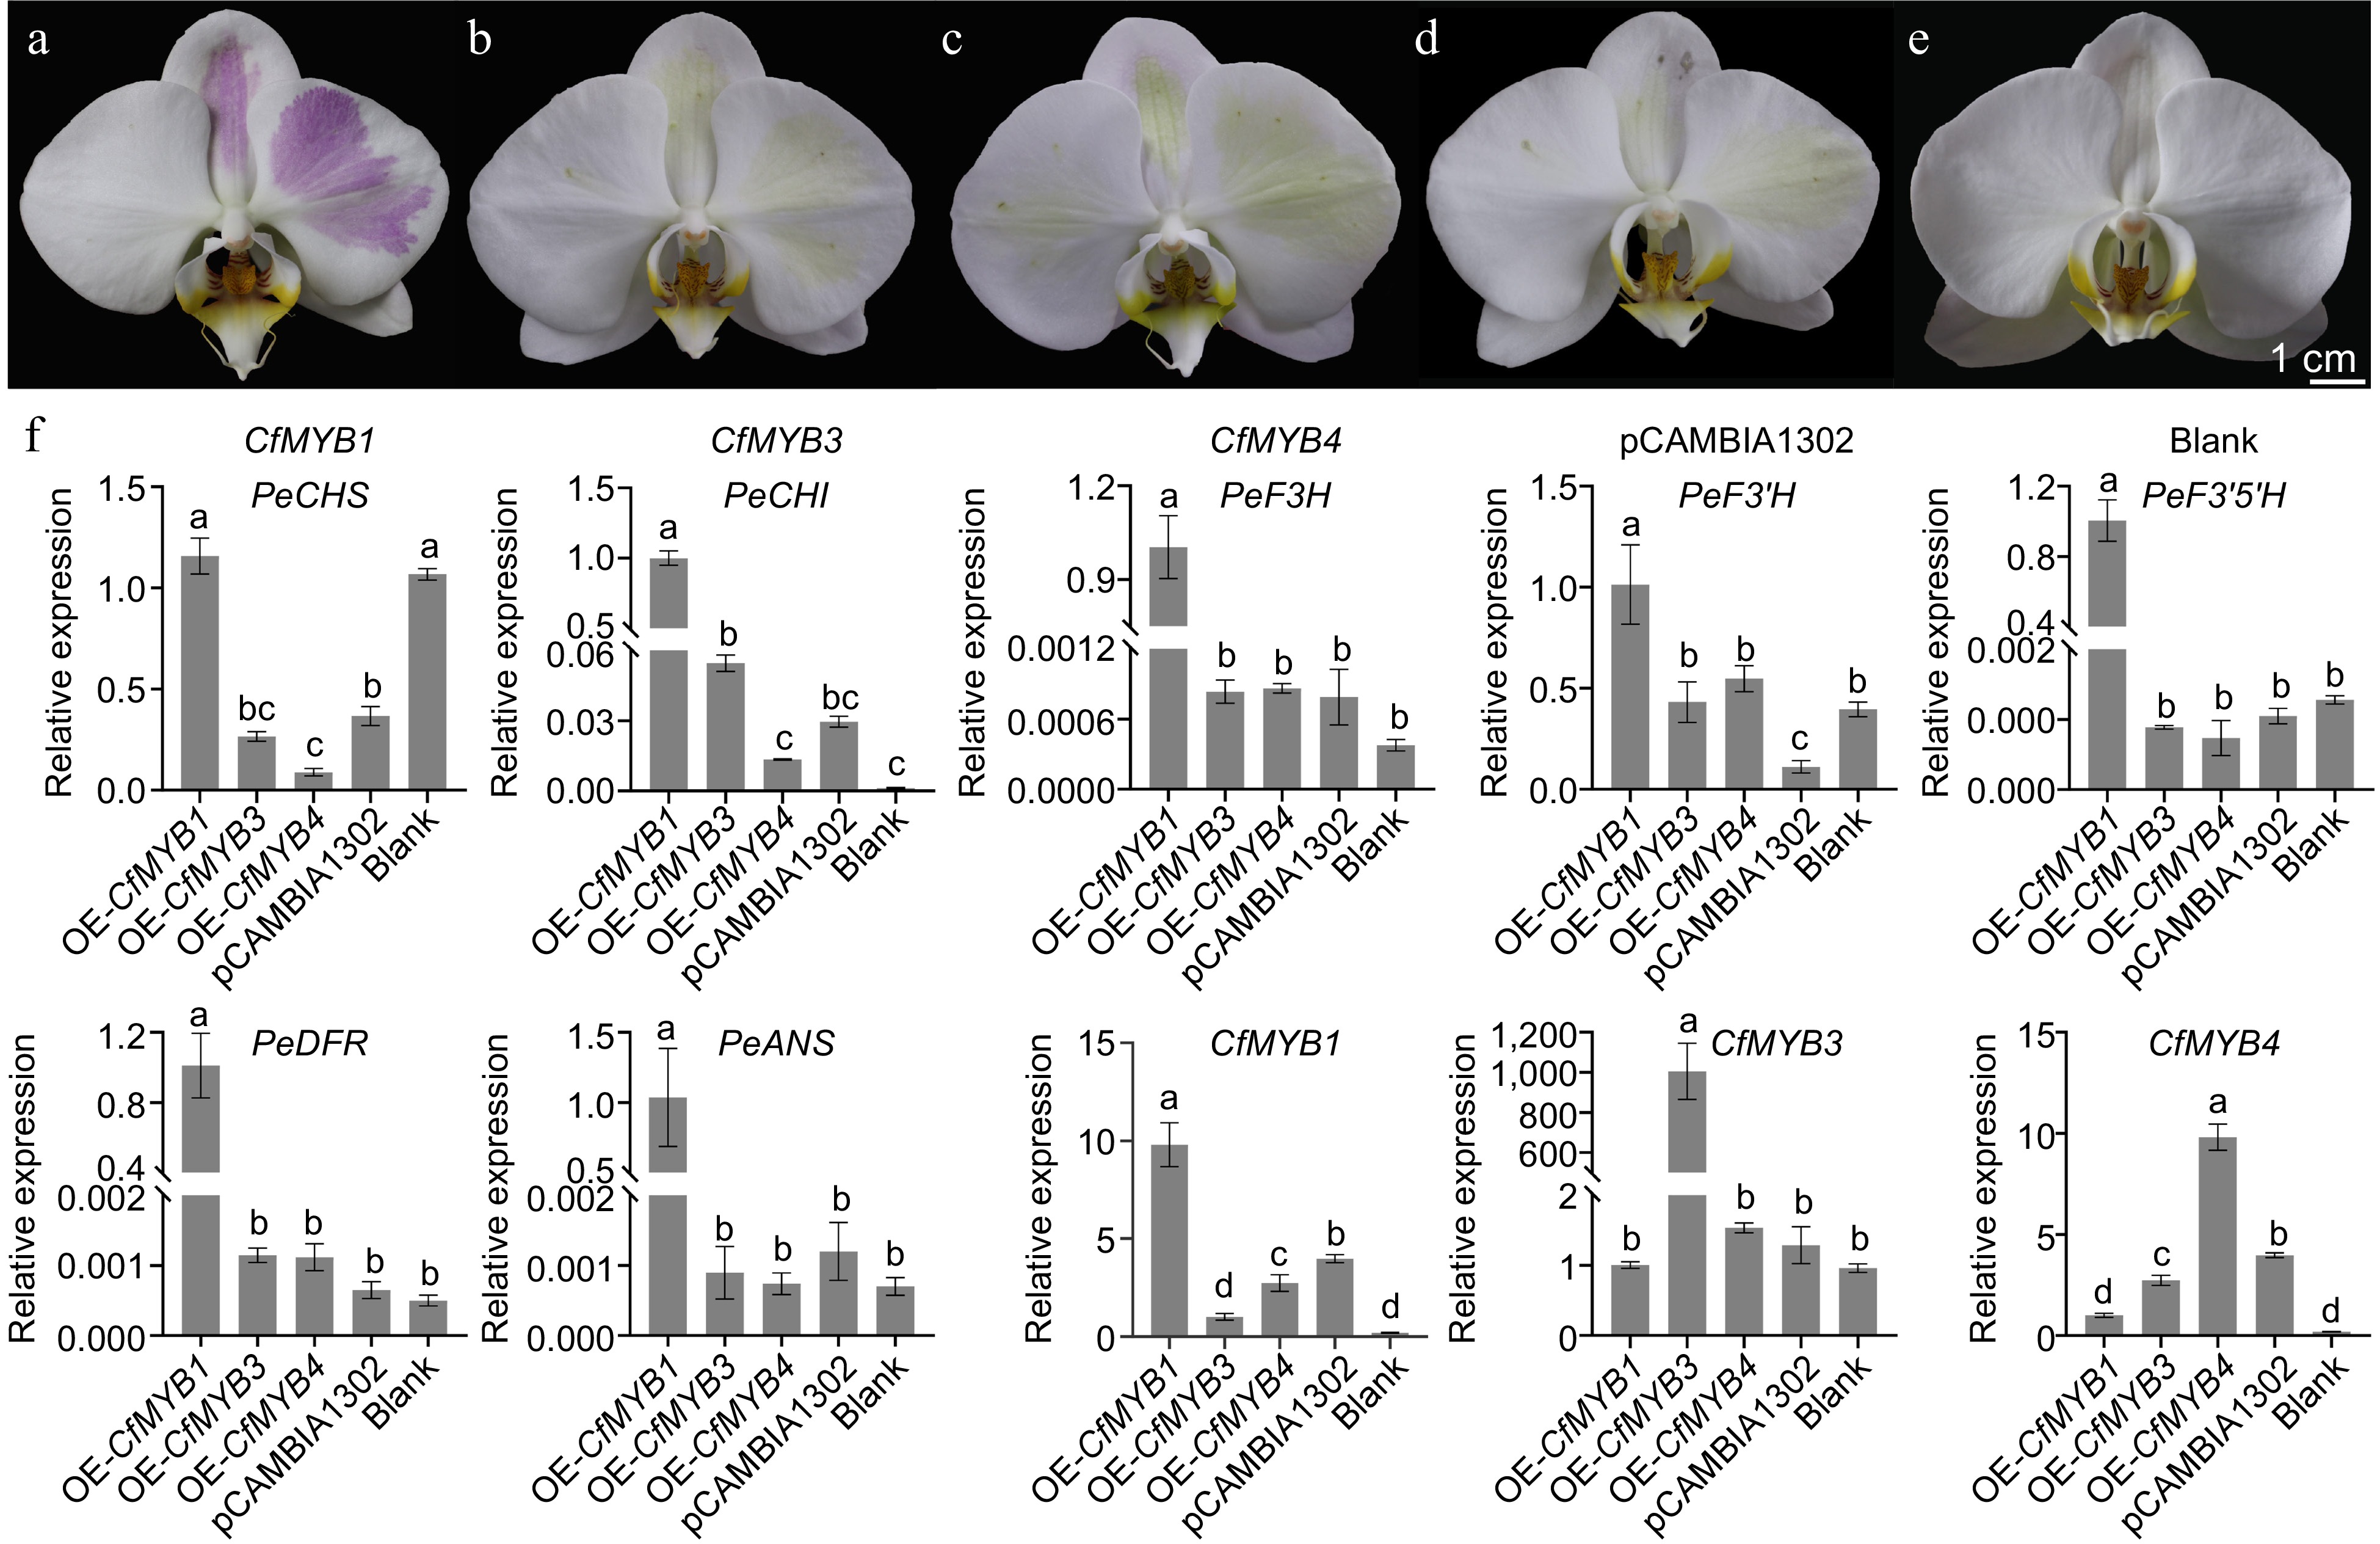
Figure 10.
The overexpression of CfMYB1, CfMYB3, CfMYB4 and the expression of anthocyanin synthesis related genes. (a)−(c) The plants overexpressing CfMYB1, CfMYB3, and CfMYB4, respectively. (d) The plants overexpression of the empty vector. (e) A normal plant without bacterial injection. (f) The expression of ABP related genes. The error bars in (f) indicate the standard deviation of three biological replicates, and the different letters represent significant differences (p < 0.05) based on Tukey's honestly significant difference test.
Figures
(10)
Tables
(0)