-
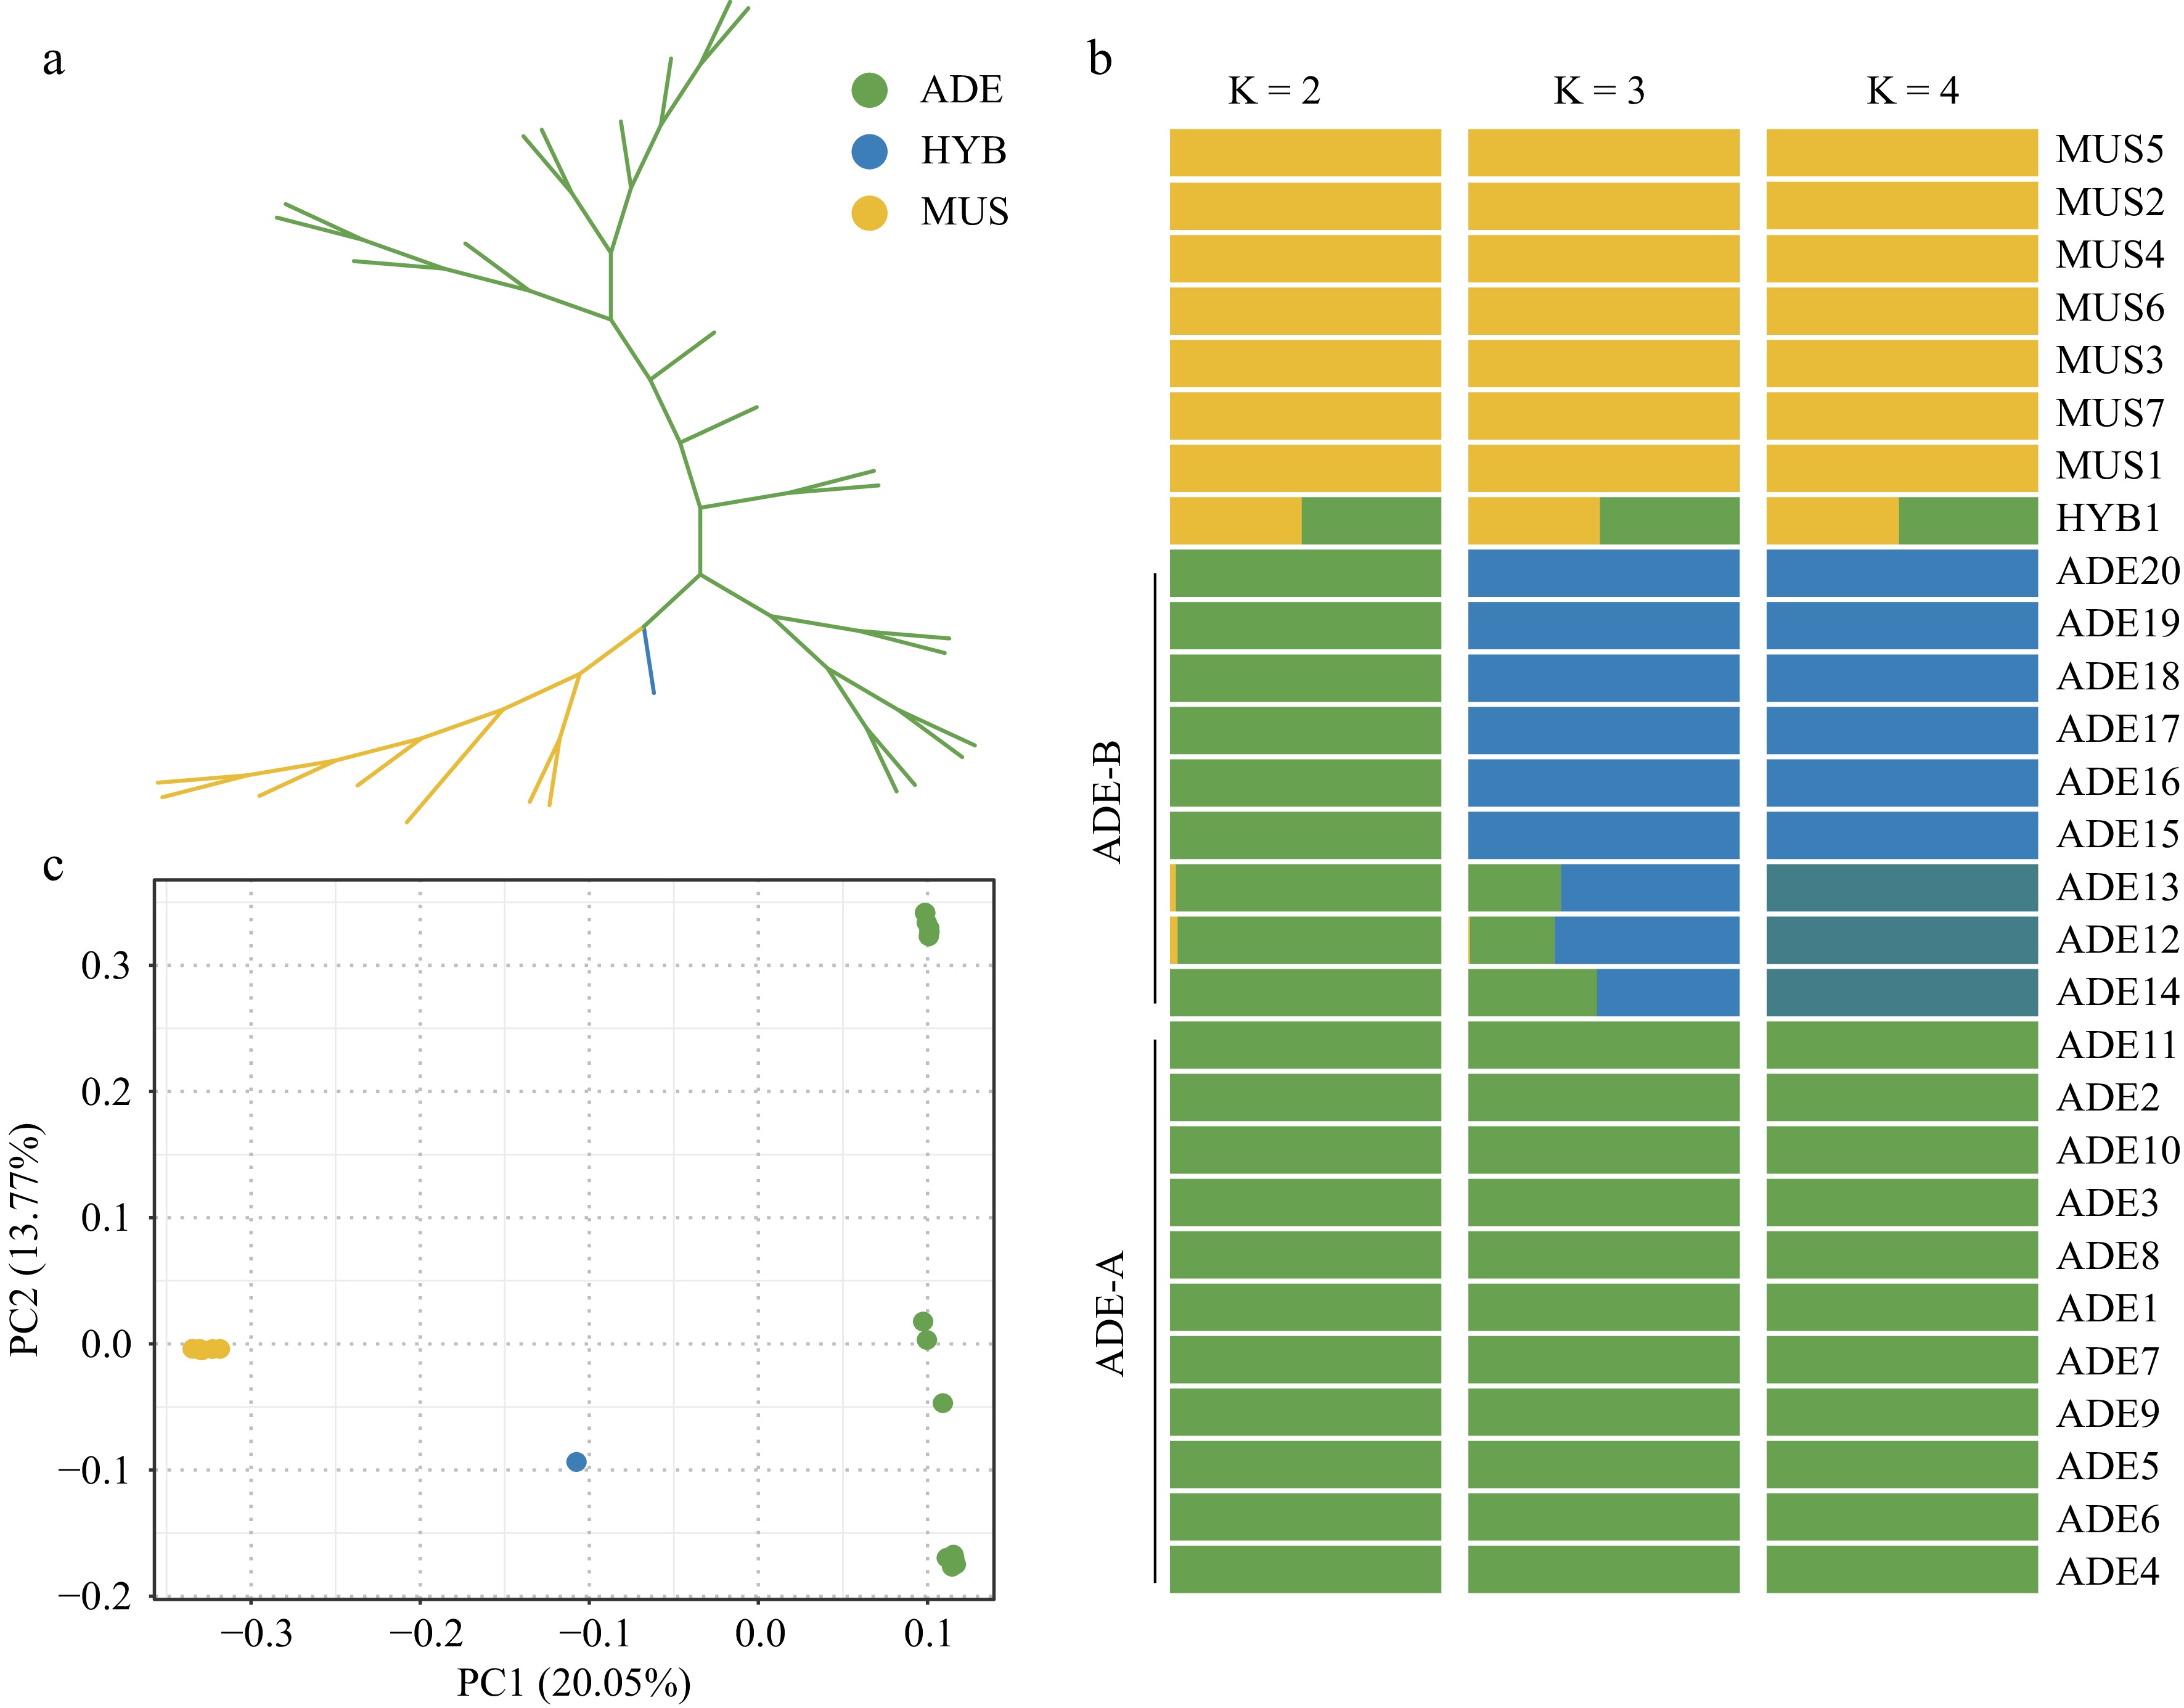
Figure 1.
Population structure of the 28 Vitis accessions. (a) Unrooted ML tree. The colors yellow, green, and blue represent the 'Shine Muscat' group, the V. adenoclada group, and the hybrid offspring, respectively. (b) Admixture analysis with K = 2, 3, and 4. (c) PCA results. The correspondence between colors and groups is consistent with Fig. 1a.
-
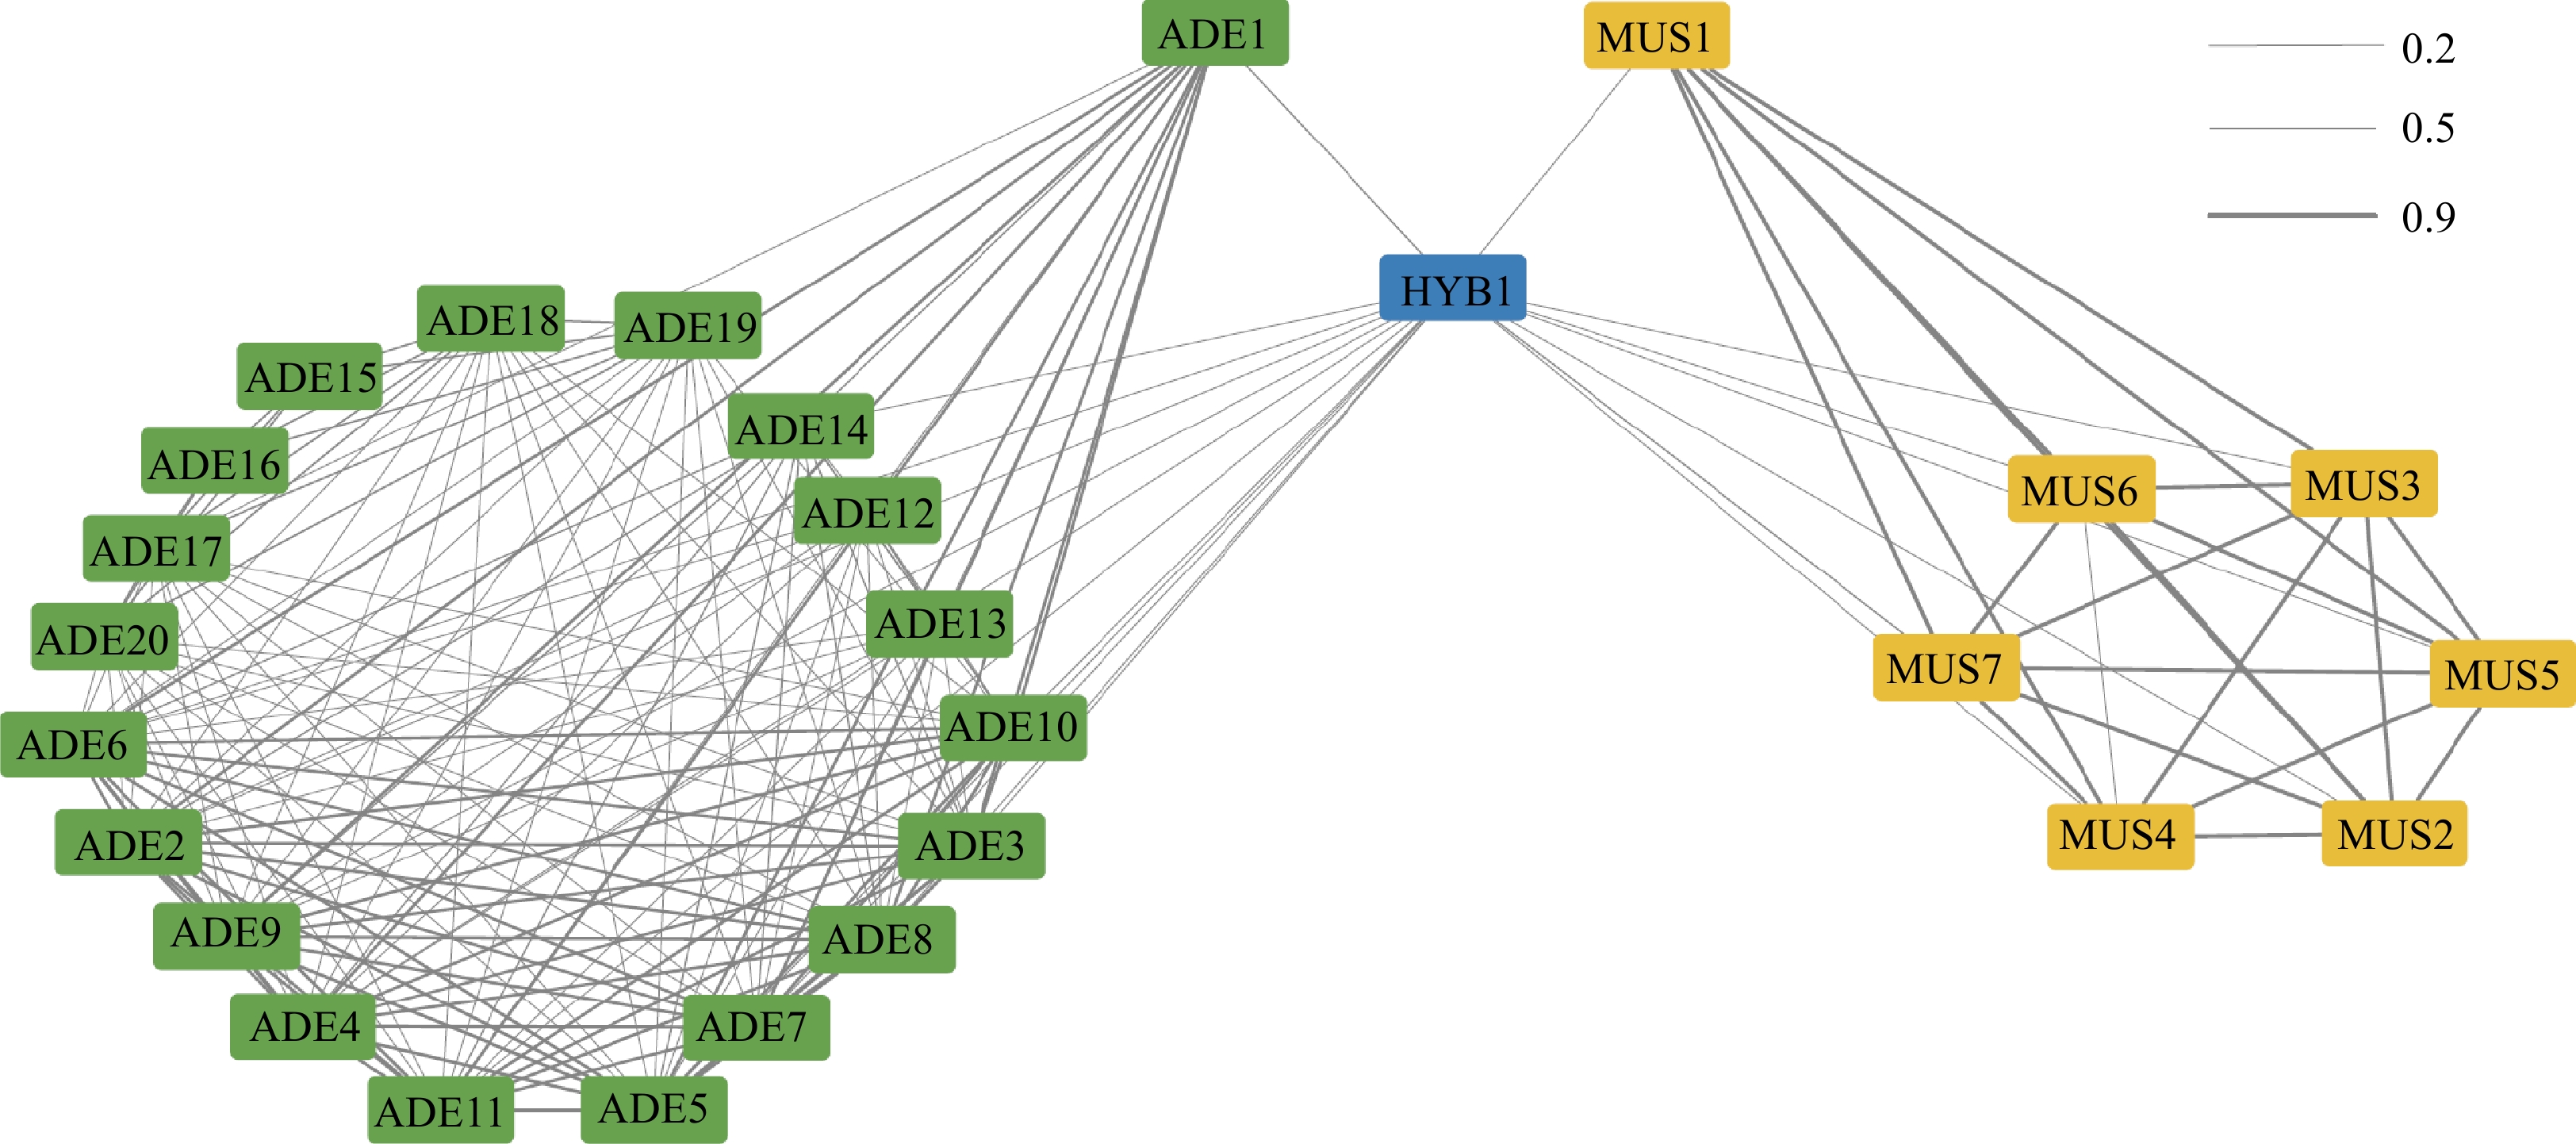
Figure 2.
IBD Relationship among the Vitis accessions.
-
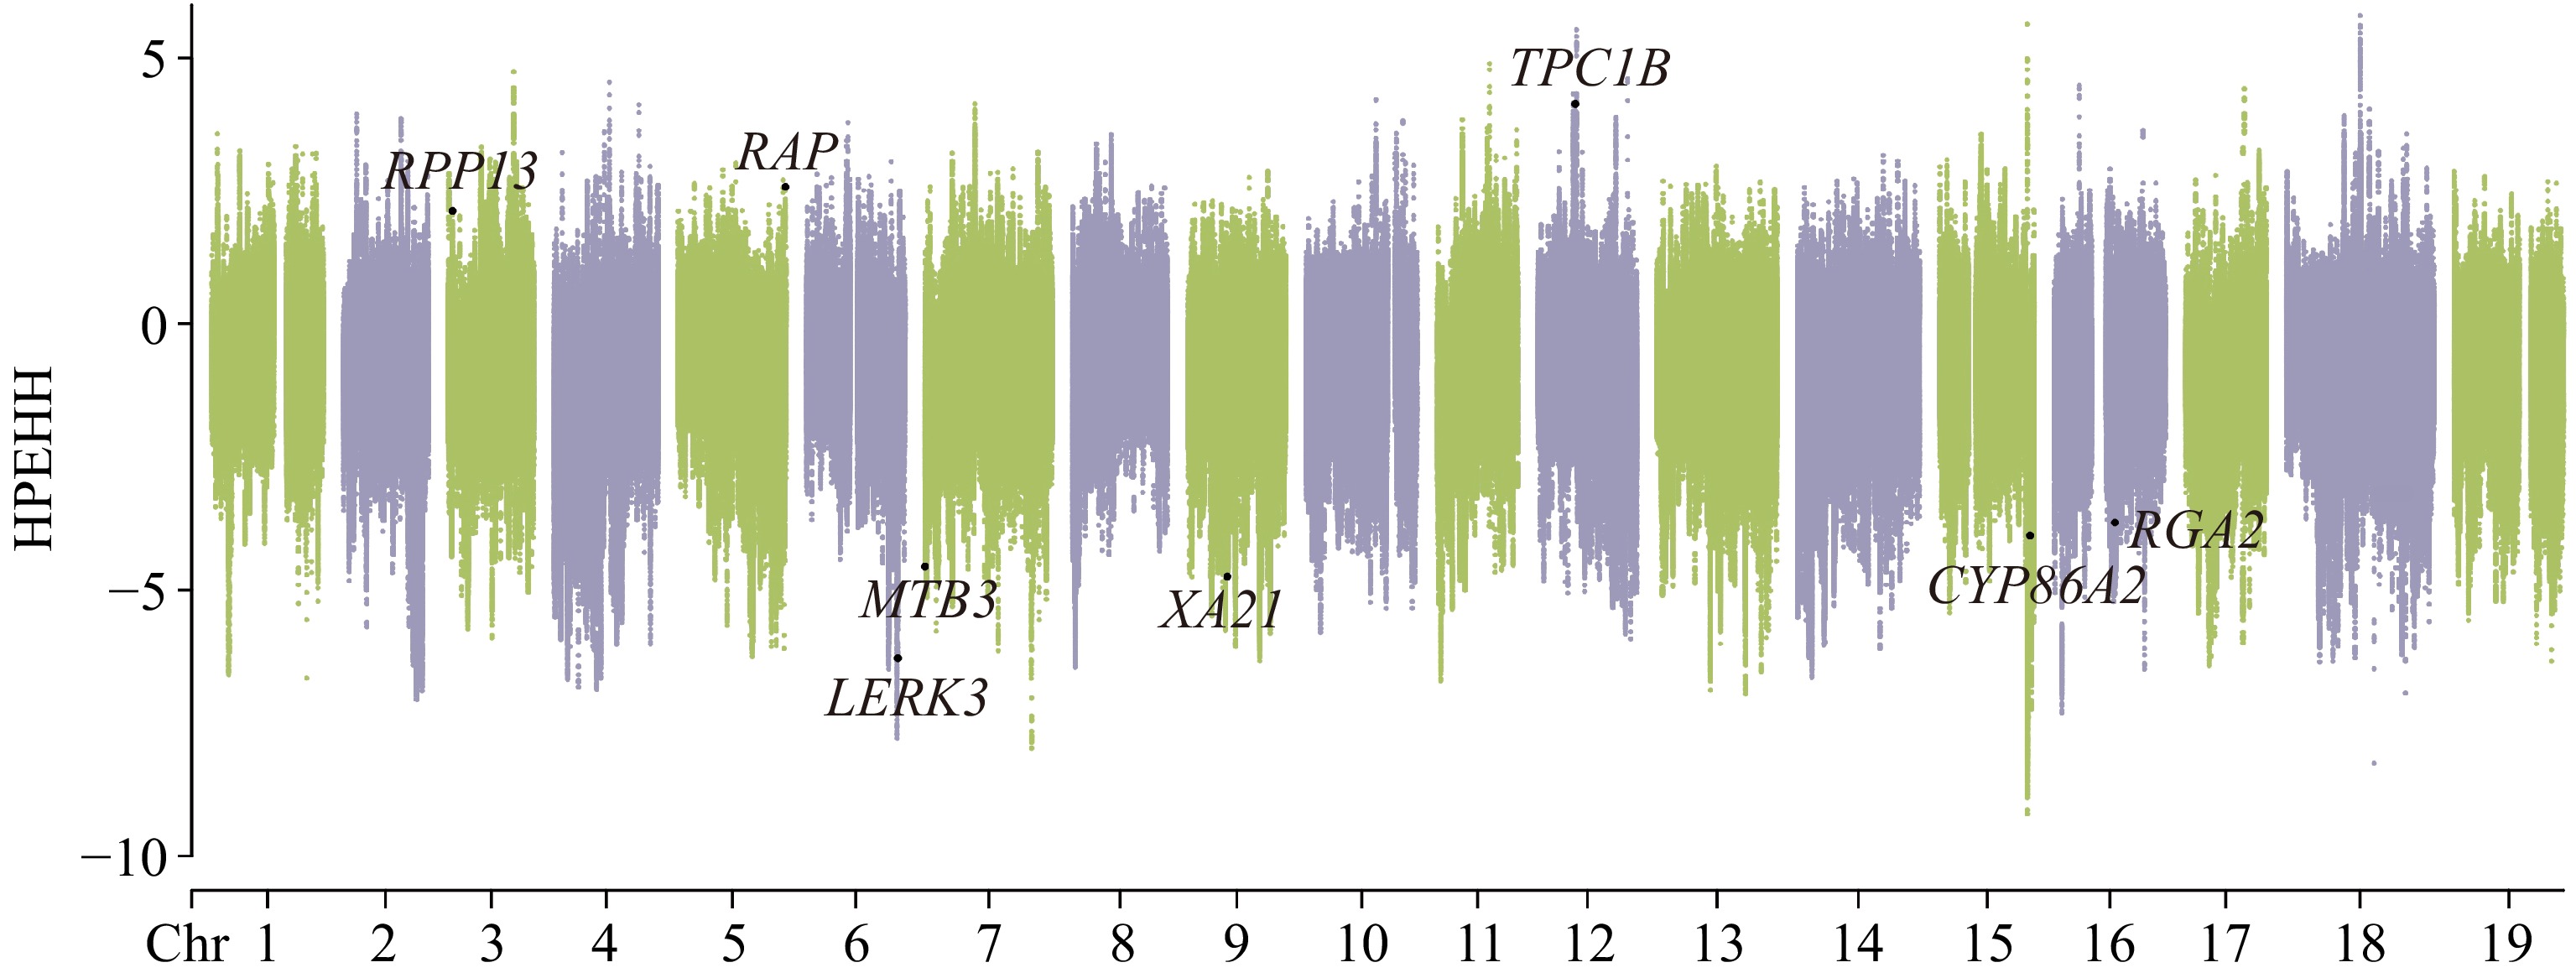
Figure 3.
Selective signal detected by XP-EHH analysis. V. adenoclada was taken as the candidate group and 'Shine Muscat' was regarded as the reference.
-
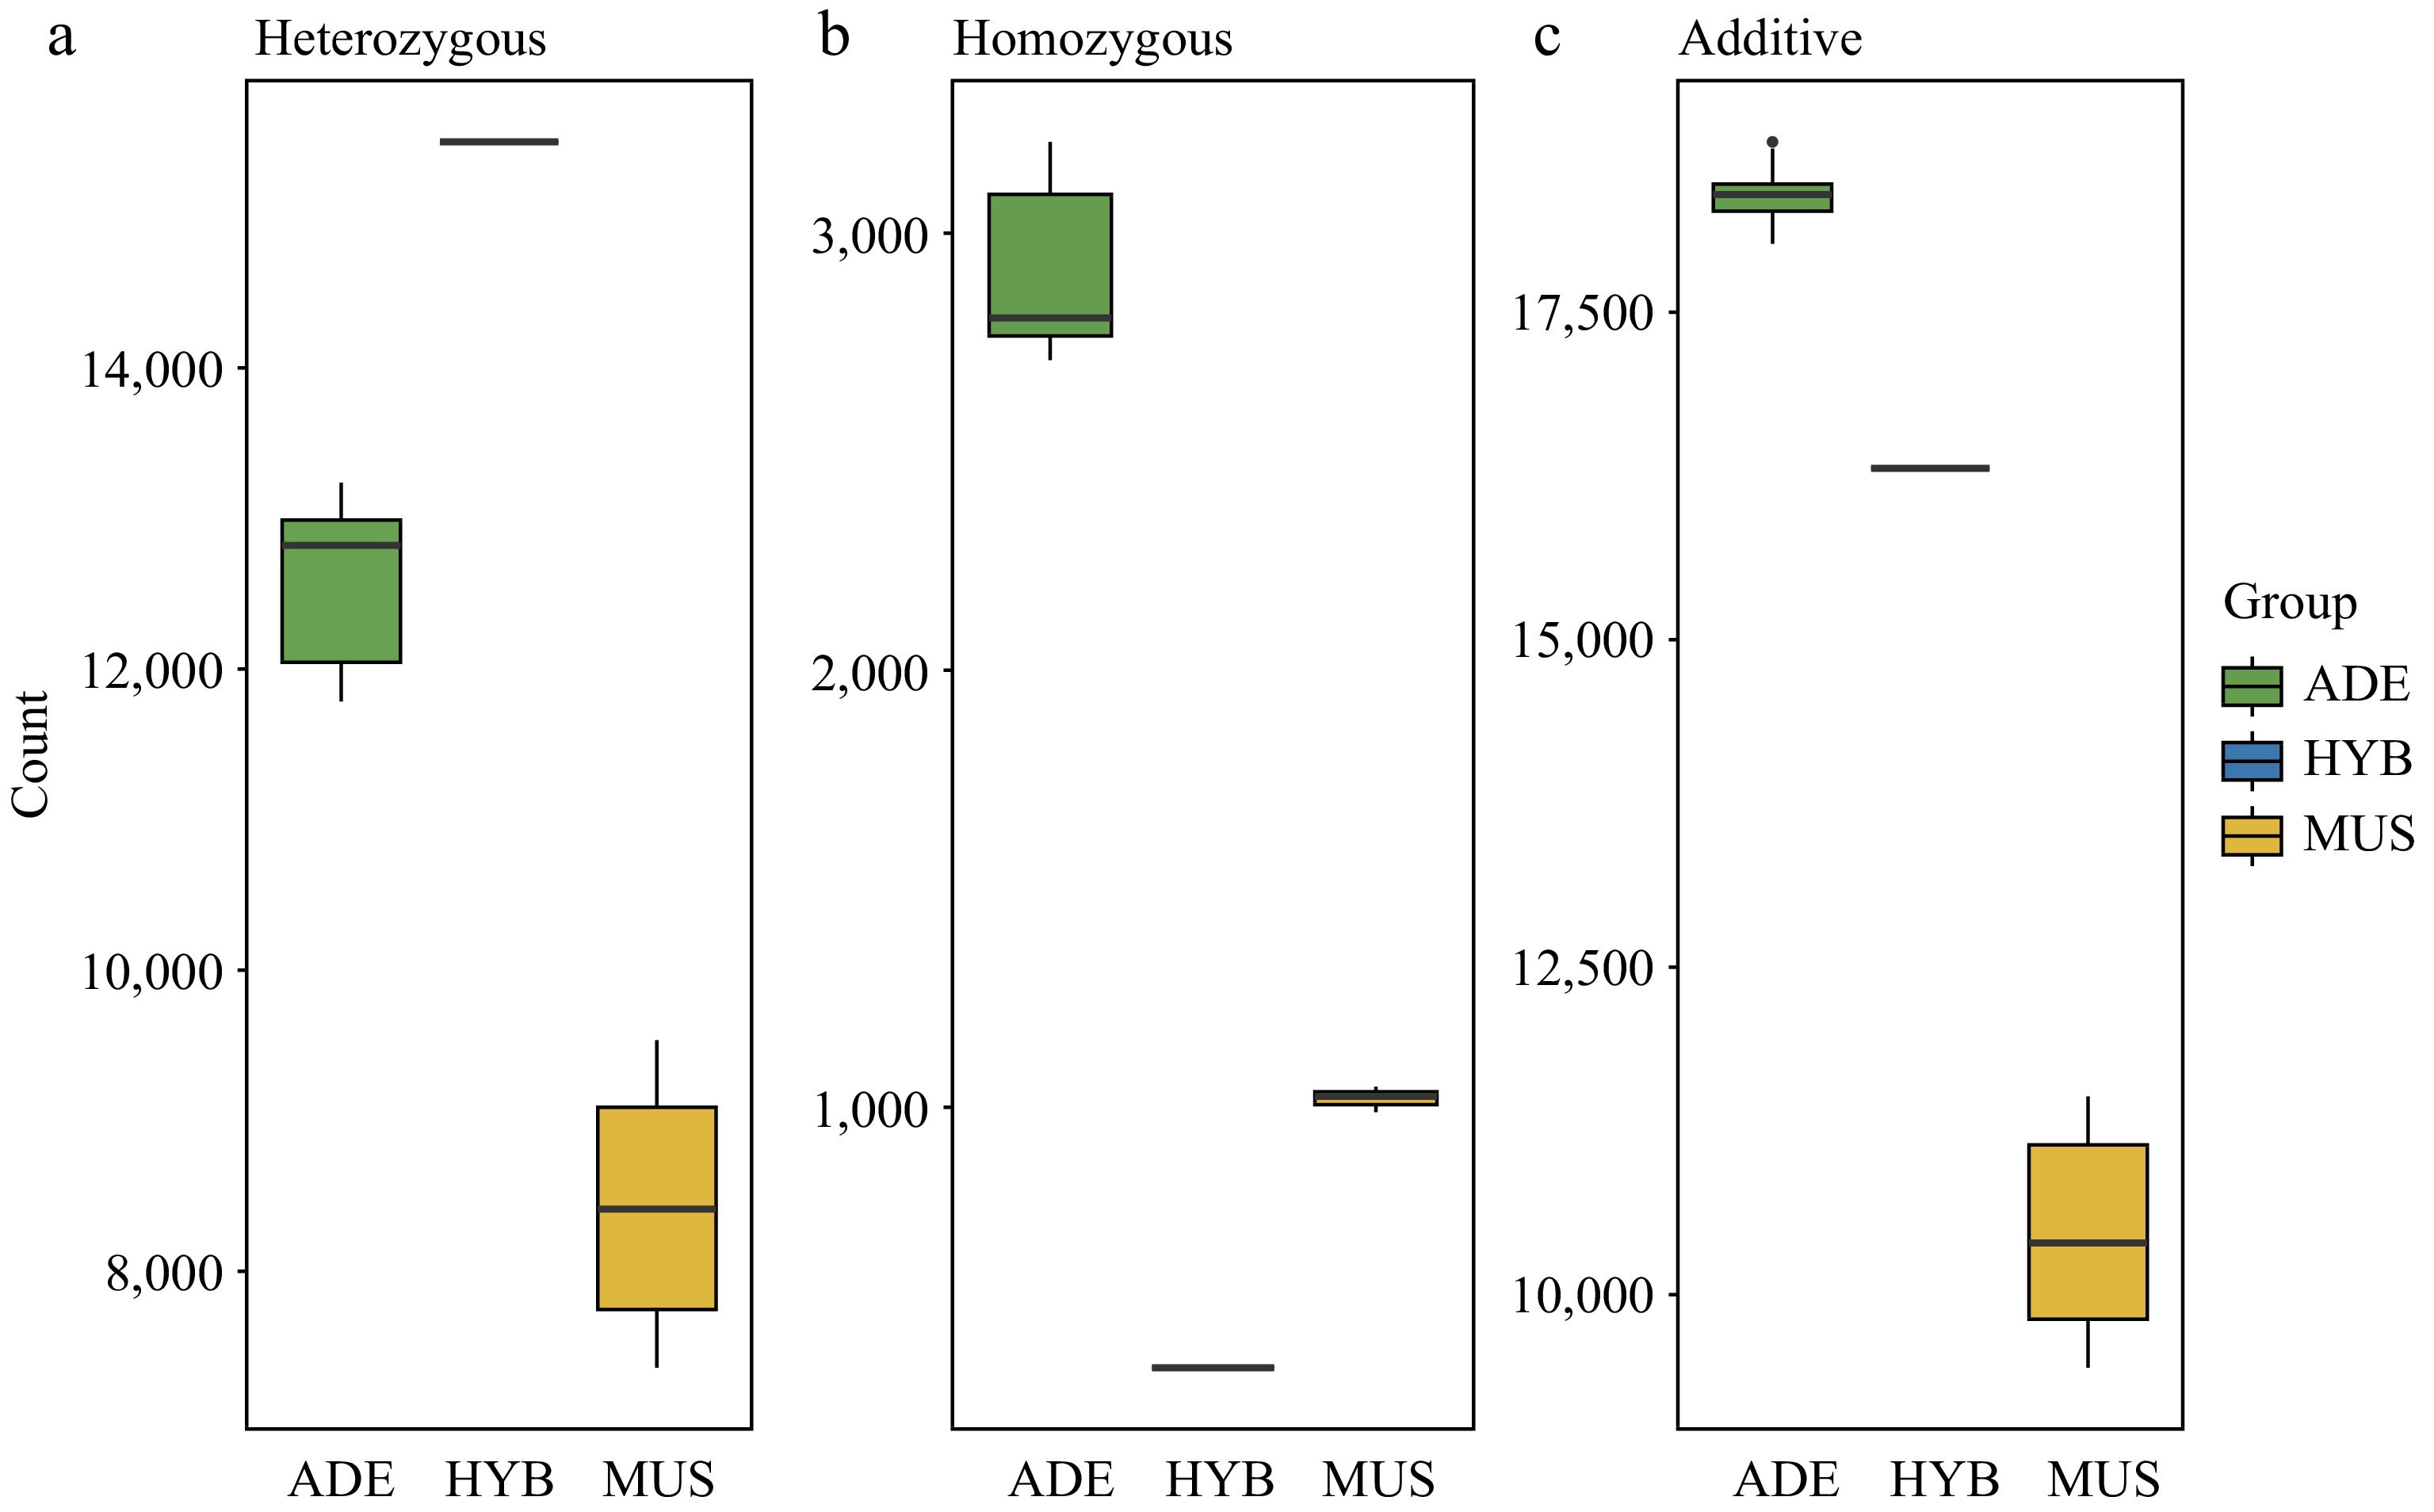
Figure 4.
Deleterious mutations analysis among V. adenoclada, 'Shine Muscat', and their one hybrid offspring. (a) The number of heterozygous deleterious alleles. (b) The number of homozygous deleterious alleles. (c) The total number of deleterious SNPs.
-
Sample Total base (bp) Depth Mapping rate SNP number ADE1 17,520,817,445 35.40 97.32% 5,626,462 ADE2 24,257,947,082 49.02 88.66% 5,679,994 ADE3 18,328,442,529 37.04 80.59% 5,676,095 ADE4 21,011,413,063 42.46 94.82% 5,689,913 ADE5 22,031,567,287 44.52 97.23% 5,691,839 ADE6 24,068,277,235 48.64 96.30% 5,695,943 ADE7 23,436,537,148 47.36 96.31% 5,696,589 ADE8 21,950,203,360 44.36 96.11% 5,669,703 ADE9 22,002,259,768 44.46 96.97% 5,703,161 ADE10 22,309,202,148 45.08 96.37% 5,700,374 ADE11 22,049,567,098 44.56 96.66% 5,680,656 ADE12 27,580,752,978 55.73 97.70% 5,651,025 ADE13 22,064,551,844 44.59 97.65% 5,643,197 ADE14 24,850,211,192 50.22 97.83% 5,581,868 ADE15 22,814,344,130 46.10 97.74% 5,451,046 ADE16 23,240,185,342 46.96 97.54% 5,448,929 ADE17 19,291,800,581 38.98 98.07% 5,479,083 ADE18 19,298,624,750 39.00 97.67% 5,463,166 ADE19 20,634,991,493 41.70 97.95% 5,451,605 ADE20 20,619,496,304 41.67 98.06% 5,476,361 HYB1 19,995,439,567 40.41 94.71% 6,140,779 MUS1 20,104,866,097 40.63 97.08% 4,059,284 MUS2 31,473,565,455 63.60 98.29% 3,919,498 MUS3 32,273,677,414 65.22 98.88% 3,832,869 MUS4 35,479,482,412 71.69 98.91% 3,771,105 MUS5 35,076,902,316 70.88 97.71% 3,973,151 MUS6 36,508,316,389 73.77 98.92% 3,749,505 MUS7 7,963,746,000 16.09 98.68% 3,956,697 Table 1.
Quality and SNPs statistics of all 28 resequenced accessions.
Figures
(4)
Tables
(1)