-
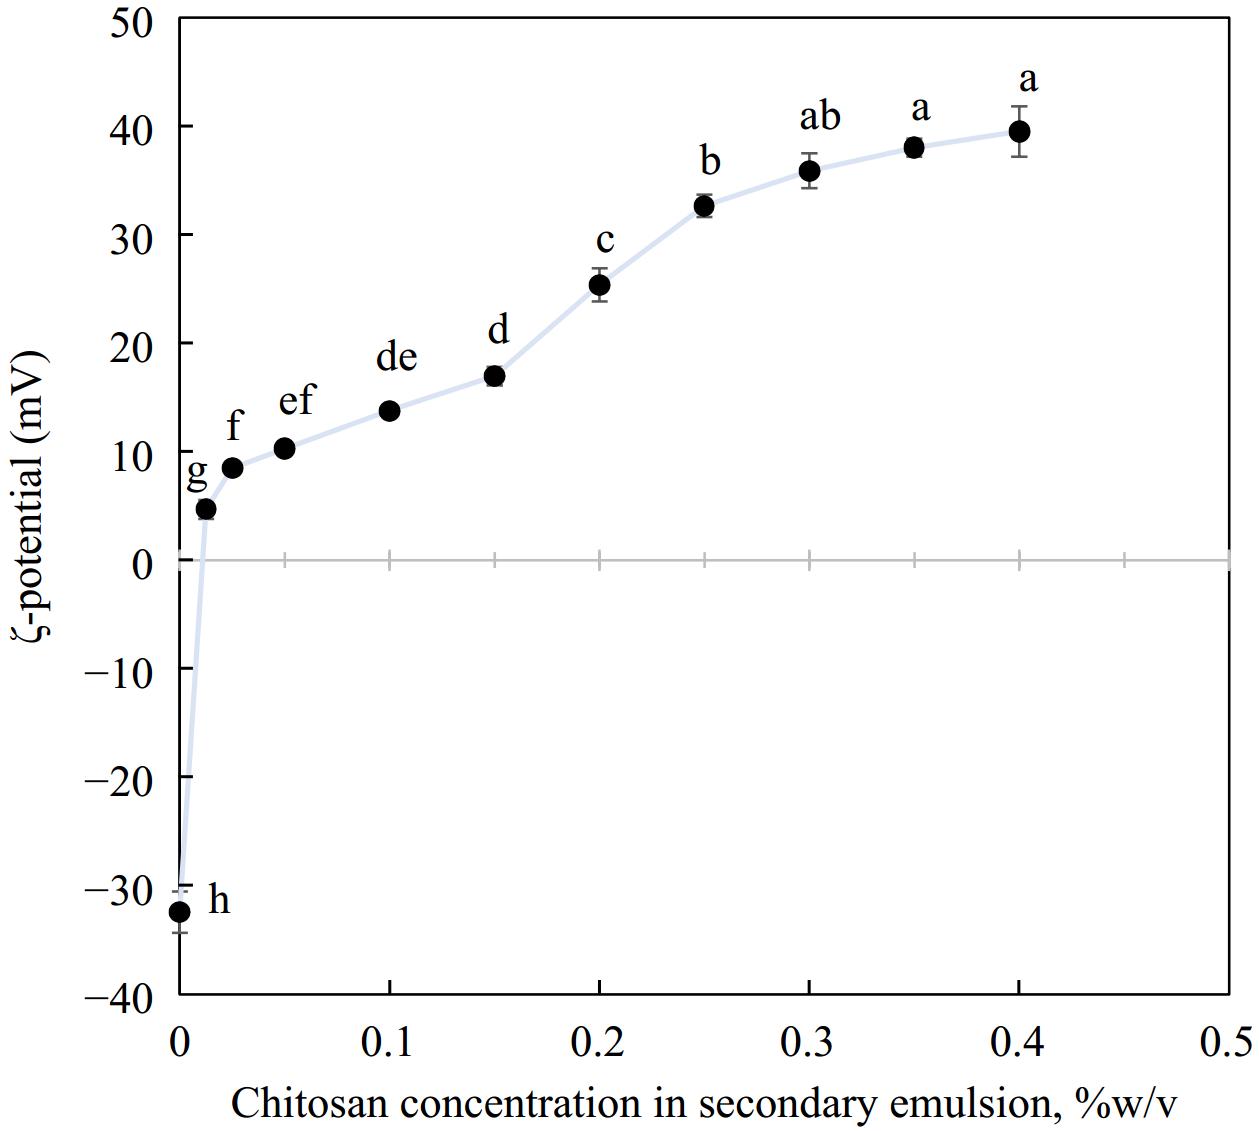
Figure 1.
Charge reversal when secondary biopolymer chitosan was deposited over a primary emulsion interface, n = 3. Different letters represent significant difference at p < 0.05.
-
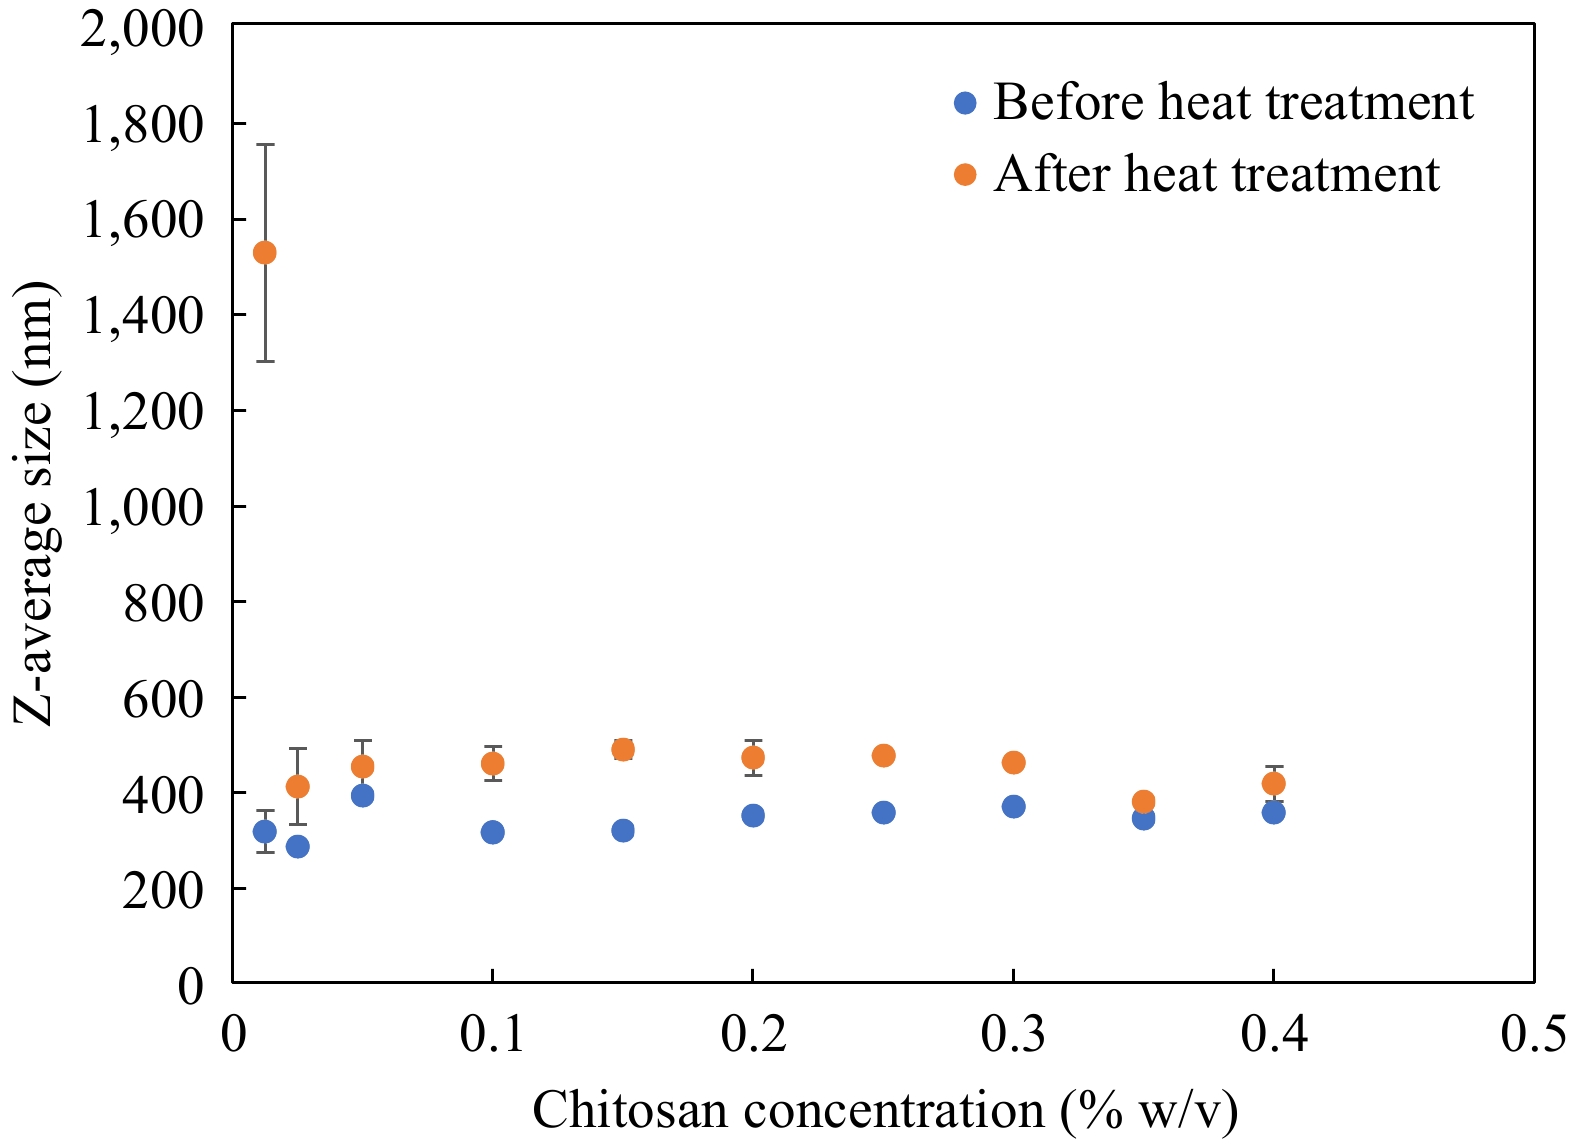
Figure 2.
Change in Z-average size of emulsions before and after heat treatment at 121 °C for 60 min, n = 3. Error bars represent standard deviation.
-
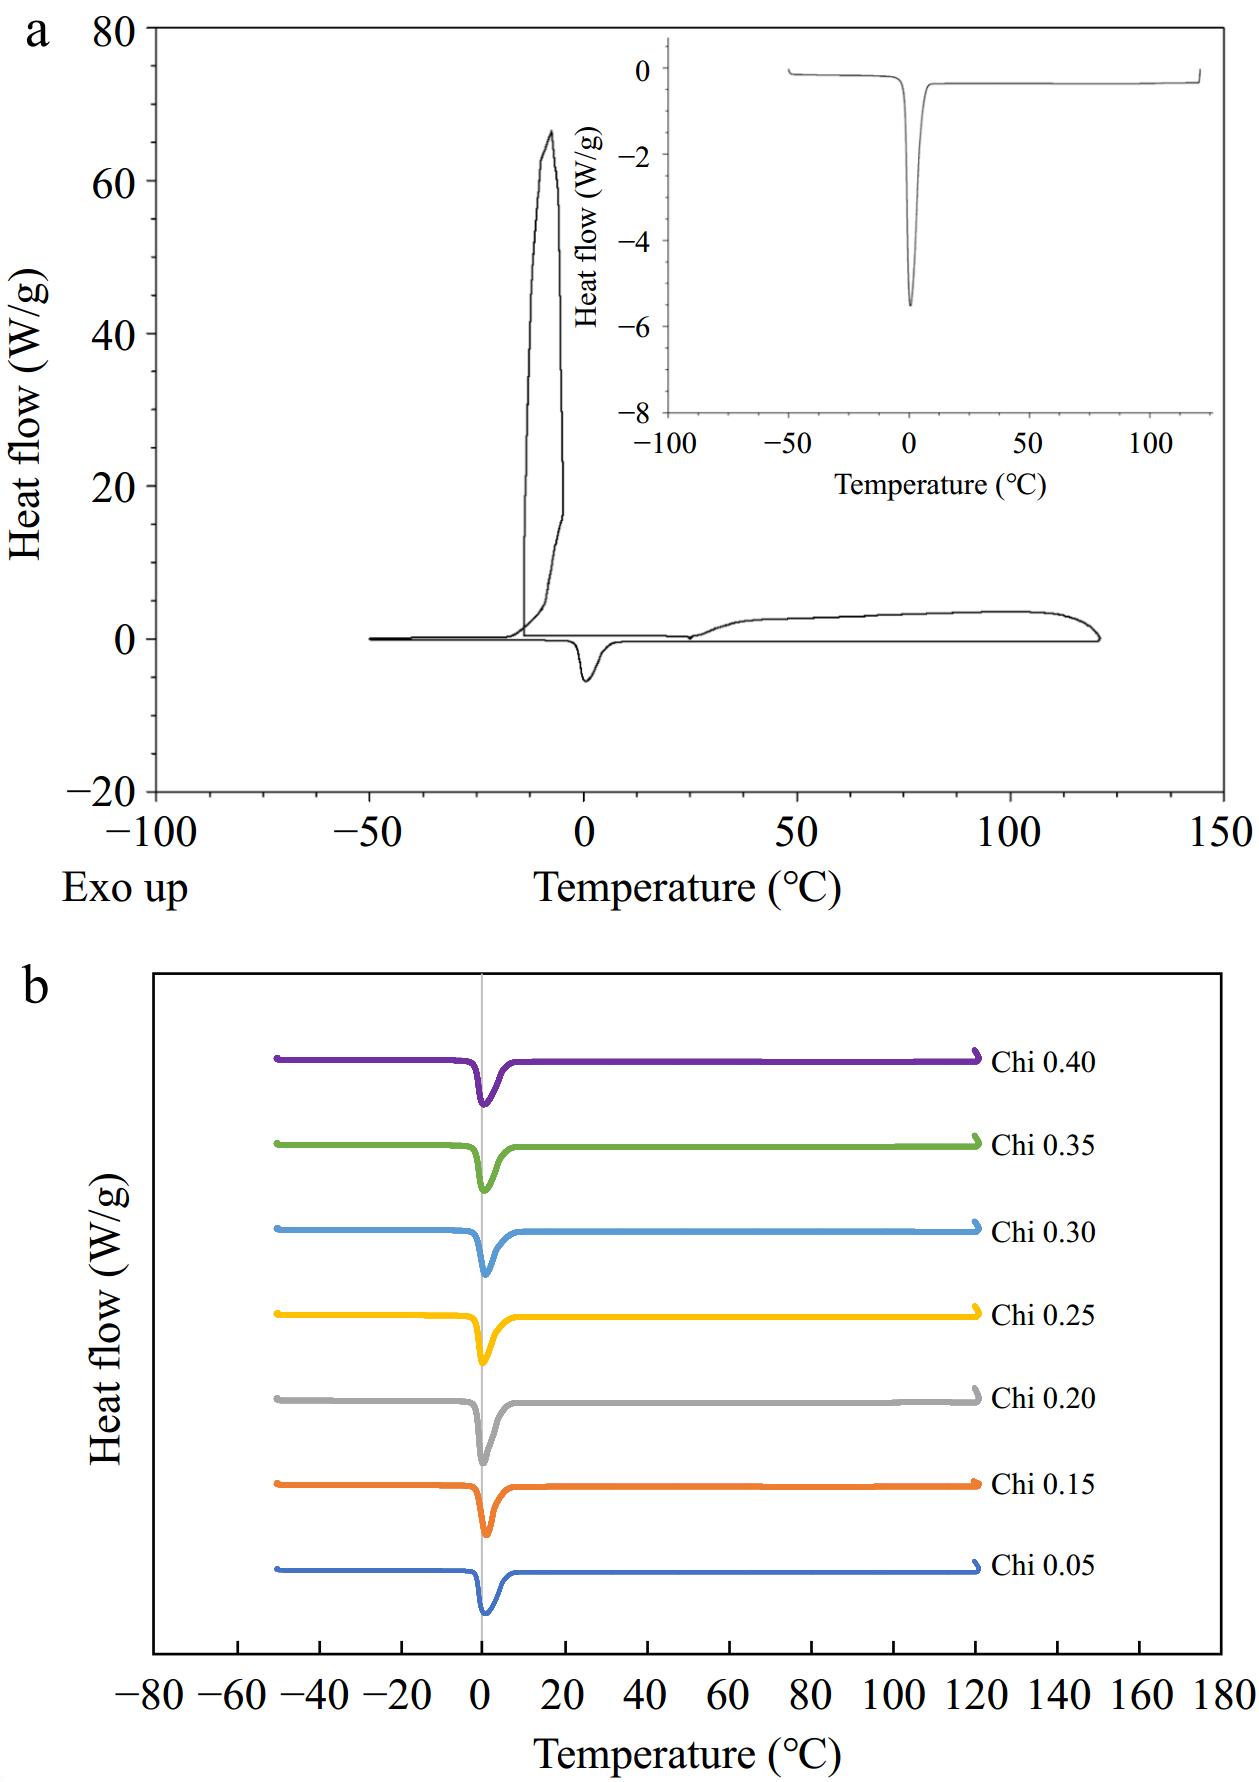
Figure 3.
(a) DSC thermogram of emulsions (0.35% final chitosan concentration) showing characteristic peak for crystallization and melting of water. Inset represents part of the thermogram that was heated from –50 to 121 °C. (b) Stacked thermograms subjected to temperature extremes, ~ –50 to 121 °C, for comparison of varying concentration of emulsifier.
-
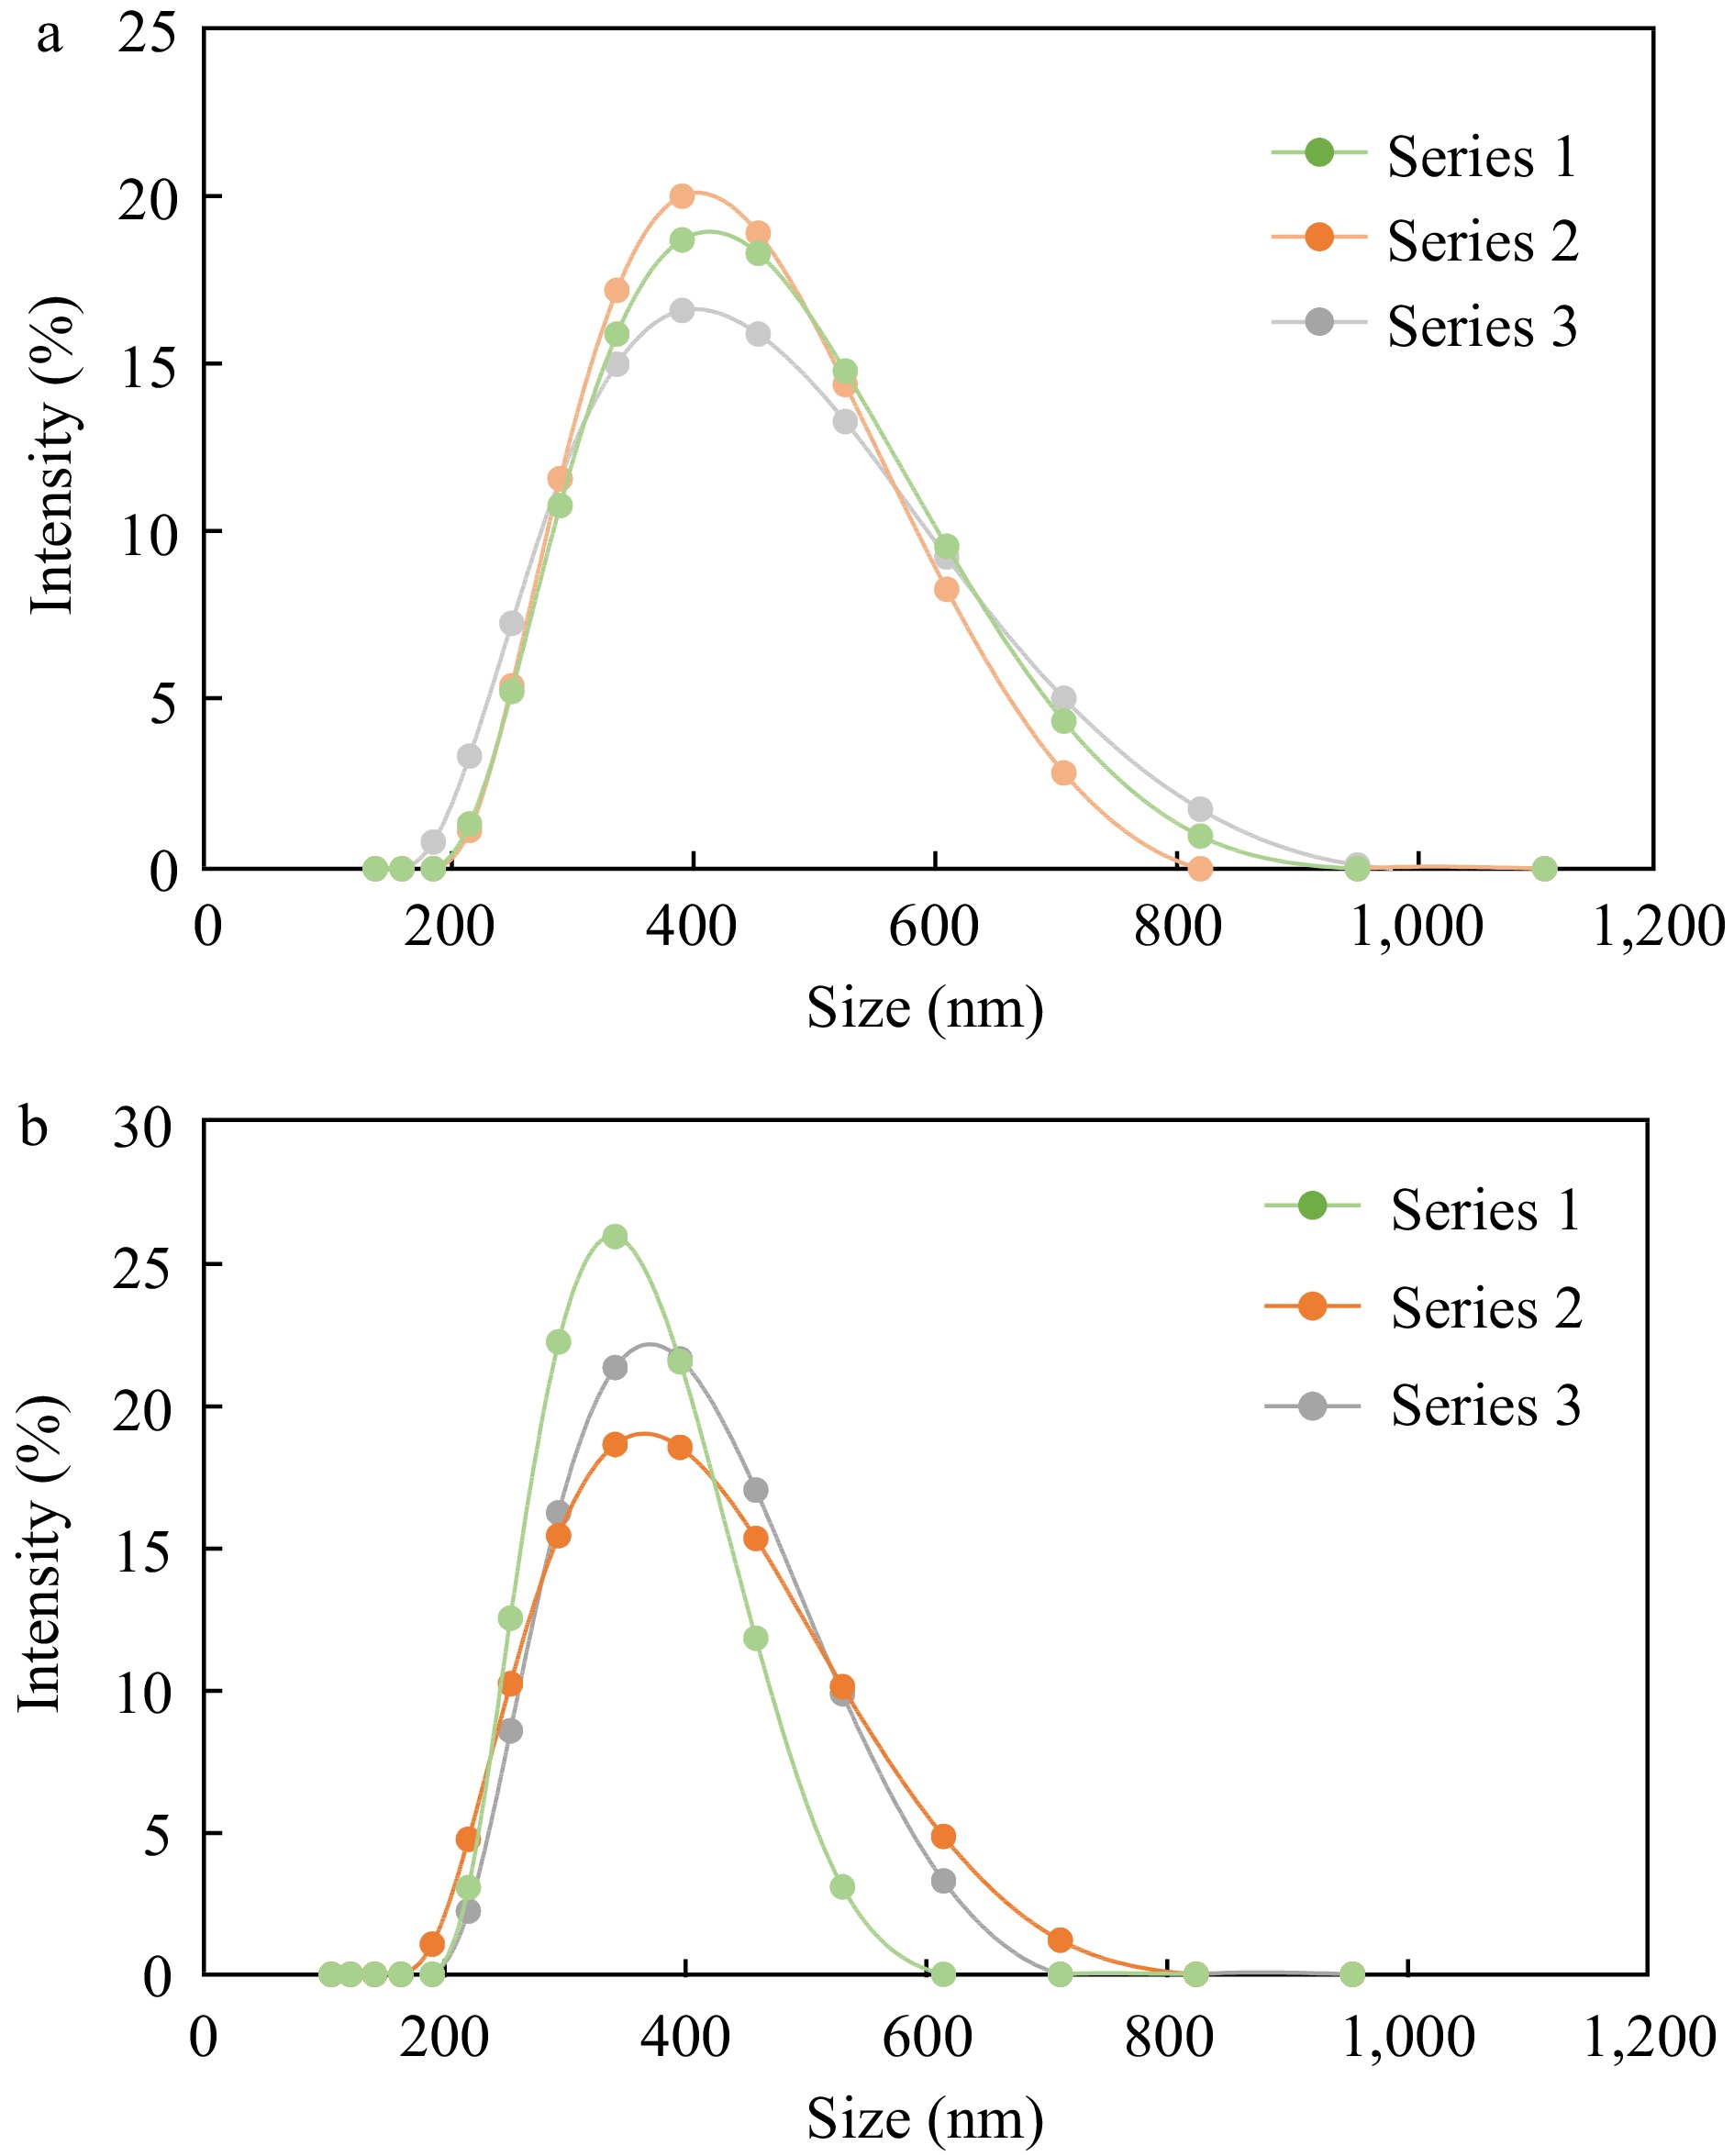
Figure 4.
Particle size distribution of (a) untreated and (b) heat treated emulsions prepared with the same concentration of chitosan (0.35%). Each chart displays distribution of three replicates (Series 1, 2 and 3).
-
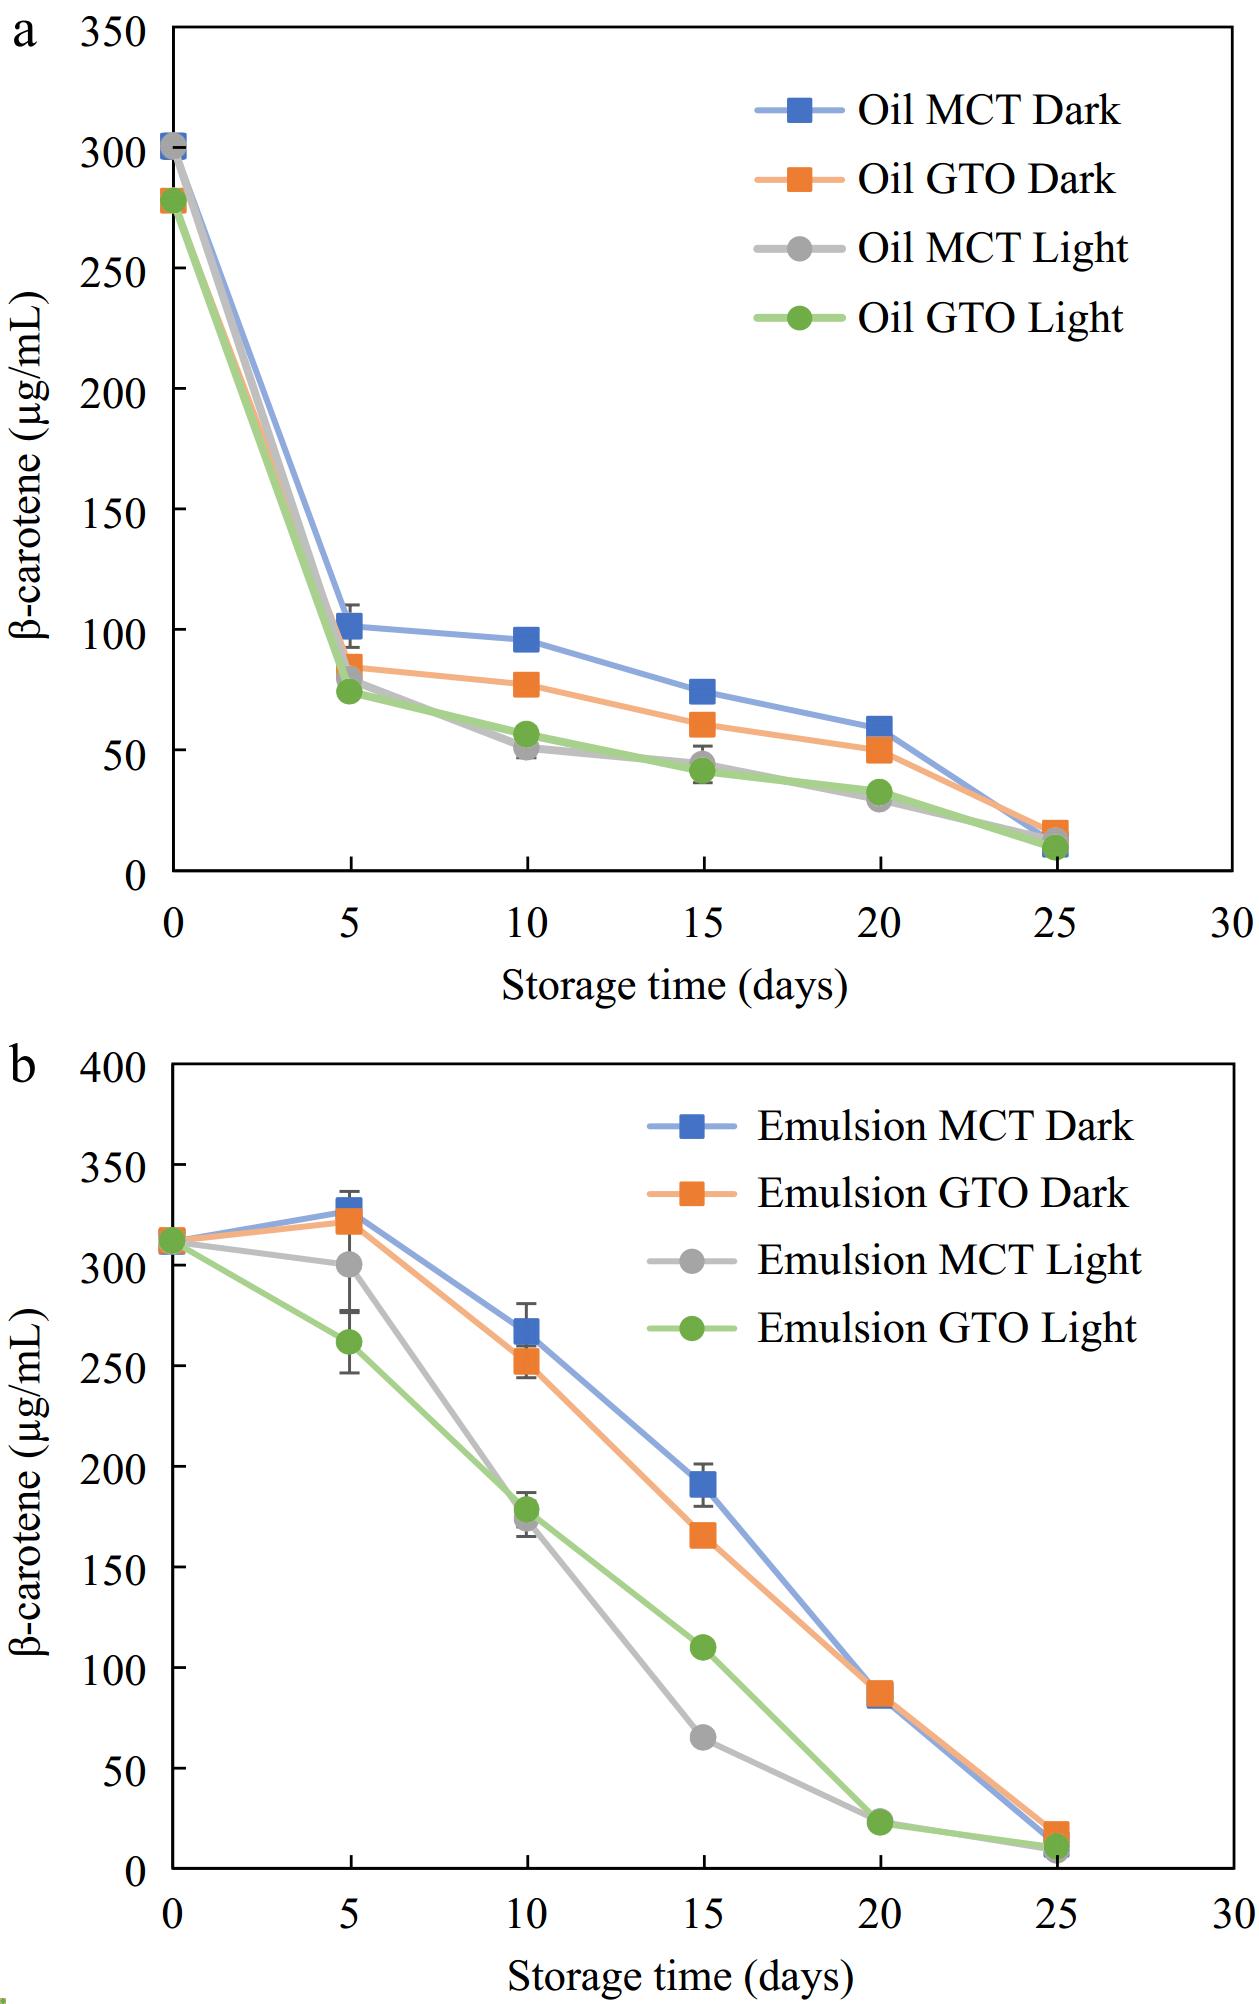
Figure 5.
β-carotene degradation in (a) bulk oils and (b) emulsions during storage at 37 °C, n = 4.
-
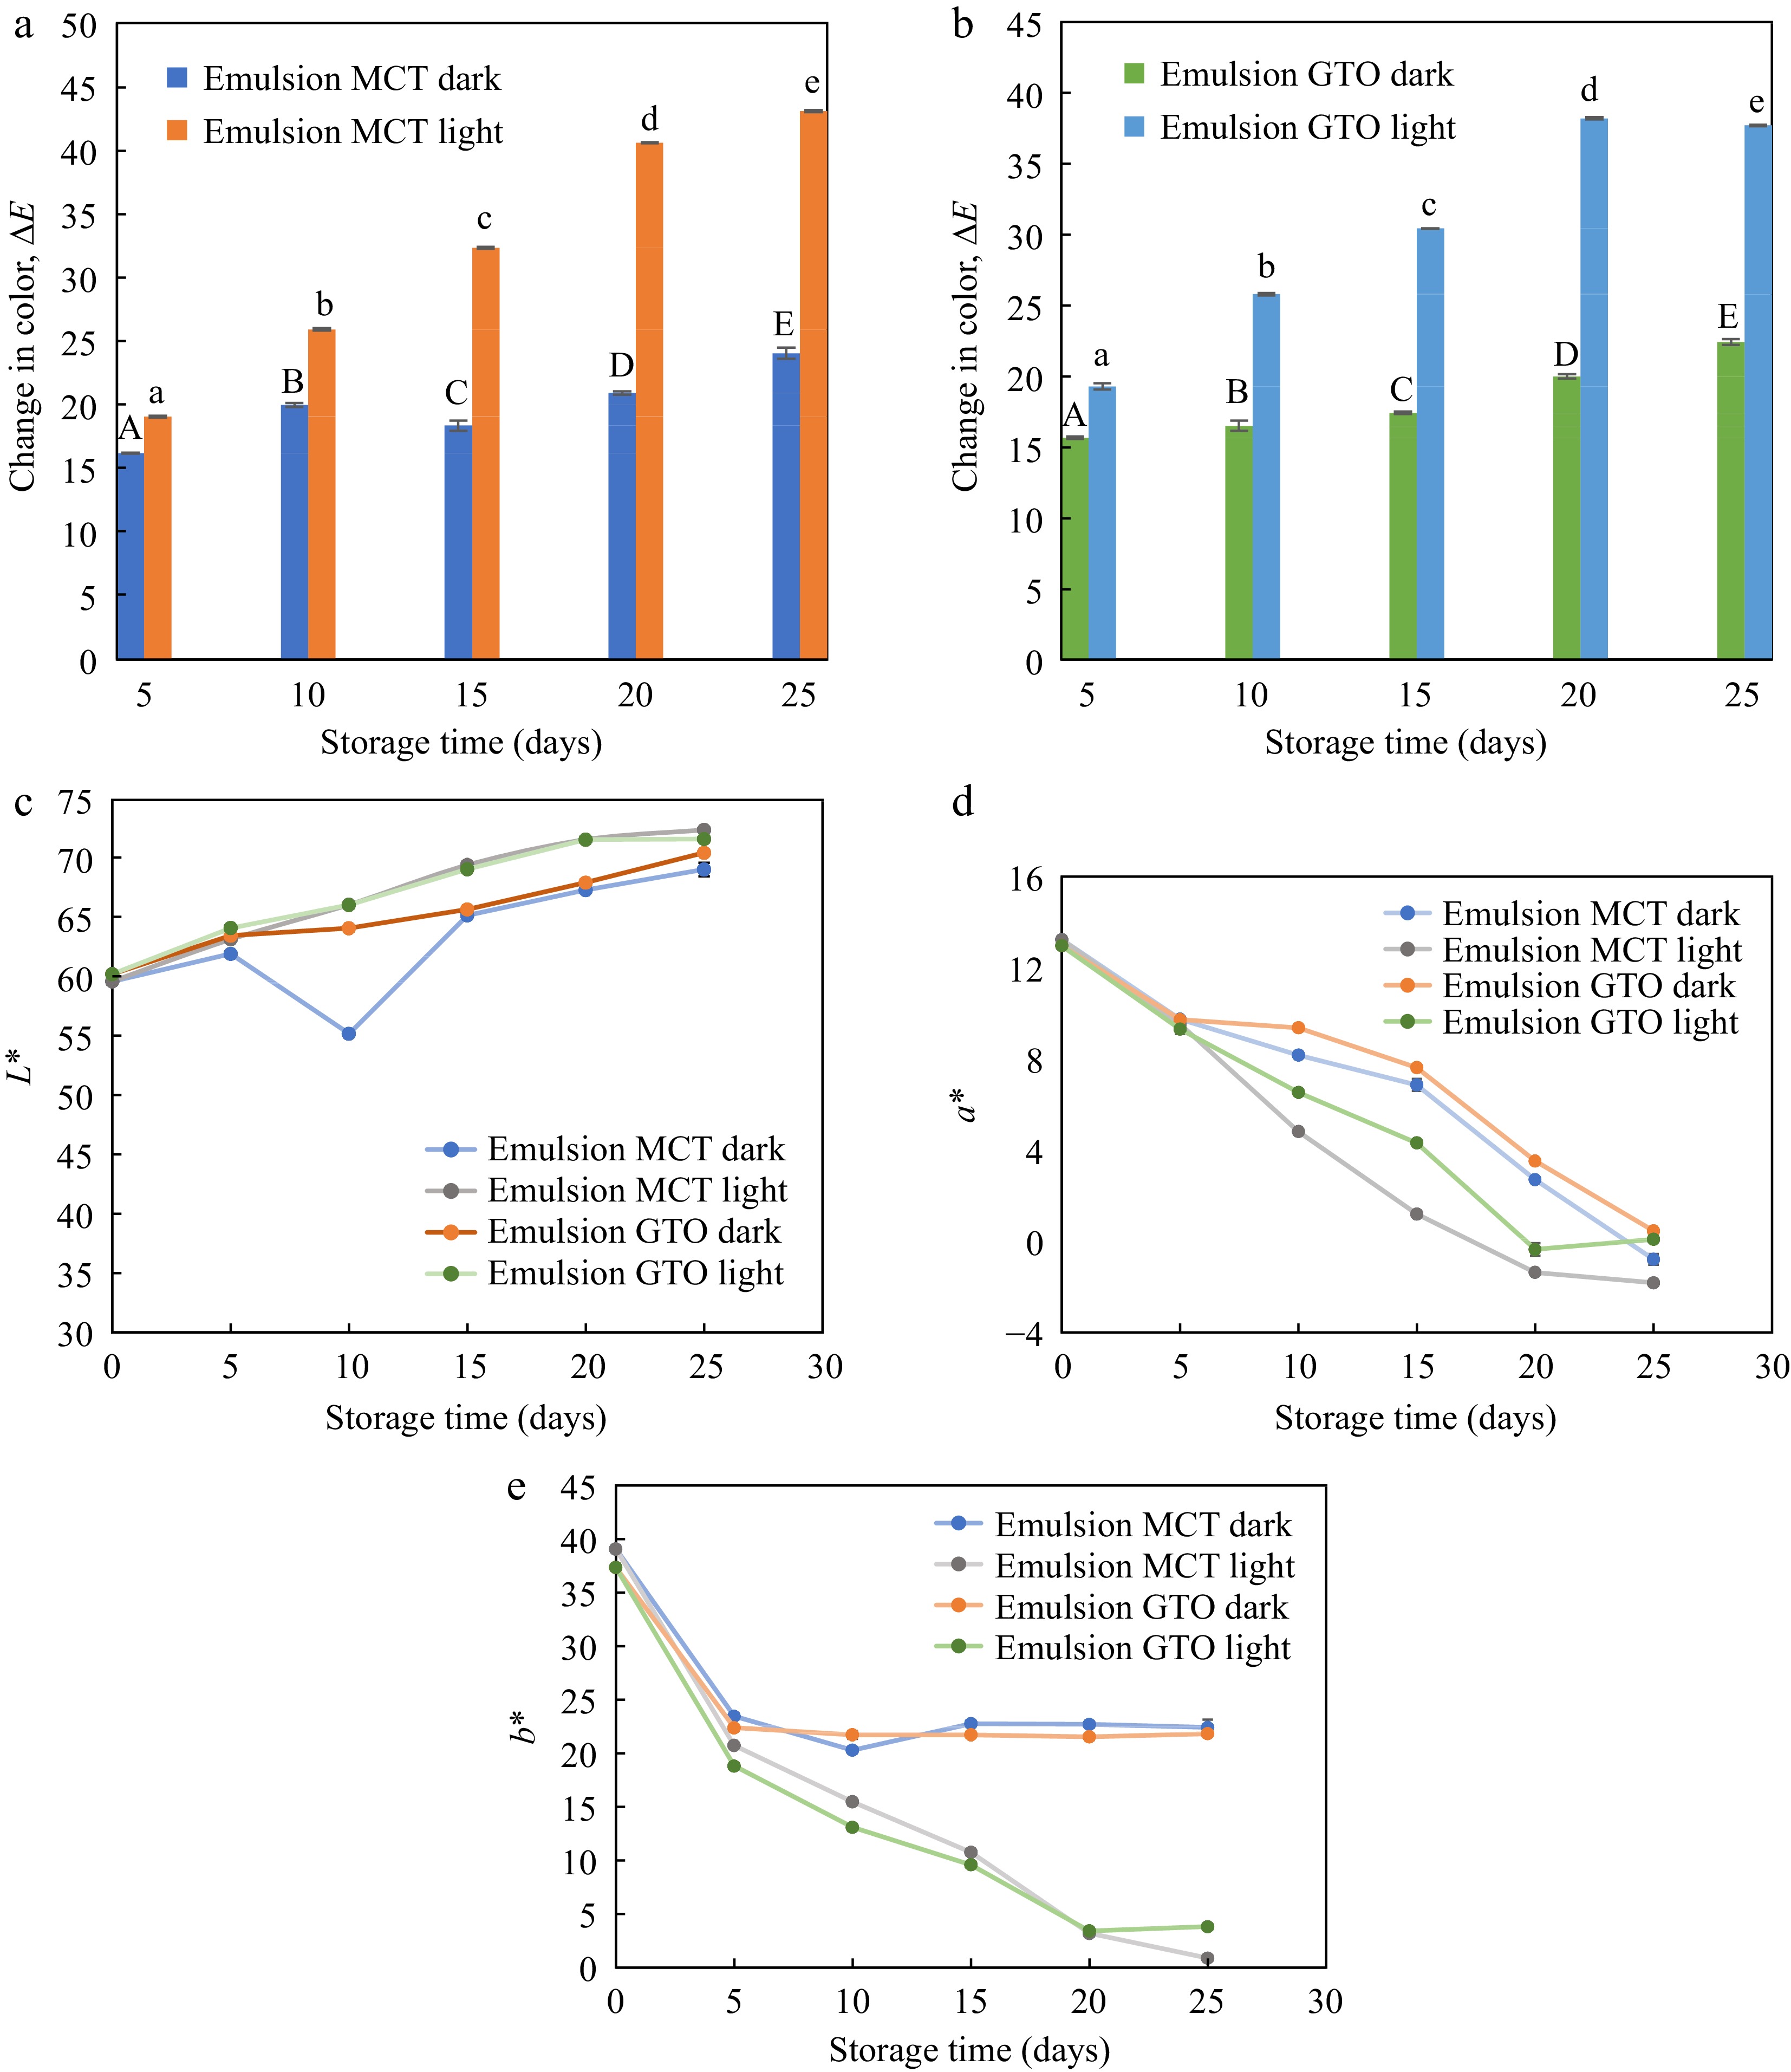
Figure 6.
Change in color of emulsions with (a) MCT carrier oil, and (b) GTO carrier oil subjected to storage under dark and light condition. Components (c) L*, (d) a*, and (e) b* of CIELAB color coordinates during storage at 37 °C, n = 3.
-
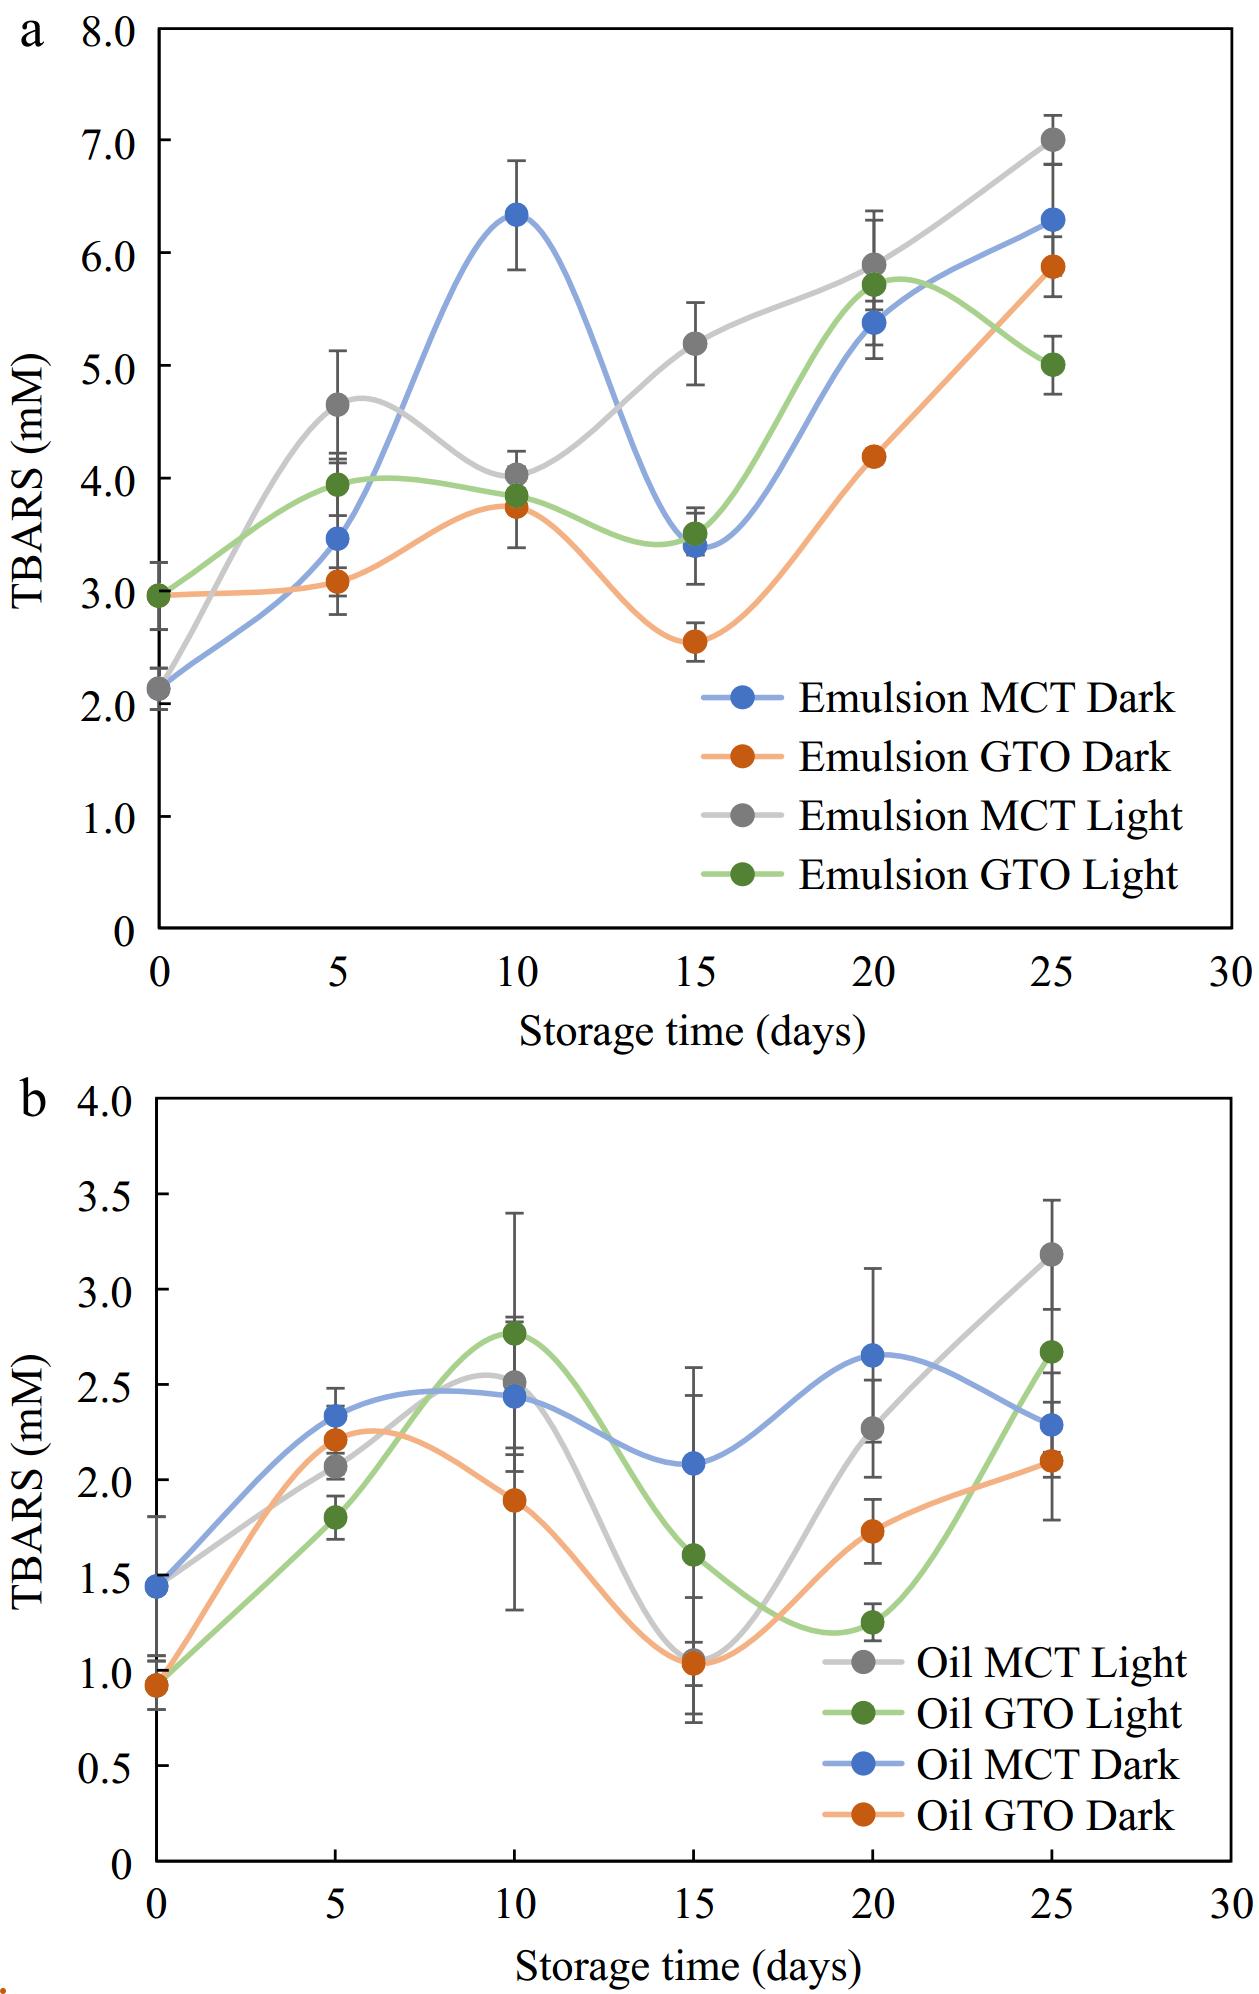
Figure 7.
Secondary oxidation products TBARS measured for (a) emulsions and, (b) their respective bulk oils stored in light and dark storage at 37 °C, n = 4.
-
OSA-starch concentration
(% w/v)Z-average size
(nm)ζ-potential
(mV)1.0 255 ± 28.3a −30.5 ± 1.3A 1.3 249 ± 8.2a −30.0 ± 2.9A 1.7 244 ± 1.5a −30.6 ± 2.4A 2.0 258 ± 0.6a −31.6 ± 2.1A 2.5 244 ± 1.4a −30.2 ± 1.9A Note: Means with same superscript are not significantly (p > 0.05) different. Table 1.
Z-average size and ζ-potential of primary emulsions prepared with varying concentrations of OSA starch (n ≥ 3).
-
Dark Light R2 k (μg mL−1 day−1) R2 k (μg mL−1 day−1) Oil MCT 0.726 9.13 0.632 9.13 GTO 0.675 8.18 0.648 8.47 Emulsions MCT 0.925 13.1 0.930 14.0 GTO 0.950 13.0 0.978 13.1 All samples were stored at an accelerated storage of 37 °C. Table 2.
Zeroth order rate constants of β-carotene dissolved in oil and dispersed in emulsified form to storage in dark vs photodegradation.
-
Dark Light R2 k (day−1) R2 k (day−1) Oil MCT 0.833 0.106 0.916 0.109 GTO 0.870 0.093 0.906 0.112 Emulsions MCT 0.746 0.119 0.943 0.152 GTO 0.800 0.102 0.904 0.143 All samples were stored at an accelerated storage of 37 °C. Table 3.
First order rate constants of β-carotene dissolved in oil and dispersed in emulsified form subjected to storage in dark vs photodegradation.
-
Dark Light R2 k (mL μg−1 day−1) R2 k (mL μg−1 day−1) Oil MCT 0.933 0.0006 0.979 0.0014 GTO 0.930 0.0008 0.985 0.0013 Emulsions MCT 0.699 0.0004 0.738 0.0018 GTO 0.768 0.0004 0.622 0.0018 All samples were stored at an accelerated storage of 37 °C. Table 4.
Second order rate constants of β-carotene dissolved in oil and dispersed in emulsified form subjected to storage in dark vs photodegradation.
Figures
(7)
Tables
(4)