-
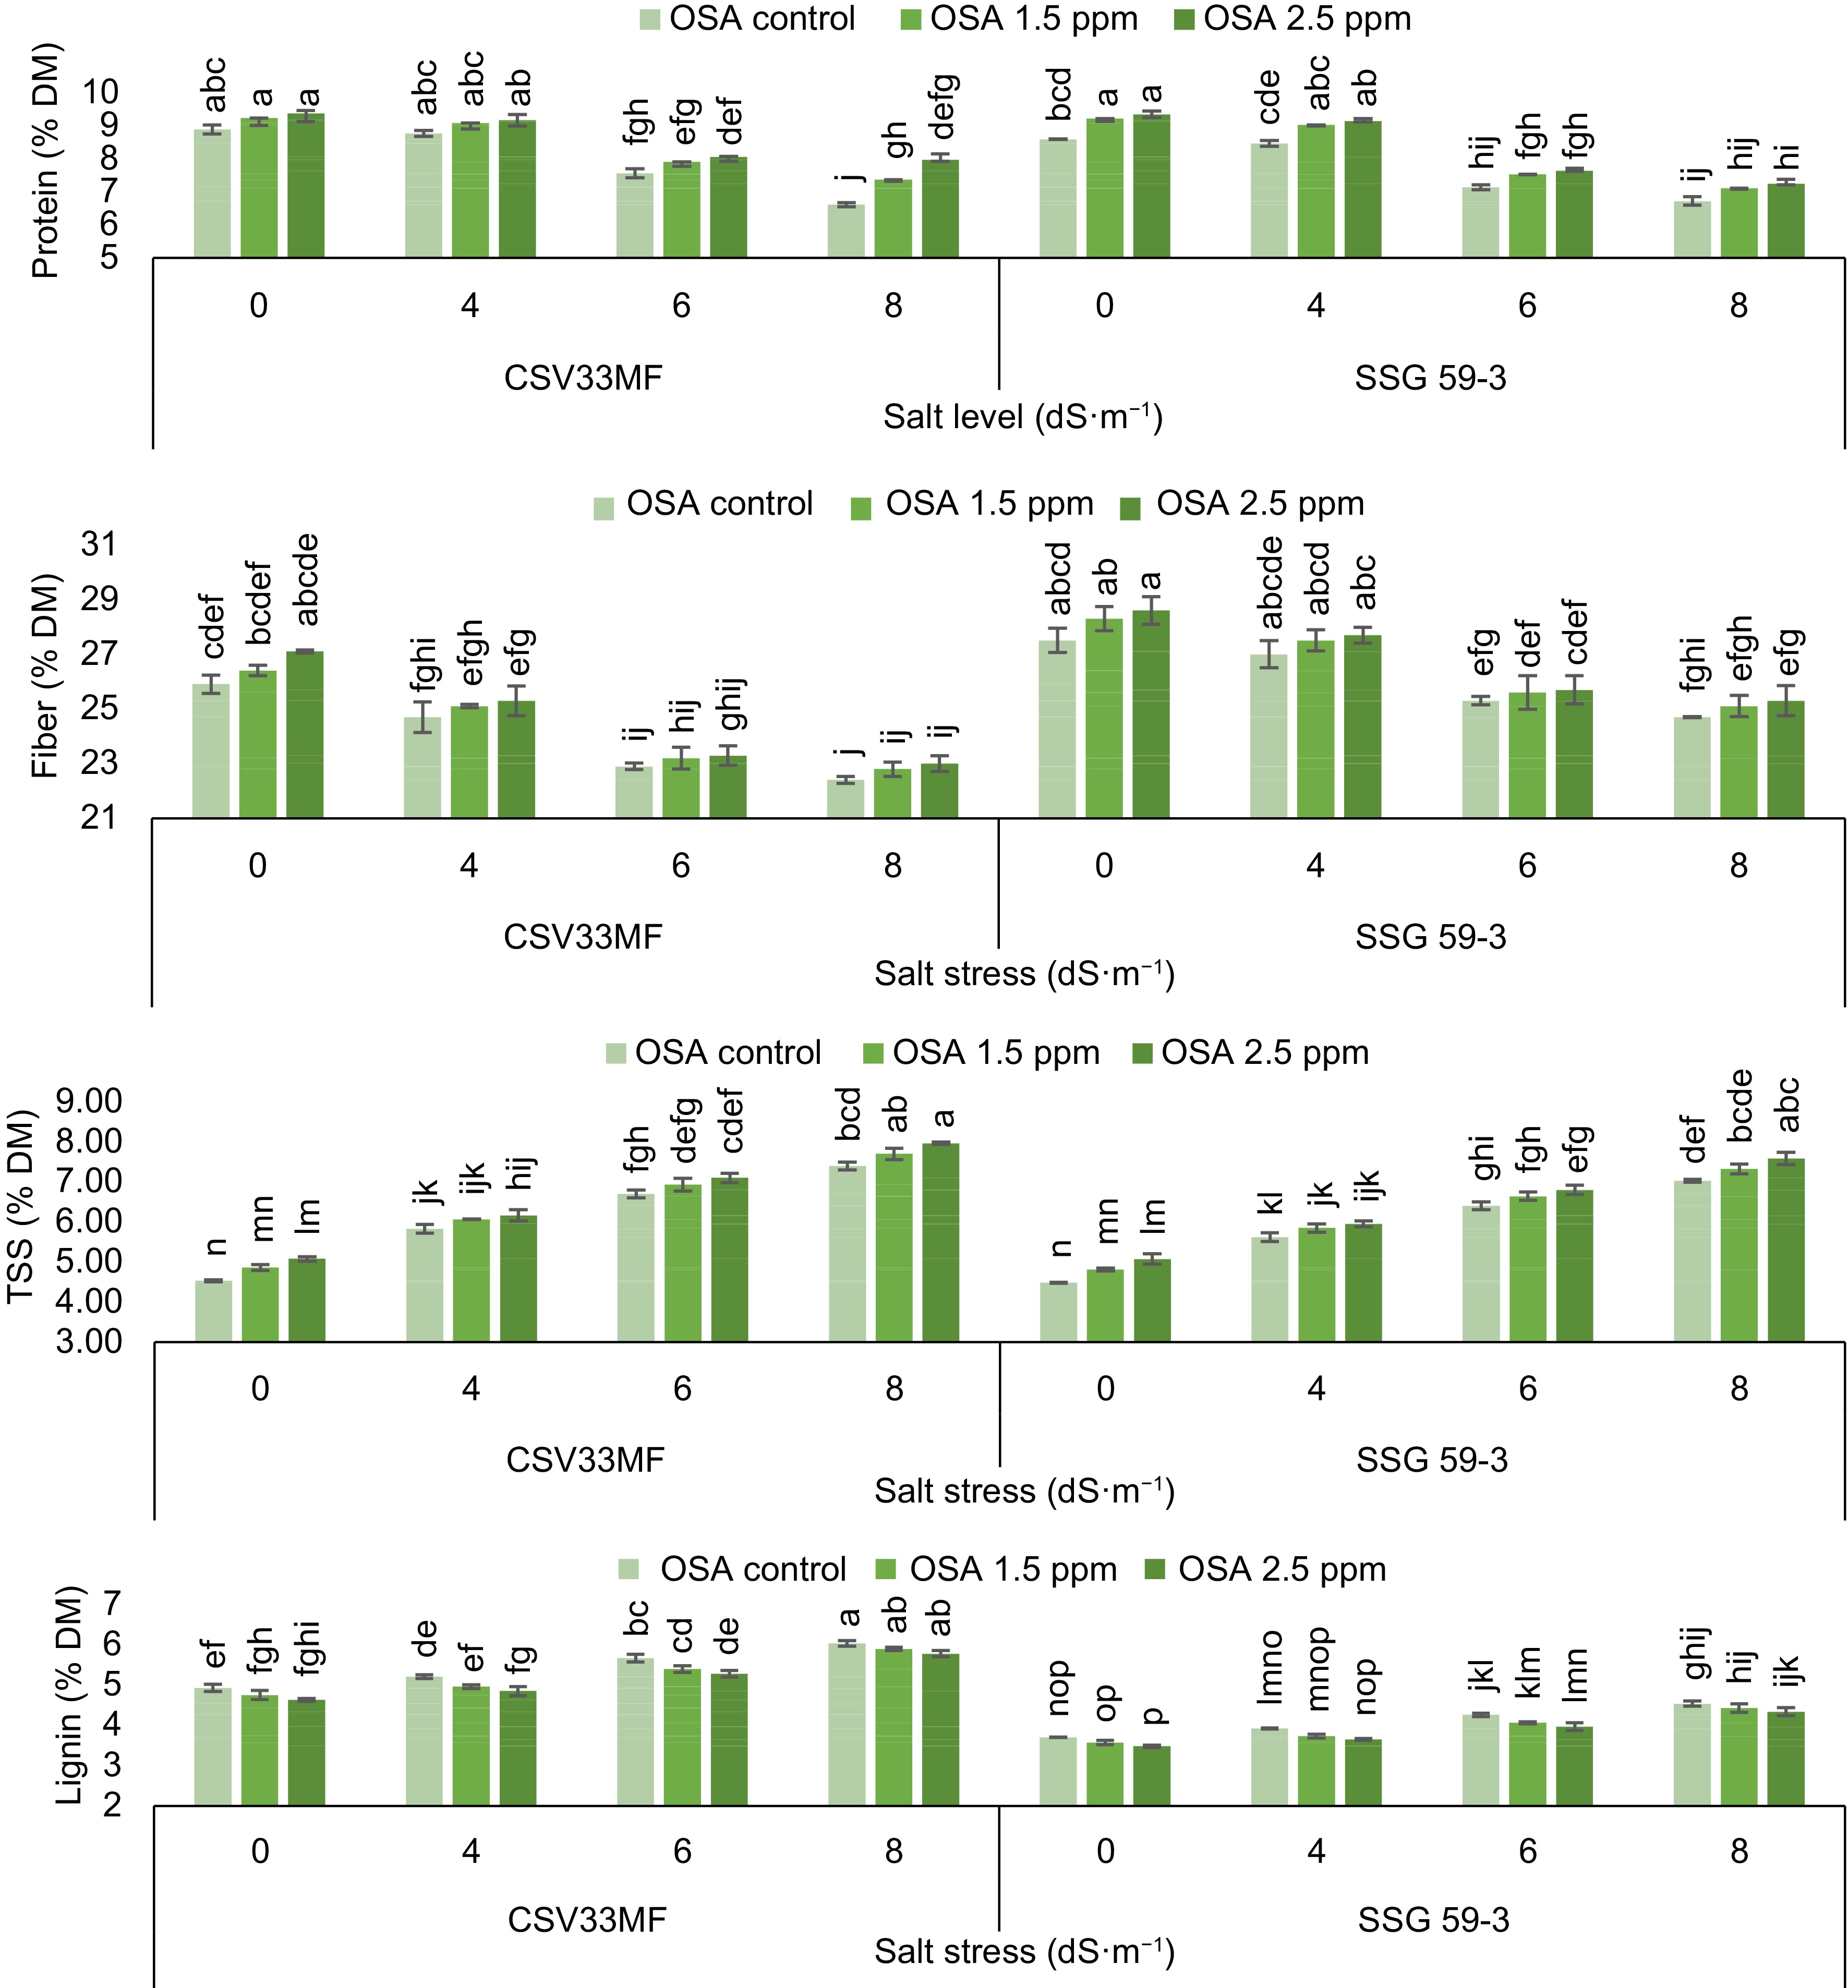
Figure 1.
Effect of ortho-silicic acid (OSA) on protein (% DM), fiber (% DM), Total Soluble Sugar (TSS) (% DM) and lignin (% DM) of Sorghum genotypes CSV33MF and SSG 59-3 grown under different levels of salt stress at 40 DAS. Data having the same letters in the column do not differ significantly while groups with different letters suggest a significant difference (Tukey's HSD test p < 0.05) with error degree of freedom = 48.
-
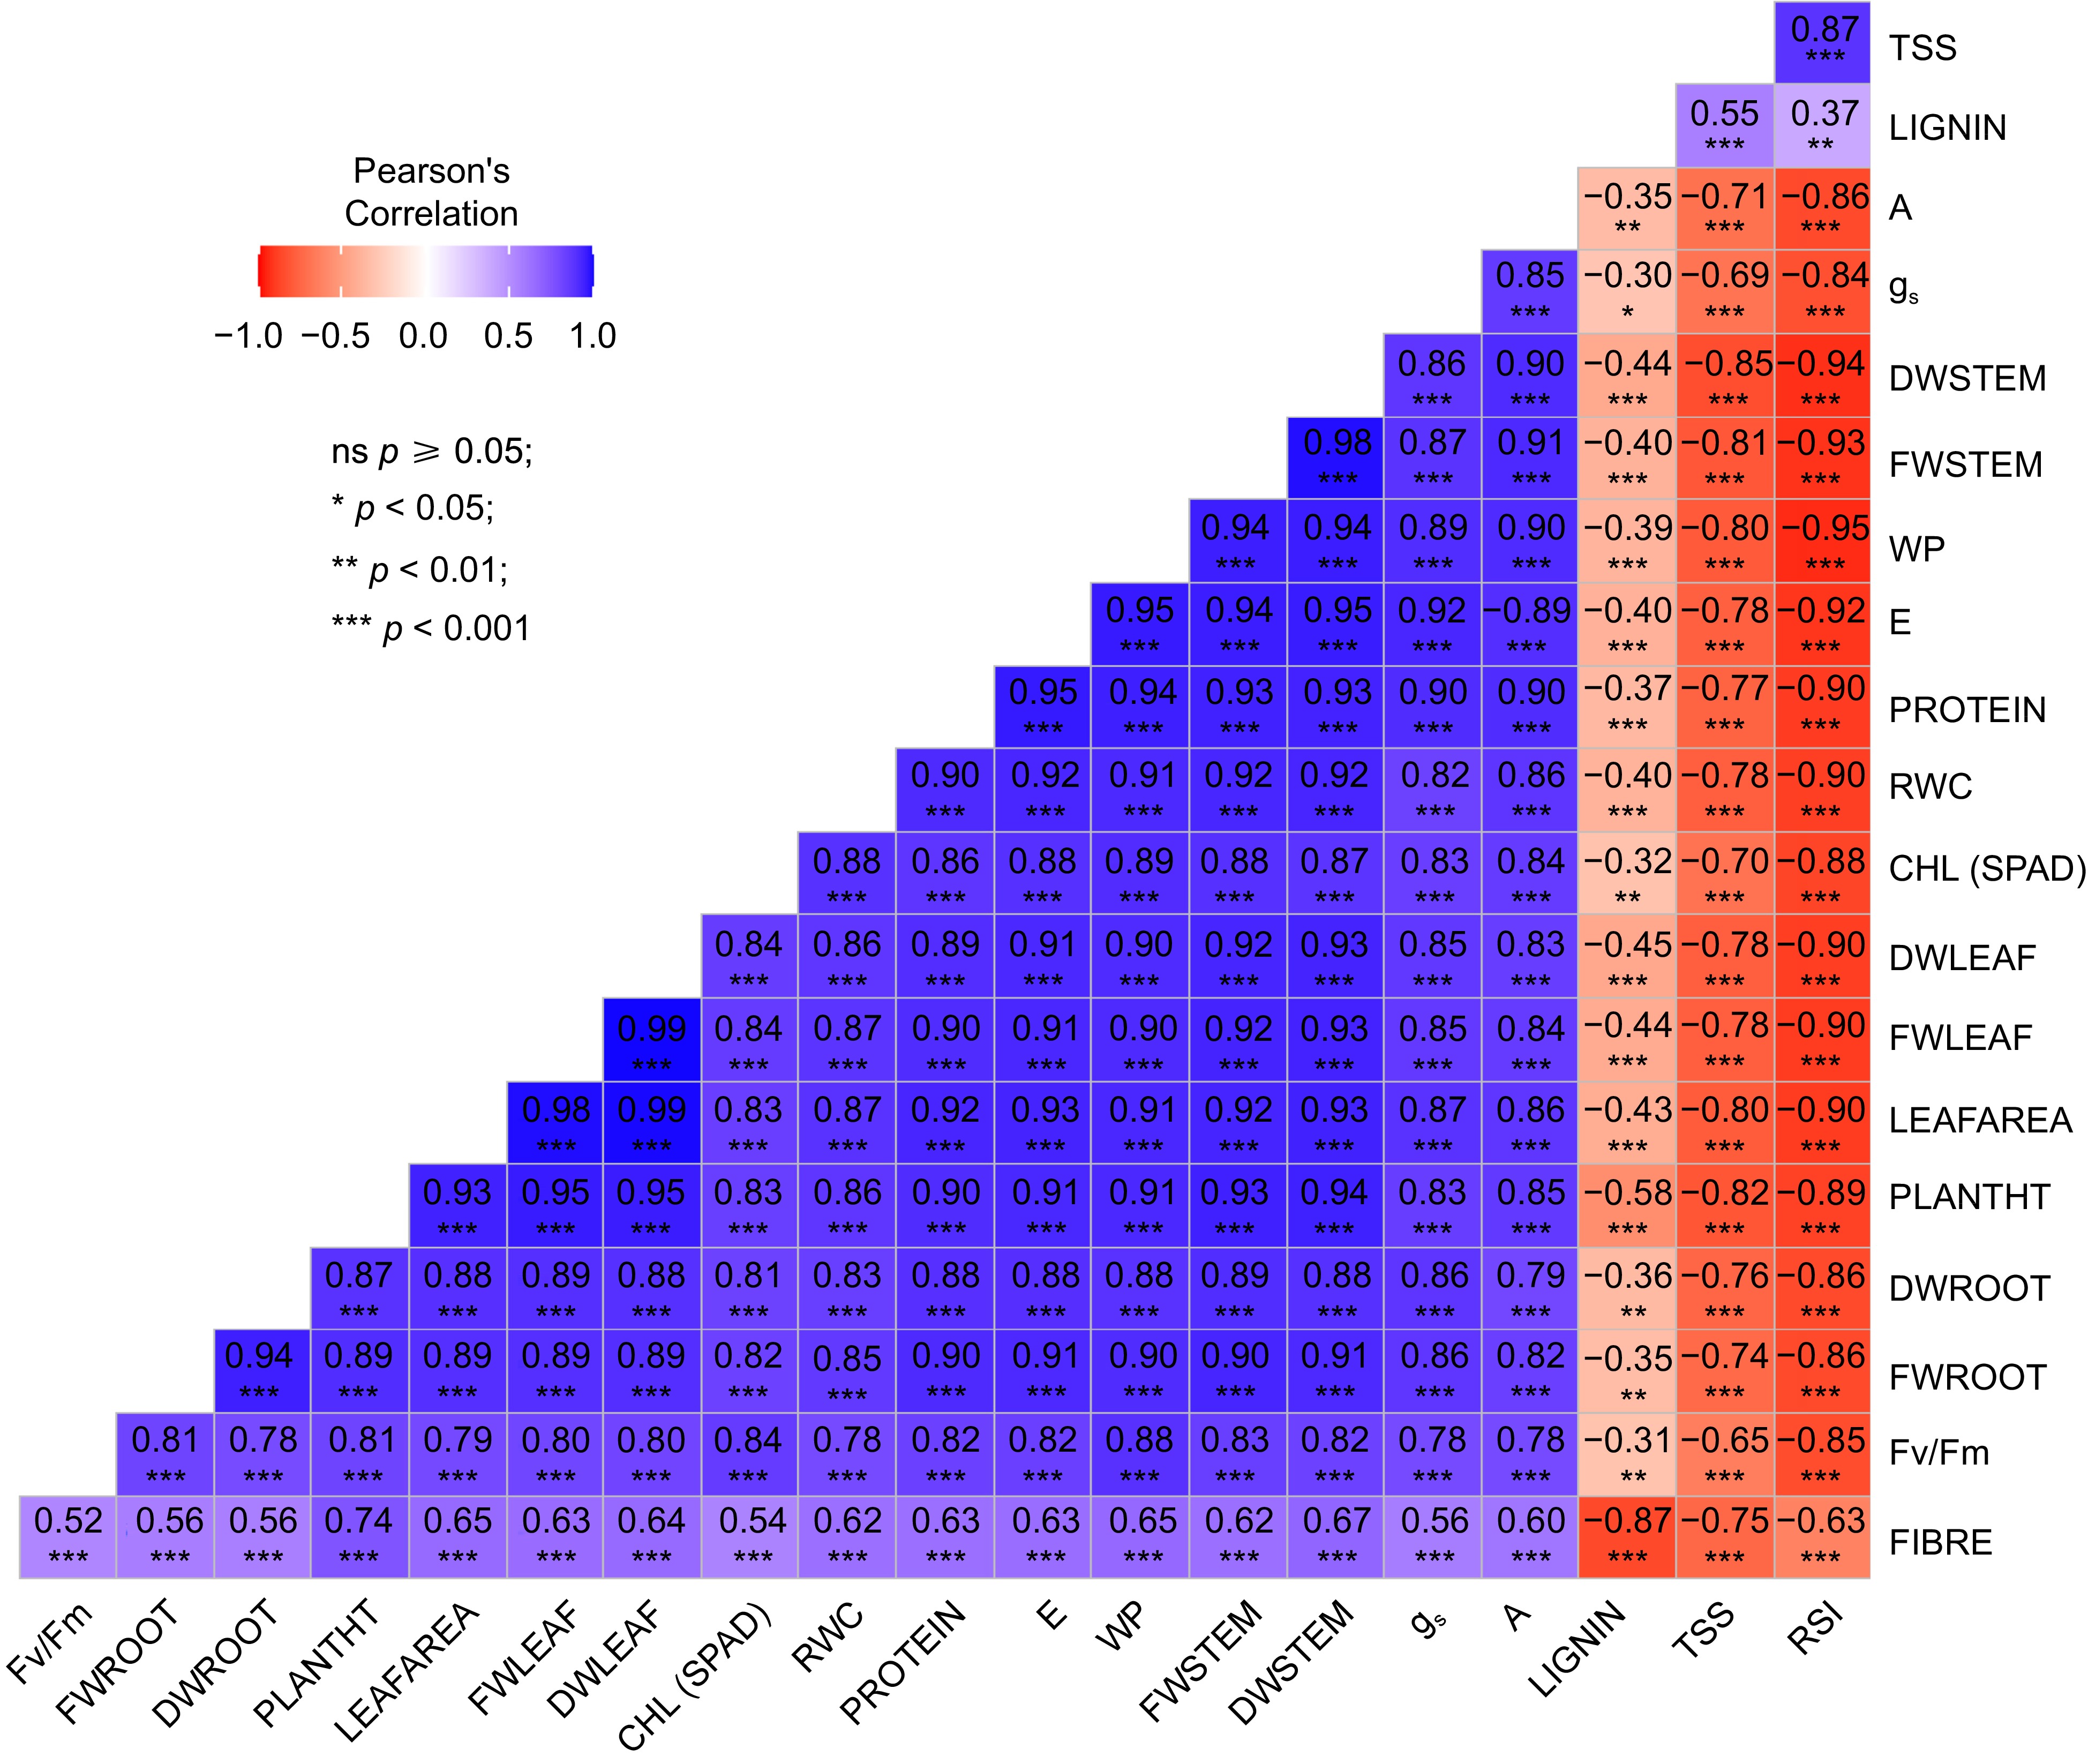
Figure 2.
Pattern of correlation and level of significance observed among different traits across all the treatments in both sorghum genotypes. TSS (Total Soluble Sugar), PROTEIN, FIBRE, LIGNIN, A (Assimilation Rate), gs (Stomatal Conductance), DW (Dry Weight of Stem, Leaf and Root), FW (Fresh Weight of Stem, Leaf and Root), WP (Water Potential), E (Transpiration Rate), RWC (Relative Water Content); PLANTHT (Plant Height), Fv/Fm (Chlorophyll Fluoroscence), CHL (Chlorophyll Content).
-
Salt level OSA
(mg·L−1)FWS
(g·plant−1)FWL
(g·plant−1)FWR
(g·plant−1)PH
(cm)DWS
(g·plant−1)DWL
(g·plant−1)DWR
(g·plant−1)LA
(cm2)0 dS·m−1 0 29.73cd ± 0.64 11.40bc ± 0.55 10.06abcd ± 0.29 114.0ab ± 8.39 9.01bc ± 0.19 2.84abc ± 0.14 3.05abc ± 0.09 689.0abc ± 33.4 1.5 33.90ab ± 0.55 12.50ab ± 0.47 11.66ab ± 0.23 129.7a ± 4.18 9.97ab ± 0.16 3.12ab ± 0.12 3.38ab ± 0.08 756.6ab ± 28.7 2.5 34.83a ± 0.46 13.76a ± 0.61 12.13a ± 0.27 136.0a ± 5.29 10.85a ± 0.14 3.43a ± 0.15 3.67a ± 0.07 832.0a ± 35.2 4 dS·m−1 0 28.20de ± 0.83 11.16bc ± 0.38 9.86bcde ± 0.73 112.0ab ± 3.79 8.26cd ± 0.25 2.70bcd ± 0.18 2.98abc ± 0.22 663.6bc ± 43.4 1.5 30.83bcd ± 0.44 12.06ab ± 0.17 11.43abc ± 0.23 120.3a ± 7.36 9.03bc ± 0.15 2.92abc ± 0.05 3.20ac ± 0.05 717.3ab ± 11.2 2.5 32.26abc ± 0.23 12.56ab ± 0.32 11.76ab ± 0.29 124.3a ± 5.90 9.49abc ± 0.06 3.14ab ± 0.08 3.41ab ± 0.23 769.6ab ± 18.4 6 dS·m−1 0 21.03gh ± 0.43 8.60de ± 0.06 7.80ef ± 0.42 82.6cd ± 4.42 5.81ef ± 0.55 2.18d ± 0.01 2.36cde ± 0.13 479.6de ± 03.0 1.5 24.10fg ± 0.40 9.16d ± 0.55 9.33de ± 0.69 93.0bc ± 1.16 6.50e ± 0.53 2.36cd ± 0.28 2.48cde ± 0.36 499.3d ± 29.6 2.5 25.20ef ± 0.55 9.76cd ± 0.27 9.40cde ± 0.12 95.3bc ± 1.33 6.73de ± 0.38 2.46cd ± 0.07 2.75bcd ± 0.07 548.3cd ± 16.0 8 dS·m−1 0 14.40i ± 1.46 5.56f ± 0.37 5.90f ± 0.32 47.7e ± 2.33 3.85g ± 0.45 1.40e ± 0.05 1.80e ± 0.21 302.0f ± 12.2 1.5 17.00i ± 0.89 6.03f ±0.13 6.76f ± 0.41 58.7de ± 4.33 4.64fg ± 0.27 1.47e ± 0.04 2.01de ± 0.10 318.0f ± 05.0 2.5 17.83hi ± 0.53 6.70ef ±0.15 7.16f ± 0.46 63.0de ± 2.08 4.88fg ± 0.16 1.54e ± 0.01 2.11de ± 0.10 340.0f ± 05.1 MSE 1.43 0.43 0.505 12.5 0.298 0.045 0.085 49.8 C.D 2.03 1.11 1.20 13.9 0.92 0.36 0.49 82.8 S.E (m) 0.69 0.38 0.41 4.74 0.31 0.12 0.17 28.2 S.E (d) 0.98 0.54 0.58 6.71 0.45 0.17 0.24 39.9 Data having the same letters in the column do not differ significantly while groups with different letters suggest a significant difference (Tukey's HSD test p < 0.05) with error degree of freedom = 24; MSE (Mean Square Error) at 5%. * Values are presented as mean ± standard error (n = 3). Table 1.
Effect of ortho-silicic acid (OSA) on fresh weight stem (FWS), fresh weight leaf (FWL), fresh weight root (FWR), plant height (PH), dry weight stem (DWS), dry weight leaf (DWL), dry weight root (DWR) and leaf area (LA) of Sorghum genotype CSV 33MF grown under different levels of salt stress.
-
Salt level OSA
(mg·L−1)FWS
(g·plant−1)FWL
(g·plant−1)FWR
(g·plant−1)PH
(cm)DWS
(g·plant−1)DWL
(g·plant−1)DWR
(g·plant−1)LA
(cm2)0 dS·m−1 0 29.10a ± 0.47 11.53abc ± 1.47 10.03abc ± 0.69 118.7b ± 4.8 8.82b ± 0.14 2.88ab ± 0.37 3.04ab ± 0.21 697.0c ± 31.5 1.5 31.57a ± 0.69 13.77a ± 0.76 10.56ab ± 0.32 132.3ab ± 1.3 9.55ab ± 0.20 3.42a ± 0.18 3.23ab ± 0.14 829.0ab ± 15.6 2.5 32.56a ± 0.54 13.97a ± 0.43 11.23a ± 1.02 140.0a ± 2.5 10.47a ± 0.42 3.63a ± 0.12 3.38a ± 0.40 879.0a ± 19.7 4 dS·m−1 0 27.73ab ± 1.65 11.27abc ± 1.33 9.67abc ± 0.57 116.7bc ± 4.1 8.06bc ± 0.51 2.82abc ± 0.33 2.92ab ± 0.33 681.7c ± 23.7 1.5 29.67a ± 1.30 12.50ab ± 0.35 11.10a ± 0.35 128.0ab ± 2.9 8.58b ± 0.40 3.12a ± 0.08 3.14ab ± 0.10 755.0bc ± 19.9 2.5 31.80a ± 1.67 13.30a ± 0.50 10.26ab ± 0.30 132.3ab ± 0.9 9.01ab ± 0.41 3.32a ± 0.12 3.21ab ± 0.19 804.0ab ± 30.1 6 dS·m−1 0 19.27cd ± 0.38 8.03cdef ± 0.70 7.67cdef ± 0.24 87.0d ± 1.5 5.77d ± 0.12 1.94cdef ± 0.17 2.29bc ± 0.16 360.7de ± 16.2 1.5 21.60c ± 0.66 8.50cde ± 0.45 8.40bcde ± 0.32 98.0d ± 1.5 6.29d ± 0.16 2.06bcde ± 0.11 2.42abc ± 0.12 389.3d ± 03.2 2.5 22.90bc ± 1.78 8.93bcd ± 0.43 8.83abcd ± 0.09 100.7cd ± 5.1 6.56cd ± 0.37 2.18bcd ± 0.13 2.57abc ± 0.23 434.7d ± 14.8 8 dS·m−1 0 12.60e ± 0.50 4.30f ± 0.25 5.70f ± 0.40 53.3e ± 1.2 3.75e ± 0.22 1.12f ± 0.07 1.66c ± 0.08 247.7f ± 17.0 1.5 14.37de ± 0.68 4.63ef ± 0.73 5.87ef ± 0.18 62.7e ± 1.6 4.04e ± 0.21 1.23ef ± 0.09 1.72c ± 0.15 269.0ef ± 25.5 2.5 15.90de ± 0.47 5.07def ± 0.72 6.77def ± 0.46 66.0e ± 2.8 4.21e ± 0.04 1.28def ± 0.10 1.85c ± 0.06 284.7ef ± 08.1 MSE 3.22 1.76 0.772 22.9 0.272 0.100 0.123 19.82 C.D 3.04 2.25 1.49 9.28 0.88 0.54 0.60 59.8 S.E (m) 1.04 0.77 0.51 3.16 0.30 0.18 0.20 20.4 S.E (d) 1.46 1.08 0.72 4.47 0.43 0.26 0.29 28.8 Data having the same letters in the column do not differ significantly while groups with different letters suggest a significant difference (Tukey's HSD test p < 0.05) with error degree of freedom = 24; MSE (Mean Square Error) at 5%. * Values are presented as mean ± standard error (n = 3). Table 2.
Effect of ortho-silicic acid (OSA) on fresh weight stem (FWS), fresh weight leaf (FWL), fresh weight root (FWR), plant height (PH), dry weight stem (DWS), dry weight leaf (DWL), dry weight root (DWR) and leaf area (LA) of Sorghum genotype SSG 59-3 grown under different levels of salt stress.
-
Salt level OSA (mg·L−1) Ψw (MPa) RWC (%) RSI (%) E (mmol H2O·m−1·s−1) gs (mmol H2O·m−1·s−1) A (μmol CO2·m−1·s−1) CHLF (Fv/Fm) CHL (SPAD) 0 dS·m−1 0 −0.673bc ± 0.023 84.45abc ± 5.49 11.13f ± 0.39 3.58ab ± 0.07 0.103abc ± 0.012 11.12bcd ± 0.80 0.729abc ± 0.011 36.6abc± 4.3 1.5 −0.583ab ± 0.015 85.89ab ± 2.14 10.54f ± 0.72 3.88ab ± 0.25 0.120ab ± 0.010 12.09abc ± 1.10 0.739ab ± 0.001 39.2ab ± 2.6 2.5 −0.496a ± 0.012 87.74a ± 2.10 10.45f ± 0.33 4.14a ± 0.06 0.147a ± 0.009 14.68a ± 0.31 0.772a ± 0.008 42.5a ± 1.4 4 dS·m−1 0 −0.783de ± 0.013 81.19abcd ± 1.98 21.30de ± 2.12 3.35bc ± 0.17 0.093abc ± 0.012 10.78bcd ± 0.53 0.703bcde ± 0.008 33.5bcde± 1.3 1.5 −0.700cd ± 0.012 84.20abc ± 3.03 20.63de ± 1.91 3.69ab ± 0.07 0.107abc ± 0.009 11.87abc ± 0.25 0.710bcd ± 0.006 35.0bcd ± 1.9 2.5 −0.667bc ± 0.018 85.50ab ± 1.38 18.30e ± 0.55 4.04ab ± 0.13 0.127ab ± 0.015 12.55ab ± 0.31 0.719abcd ± 0.004 38.7abc ± 2.3 6 dS·m−1 0 −0.996h ± 0.009 71.59de ± 4.01 28.97bc ± 0.55 1.80ef ± 0.10 0.050bc ± 0.010 7.84de ± 1.29 0.679cde ± 0.010 28.7def ± 1.3 1.5 −0.893fg ± 0.003 74.32cde ± 0.39 27.30bc ± 0.72 2.09de ± 0.12 0.063bc ± 0.009 8.94cde ± 1.03 0.723abcd ± 0.003 32.5cde ± 2.3 2.5 −0.833ef ± 0.018 76.07bcde ± 2.15 24.03cd ± 0.07 2.71cd ± 0.23 0.083abc ± 0.012 9.27bcde ± 0.45 0.736abc ± 0.003 34.3bcd ± 1.9 8 dS·m−1 0 −1.127i ± 0.023 66.17e ± 4.00 36.80a ± 0.61 1.09f ± 0.11 0.030c ± 0.010 6.21e ± 0.24 0.650e ± 0.005 21.8g ± 1.2 1.5 −1.010h ± 0.012 70.30e± 1.48 34.23a ± 0.61 1.57ef ± 0.16 0.047bc ± 0.009 7.31e ± 0.33 0.665de ± 0.009 25.6fg ± 1.0 2.5 −0.957gh ± 0.035 71.97de ± 4.42 31.87ab ± 1.12 2.16de ± 0.06 0.070abc ± 0.010 8.20de ± 0.10 0.687bcde ± 0.015 27.5efg ± 2.7 MSE 0.001 5.89 3.02 0.06 0.0008 1.372 0.0004 4.84 C.D 0.052 5.13 2.96 0.42 0.031 1.98 0.023 3.73 S.E (m) 0.018 1.76 1.00 0.14 0.011 0.68 0.008 1.27 S.E (d) 0.025 2.49 1.42 0.20 0.015 0.96 0.011 1.80 Data having the same letters in the column do not differ significantly while groups with different letters suggest a significant difference (Tukey's HSD test p < 0.05) with error degree of freedom = 24; MSE (Mean Square Error) at 5%. * Values are presented as mean ± standard error (n = 3). Table 3.
Effect of ortho-silicic acid (OSA) on water potential (Ψw), Relative Water Content (RWC), Relative Stress Injury (RSI), Transpiration Rate (E), Stomatal Conductance (gs), Assimilation Rate (A), Chlorophyll Fluoroscence (CHLF) and Chlorophyll content (CHL) of Sorghum genotype CSV33MF grown under different levels of salt stress.
-
Salt level OSA (mg·L−1) Ψw (MPa) RWC (%) RSI (%) E (mmol H2O·m−1·s−1) gs (mmol H2O·m−1·s−1) A (μmol CO2·m−1·s−1) CHLF (Fv/Fm) CHL (SPAD) 0 dS·m−1 0 −.713bc ± 0.026 82.47ab ± 1.98 12.93f ± 0.43 3.30bc ± 0.13 0.097abc ± 0.009 10.85abc ± 0.61 0.713abc ± 0.006 33.5cd ± 0.7 1.5 −0.630ab ± 0.015 84.84a ± 2.44 11.77f ± 0.73 3.74ab ± 0.08 0.117a ± 0.009 11.54ab ± 0.30 0.738a ± 0.014 37.4ab ± 1.1 2.5 −0.570a ± 0.025 86.48b ± 1.69 11.33f ± 0.33 4.02a ± 0.15 0.136a ± 0.015 13.34a ± 0.76 0.751a ± 0.001 40.1a ± 0.6 4 dS·m−1 0 −0.837cd ± 0.017 79.29ab ± 1.88 22.83e ± 0.58 3.15c ± 0.06 0.093abcd ± 0.008 10.14bcd ± 1.17 0.710abc ± 0.001 31.1de ± 0.5 1.5 −0.743bc ± 0.015 82.32ab ± 1.72 22.06e ± 0.80 3.42bc ± 0.07 0.103ab ± 0.012 11.90ab ± 0.12 0.714abc ± 0.001 34.2bcd ± 0.6 2.5 −0.713bc ± 0.020 84.59a ± 2.10 19.57e ± 0.58 3.58abc ± 0.09 0.128a ± 0.015 12.71ab ± 0.16 0.724ab ± 0.006 37.3abc ± 0.4 6 dS·m−1 0 −1.023ef ± 0.052 69.96cd ± 0.71 32.47c ± 0.60 1.54ef ± 0.16 0.030e ± 0.010 6.84e ± 0.21 0.657cd ± 0.009 26.4fg ± 1.0 1.5 −0.943de ± 0.029 74.45bc ± 0.78 30.60c ± 0.78 2.04de ± 0.08 0.040cde ± 0.010 7.40de ± 0.07 0.700abc ± 0.001 29.5ef ± 0.9 2.5 −0.877d ± 0.009 75.76bc ± 1.78 26.90d ± 0.10 2.55d ± 0.08 0.057bcde ± 0.009 8.27cde ± 0.08 0.715ab ± 0.008 32.2de ± 0.5 8 dS·m−1 0 −1.150f ± 0.042 63.96d ± 0.68 42.33a ± 0.69 0.92g ± 0.14 0.017e ± 0.008 5.81e ± 0.23 0.637d ± 0.001 20.0h ± 0.8 1.5 −1.063ef ± 0.044 68.76cd ± 1.09 39.40ab ± 0.71 1.32fg ± 0.06 0.020e ± 0.009 6.12e ± 0.33 0.665cd ± 0.014 23.5gh ± 0.9 2.5 −1.030ef ± 0.010 69.45cd ± 1.82 36.63a ± 1.30 1.61ef ± 0.07 0.037de ± 0.010 7.11e ± 0.70 0.678bcd ± 0.001 25.7fg ± 0.8 MSE 0.002 8.28 1.45 0.31 0.0008 0.96 0.0004 1.65 C.D 0.084 4.88 2.04 0.16 0.031 1.30 0.021 2.18 S.E (m) 0.029 1.66 0.69 0.05 0.011 0.45 0.007 0.74 S.E (d) 0.040 2.35 0.98 0.07 0.015 0.63 0.010 1.05 Data having the same letters in the column do not differ significantly while groups with different letters suggest a significant difference (Tukey’s HSD test p < 0.05) with error degree of freedom = 24; MSE (Mean Square Error) at 5%. * Values are presented as mean ± standard error (n = 3). Table 4.
Effect of ortho-silicic acid (OSA) on water potential (Ψw), Relative Water Content (RWC), Relative Stress Injury (RSI), Transpiration Rate (E), Stomatal Conductance (gs), Assimilation Rate (A), Chlorophyll Fluoroscence (CHLF) and Chlorophyll content (CHL) of Sorghum genotype SSG 59-3 grown under different levels of salt stress.
Figures
(2)
Tables
(4)