-

Figure 1.
Aphid density on C. morifolium 'jinba' and four Artemisia species at 5 d after aphid inoculation.
-

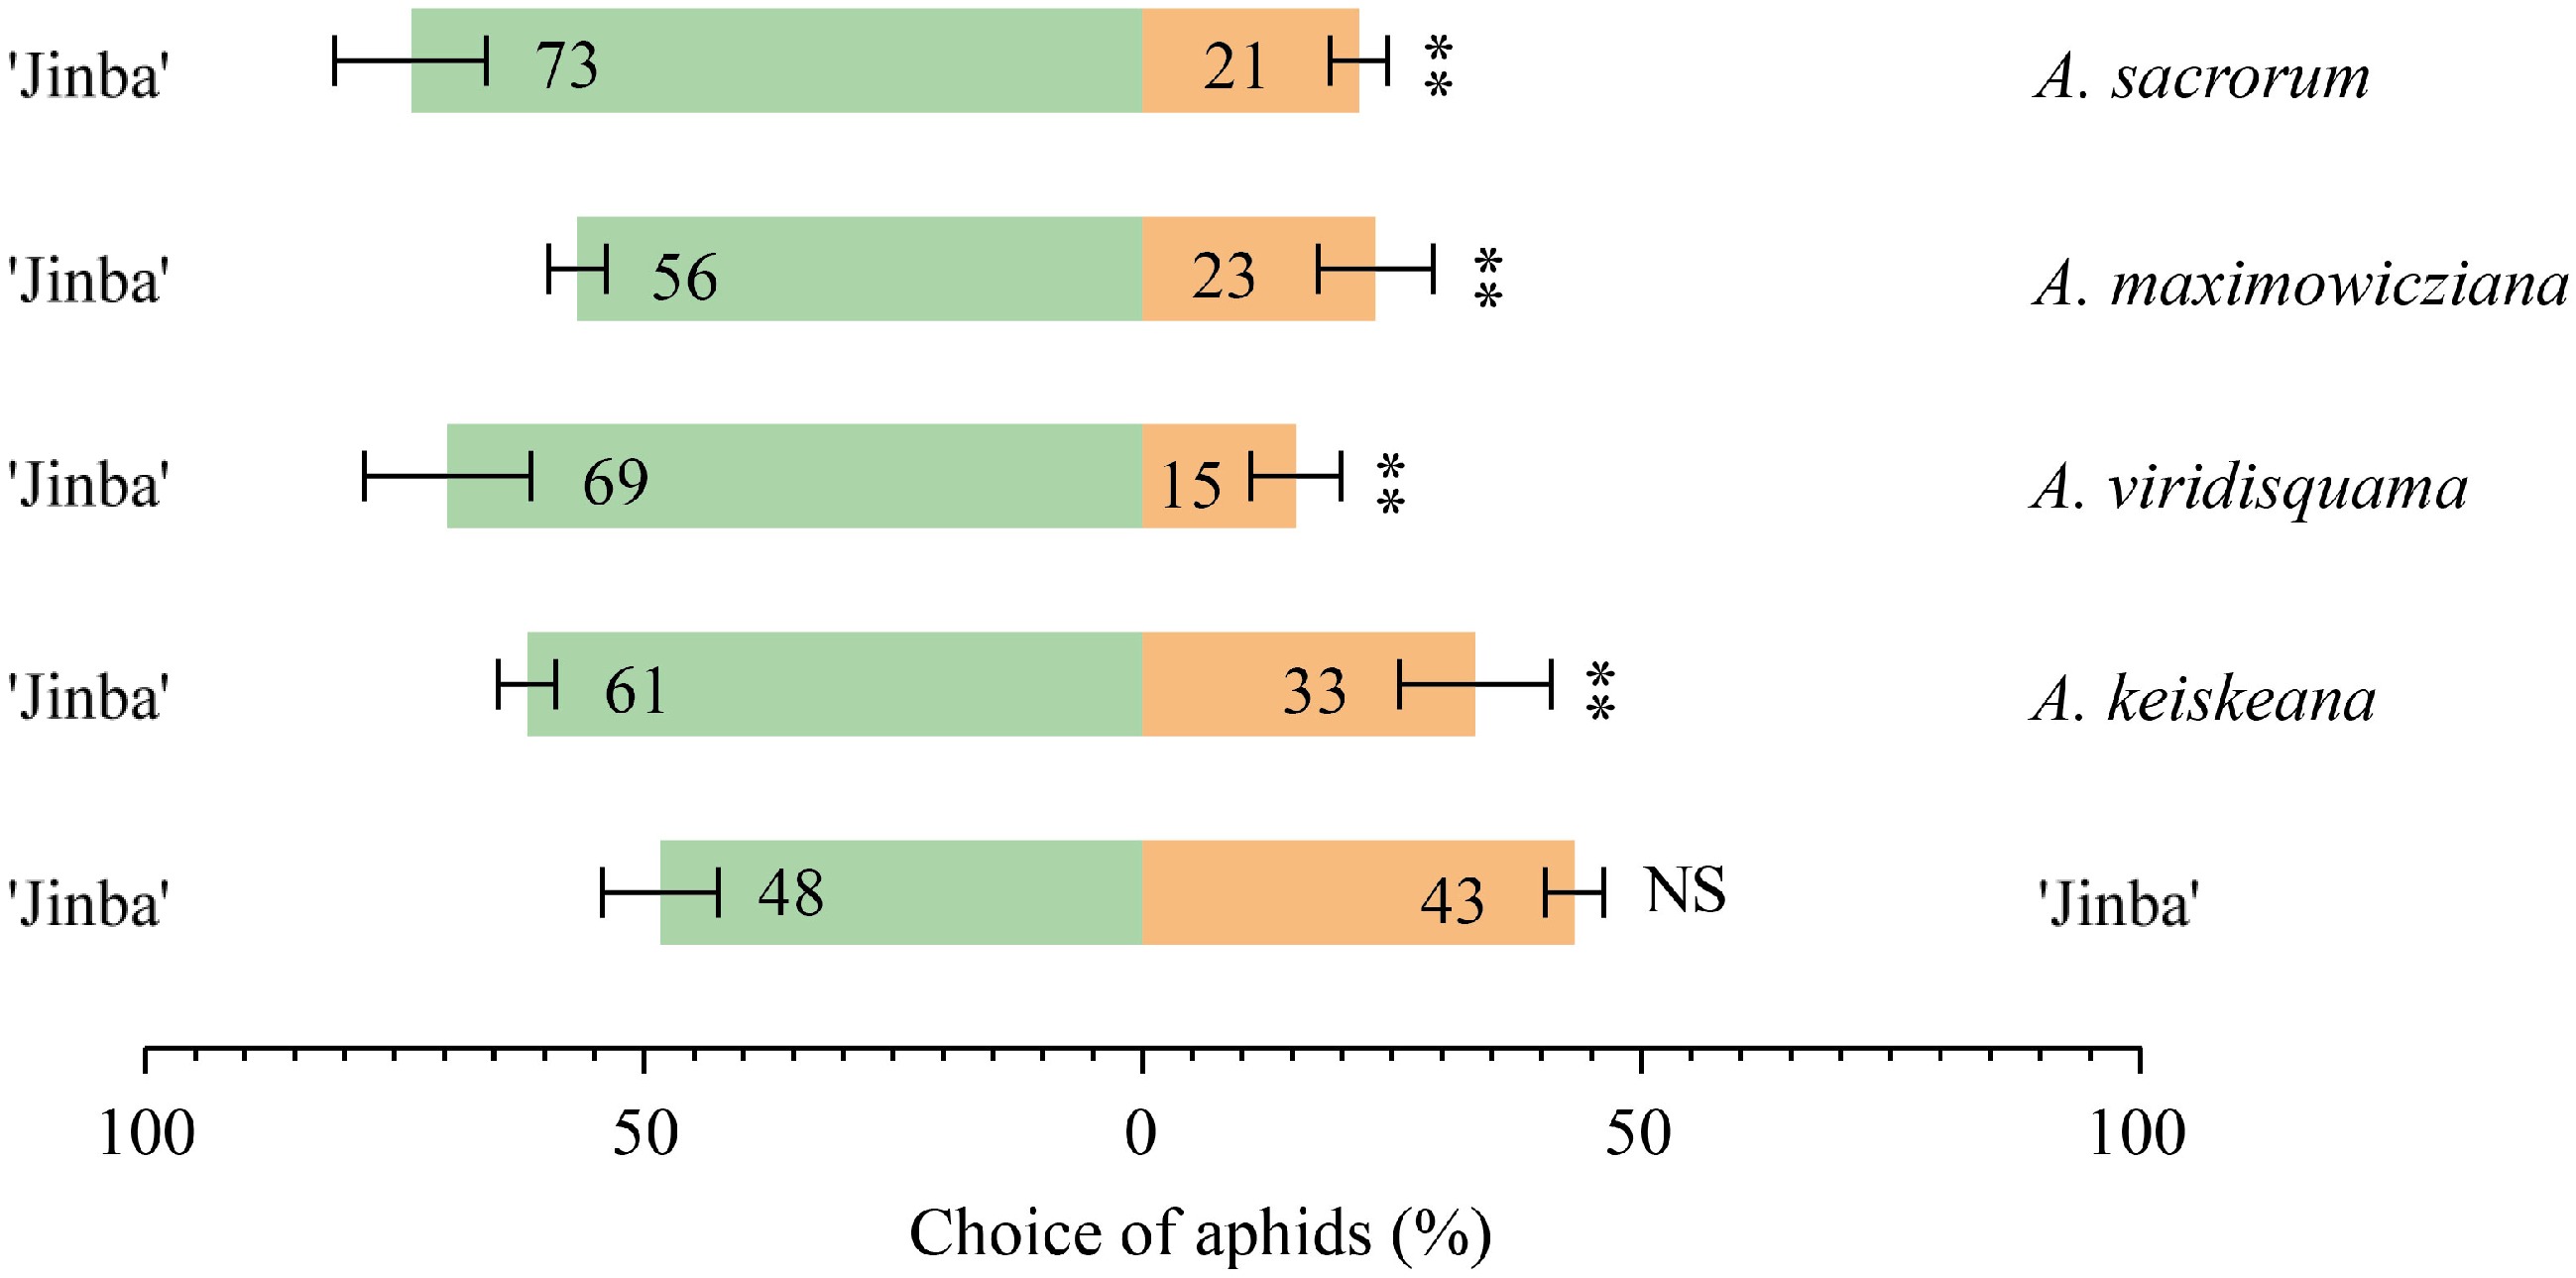
Figure 2.
Choices of aphid to Artemisia species and C. morifolium 'Jinba' in the Y-tube olfactometer. The asterisks with the choice bars indicate significant preference. **p < 0.01.
-

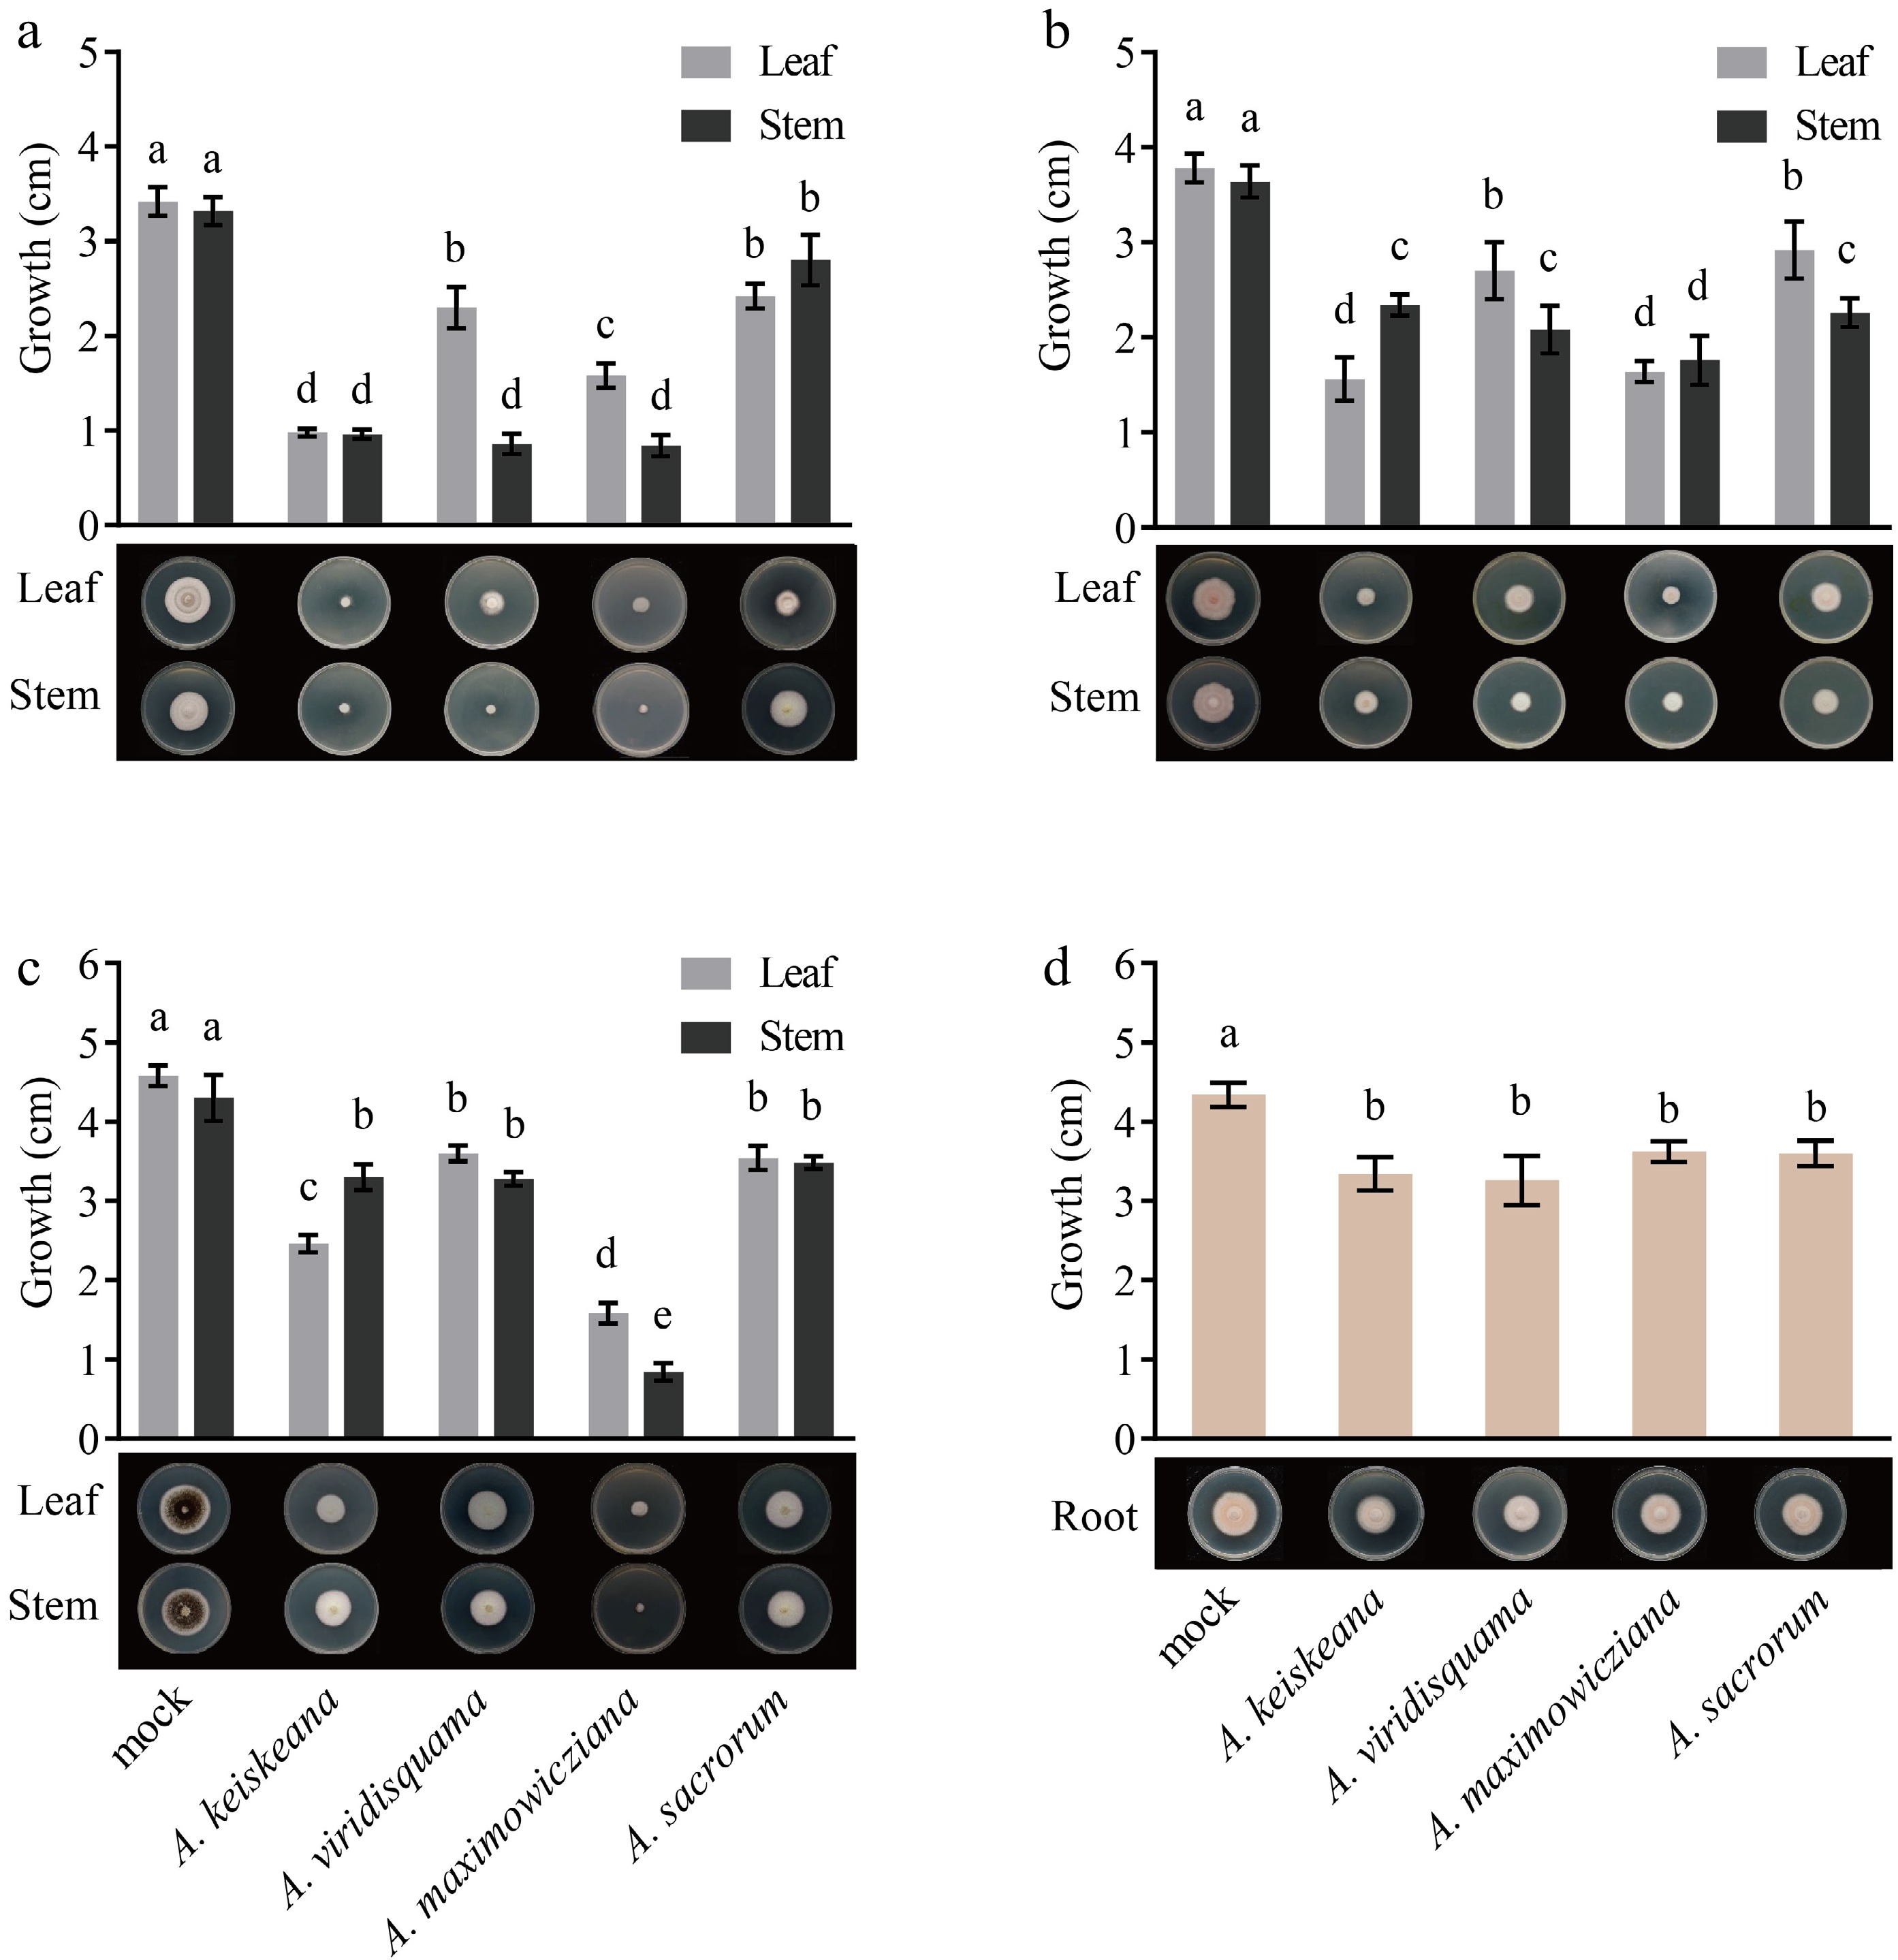
Figure 3.
Inhibitory effect of different tissue extracts from four Artemisia plants on mycelia growth. (a), (b) and (c) colony diameter (cm) of A. alternata, C. siamense, and Phoma sp. after treatment with leaf and stem extracts for 4 d, respectively; (d) growth (cm) of F. solani after treatment with root extracts for 4 d. Different letters represent significant differences (p < 0.05).
-

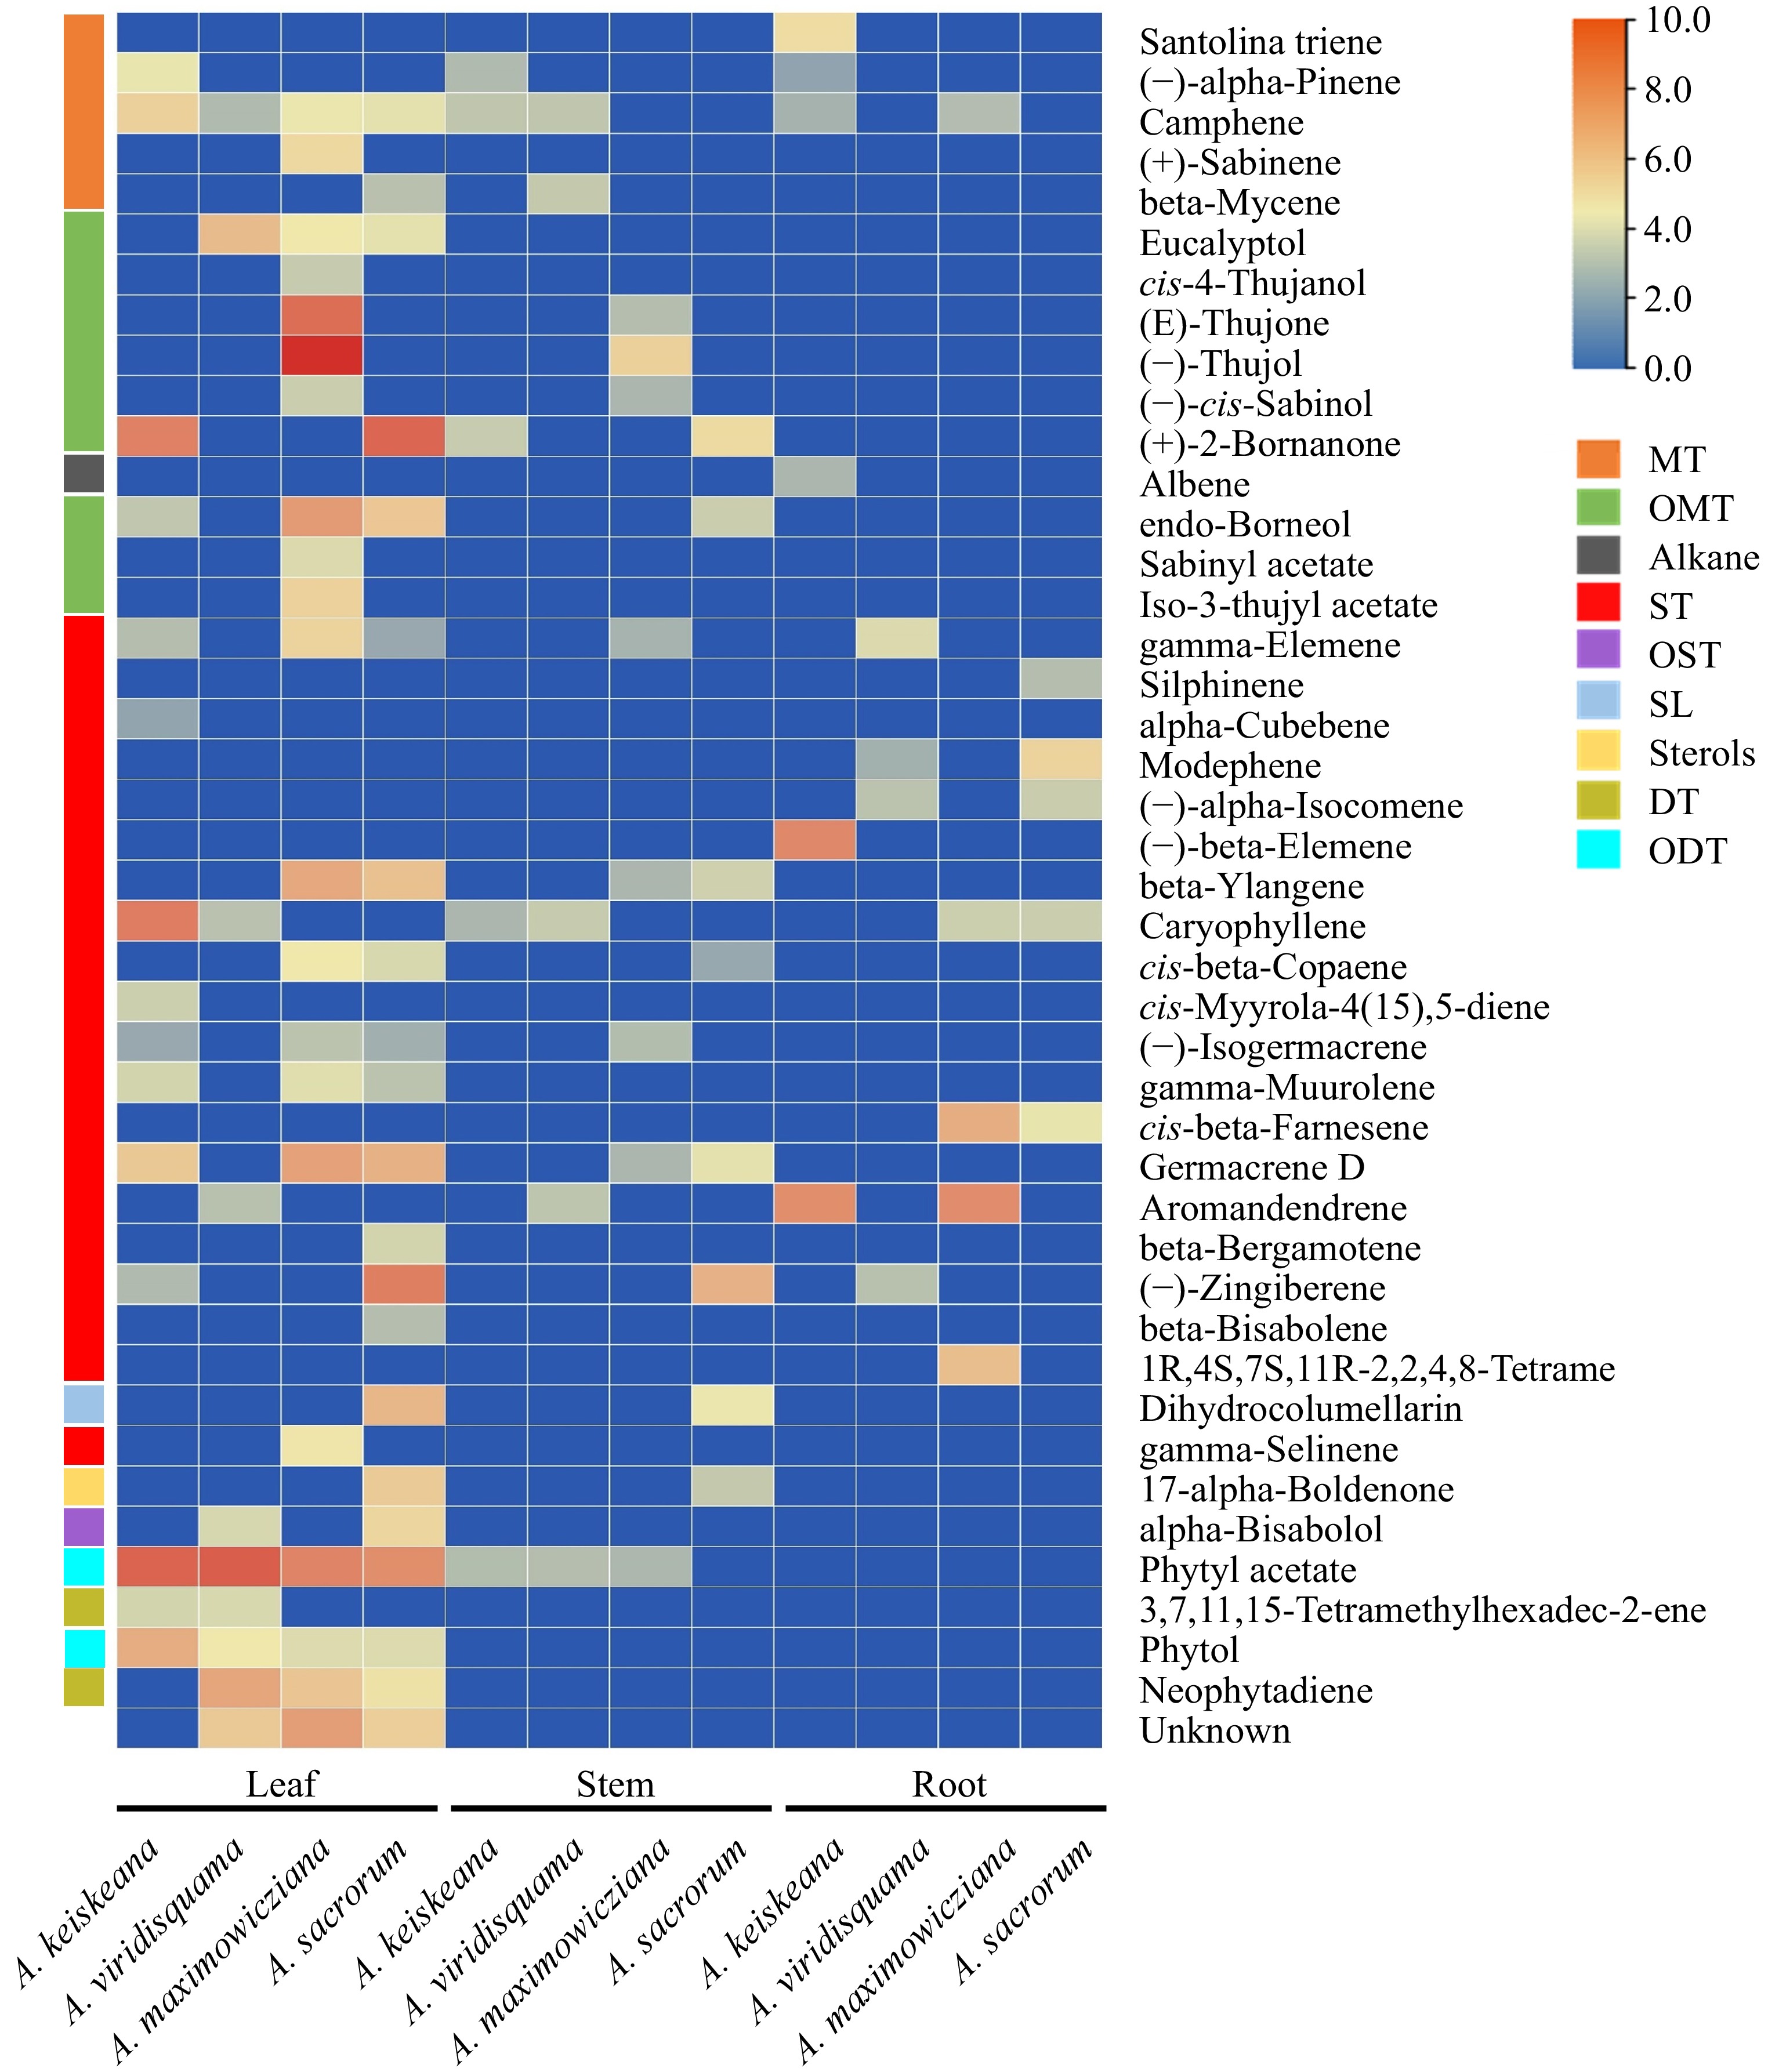
Figure 4.
Main components (above 1% of total volatiles present in chromatograms) of ethyl acetate extracts from the leaf, stem and root of four Artemisia species. Colors reflect the VOC's average relative content, n = 3. MT: monoterpenes; OMT: oxygenated monoterpenes; ST: sesquiterpenes; OST: oxygenated sesquiterpenes; SL: sesquiterpene lactones; DT: diterpenes; ODT: oxygenated diterpenes.
-

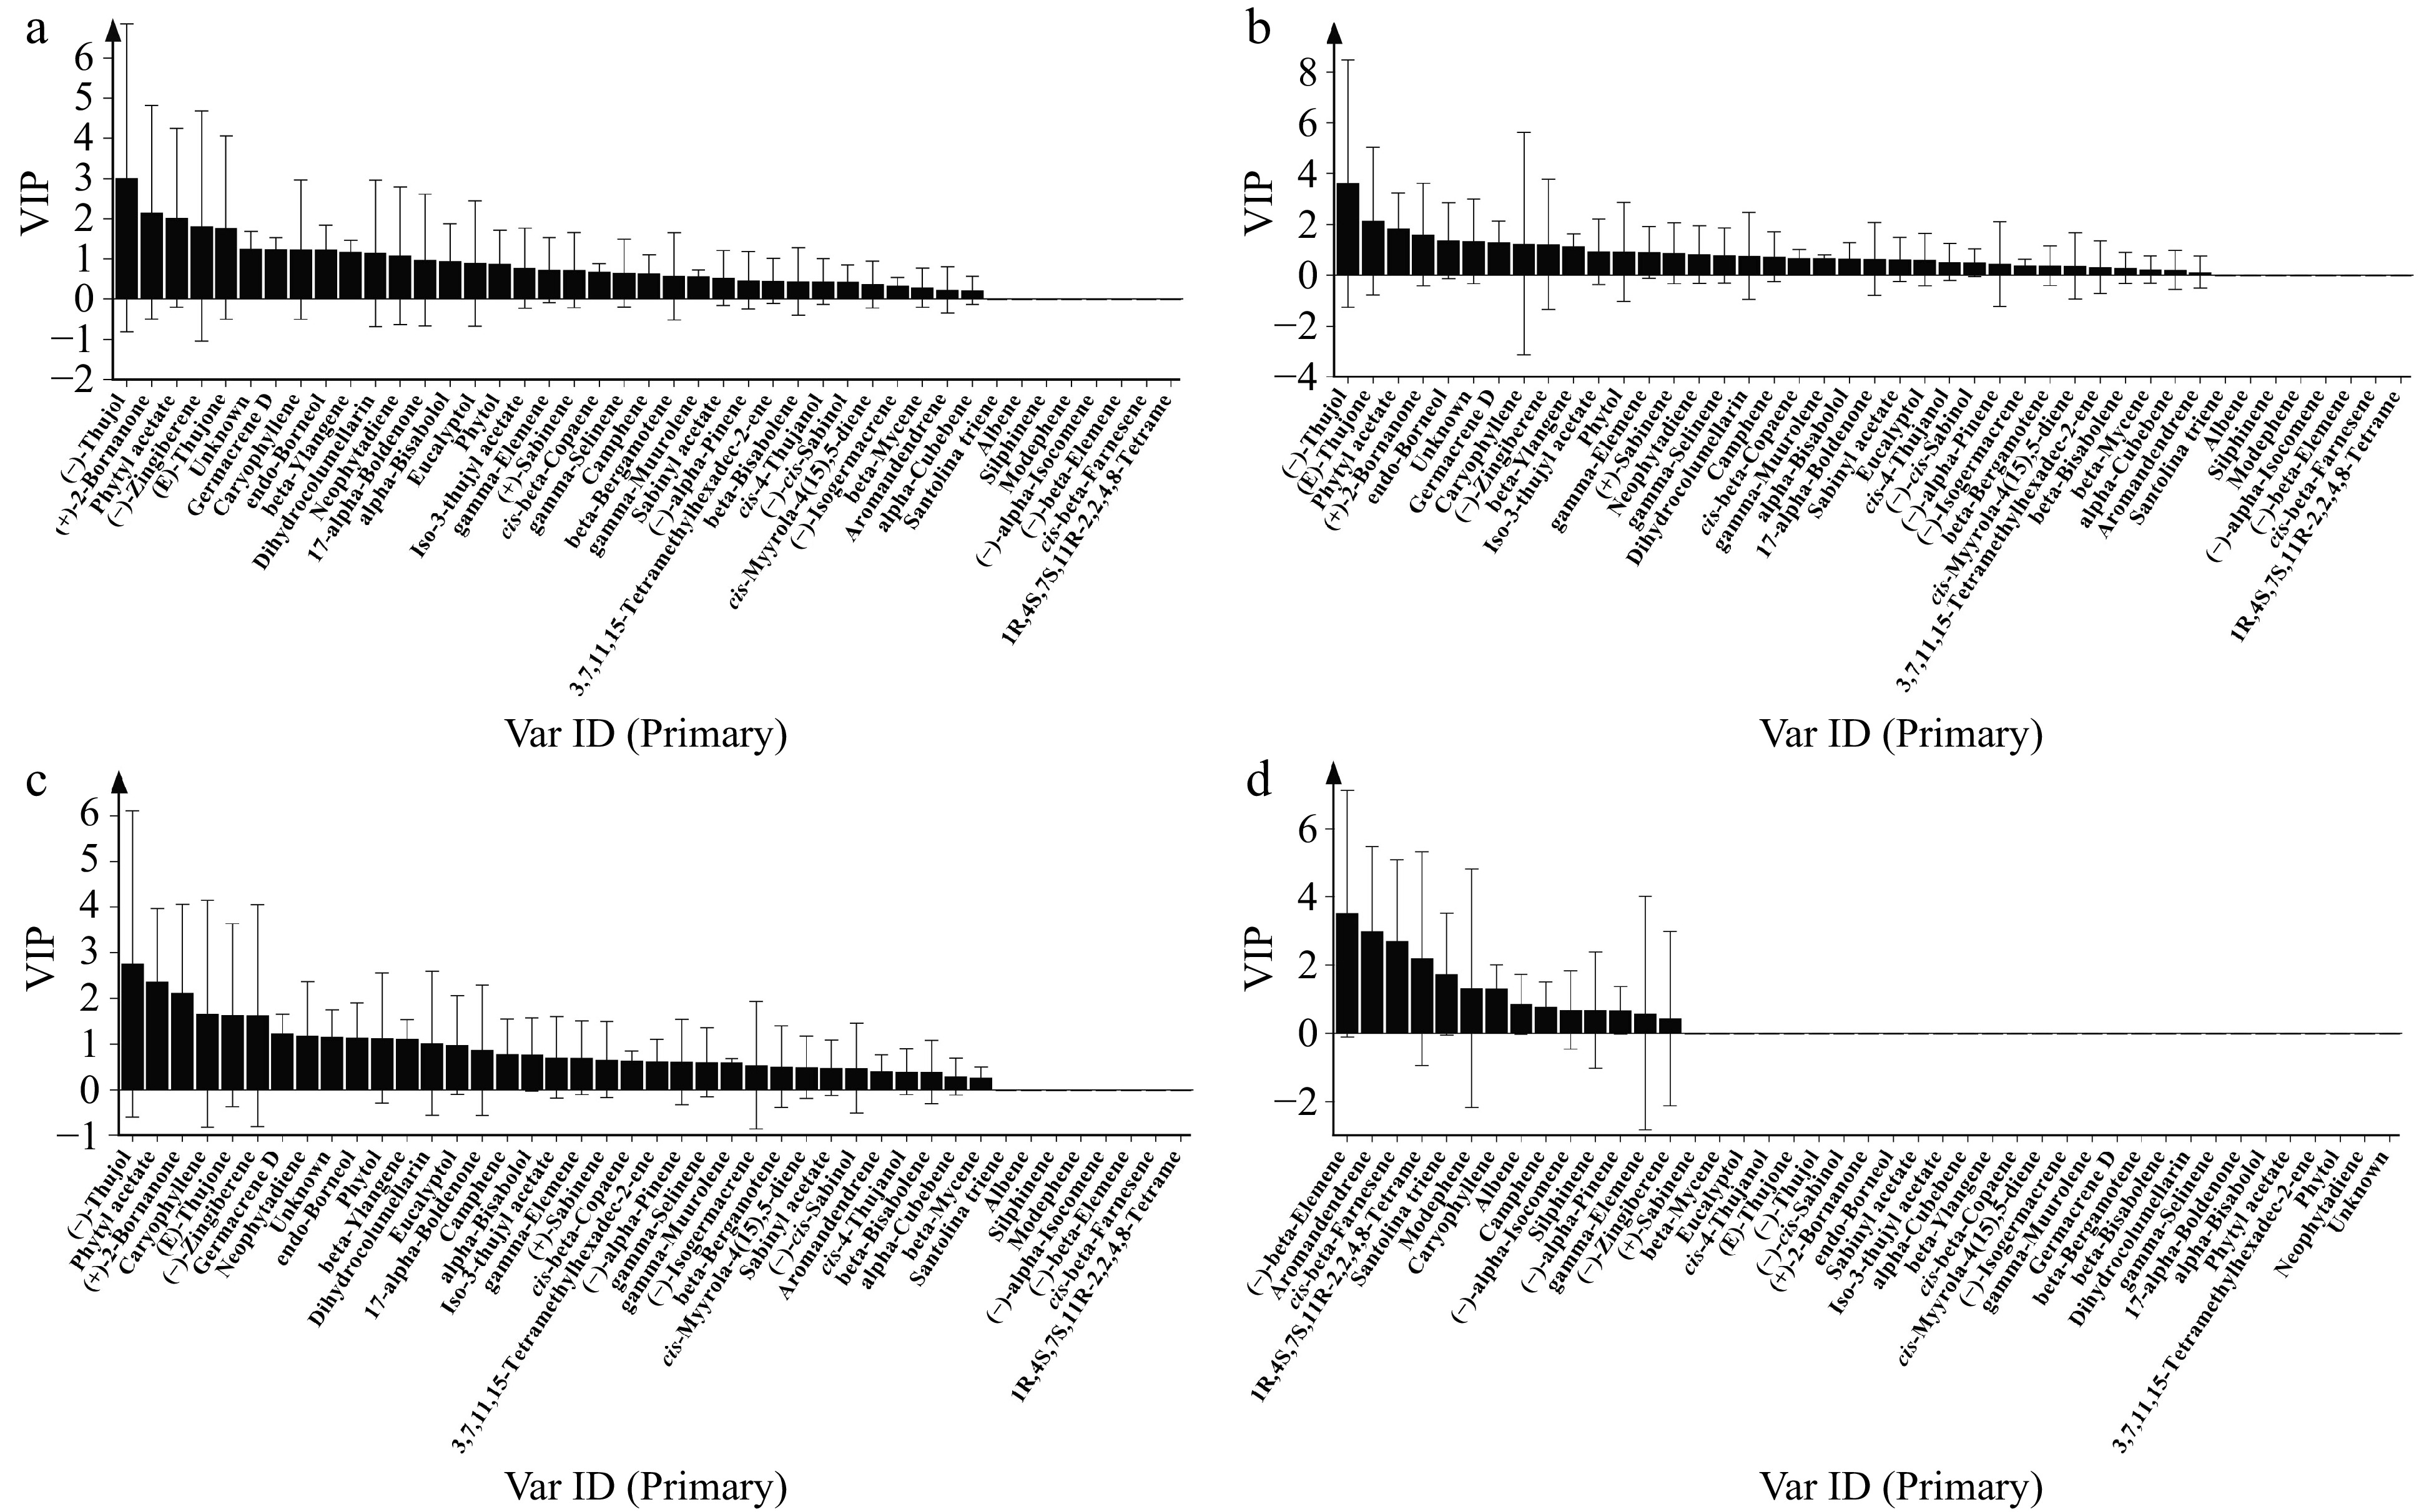
Figure 5.
Screening of key bioactive components of extracts with antifungal effect against (a) A. alternata, (b) C. siamense, (c) Phoma sp. and (d) F. solani by OPLS-DA. VIP ≥ 1 was used as the screening criterion.
-
Plants No. of aphids at different days after inoculation Multiplication rate 1 d 3 d 5 d 7 d C. morifolium 'Jinba' 10.0 ± 0.00c 15.9 ± 2.15d 31.7 ± 5.43e 59.1 ± 7.29f 5.9 ± 0.73 A. keiskeana 10.0 ± 0.00c 2.6 ± 1.51b 0.6 ± 0.79a 0.0 ± 0.00a 0.00 ± 0.00 A. viridisquama 10.0 ± 0.00c 3.5 ± 1.73 b 0.4 ± 0.67a 0.0 ± 0.00a 0.00 ± 0.00 A. maximowicziana 10.0 ± 0.00c 3.3 ± 1.95 b 0.2 ± 0.63a 0.0 ± 0.00a 0.00 ± 0.00 A. sacrorum 10.0 ± 0.00c 2.7 ± 0.98b 0.1 ± 0.29a 0.0 ± 0.00a 0.00 ± 0.00 Values (given as mean ± SD) labelled with different letters represent significant differences (p < 0.01). Table 1.
Identification of resistance of Artemisia species to aphids.
-
Plants Tissue Inhibition rate (IR) A. alternata C. siamense Phoma sp. A. keiskeana L 71.35 ± 1.17 57.14 ± 6.08 40.00 ± 2.40 S 71.93 ± 1.50 35.71 ± 3.02 19.51 ± 3.72 A. viridisquama L 33.00 ± 6.43 25.82 ± 1.92 12.20 ± 2.18 S 74.85 ± 3.31 42.86 ± 6.87 20.00 ± 1.86 A. maximowicziana L 53.80 ± 3.80 54.95 ± 2.91 61.46 ± 2.84 S 75.44 ± 3.31 51.65 ± 7.14 79.51 ± 2.56 A. sacrorum L 29.24 ± 3.80 19.78 ± 7.93 13.66 ± 3.28 S 29.24 ± 2.34 38.00 ± 4.12 15.12 ± 1.86 Values were given as mean ± SD. L, leaf; S, stem. Table 2.
Inhibitory effect of volatiles from leaves and stems of four kinds of Artemisia on the growth of A. alternata, C. siamense, and Phoma sp.
-
Plants Tissue Inhibition rate (IR) A. keiskeana R 23.04 ± 4.84 A. viridisquama R 24.88 ± 7.14 A. maximowicziana R 16.59 ± 2.99 A. sacrorum R 17.05 ± 3.68 Values were given as mean ± SD. R, root. Table 3.
Inhibitory effect of volatiles from roots of four kinds of Artemisia on the growth of F. solani.
Figures
(5)
Tables
(3)