-
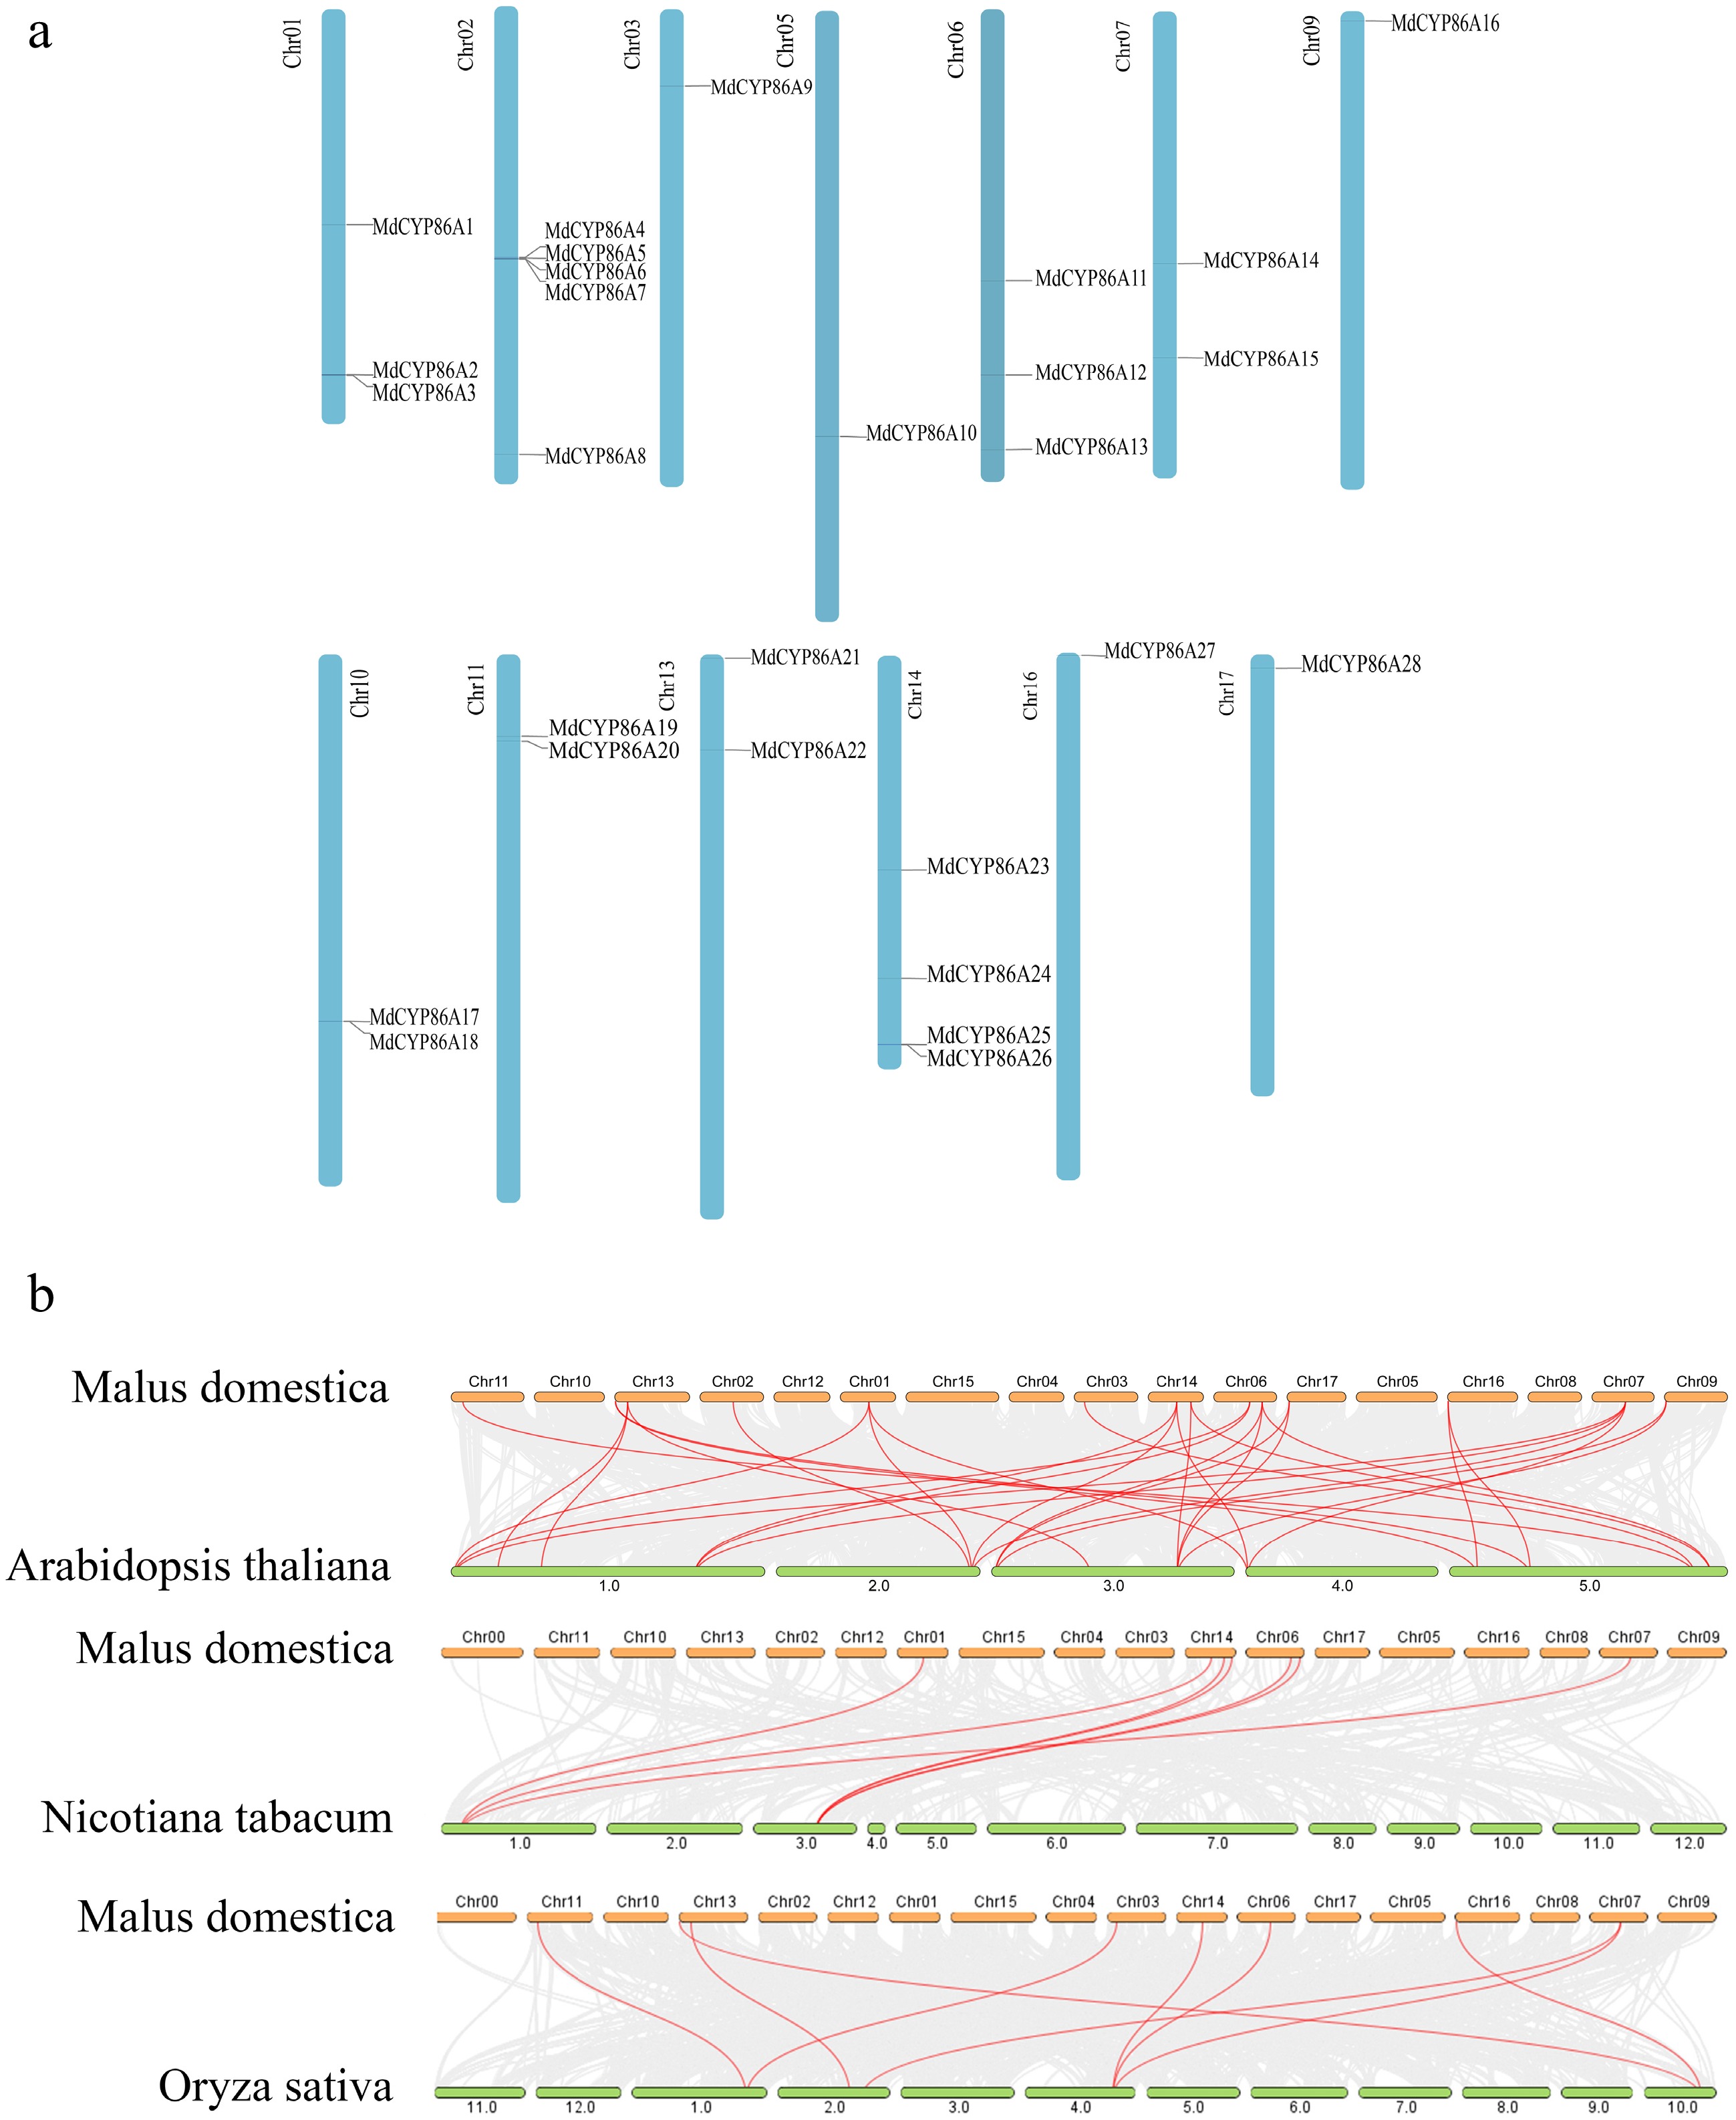
Figure 1.
Localization distribution and the inter-species covariance of MdCYP86A family genes. (a) Distribution of MdCYP86A family genes on 13 apple chromosomes. (b) Analysis of covariance in Apple, Arabidopsis, Tobacco, Rice.
-
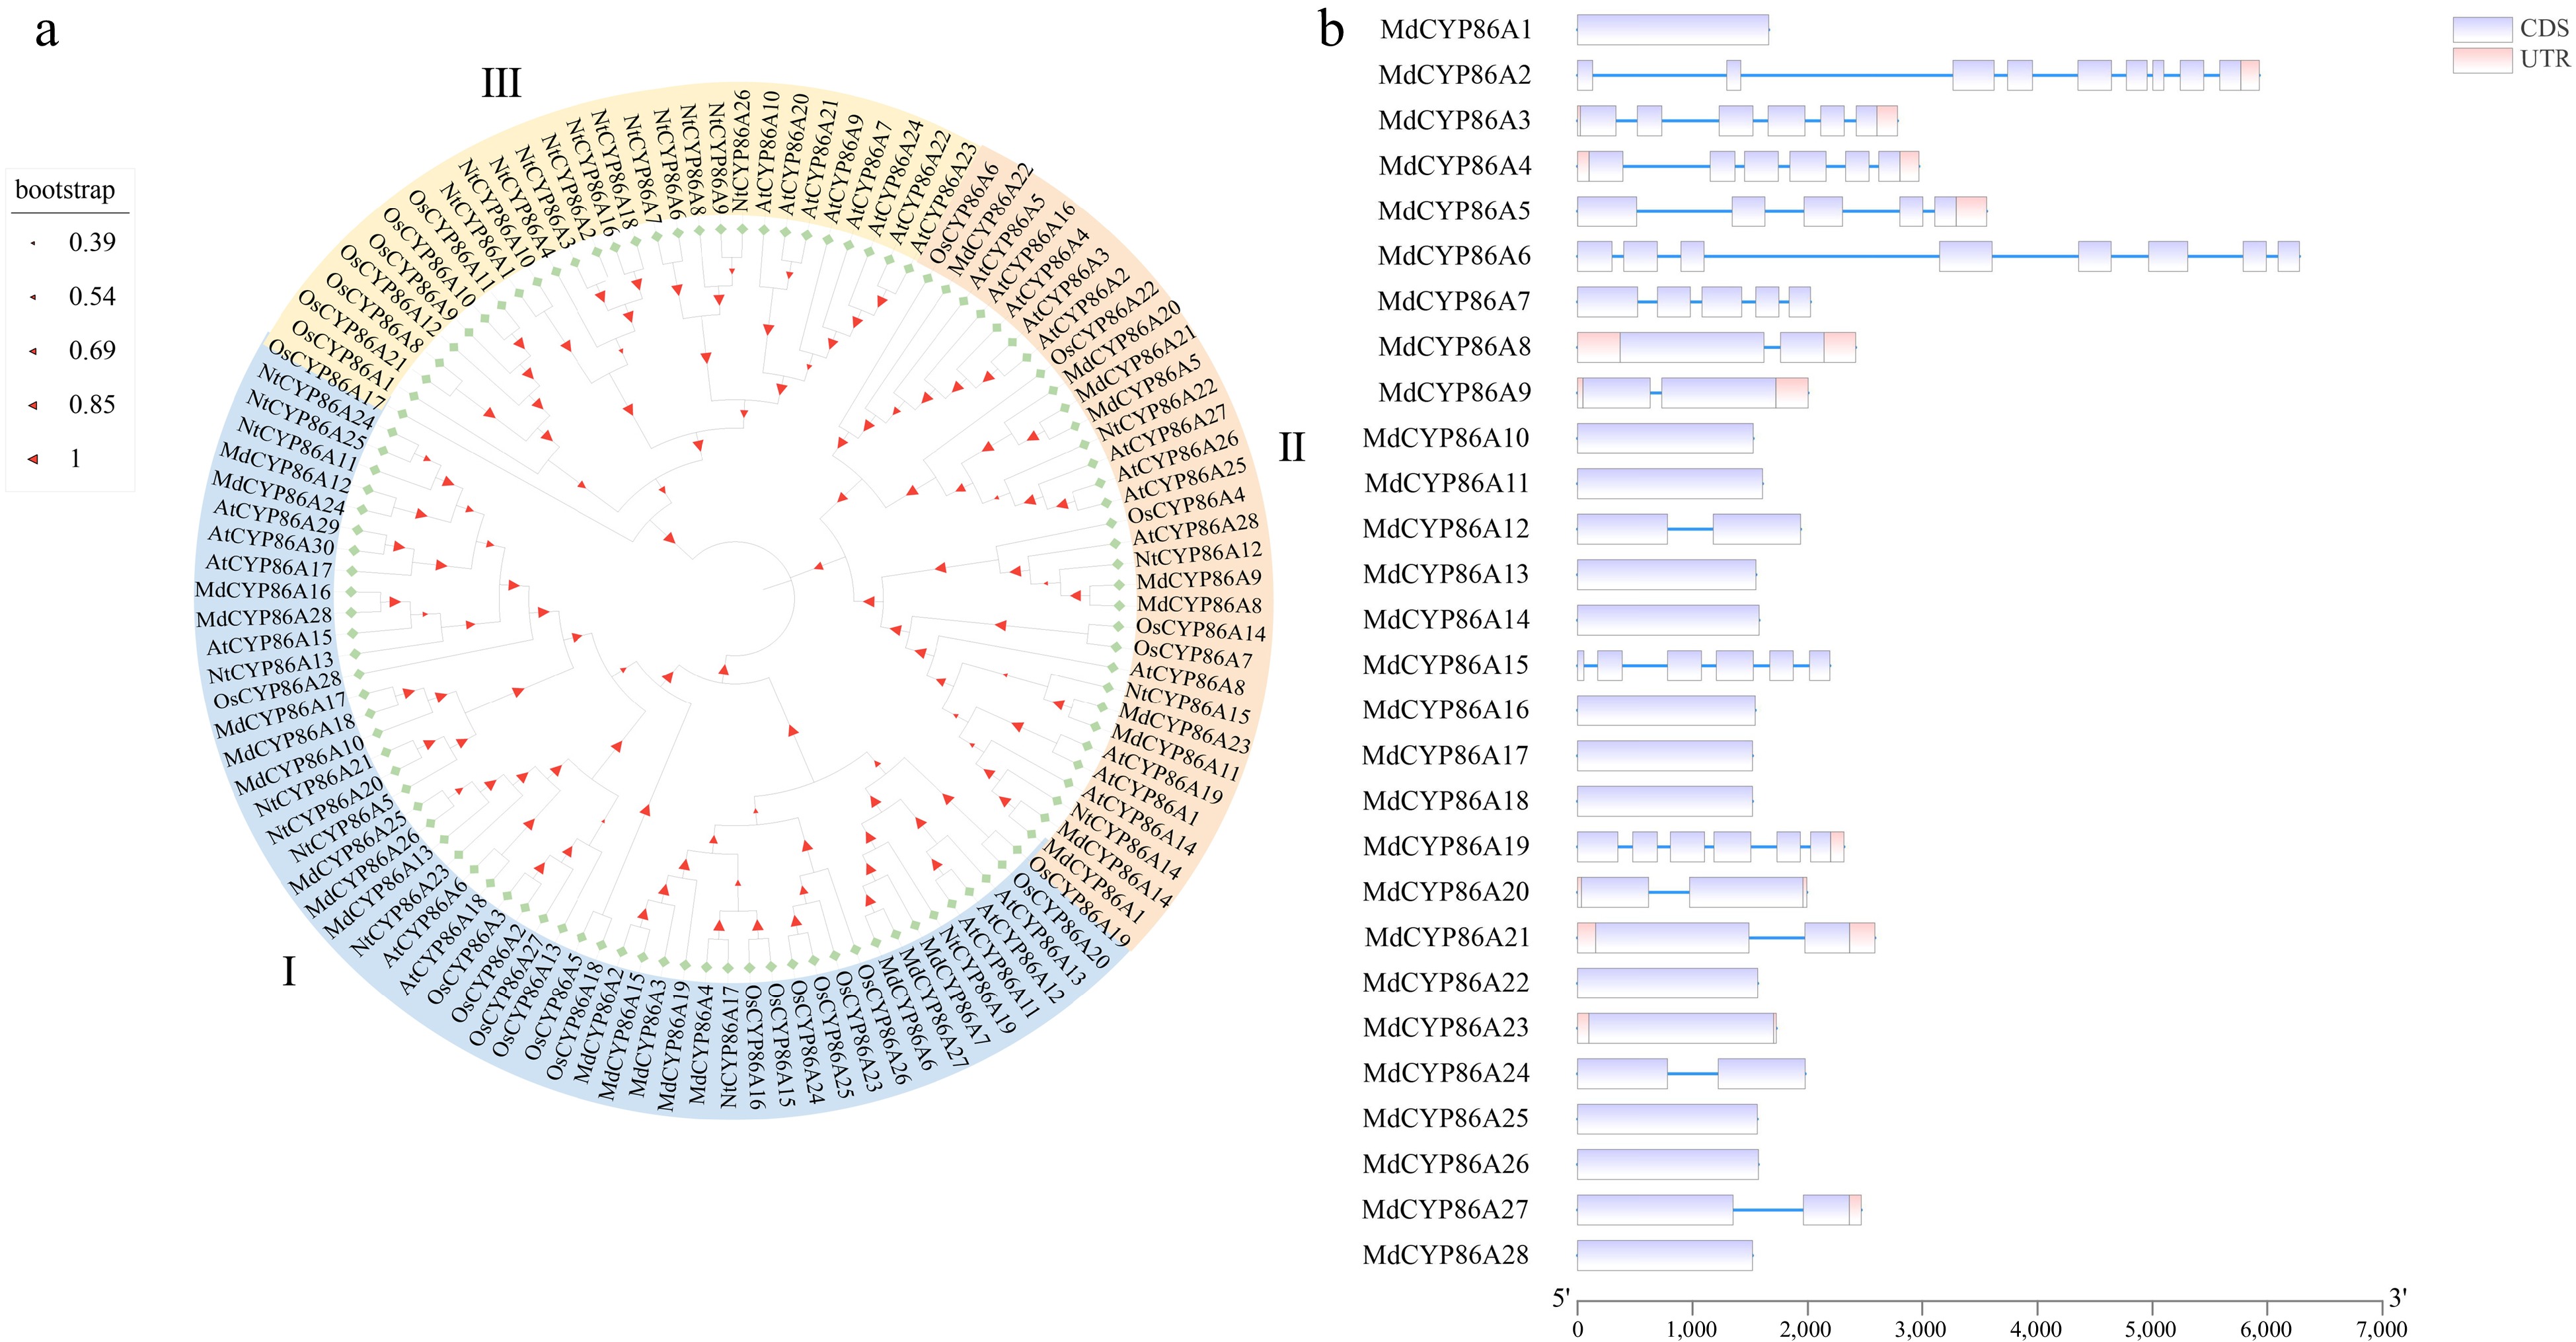
Figure 2.
Phylogenetic and gene structure of MdCYP86As. (a) Phylogenetic tree construction in MEGA software for CYP86A family genes in four species: Arabidopsis thaliana, Rice, Tobacco, and Apple. (b) Gene structure analysis of MdCYP86A subfamily genes in apple, including both CDS and UTR regions.
-
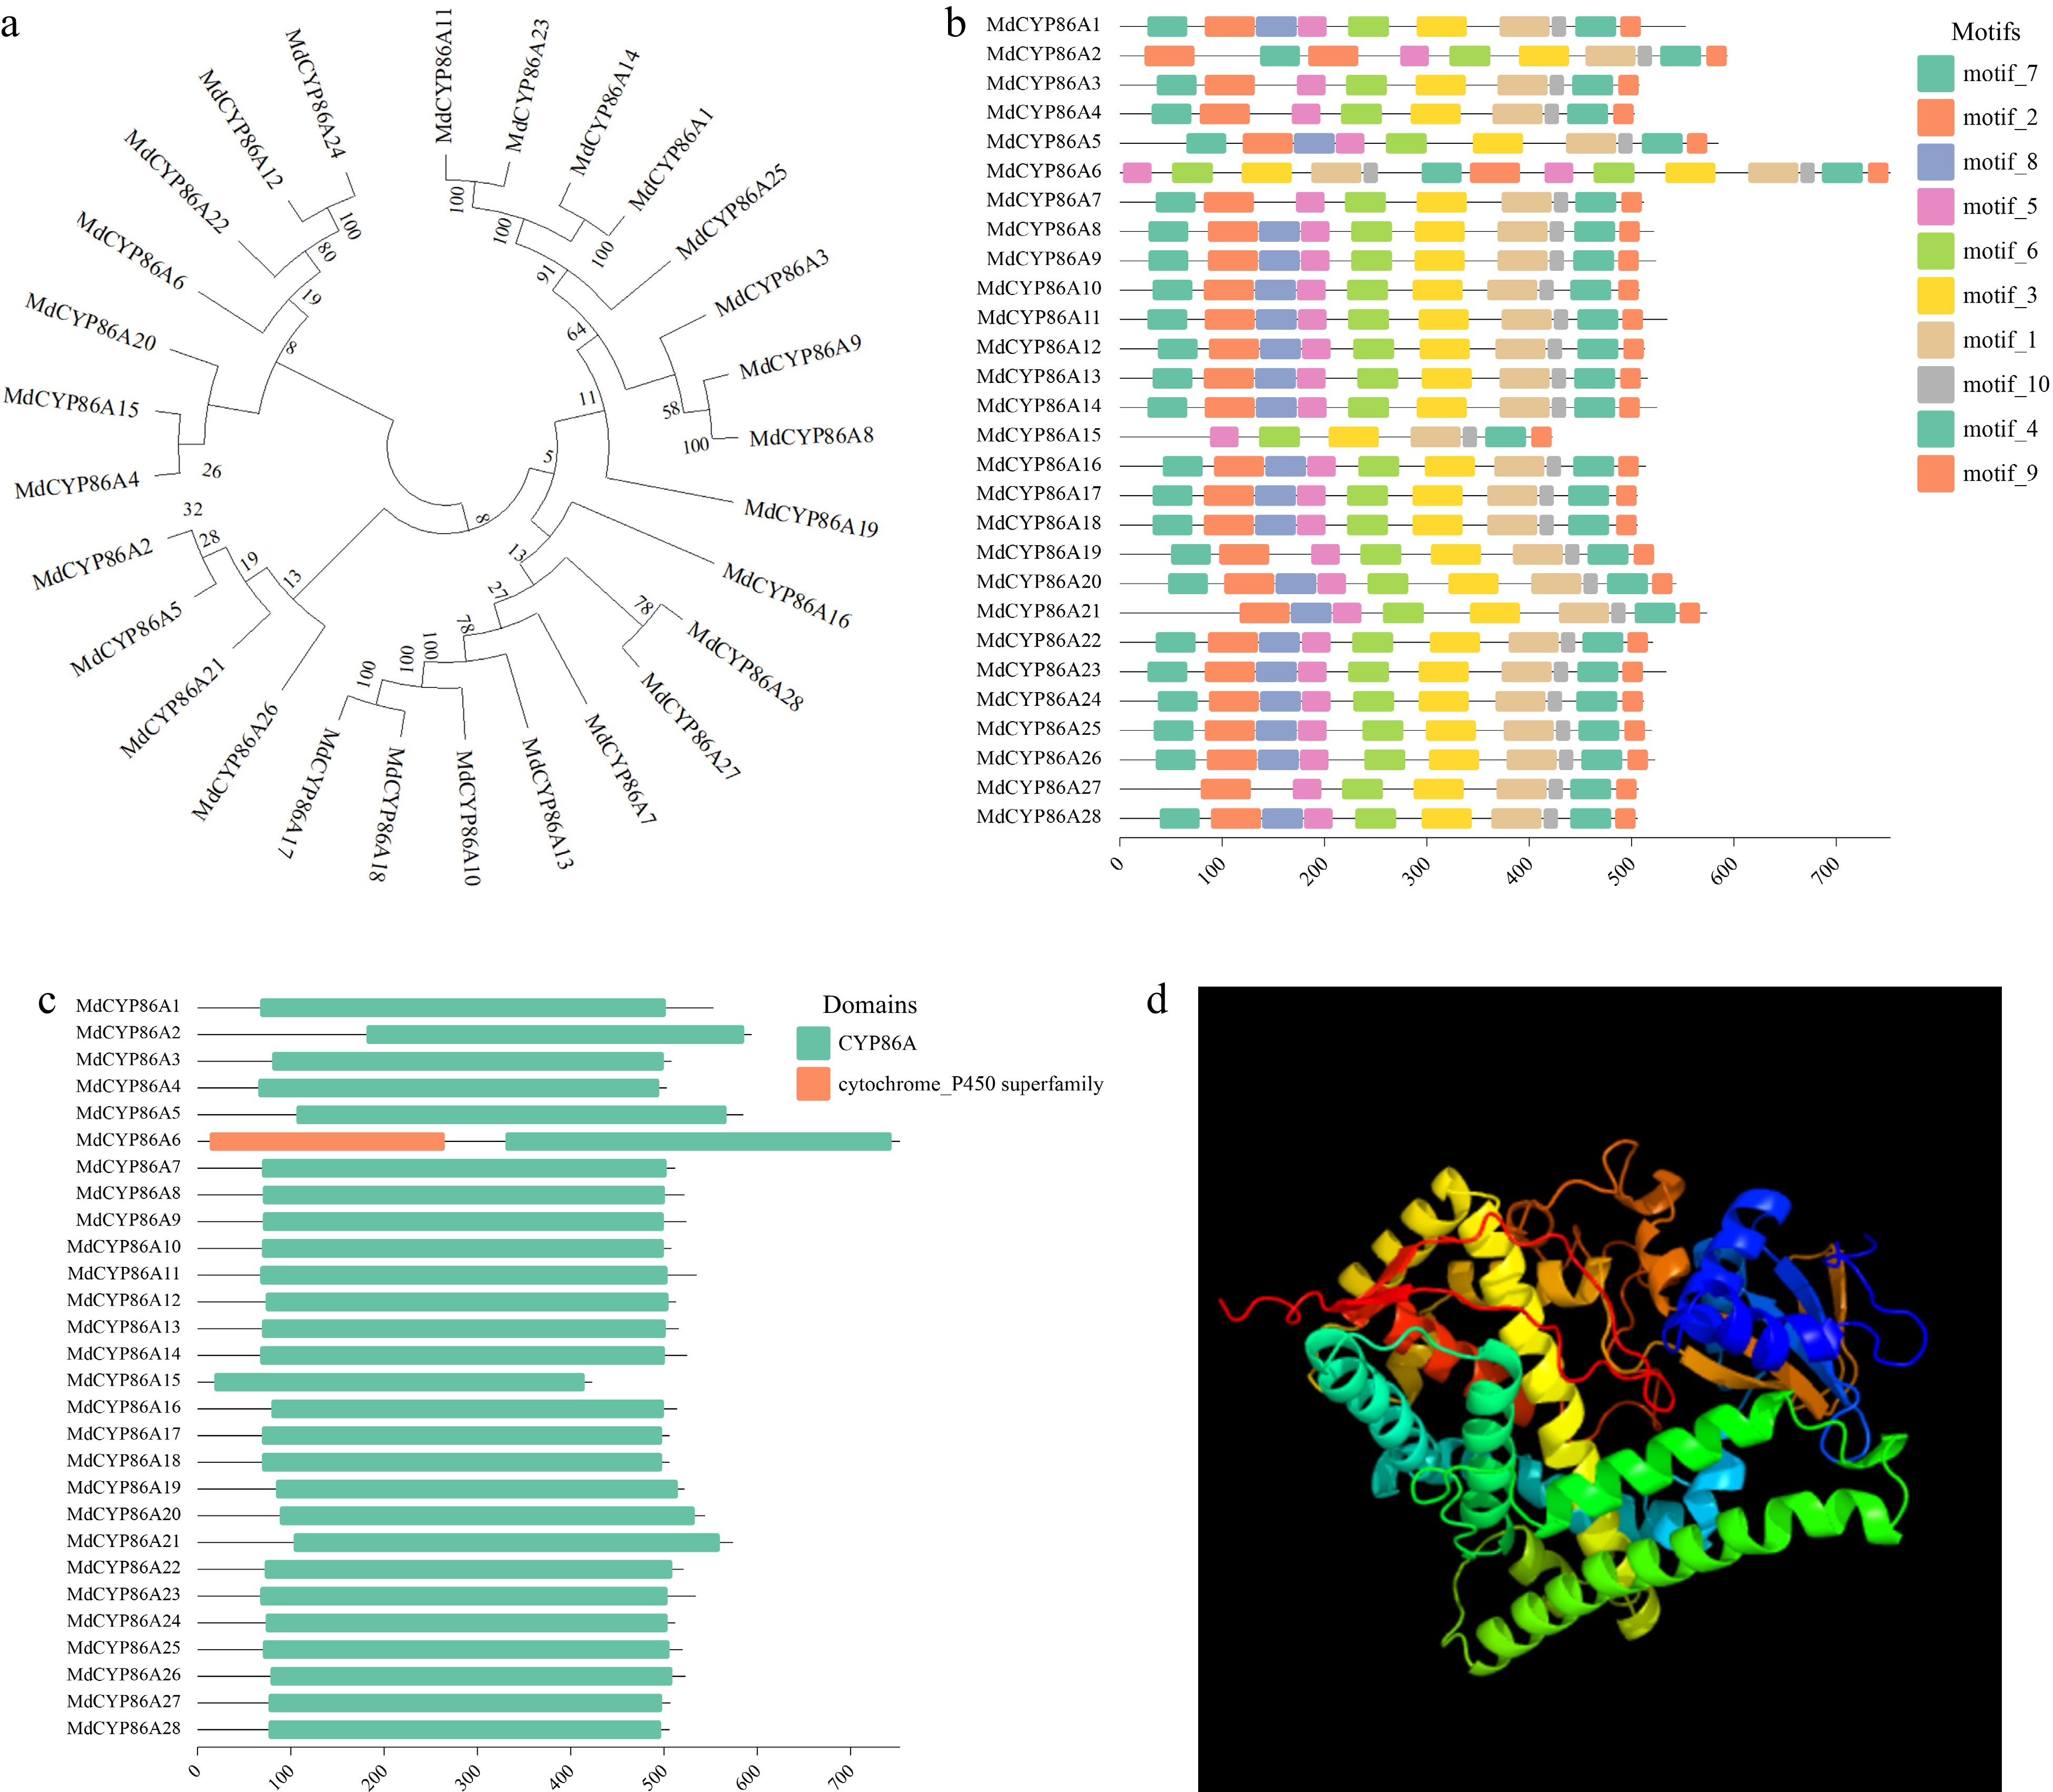
Figure 3.
Evolutionary and conserved motif analysis of MdCYP86As gene in apple. (a) Construction of MdCYP86A subfamily evolutionary tree in MEGA11 software, the numbers next to the branches represent the evolutionary proximity between genes. (b) MdCYP86A subfamily motif analysis, on the left side is the gene ID of the family, and different colored boxes represent different motifs, with sequence length scale bar underneath. (c) The MdCYP86A subfamily conserved structural domains are analyzed, with gene ID on the left, structural domain on the right, and sequence length scale bar below. (d) Protein 3D structure image of MdCYP86A21.
-
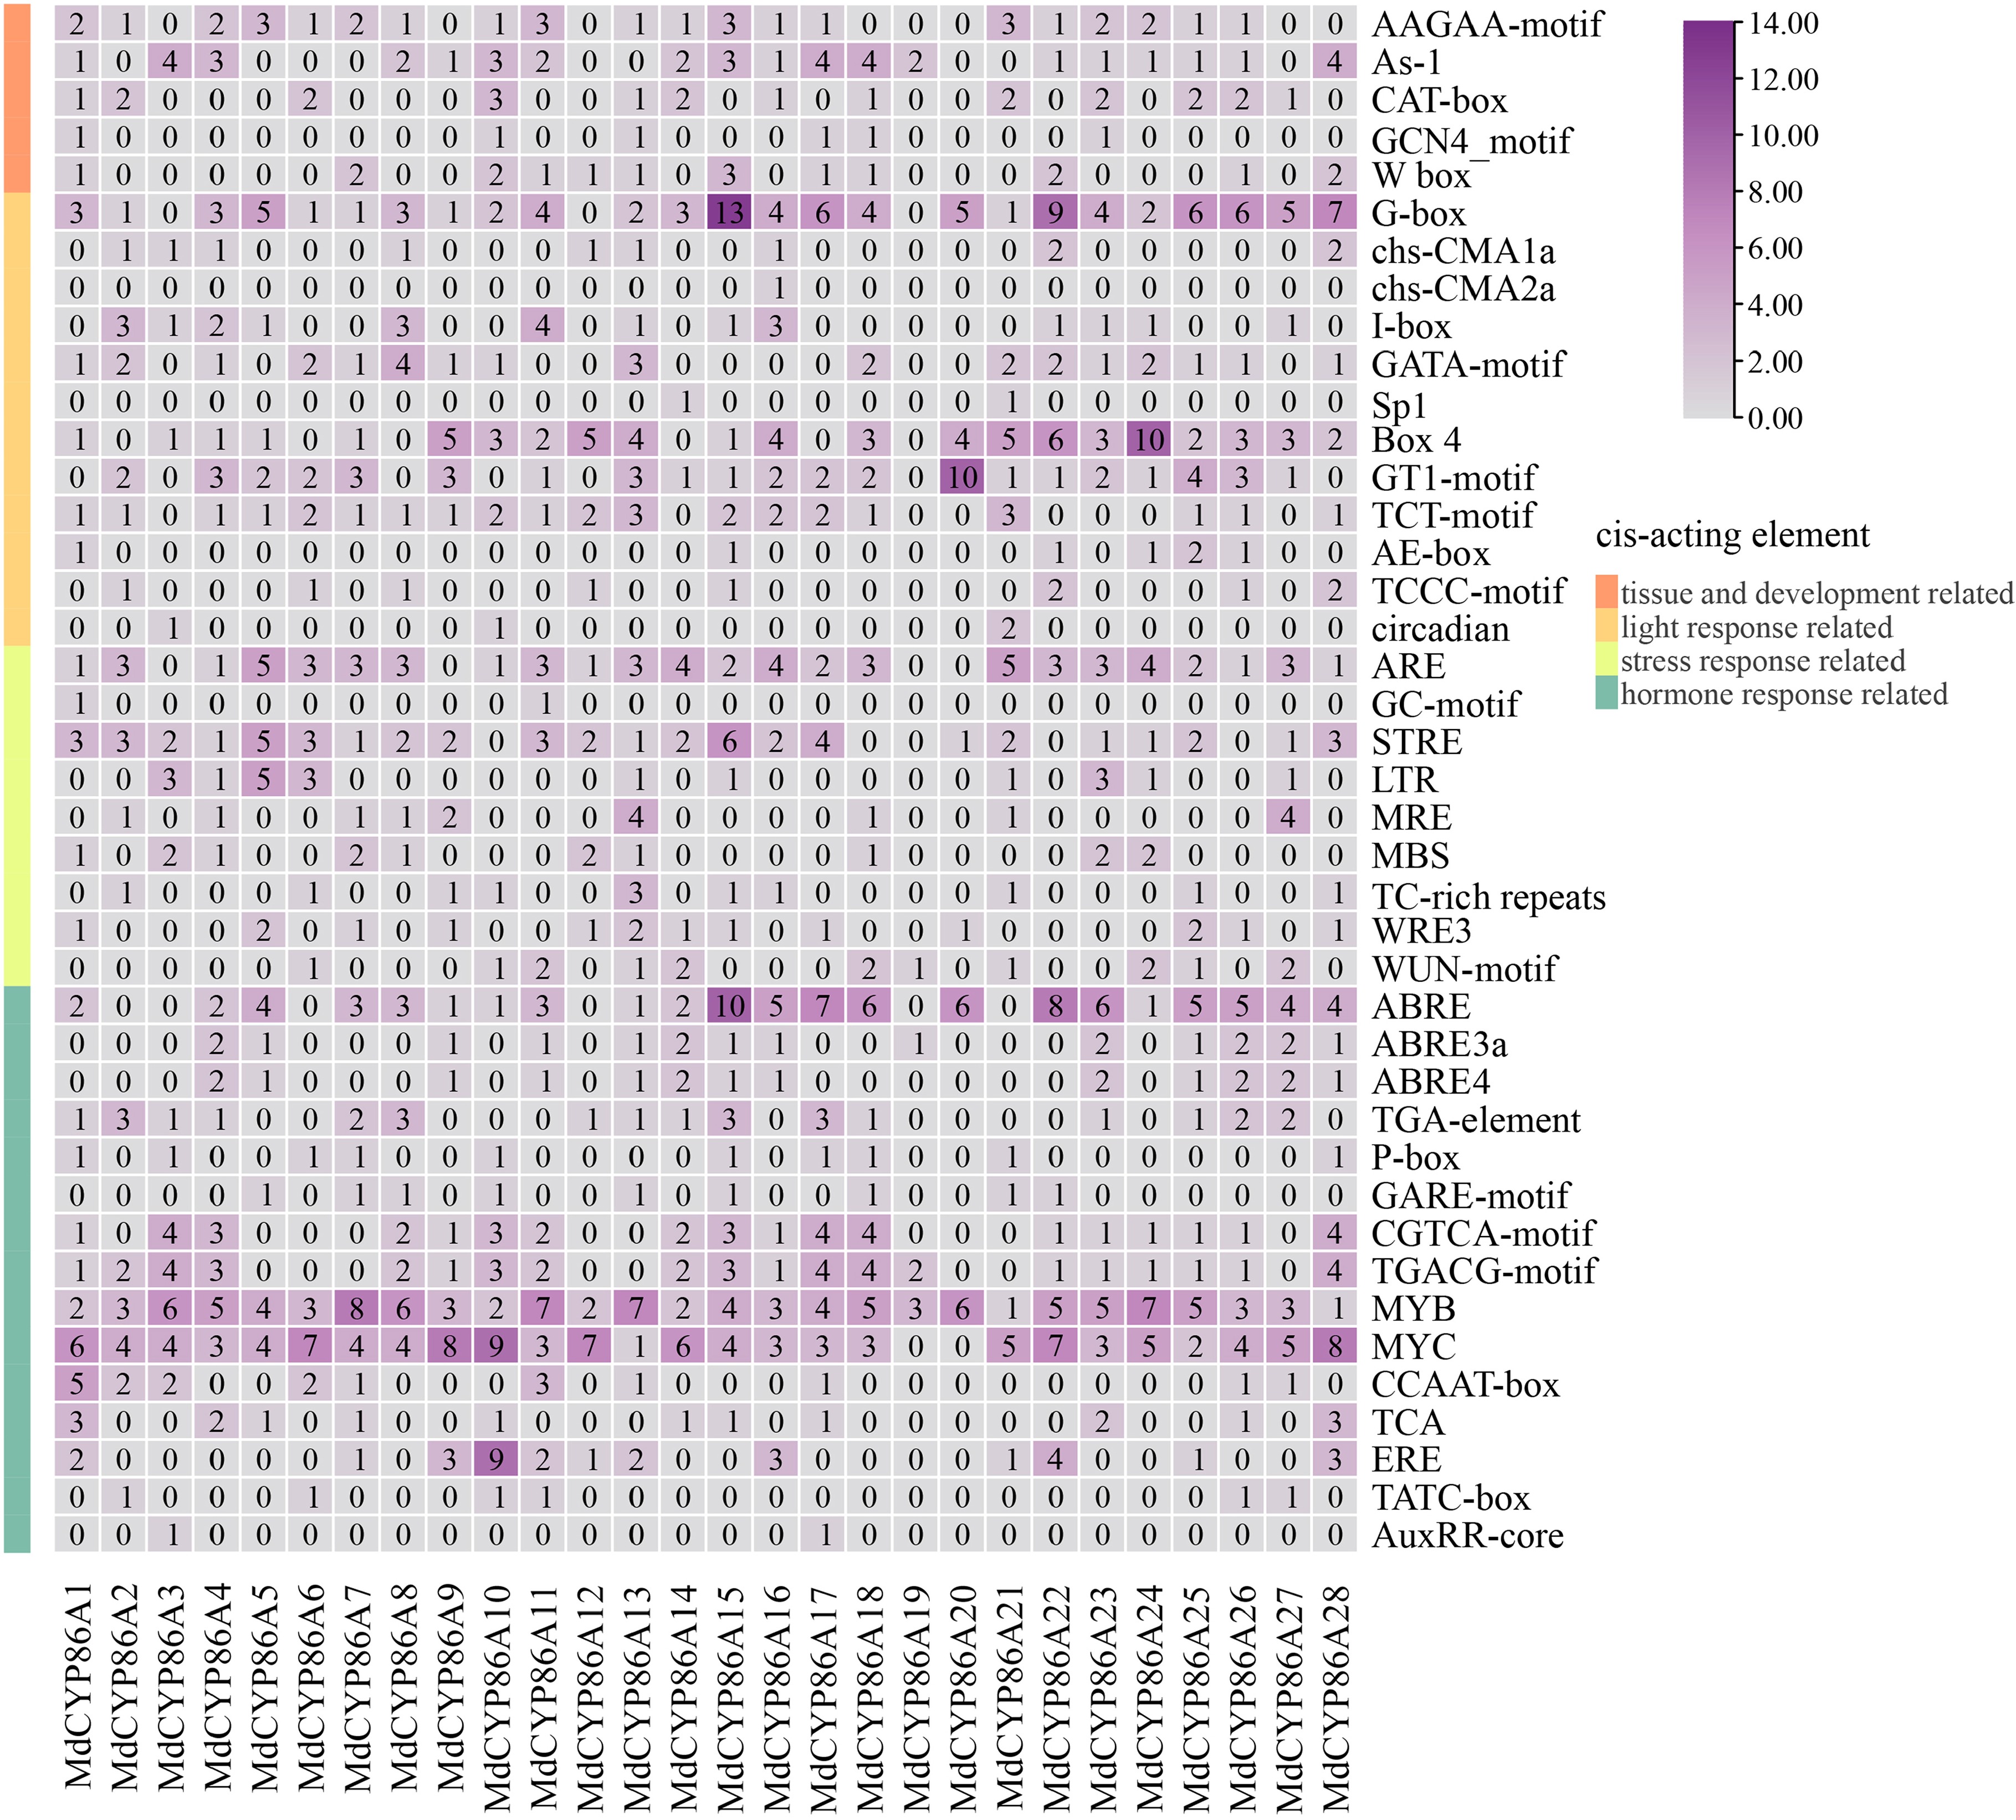
Figure 4.
Cis-acting elements analysis of the MdCYP86A subfamily. The classification of the different types of elements on the left, the gene ID below, and the name of the element on the right. The number representing the number of elements, and a larger number representing higher numbers of that element.
-
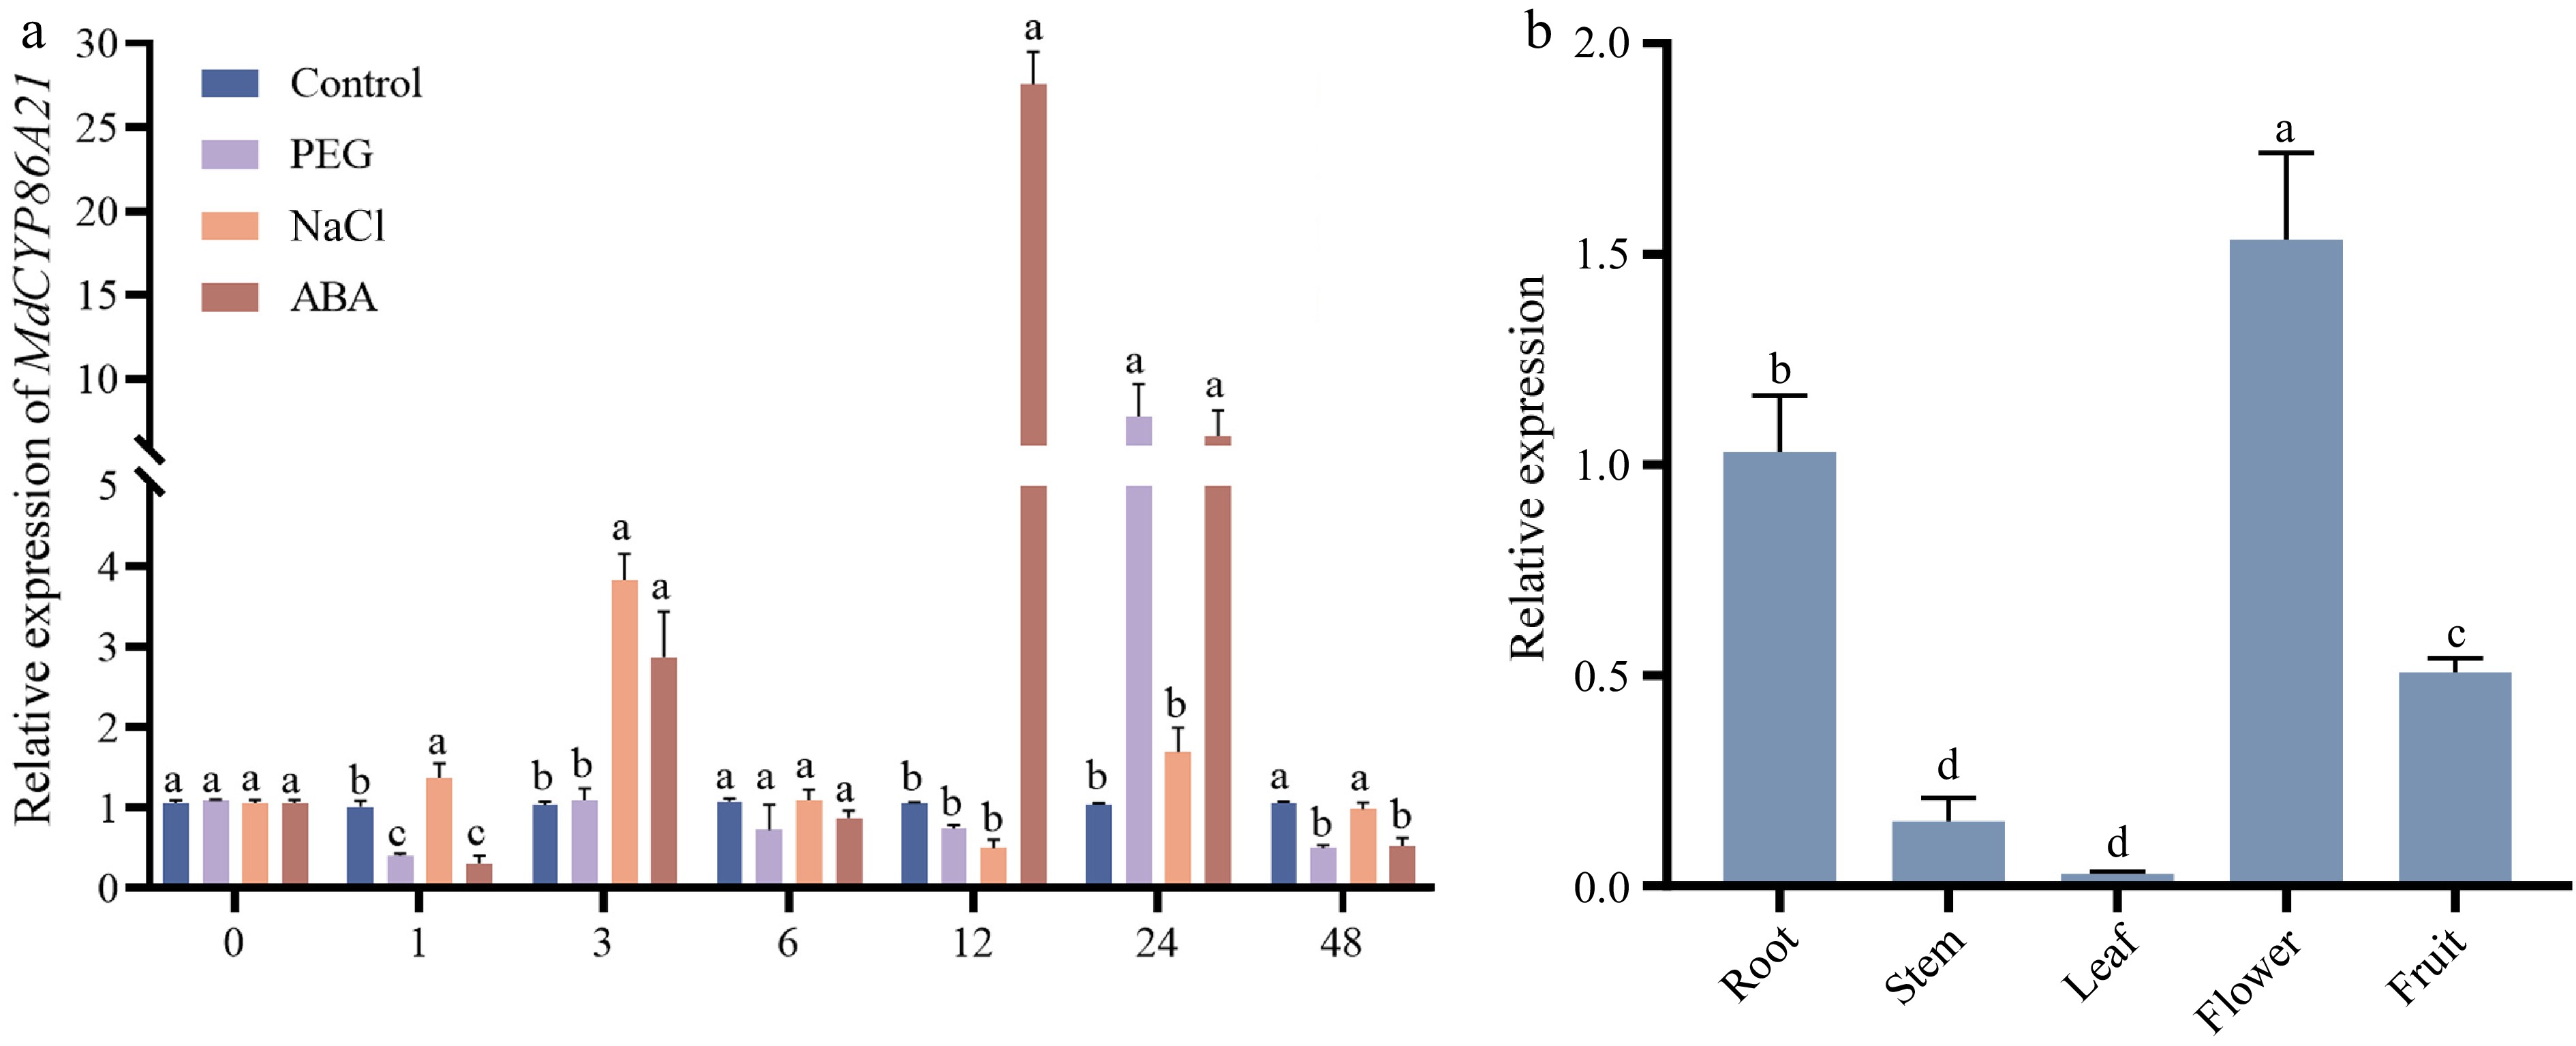
Figure 5.
Expression patterns of MdCYP86A21 in different tissues and abiotic stress. (a) Expression pattern of MdCYP86A21 in response to three abiotic stresses, including PEG, NaCl and ABA. There are three biological replicates of the data, p < 0.05. (b) Expression levels of MdCYP86A21 in root, stem, leave, flower and fruit, there are three biological replicates of the data, p < 0.05.
-
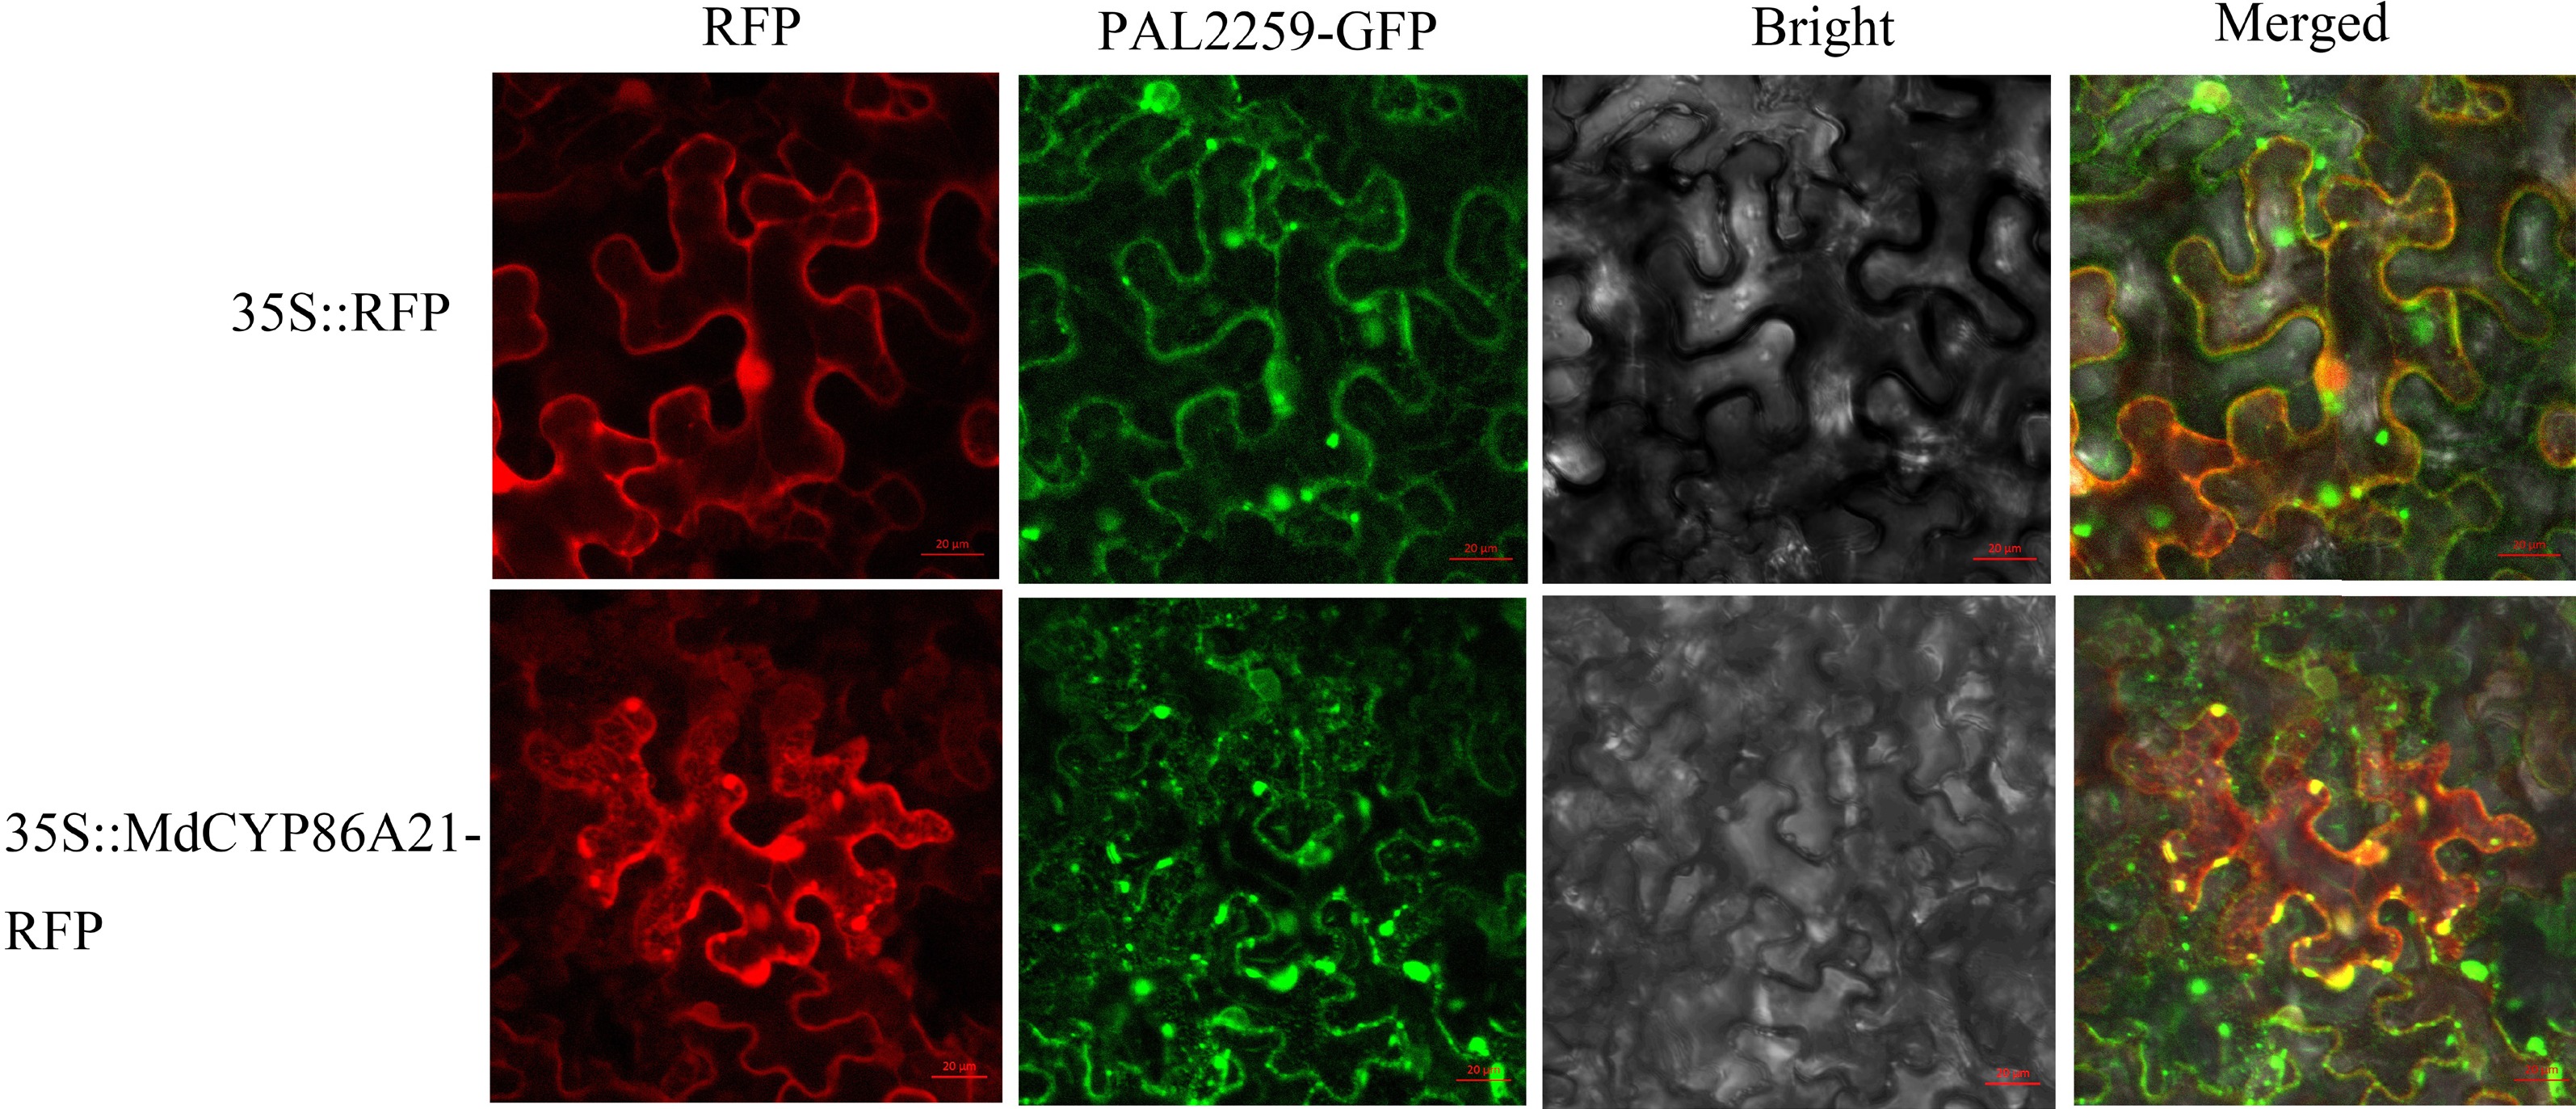
Figure 6.
Subcellular localization of MdCYP86A21, scale bar = 20 μm.
-
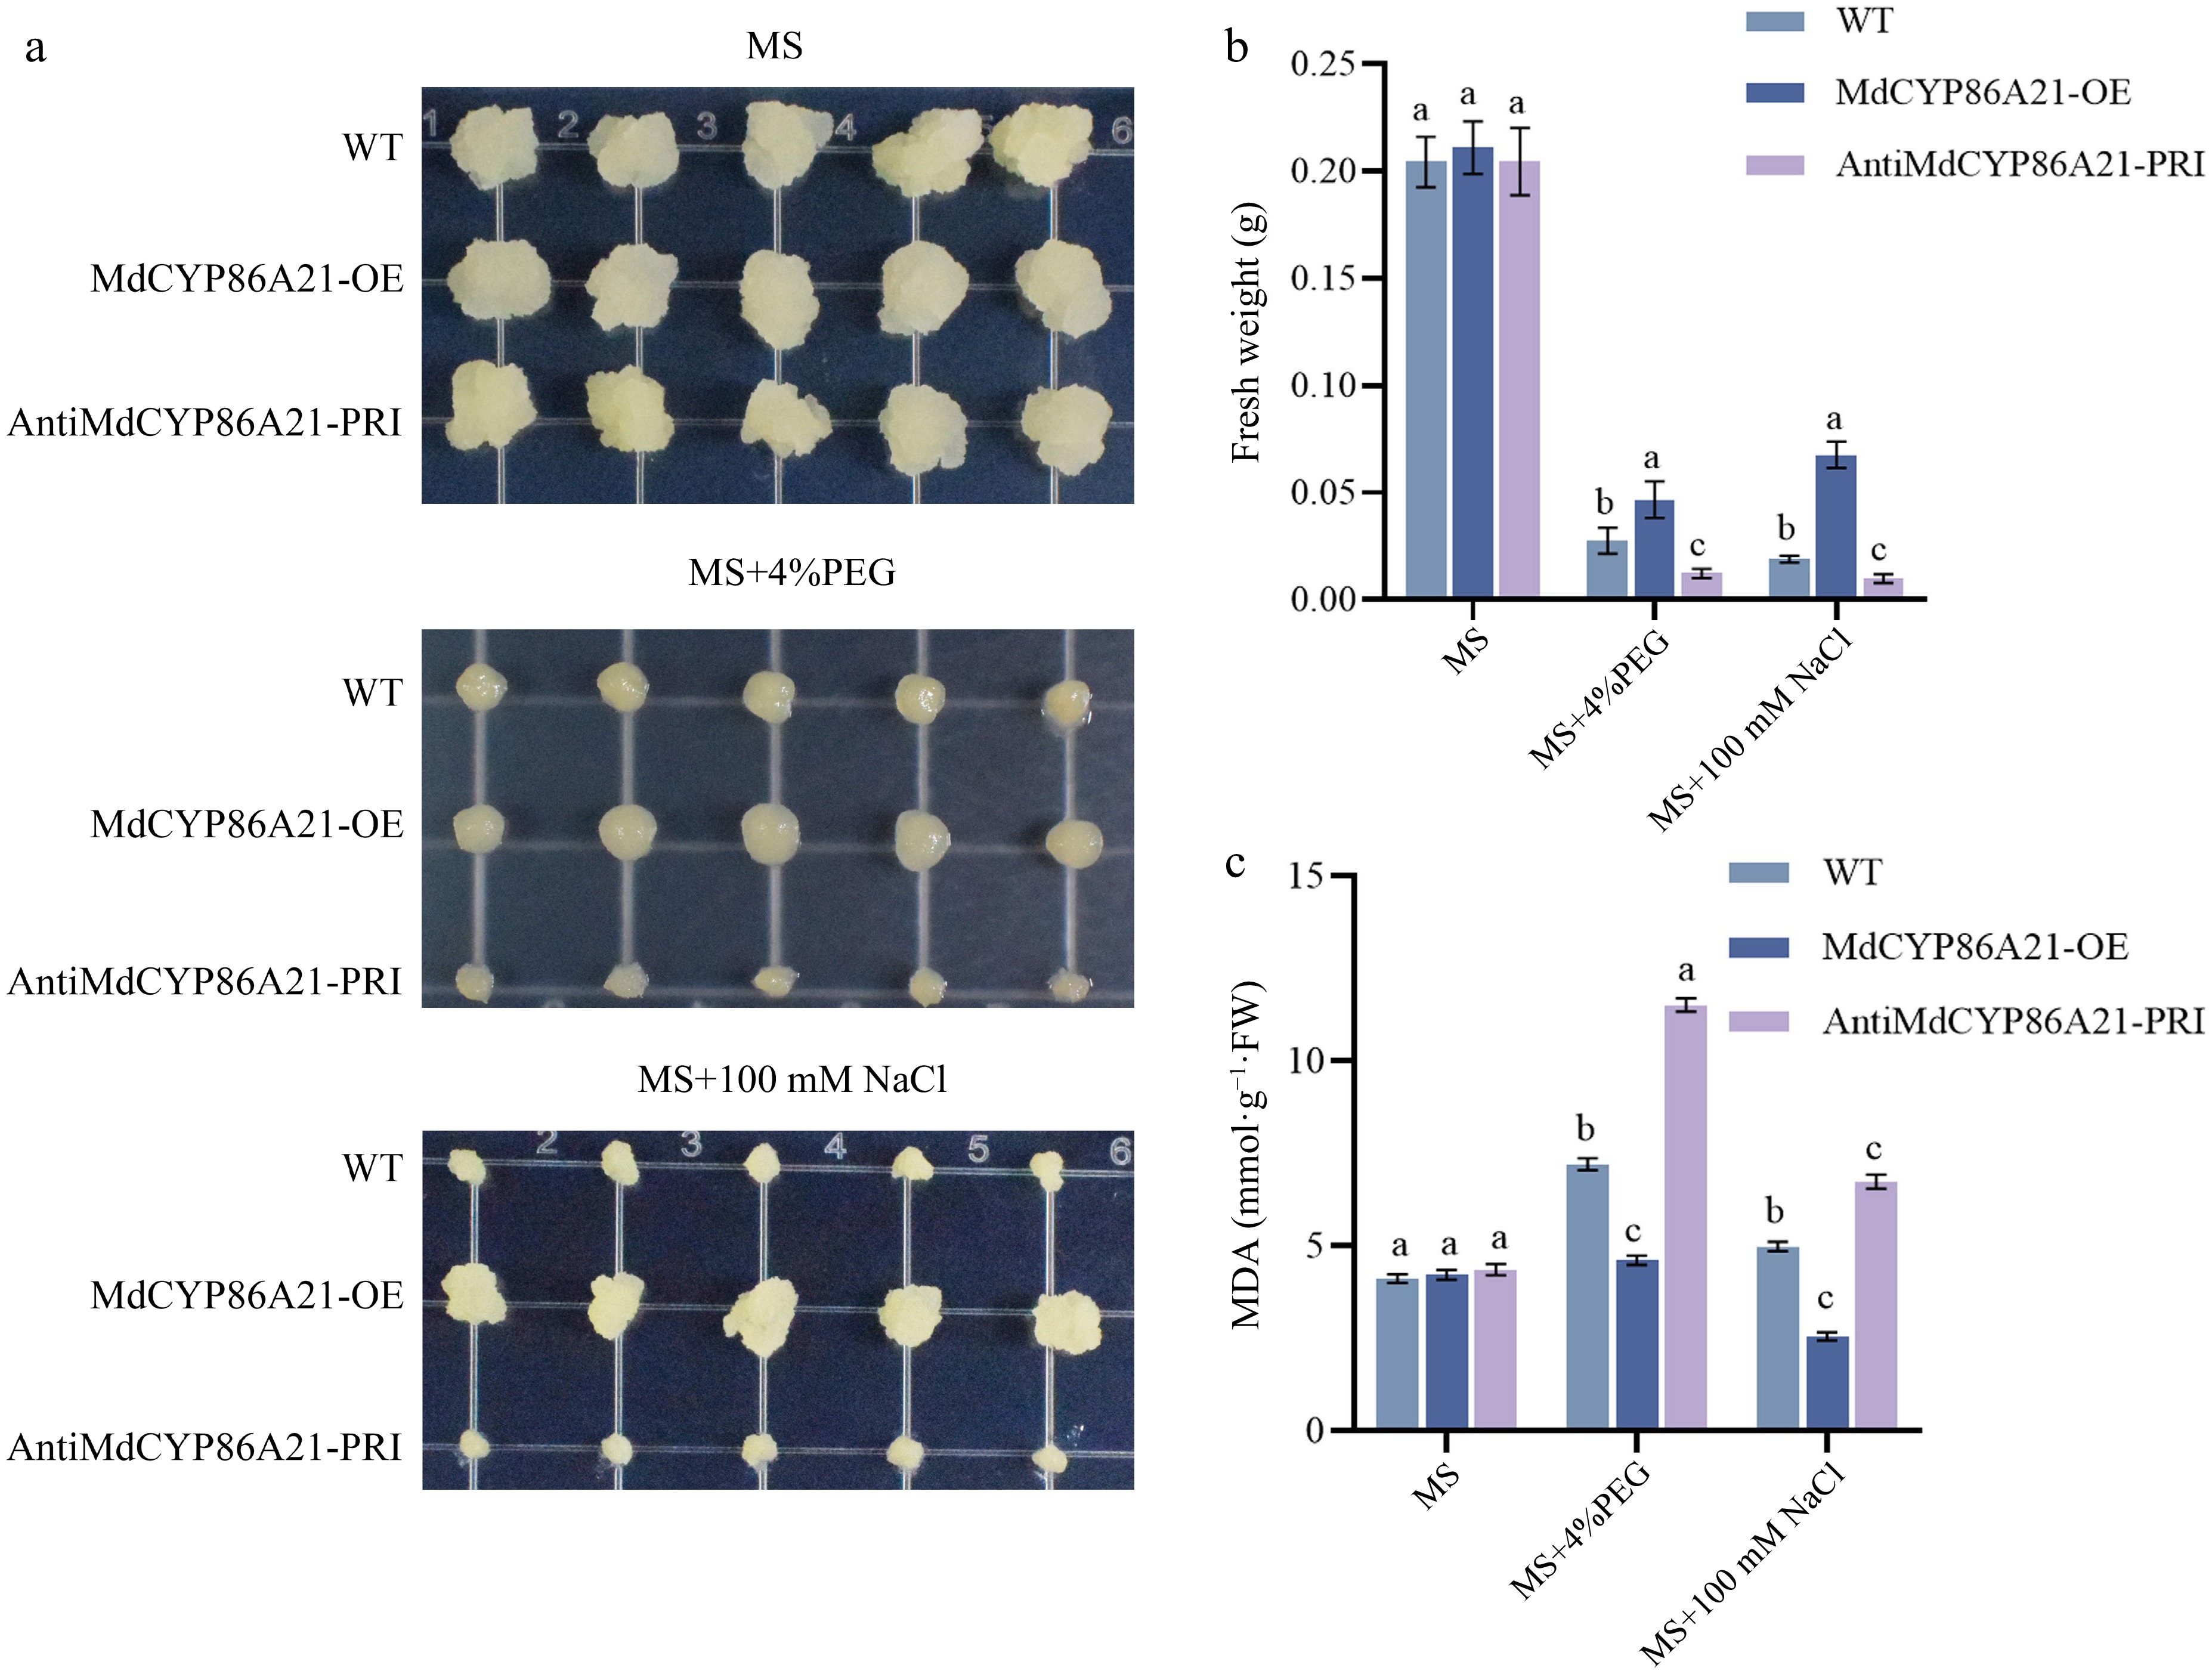
Figure 7.
MdCYP86A21 improves the tolerance to PEG and NaCl. (a) MdCYP86A21 apple calli treated on MS, PEG, NaCl medium for 15 d, the first row is wild type, the second is overexpression, and the third is suppression, five replicates per treatment. (b) Fresh weight of wild-type, overexpressed, and suppression calli were determined under different treatments. (c) Determination of MDA content in wild-type, overexpressed, and suppression calli under different treatments.
-
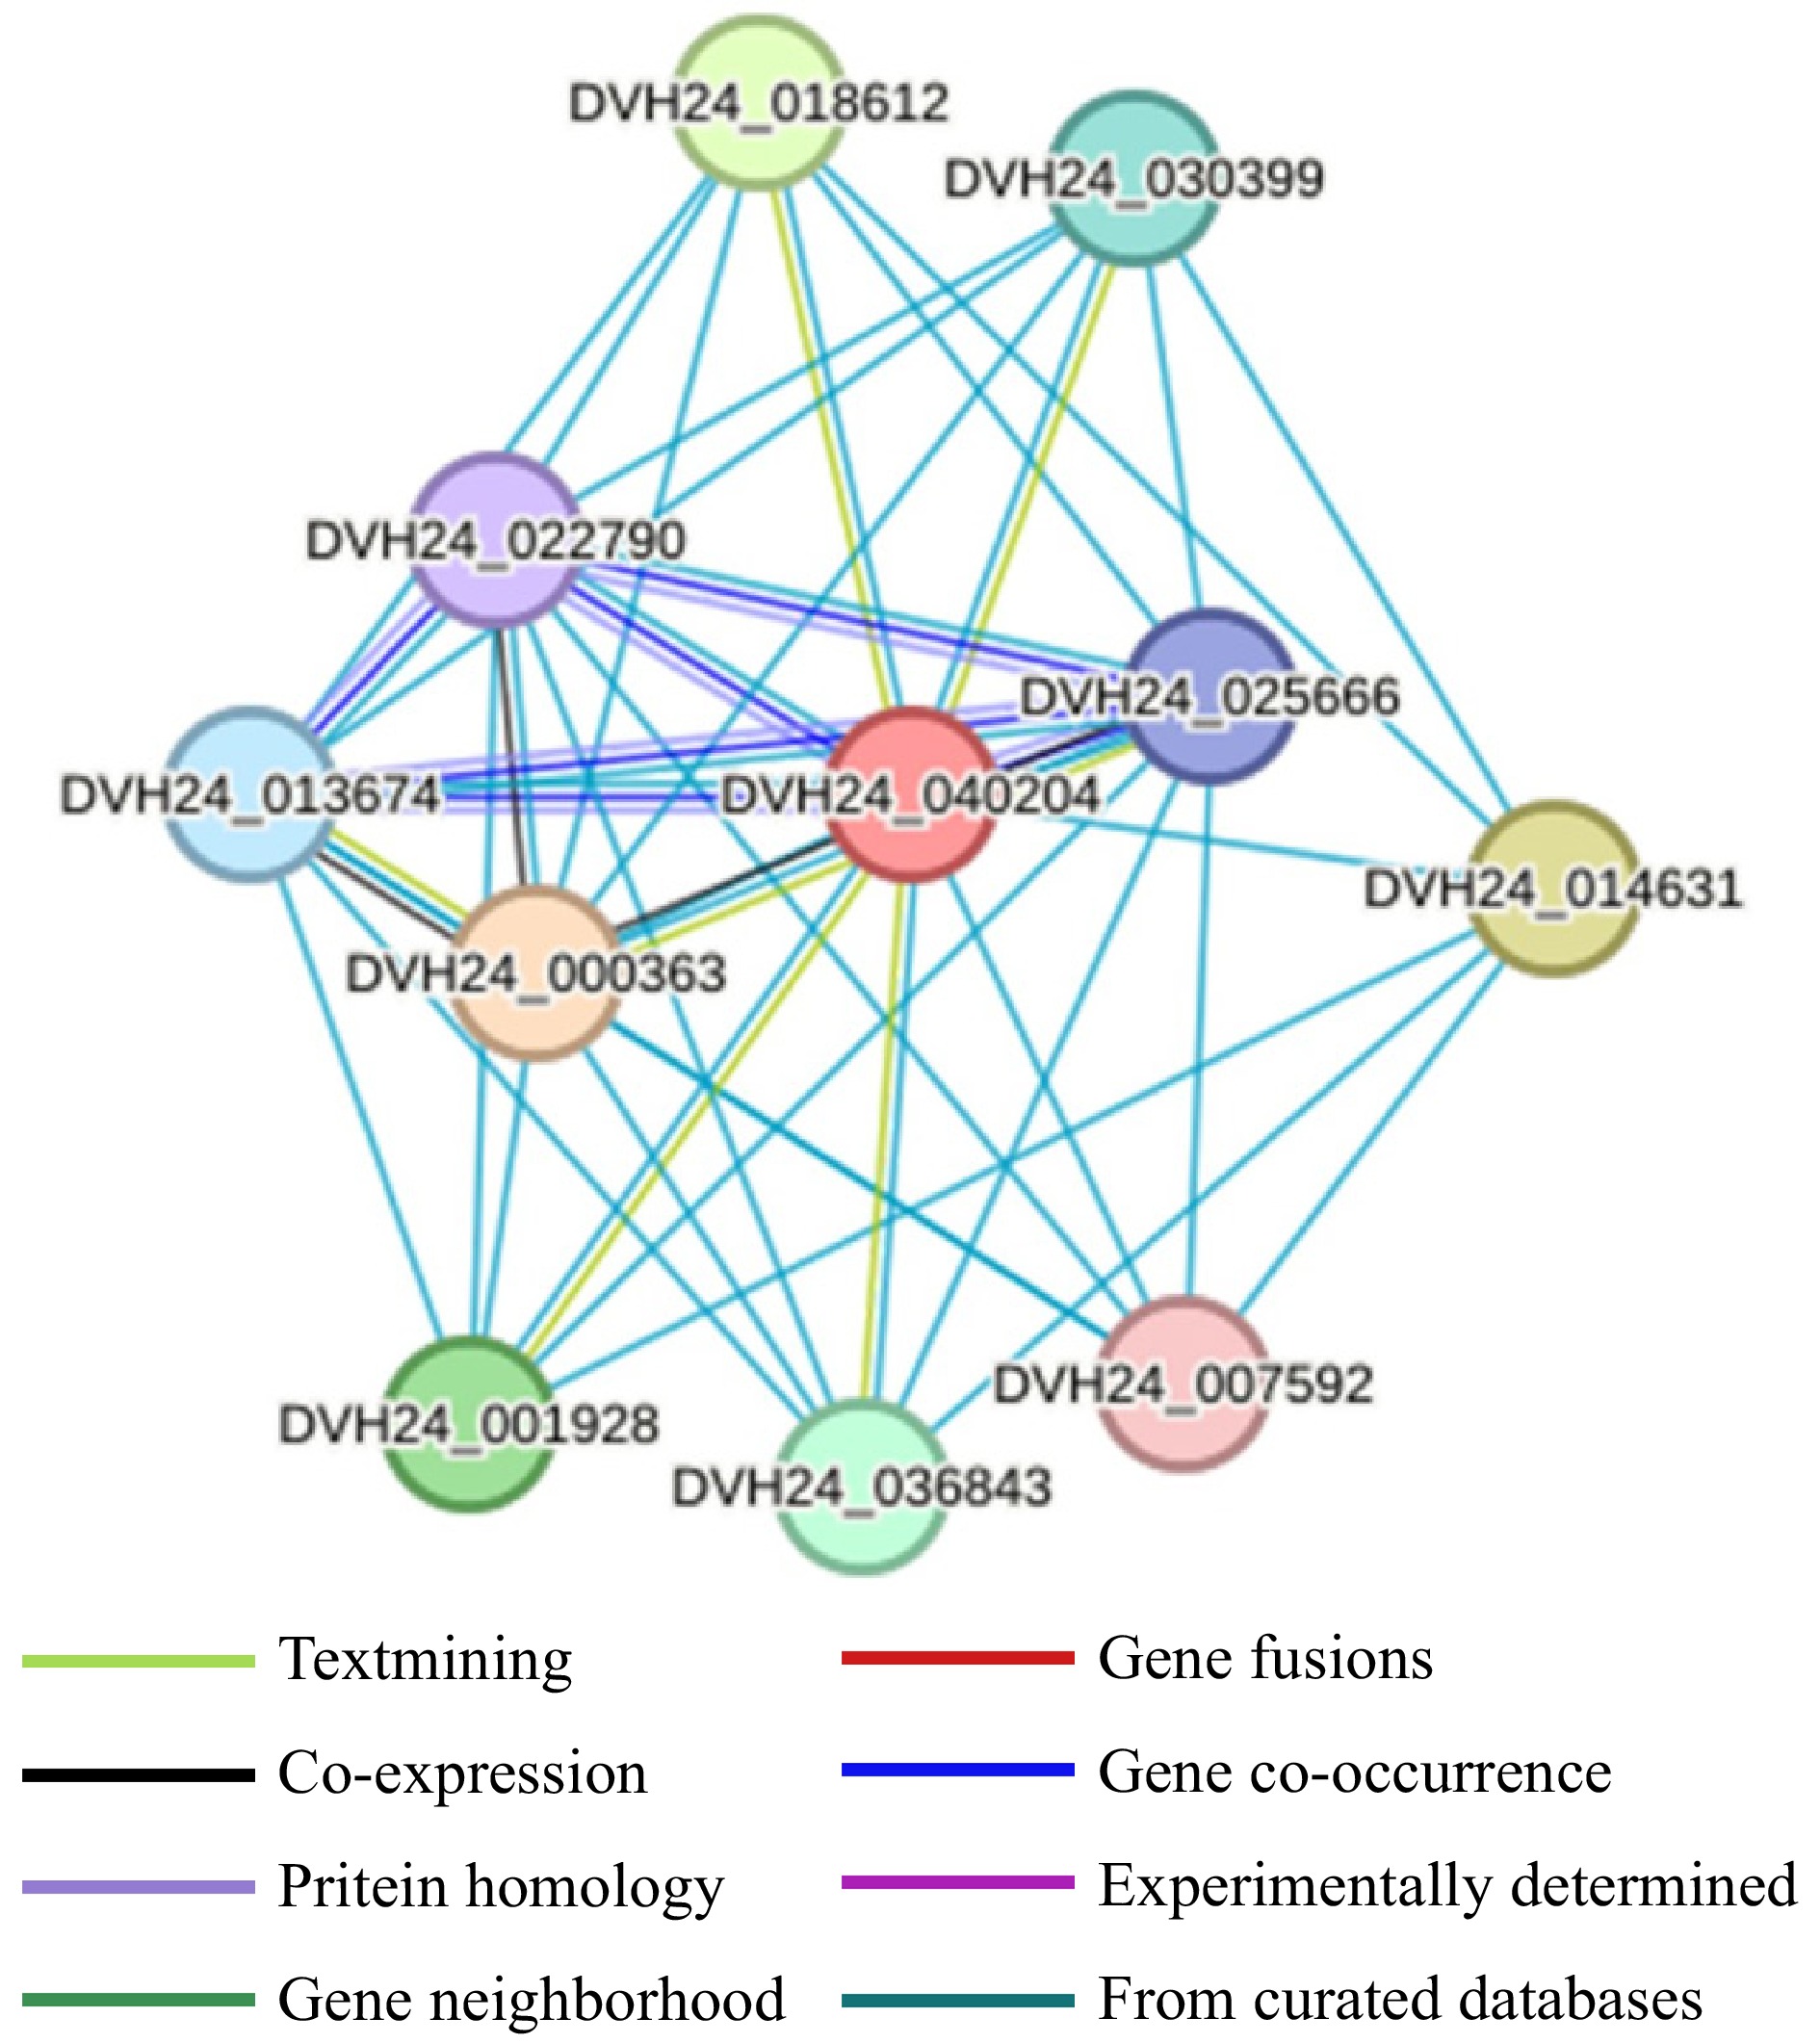
Figure 8.
Protein interactions network analysis of MdCYP86A21.
-
Sequence ID Number of amino acids Molecular weight Theoretical pI Instability index Aliphatic index Grand average of hydropathicity MdCYP86A1 553 62,140.98 5.86 51.14 96.47 −0.029 MdCYP86A2 594 68,147.91 9.05 33.81 94.6 −0.183 MdCYP86A3 508 58,180.4 8.77 30.04 95.63 −0.131 MdCYP86A4 503 58,126.88 8.86 33.51 85.31 −0.213 MdCYP86A5 585 67,211.62 8.19 36.64 89.85 −0.221 MdCYP86A6 753 87,408.56 6.3 41.04 87.78 −0.232 MdCYP86A7 512 59,231.46 8.31 38.68 89.28 −0.138 MdCYP86A8 522 58,977.08 9.16 41.38 90.65 −0.161 MdCYP86A9 524 59,217.2 8.85 39.72 90.5 −0.124 MdCYP86A10 508 57,785.03 8.2 40.48 84.45 −0.306 MdCYP86A11 535 60,662.44 8.15 43.34 94.64 −0.081 MdCYP86A12 513 58,460.27 8.84 40.19 94.56 −0.066 MdCYP86A13 516 59,081.04 7.97 42.69 89.59 −0.178 MdCYP86A14 525 59,381.74 6.17 50.18 97.89 −0.042 MdCYP86A15 423 48,120.41 6.35 35.13 92.25 −0.194 MdCYP86A16 514 58,923.46 7.95 44.63 89.32 −0.131 MdCYP86A17 506 57,795.41 8.9 41.48 86.5 −0.234 MdCYP86A18 506 57,541.1 9.03 41.64 85.18 −0.236 MdCYP86A19 522 59,333.65 8.59 30.91 94.16 −0.104 MdCYP86A20 544 62,600.47 8.45 37.62 88.88 −0.176 MdCYP86A21 574 65,958.23 8.81 39.96 89.51 −0.229 MdCYP86A22 521 59,981.17 8.65 38.03 94.45 0.034 MdCYP86A23 534 60,600.33 8.68 40.6 95.51 −0.098 MdCYP86A24 512 58,494.1 9.02 41.24 92.48 −0.088 MdCYP86A25 520 59,435.27 8.3 41.37 88.71 −0.192 MdCYP86A26 523 60,084.98 6.38 46.06 92.1 −0.152 MdCYP86A27 507 58,722.86 8.55 35.93 91.68 −0.113 MdCYP86A28 506 57,839.15 7.55 47.57 89.98 −0.092 Table 1.
The physicochemical properties of the MdCYP86As family proteins.
Figures
(8)
Tables
(1)