-
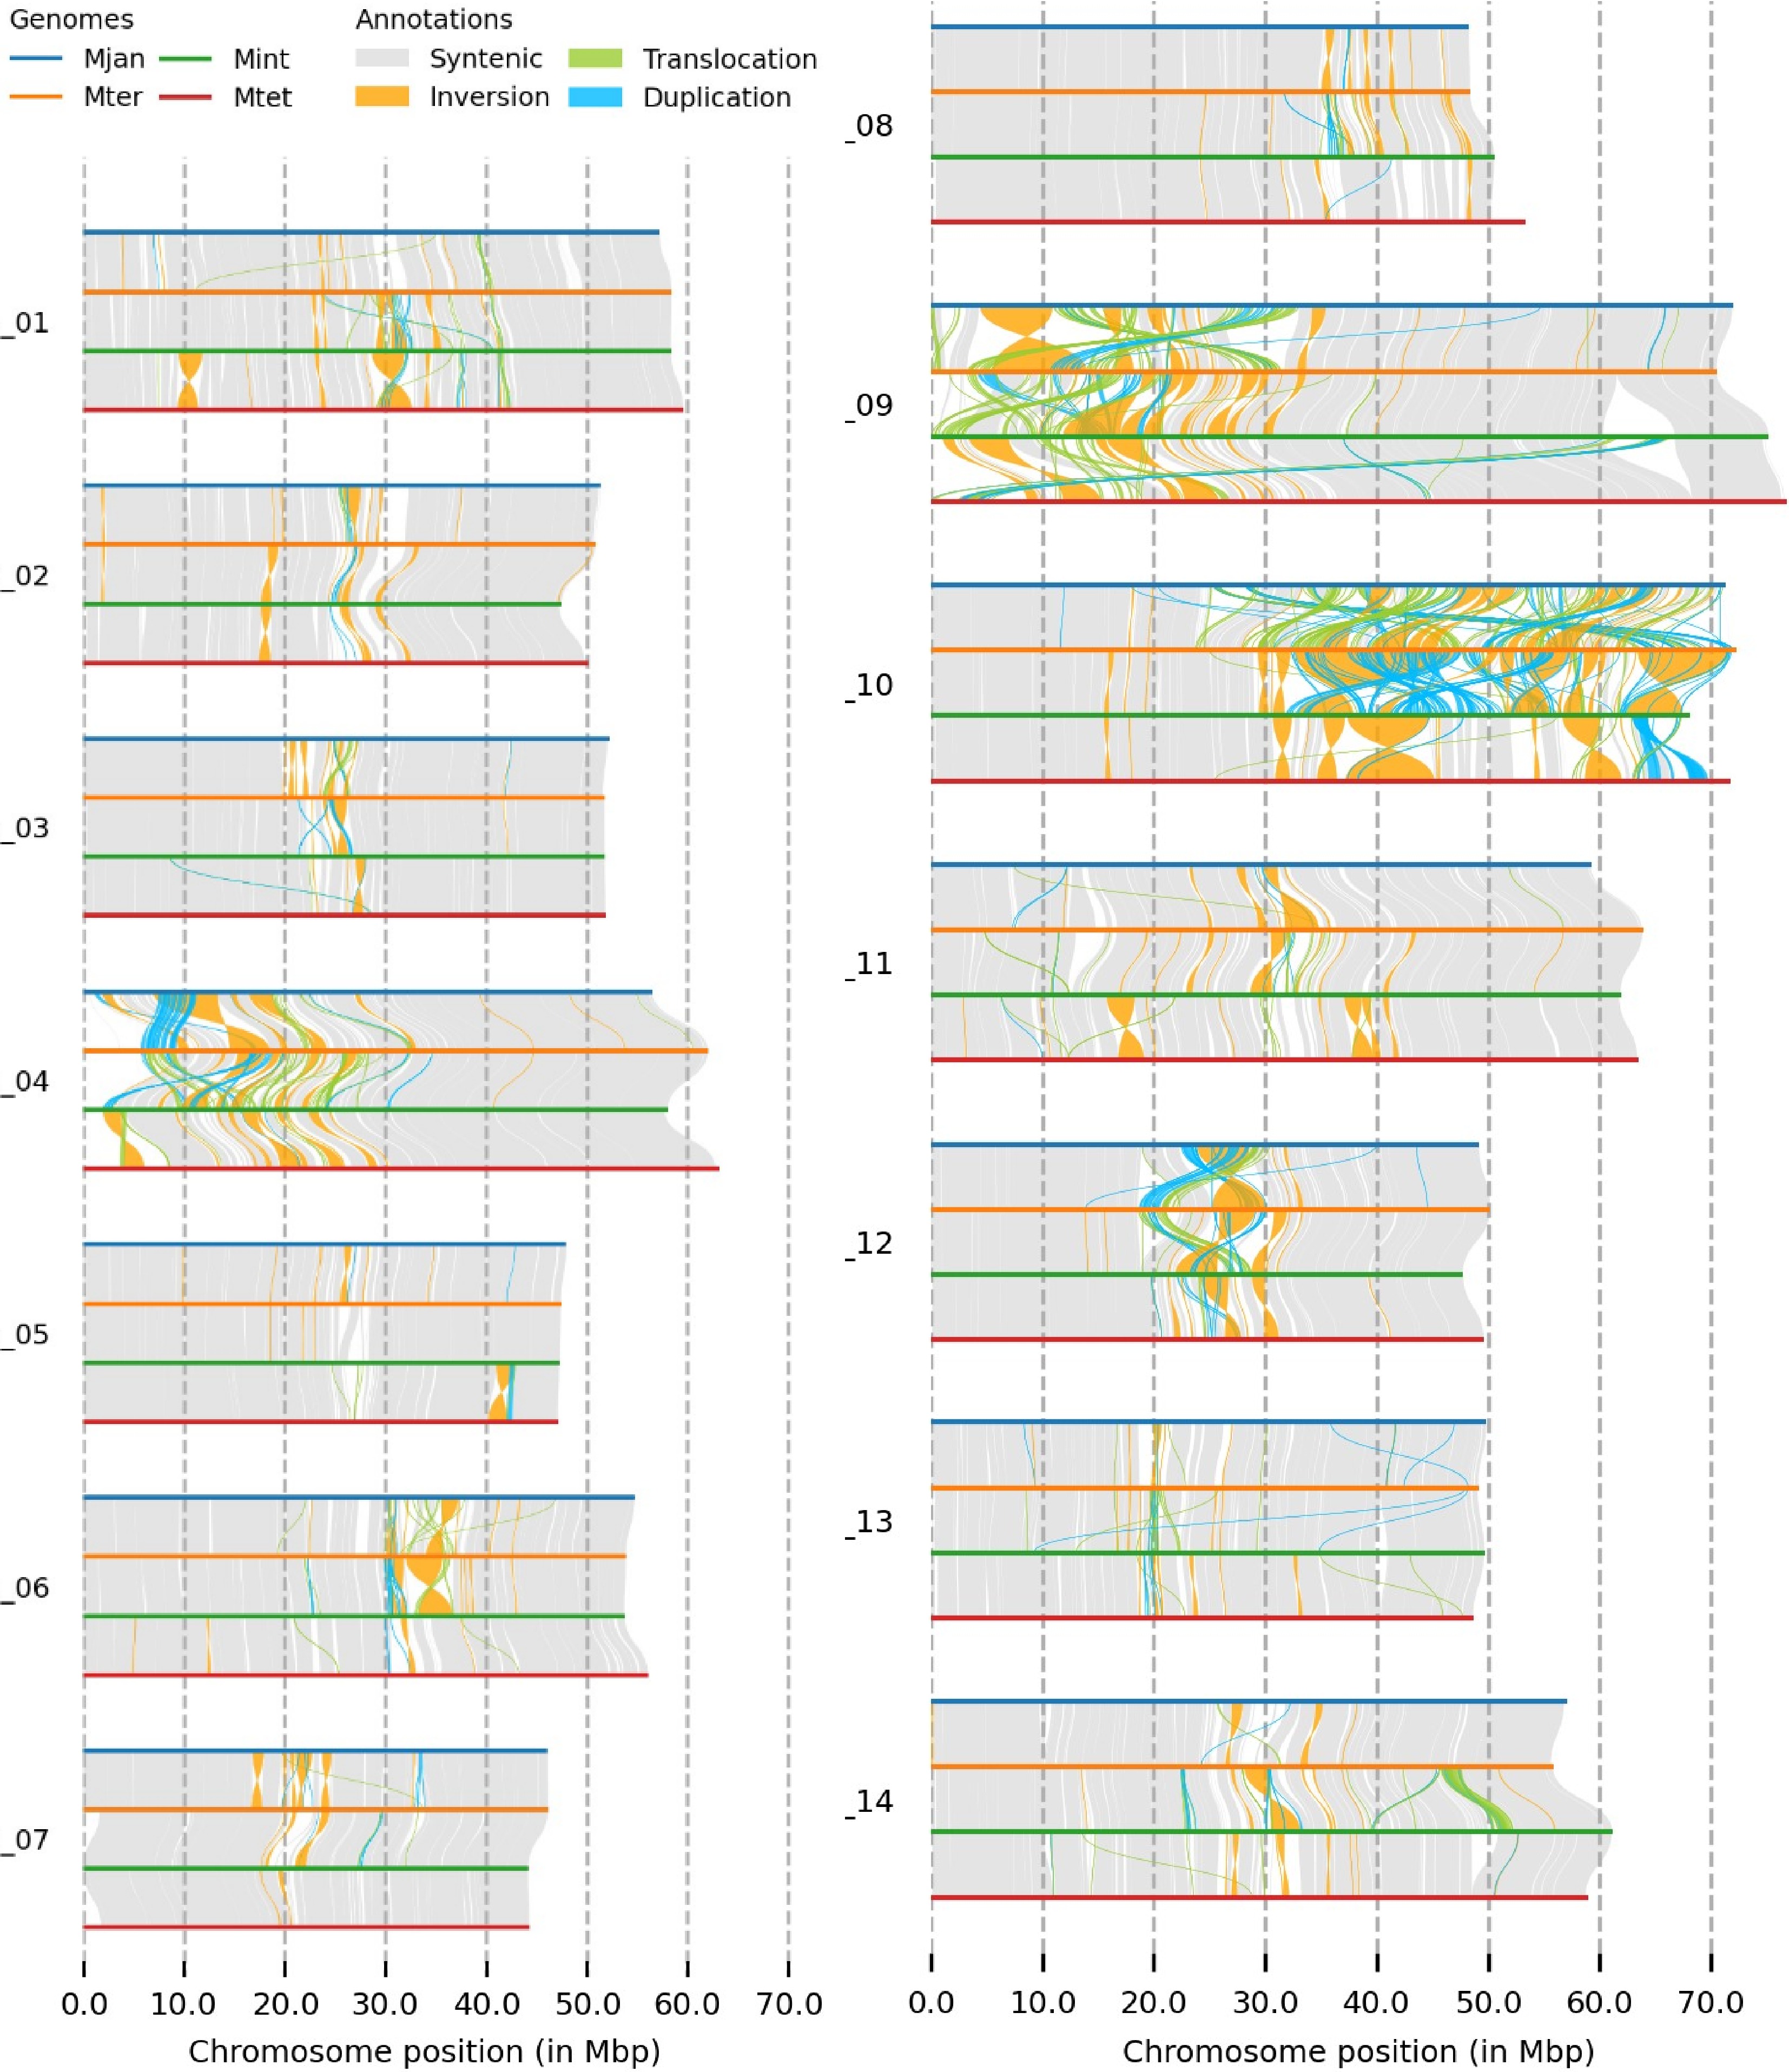
Figure 1.
The genome structure comparison of four Macadamia species, with different colours denoting each species and structural rearrangements (synteny, inversion, translocation, and duplication) as indicated on the top of the image.
-
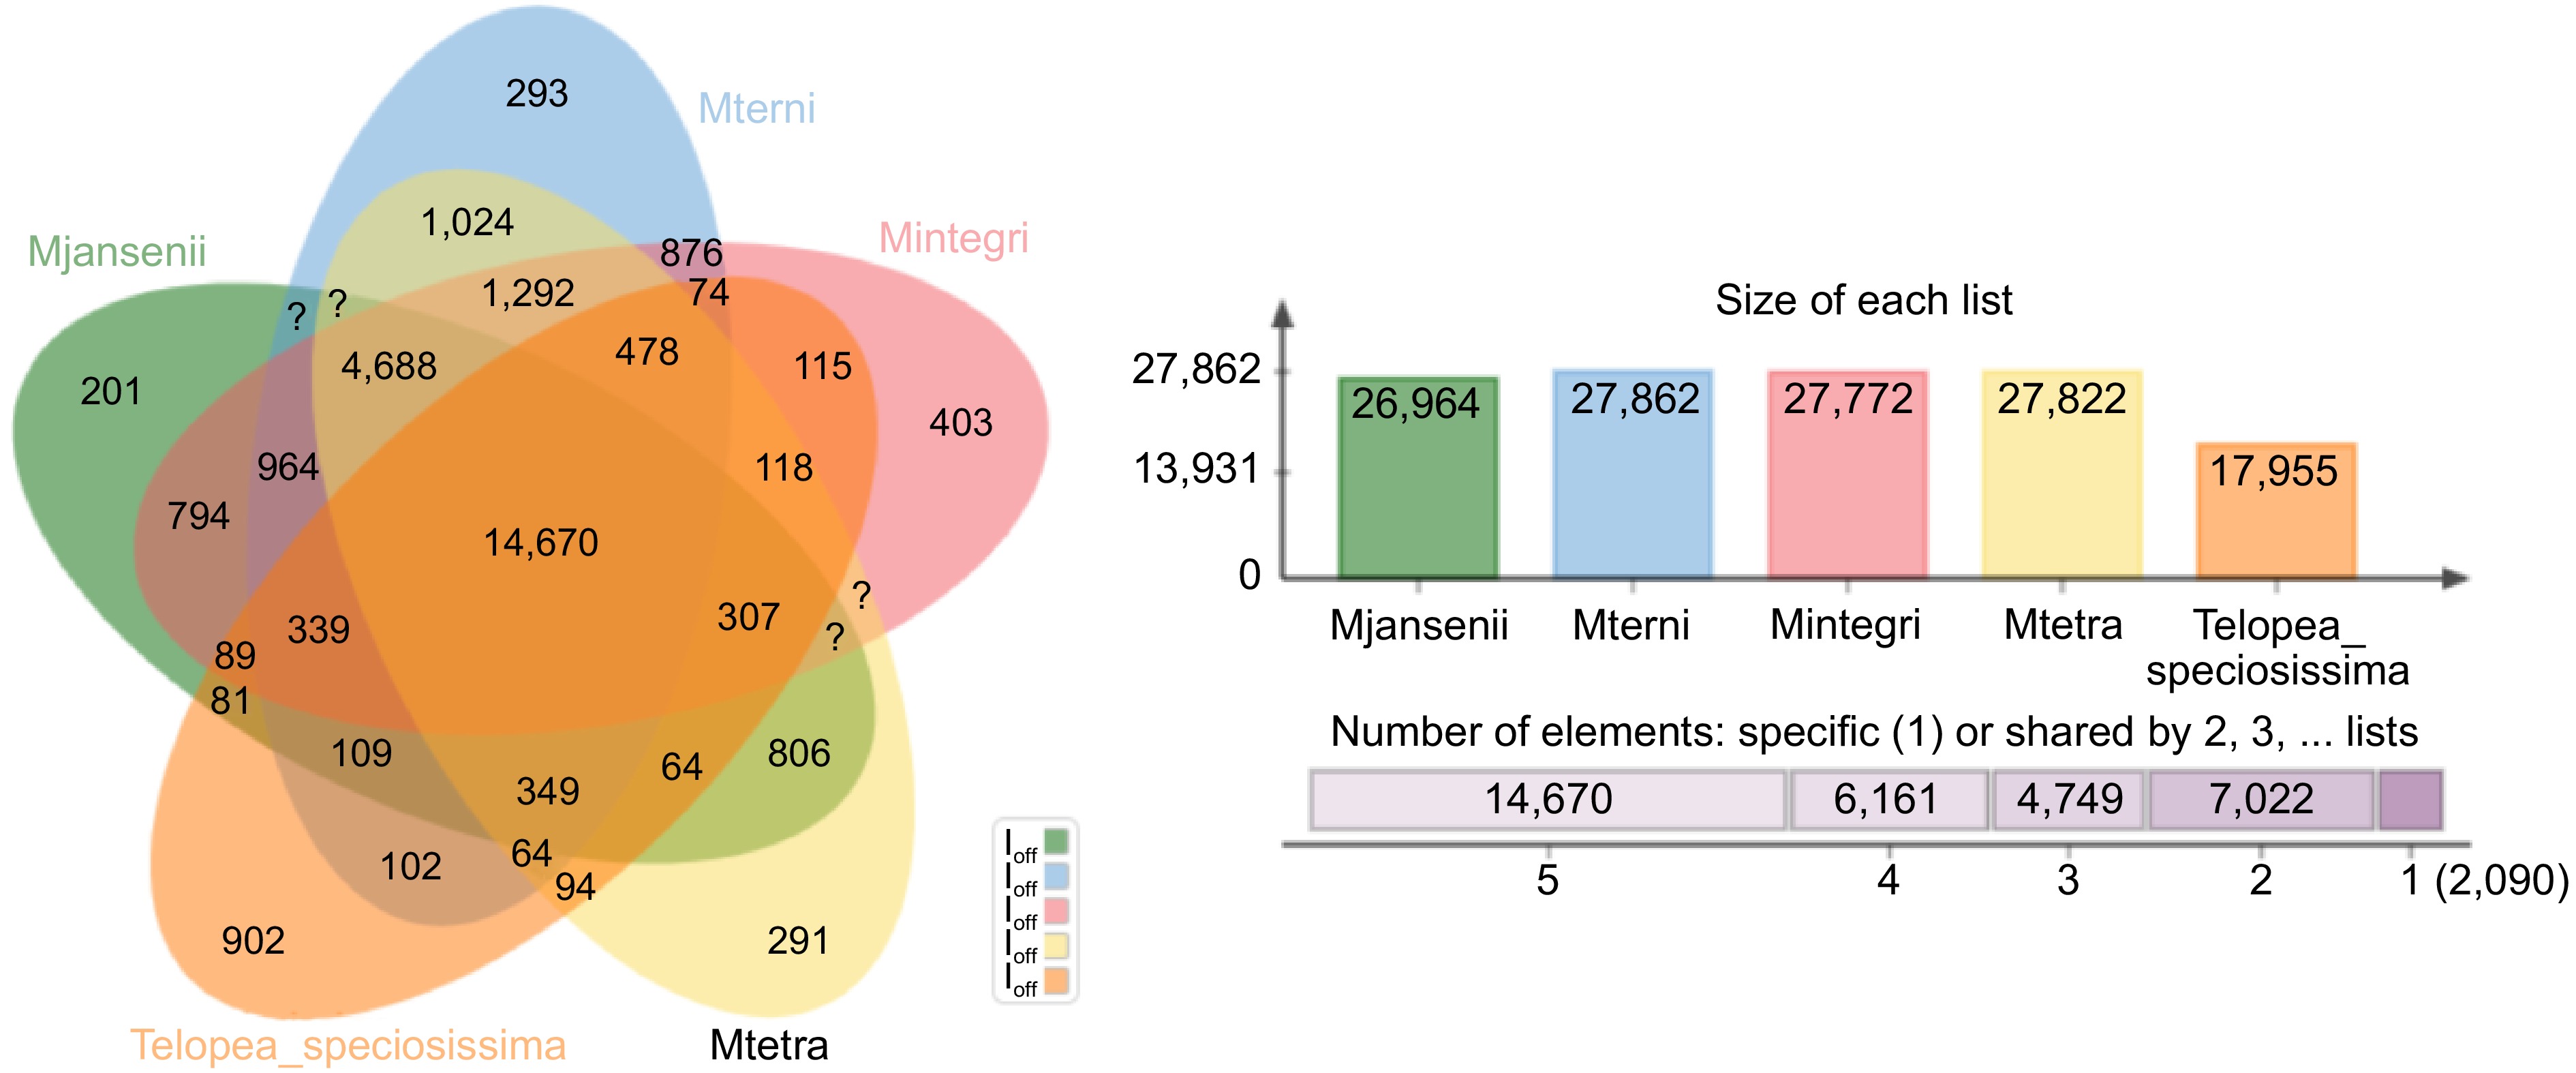
Figure 2.
A Venn-diagram showing clusters of orthologous groups of genes (OGs) for the four Macadamia species and T. speciosissima. Number of orthologous groups (OGs) belonging to core genome (OGs common among all five species- union of all circles), number of singletons (unique genes—outer area of each circle), and the common ones of remaining different combination of all five species (in between the core and the periphery of the diagram) are described.
-
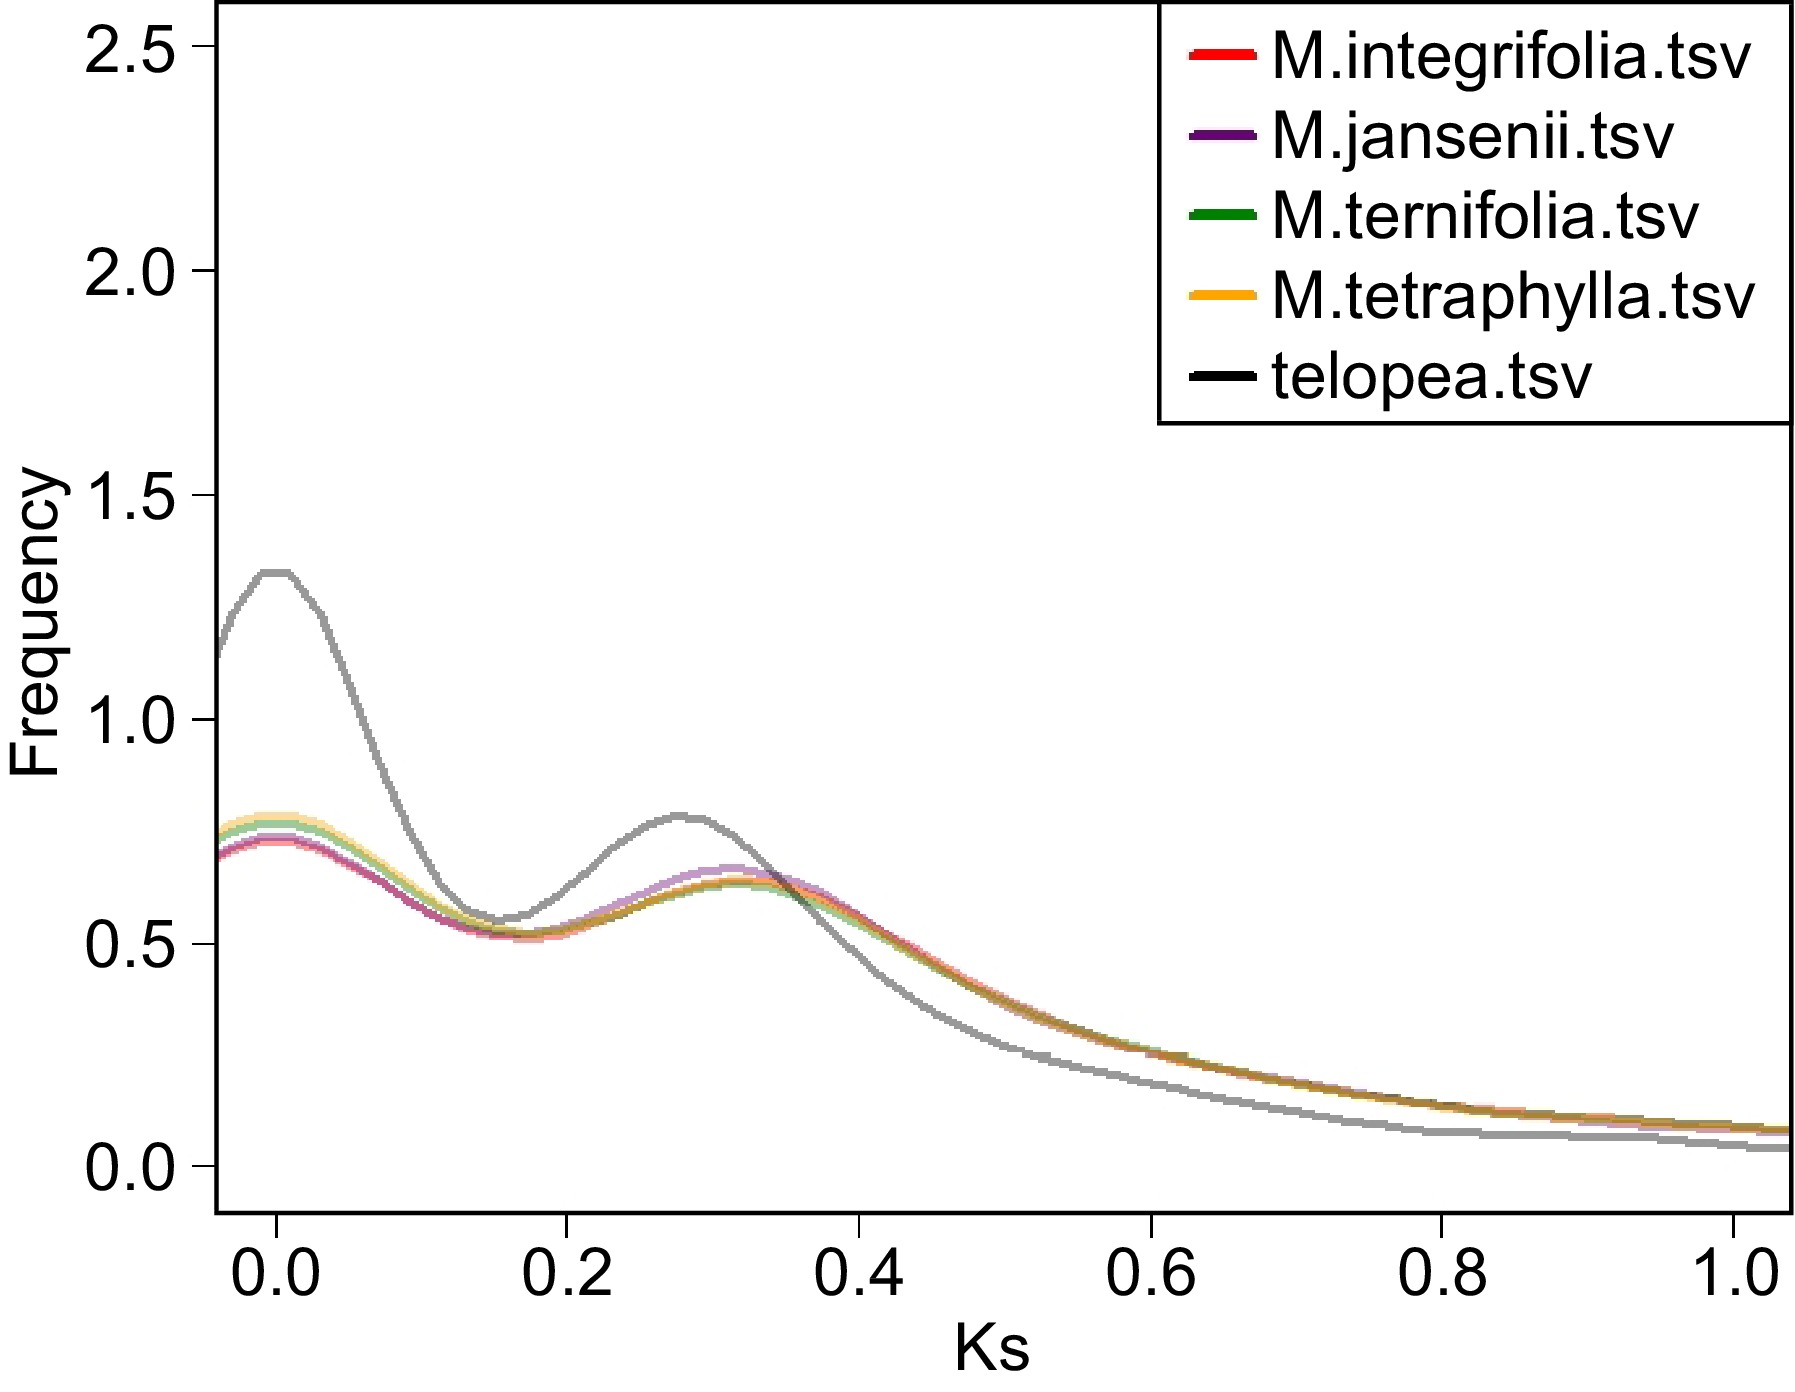
Figure 3.
Ks distribution plot of the four Macadamia species and Telopea. The colour code of each species is provided on the top left corner.
-
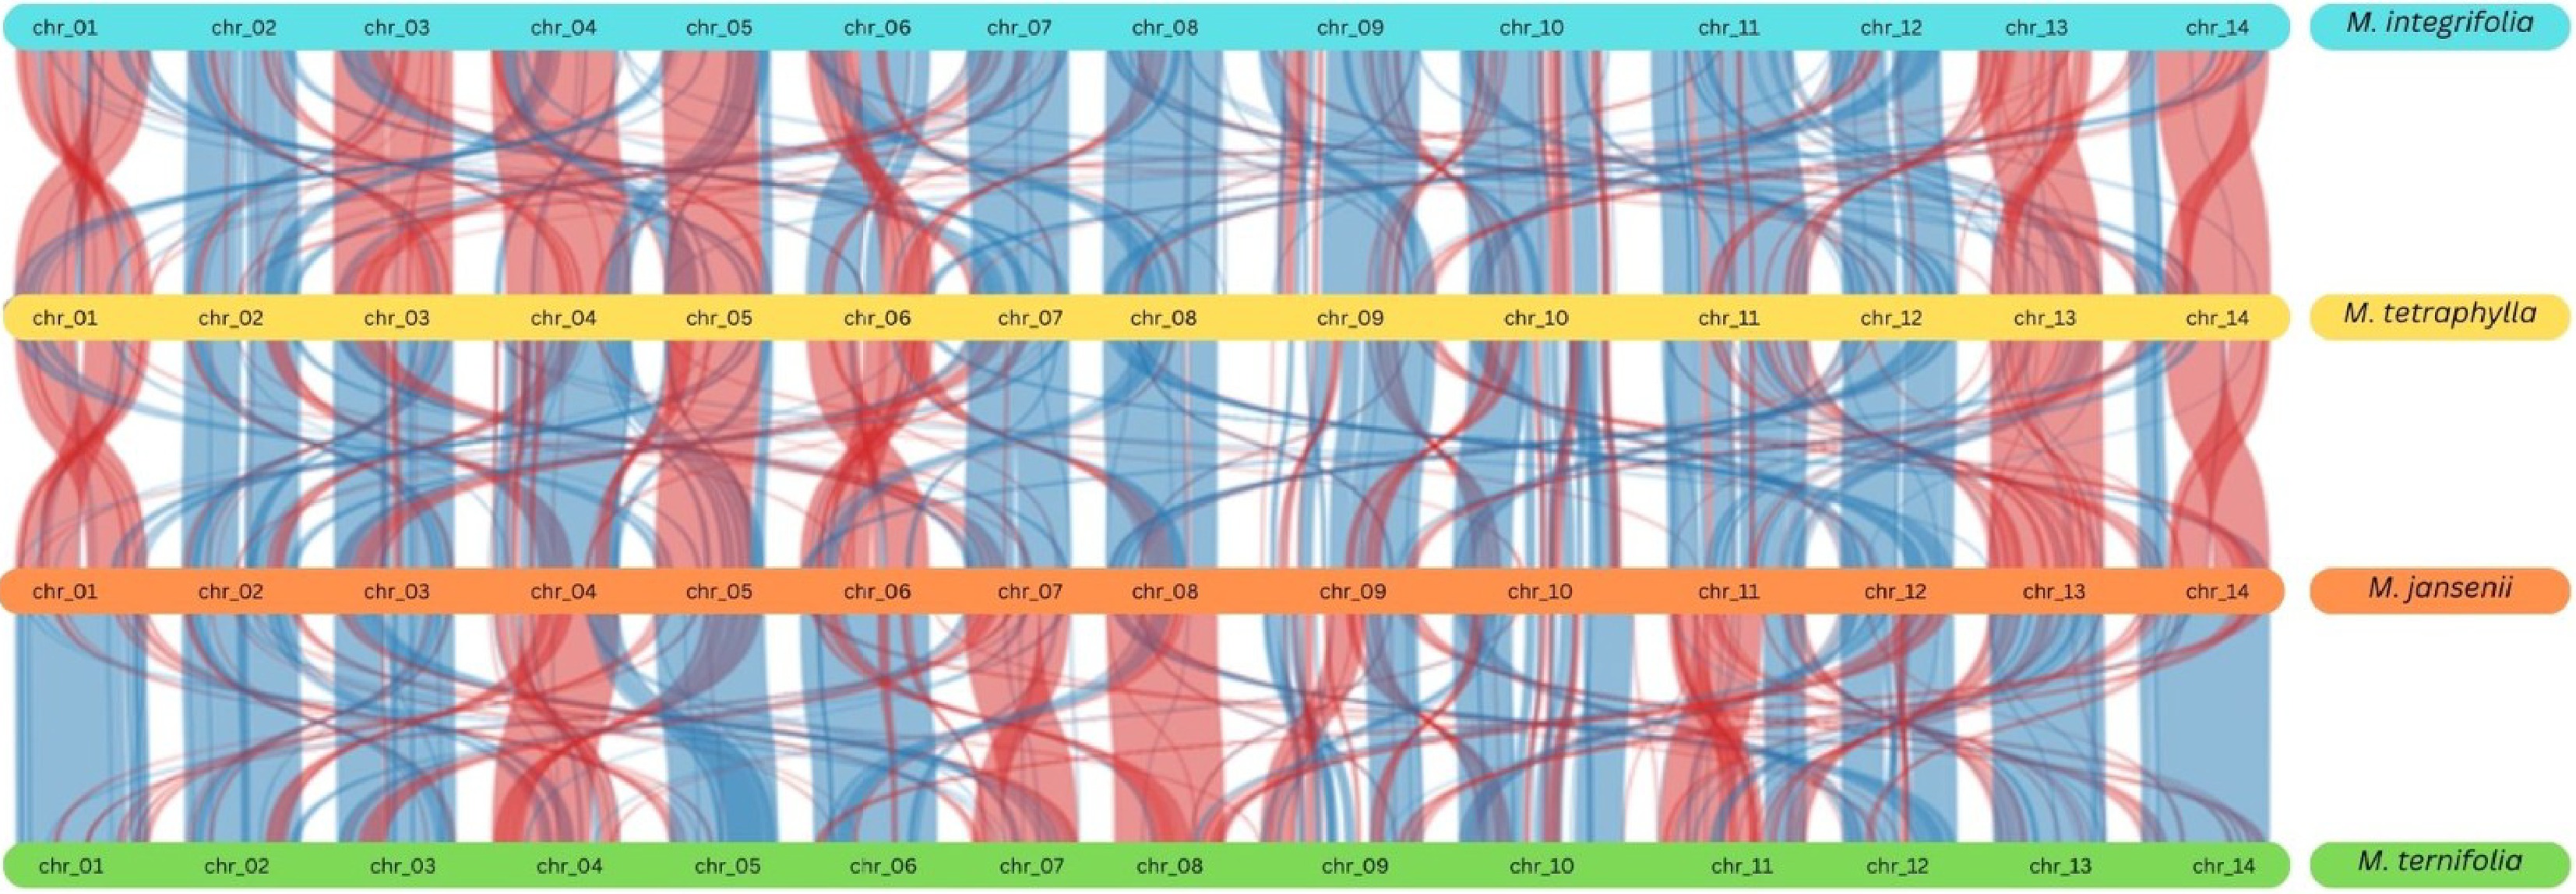
Figure 4.
Synteny plot across all the four Macadamia species. The vertical lines connect orthologous genes across the four species. The blue coloured ribbons represent the regular conserved regions while the red ribbons represent the inverted regions.
-
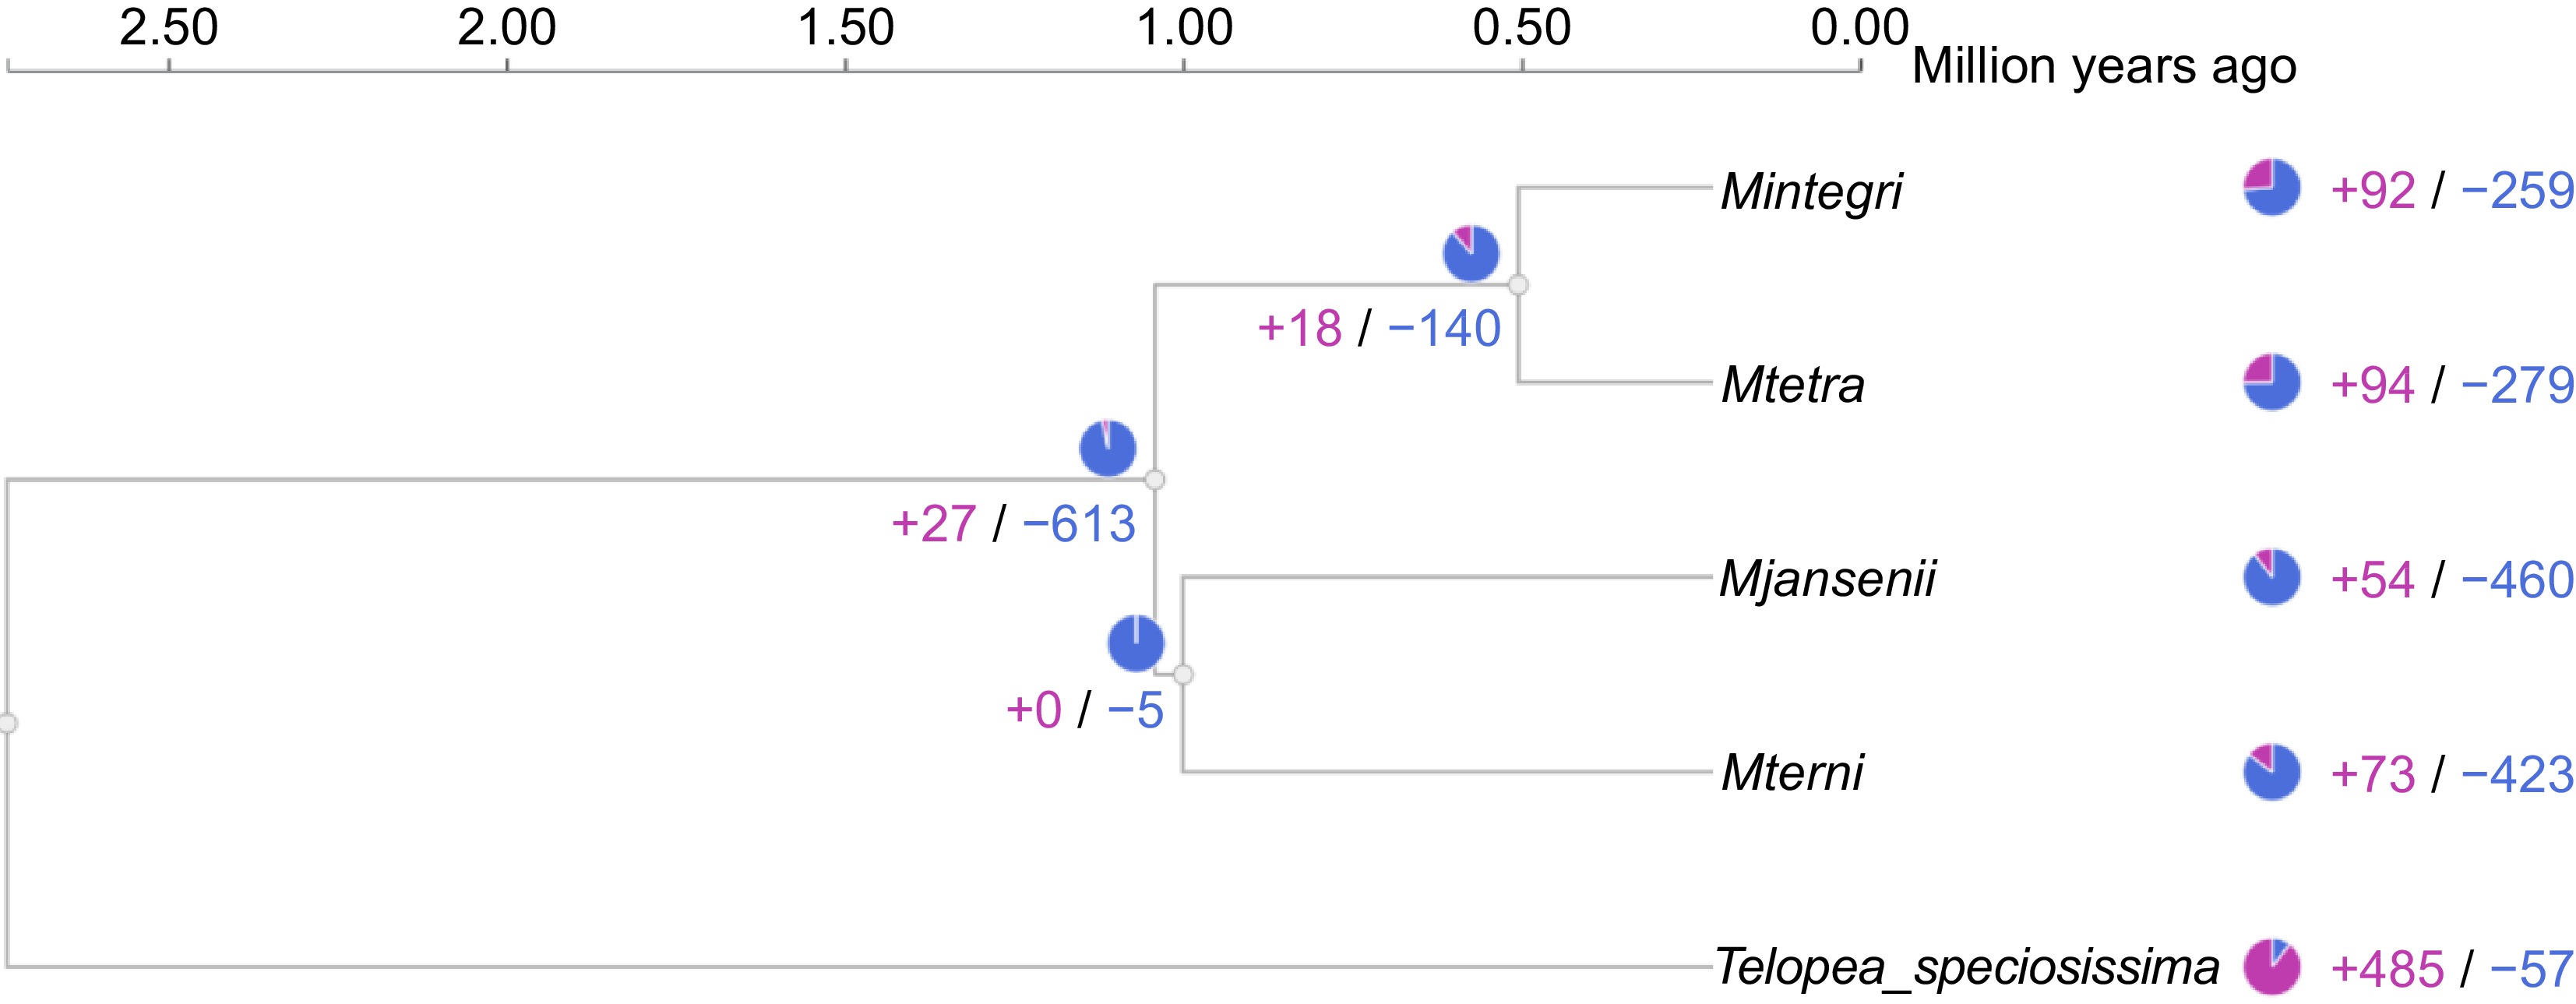
Figure 5.
Gene family expansion and contraction across the Macadamia species and Telopea. The blue colour represents contraction and pink presents expansion of gene clusters.
-
M. jansenii M. ternifolia M. integrifolia M. tetraphylla Hap1 Hap2 Collapsed Hap1 Hap2 Collapsed Hap1 Hap2 Collapsed Hap1 Hap2 Collapsed Assembly length (Mb) 761 735 773 766b 748 780 748 751 775 776 775 795 Complete BUSCO 98.9% 95.0% 97.7% 97.1% 96.5% 97.7% 95.1% 94.3% 97.6% 97.4% 97.3% 97.8% Single 83.3% 82.1% 84.2% 83.8% 83.4% 84.1% 82.4% 81.6% 84.1% 83.5% 83.8% 83.7% Double 13.6% 12.9% 13.5% 13.3% 13.1% 13.6% 12.7% 12.7% 13.5% 13.9% 13.5% 14.1% Fragmented 0.6% 0.6% 0.7% 0.8% 0.8% 0.8% 0.9% 0.6% 0.6% 0.8% 0.7% 0.7% Missing 2.5% 4.4% 1.6% 2.1% 2.7% 1.5% 4.0% 5.1% 1.8% 1.8% 2.0% 1.5% N50 (Mb) 54.2 51.7 54.7 53.8 51.8 53.8 52.8 53 53.7 54 56 56 *The chromosomes were numbered according to the M. integrifolia genome which used the seven genetic linkage maps[4]. Table 1.
Chromosome level assemblies of four species of Macadamia representing assembly length, BUSCO and N50 values.
-
M. jansenii M. ternifolia M. integrifolia M. tetraphylla Hap 1 Hap2 Collapsed Hap 1 Hap2 Collapsed Hap 1 Hap2 Collapsed Hap 1 Hap2 Collapsed Chr_01 2483 2543 2474 2455 2484 2612 2483 2389 2665 2643 2521 2631 Chr_02 2666 2514 2608 2774 2666 2739 2453 2613 2699 2664 2735 2786 Chr_03 2802 2868 2844 3007 2943 3053 2837 2771 2974 2949 2917 3017 Chr_04 2780 2670 2718 2832 2706 2931 2833 2746 3078 3142 2782 2813 Chr_05 2800 2783 2798 2798 2636 2911 2755 2569 2814 2746 2780 2866 Chr_06 2607 2579 2568 2623 2465 2683 2585 2616 2667 2702 2731 2709 Chr_07 2790 2702 2696 2764 2699 2836 2810 2587 2623 2711 2578 2712 Chr_08 2768 2768 2677 2742 2671 2770 2509 2802 2878 3062 2869 2837 Chr_09 2870 2897 2878 2915 2874 3053 3373 2816 3842 3626 2978 3137 Chr_10 2402 2359 2428 2301 2209 2463 2699 2367 3103 3710 2295 2392 Chr_11 2820 2896 2812 2910 2845 3001 2917 2879 3087 2888 3024 2935 Chr_12 2590 2567 2517 2642 2408 2721 2576 2092 2538 2617 2430 2566 Chr_13 2766 2627 2732 2641 2716 2790 2684 2723 2875 2694 2663 2724 Chr_14 2560 2409 2448 2598 2474 2626 2446 2495 2691 2634 2534 2608 Total no. of genes 37704 37182 37198 38002 36796 39189 37960 36465 40534 40788 37837 38733 Number of mRNA 43510 43098 43092 44506 43016 45694 44527 43010 47301 47184 44490 45519 Number of CDS 43510 43098 43092 44506 43016 45694 44527 43010 47301 47184 44490 45519 Table 2.
Distribution of genes across the 14 chromosomes of Macadamia species.
Figures
(5)
Tables
(2)