-
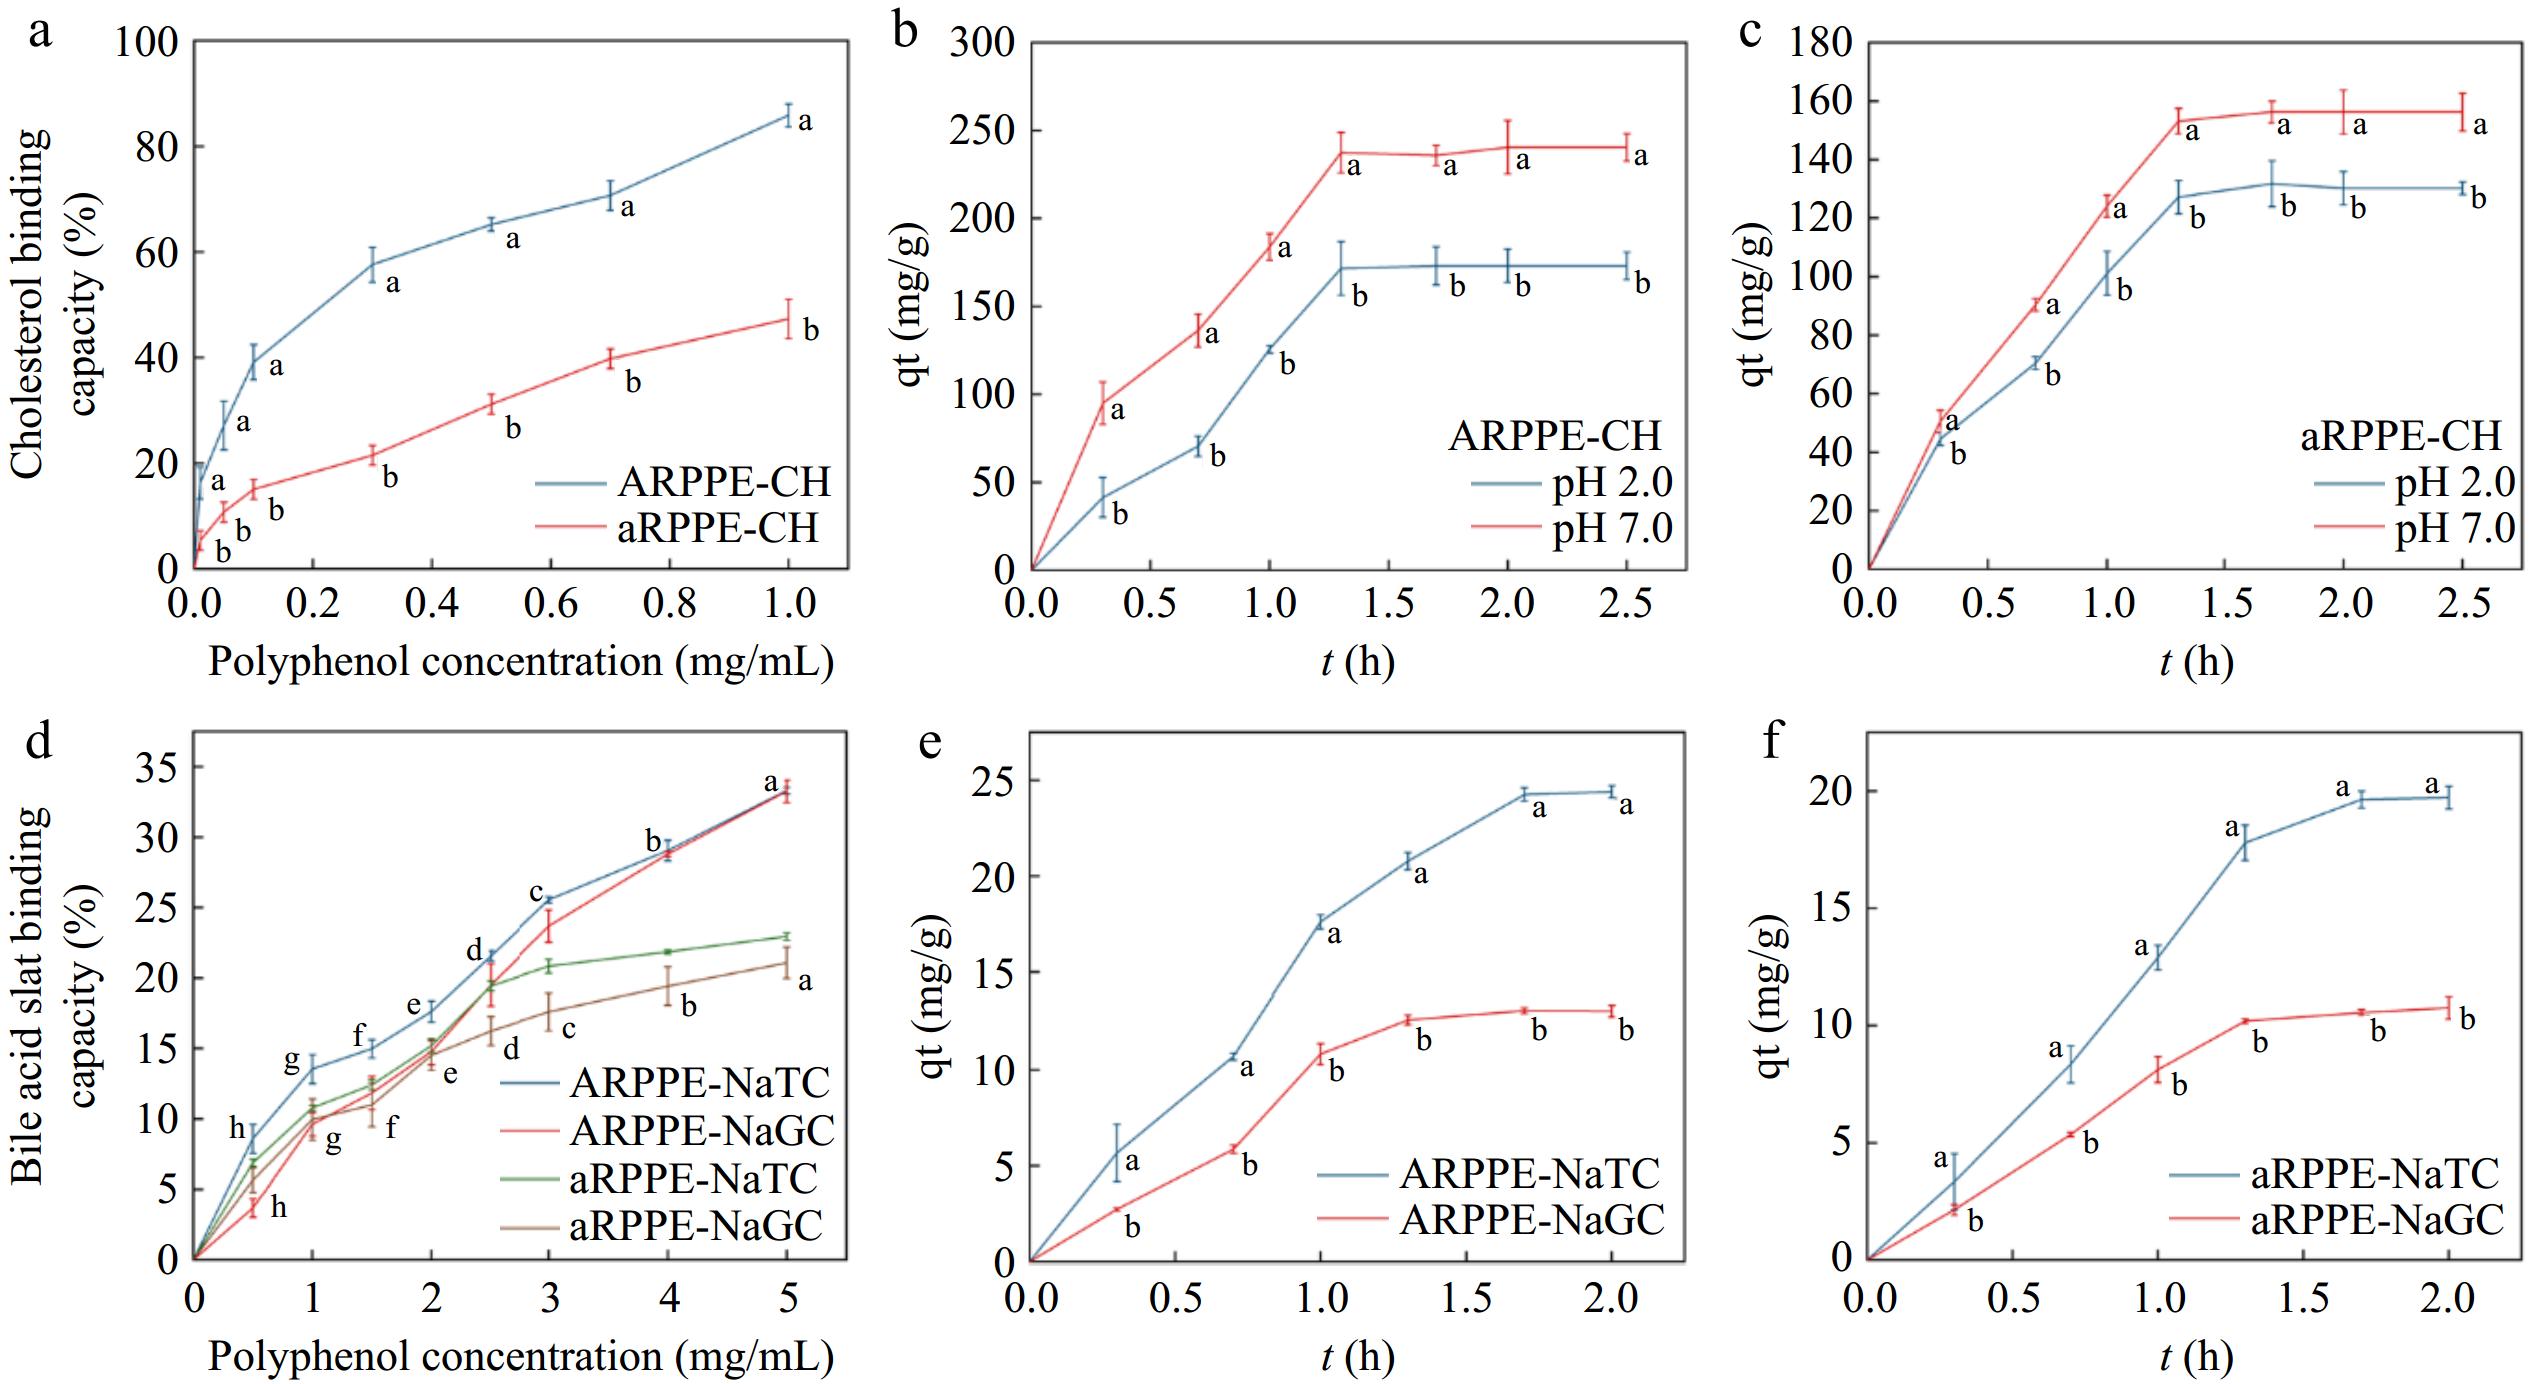
Figure 1.
Effect of ARPPE and aRPPE concentrations on their (a) cholesterol and (d) cholates binding; (b) and (c) are the equilibrium cholesterol binding of ARPPE and aRPPE at pH conditions simulating gastrointestinal digestion; (e) and (f) are the equilibrium binding of cholates.
-
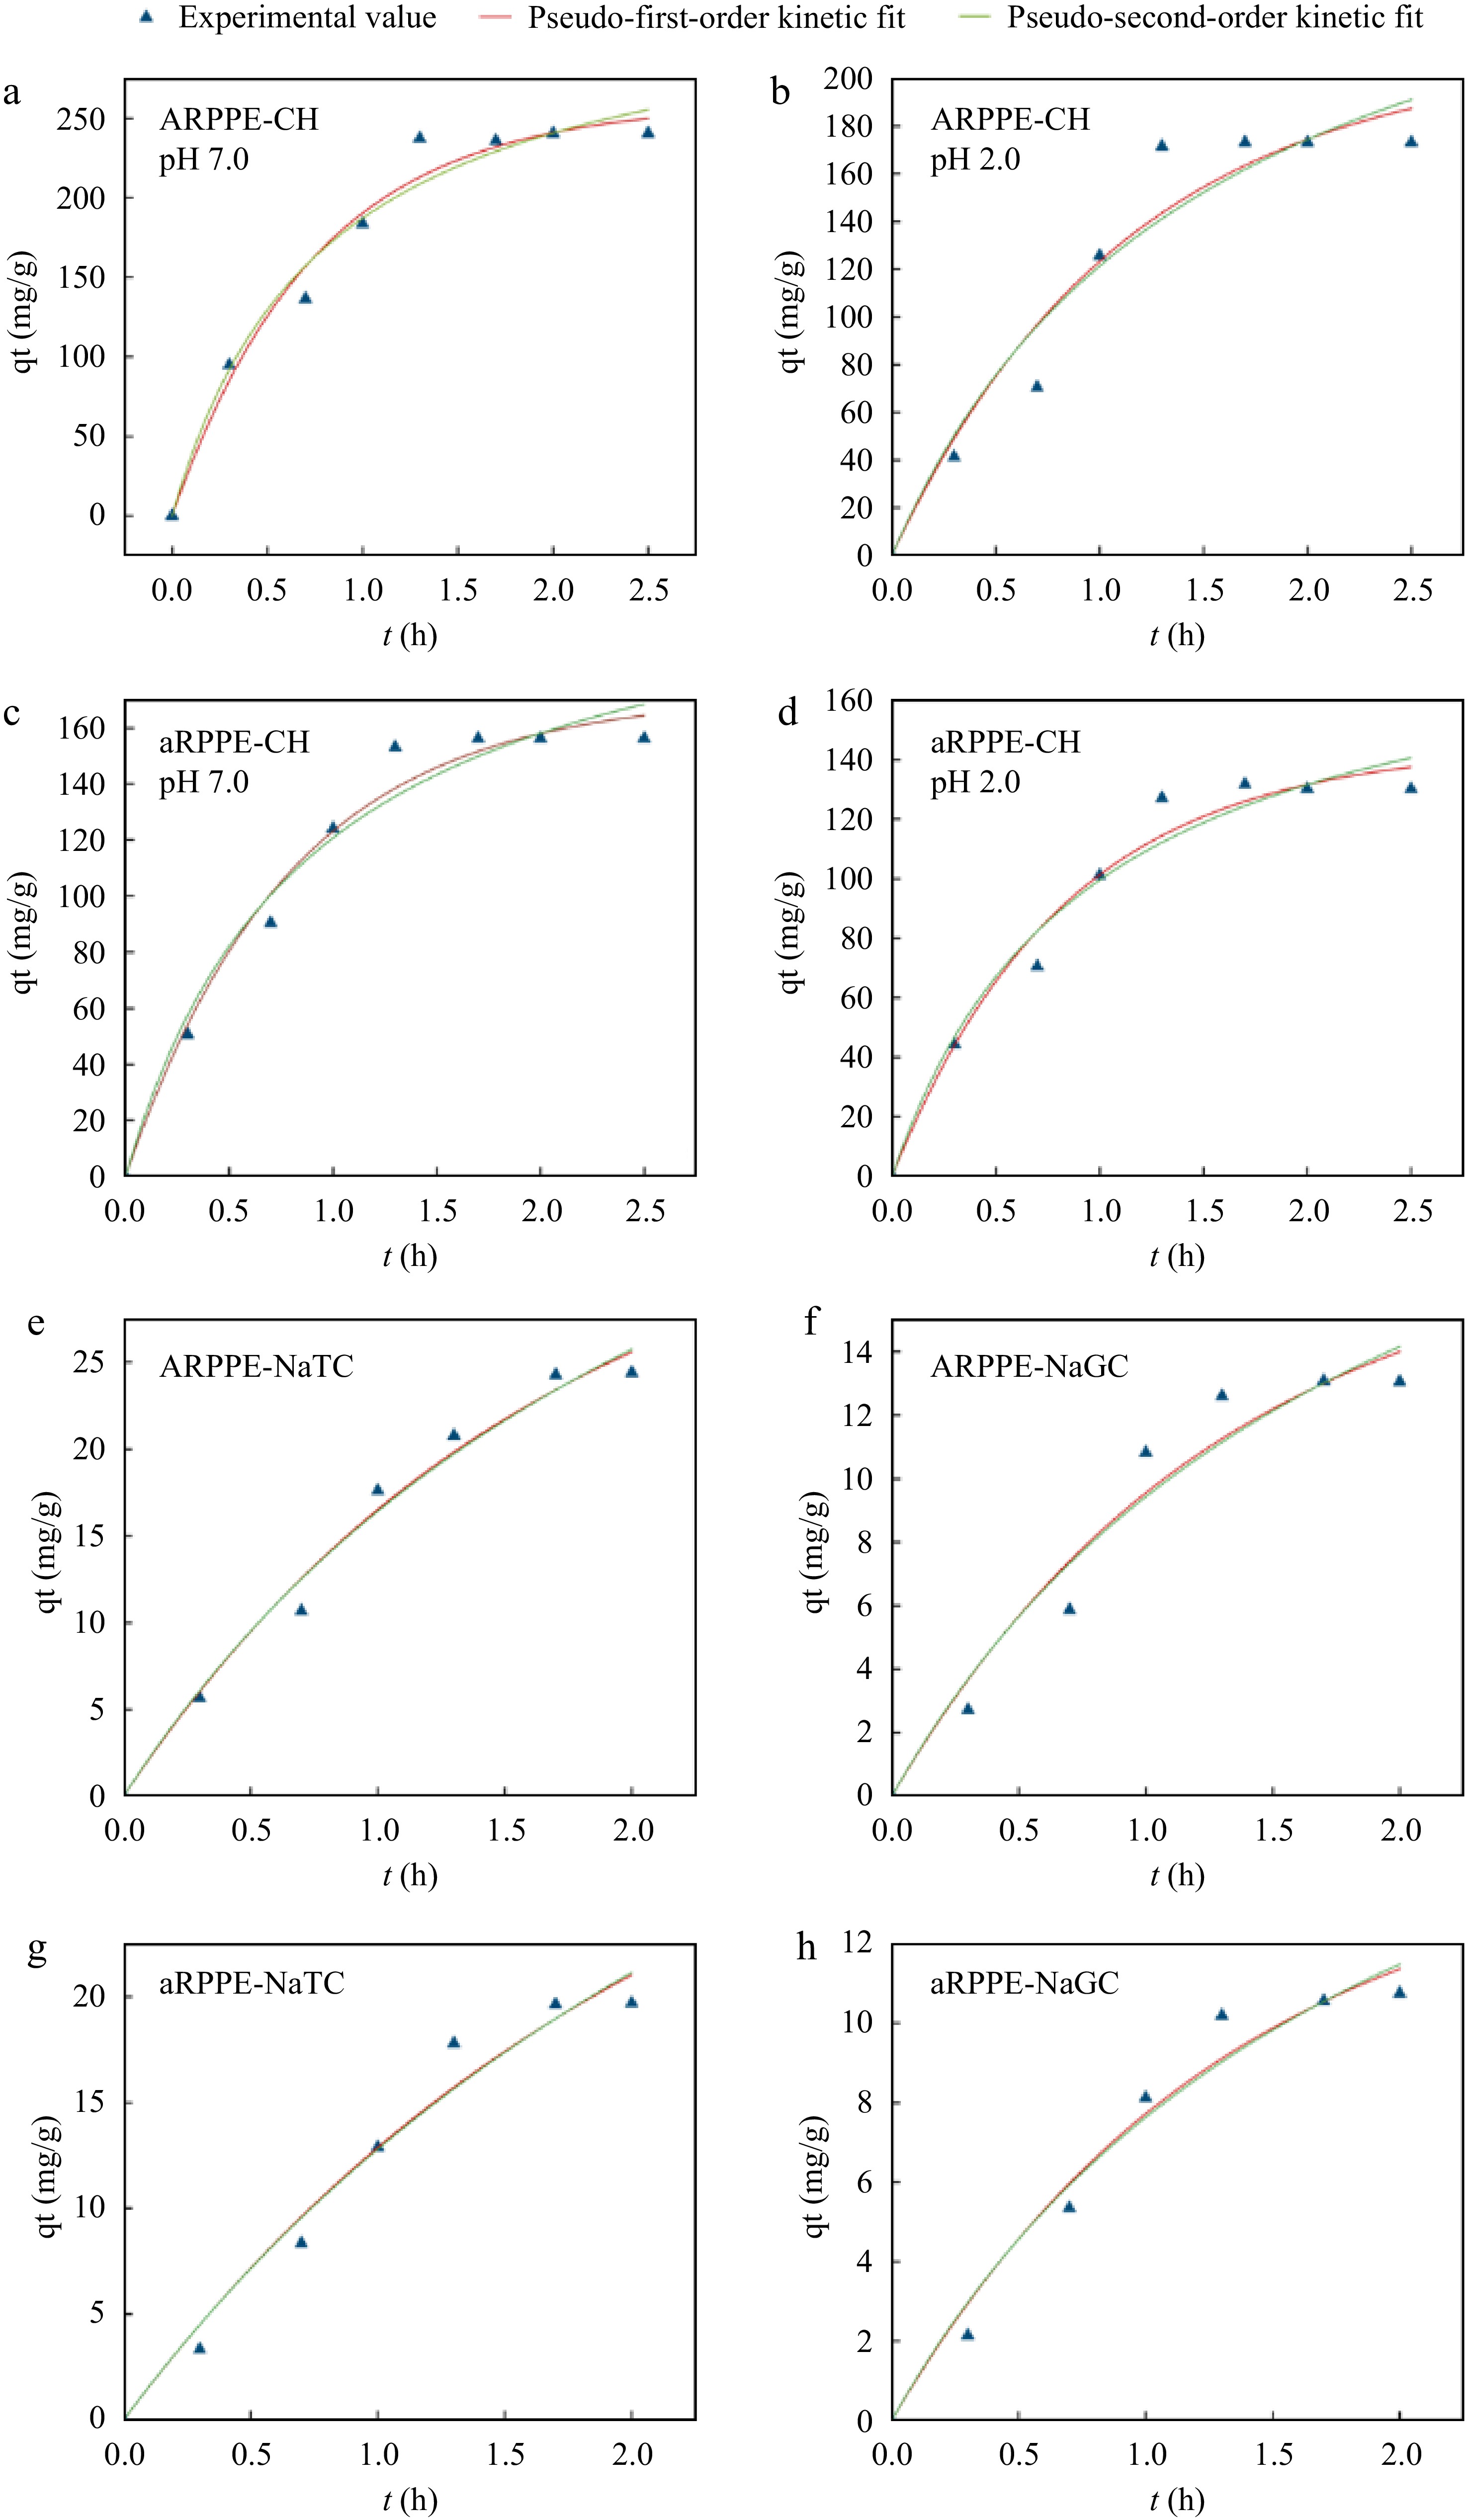
Figure 2.
Binding kinetic models of ARPPE and aRPPE for cholesterol and cholates-Lagergren pseudo-first-order and pseudo-second-order fits. (a), (b) Kinetic fits of ARPPE for cholesterol binding ability at pH 7.0 and pH 2.0, respectively; (c), (d) kinetic fits of aRPPE for cholesterol binding ability at pH 7.0 and pH 2.0, respectively; (e), (f) kinetic fits of ARPPE for the binding ability of sodium taurocholate and sodium glycyl cholate, respectively; (g), (h) kinetic fits of aRPPE for the binding ability of sodium taurocholate and sodium glycyl cholate, respectively.
-
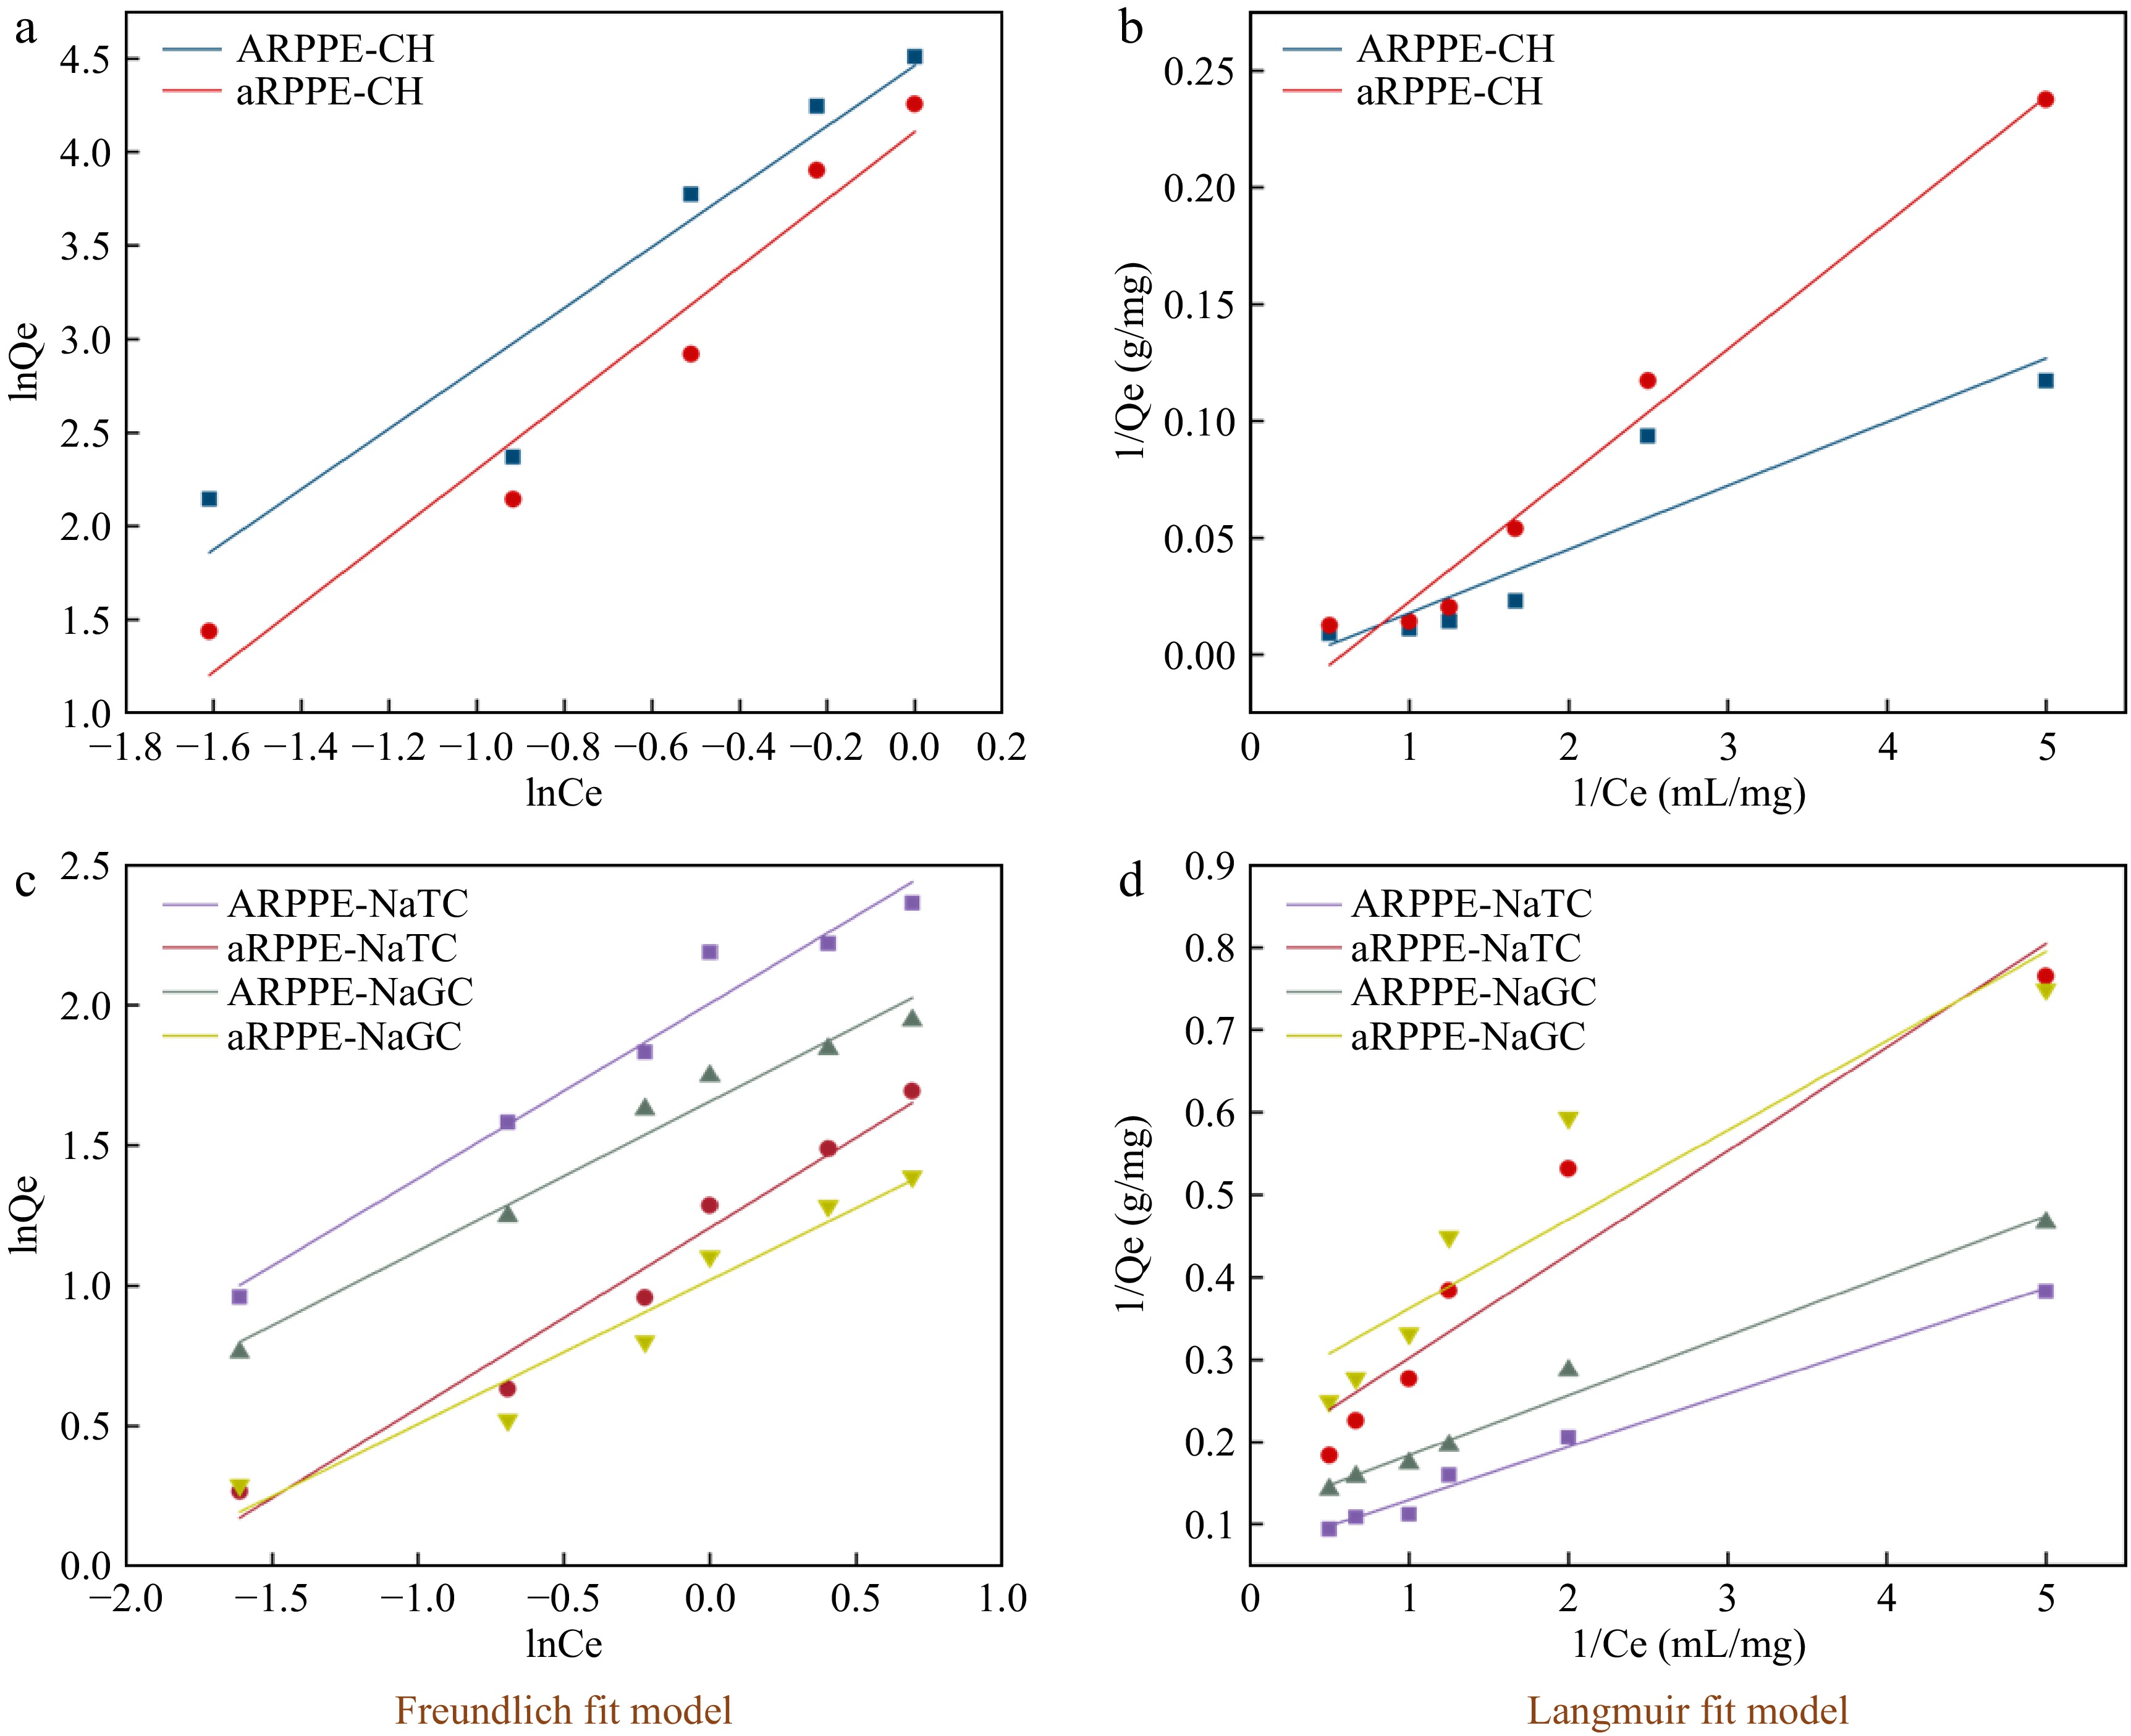
Figure 3.
Isothermal adsorption modelling of cholesterol and cholates by ARPPE and aRPPE-Freundlich, Langmuir fitting. Where (a) and (b) are cholesterol; (c) and (d) are cholates.
-
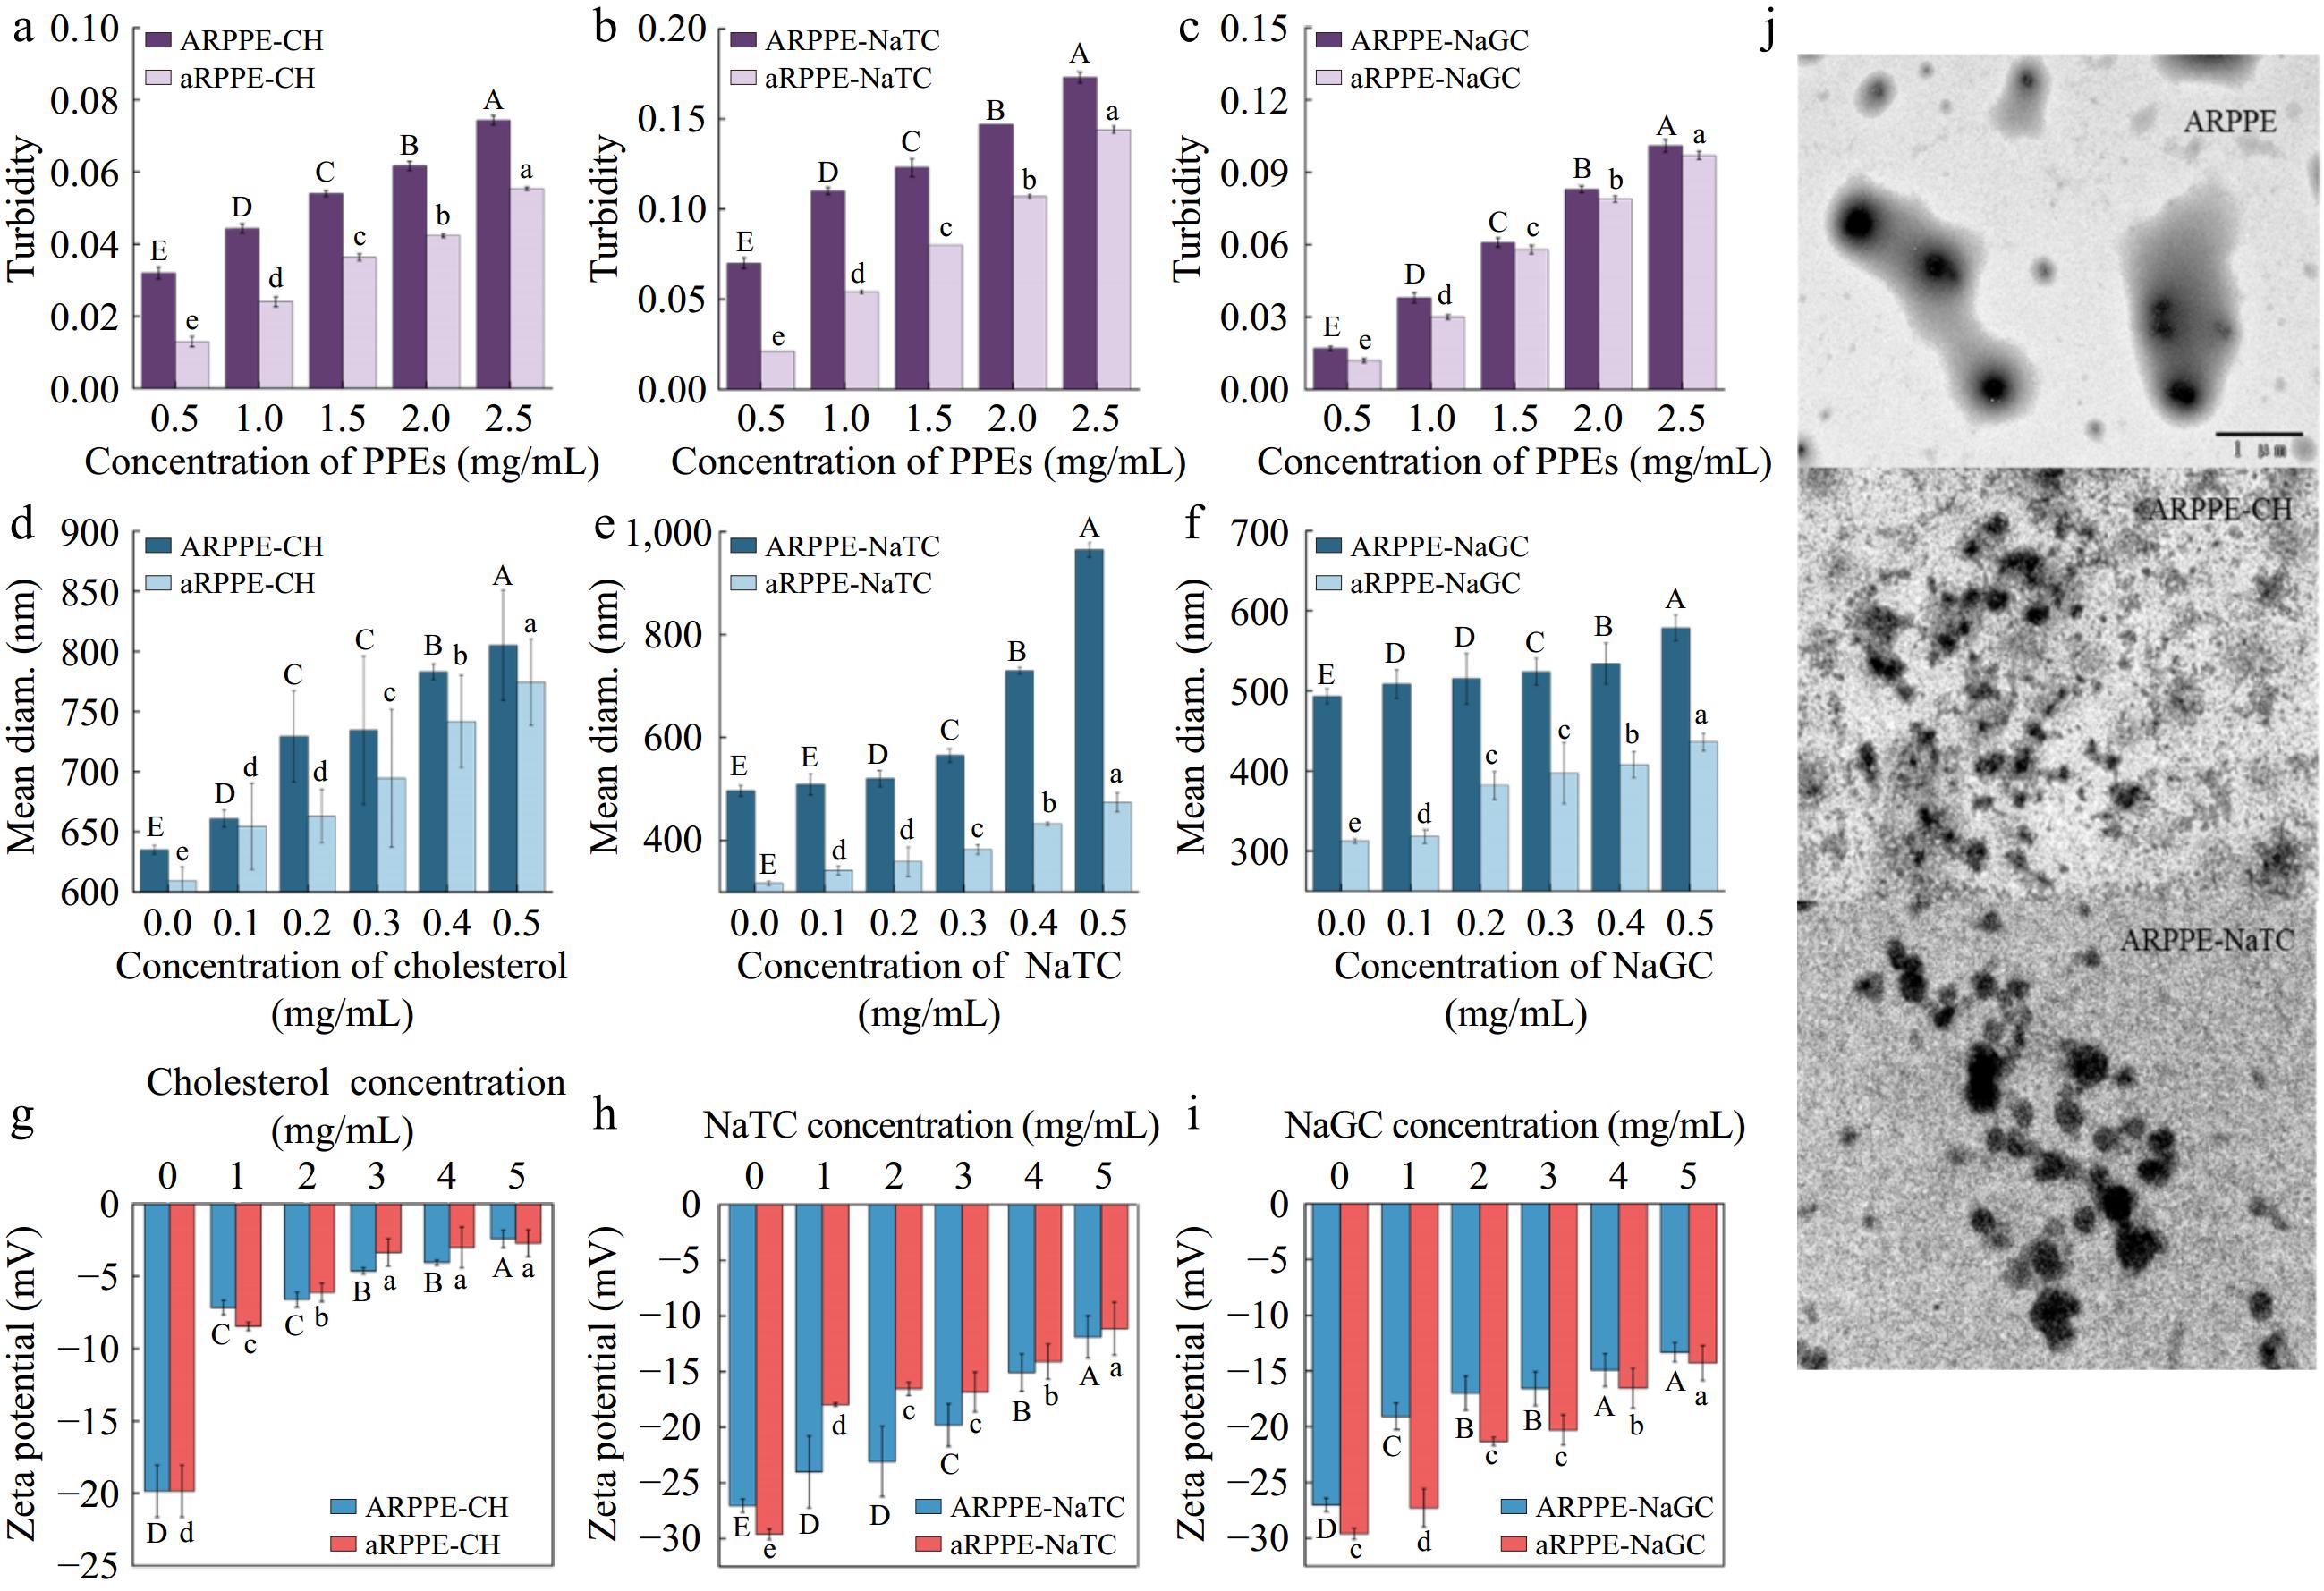
Figure 4.
Analysis of the mechanism of action of PPEs binding to cholesterol and cholates. (a)−(c) are turbidity, (d)−(f) are DLS analysis, (g)−(i) are zeta-potentials, and (j) is TEM.
-
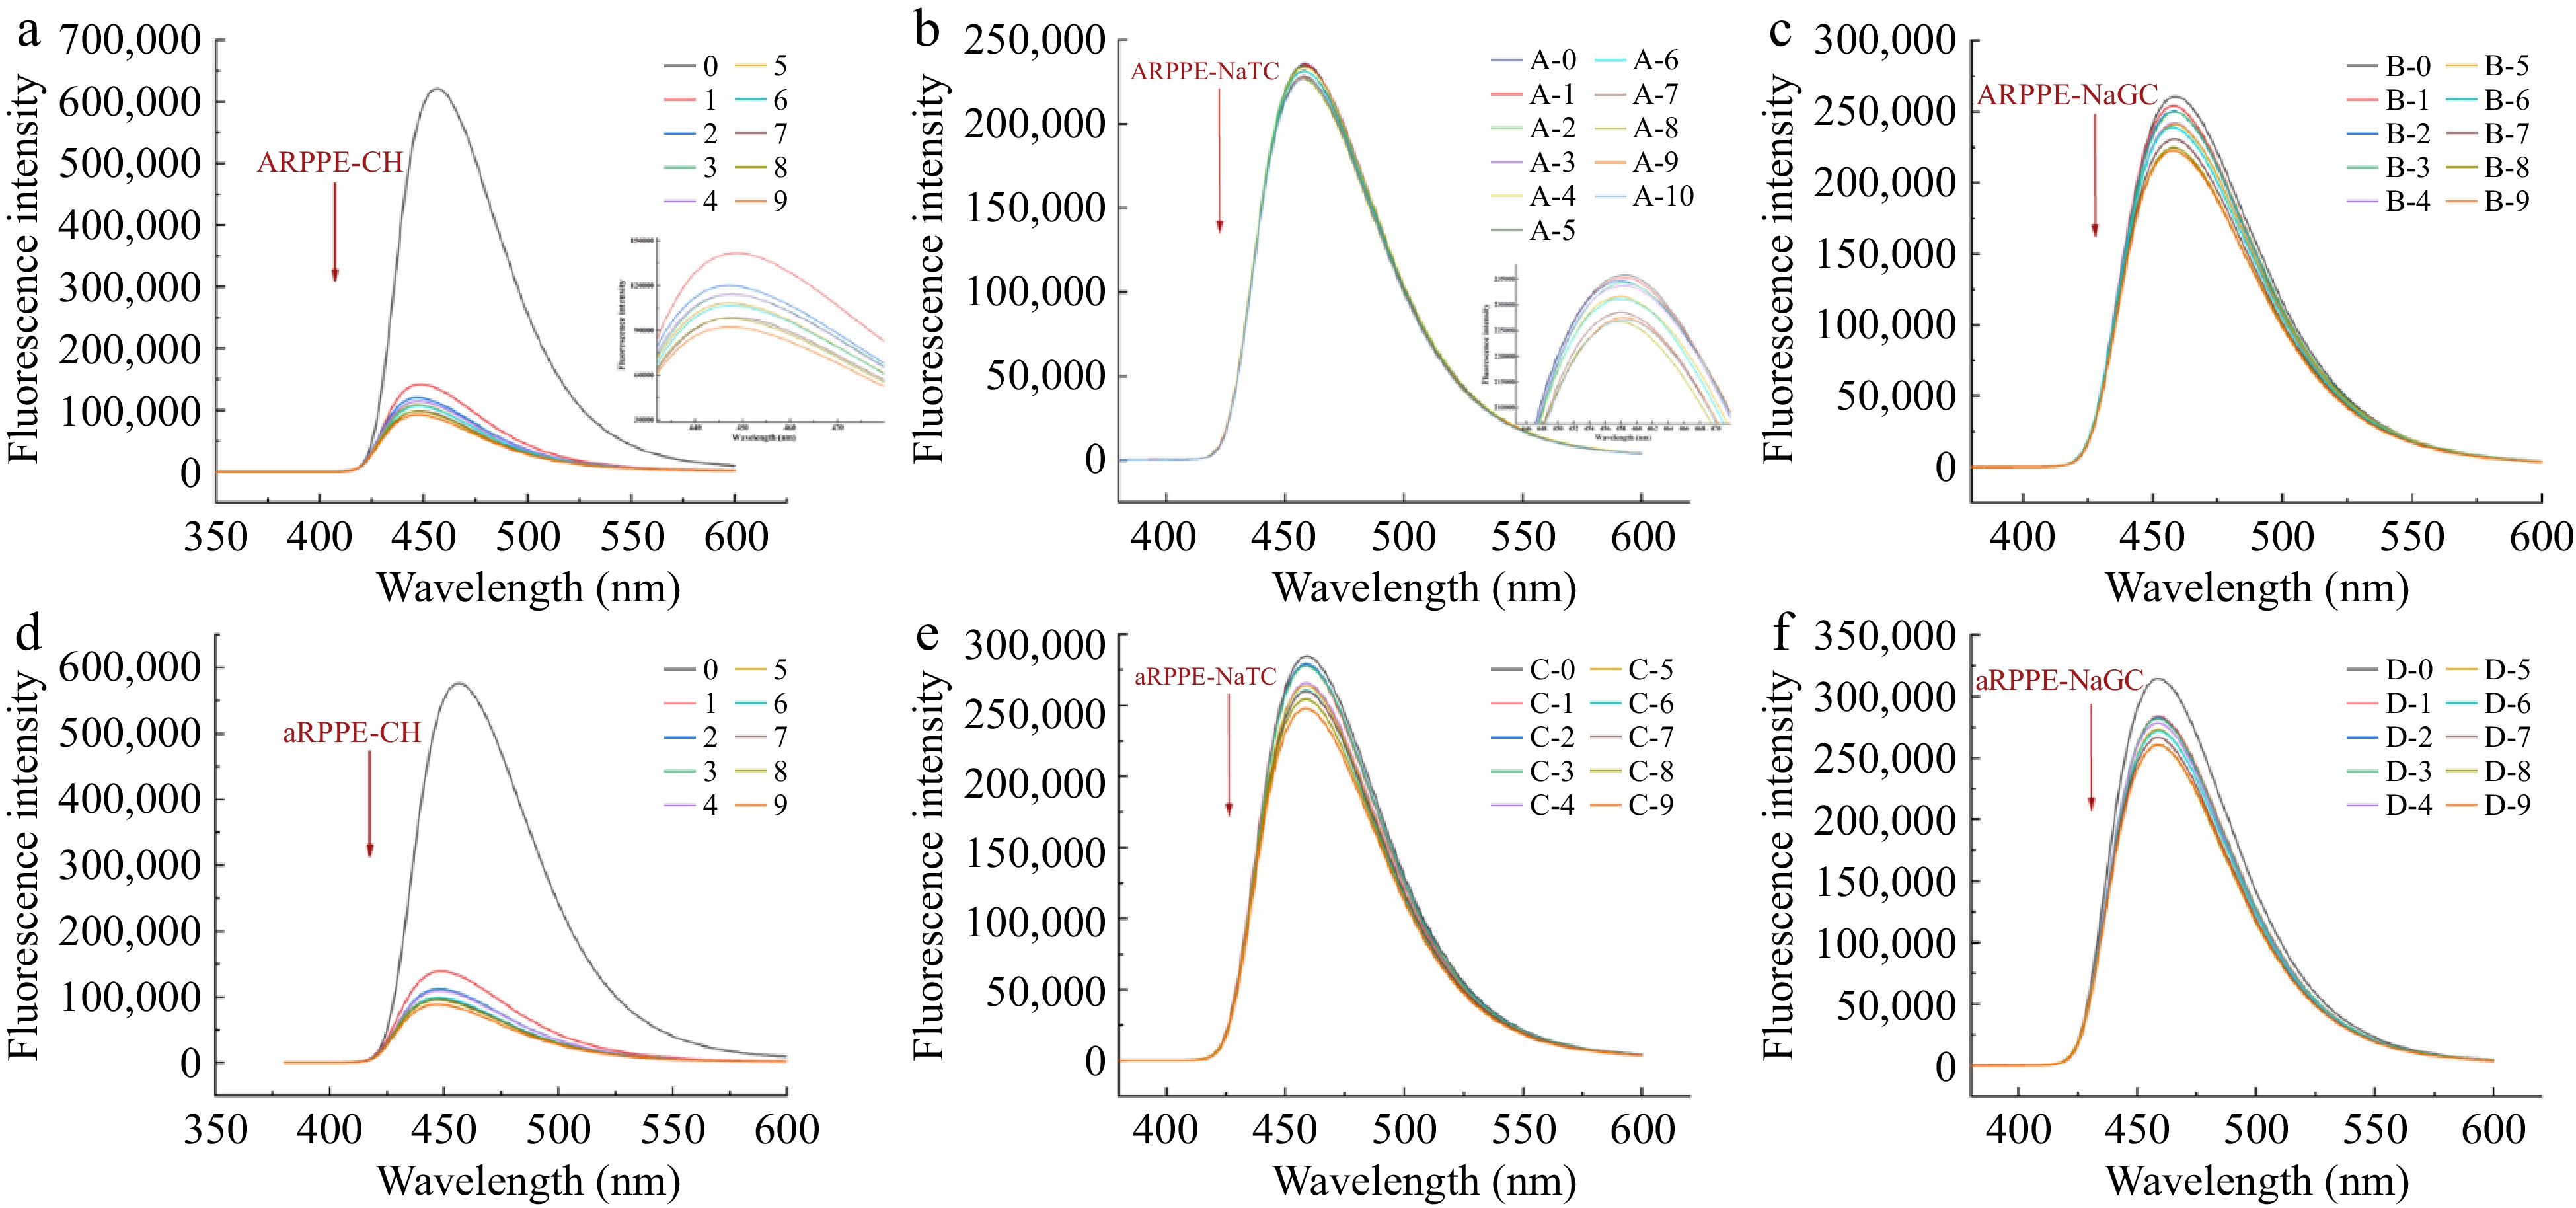
Figure 5.
Exogenous fluorescence spectra of different concentrations of PPEs bound to cholesterol (CH), sodium taurocholate (NaTC), and sodium glycinate cholate (NaGC) at 310 K.
Figures
(5)
Tables
(0)