-
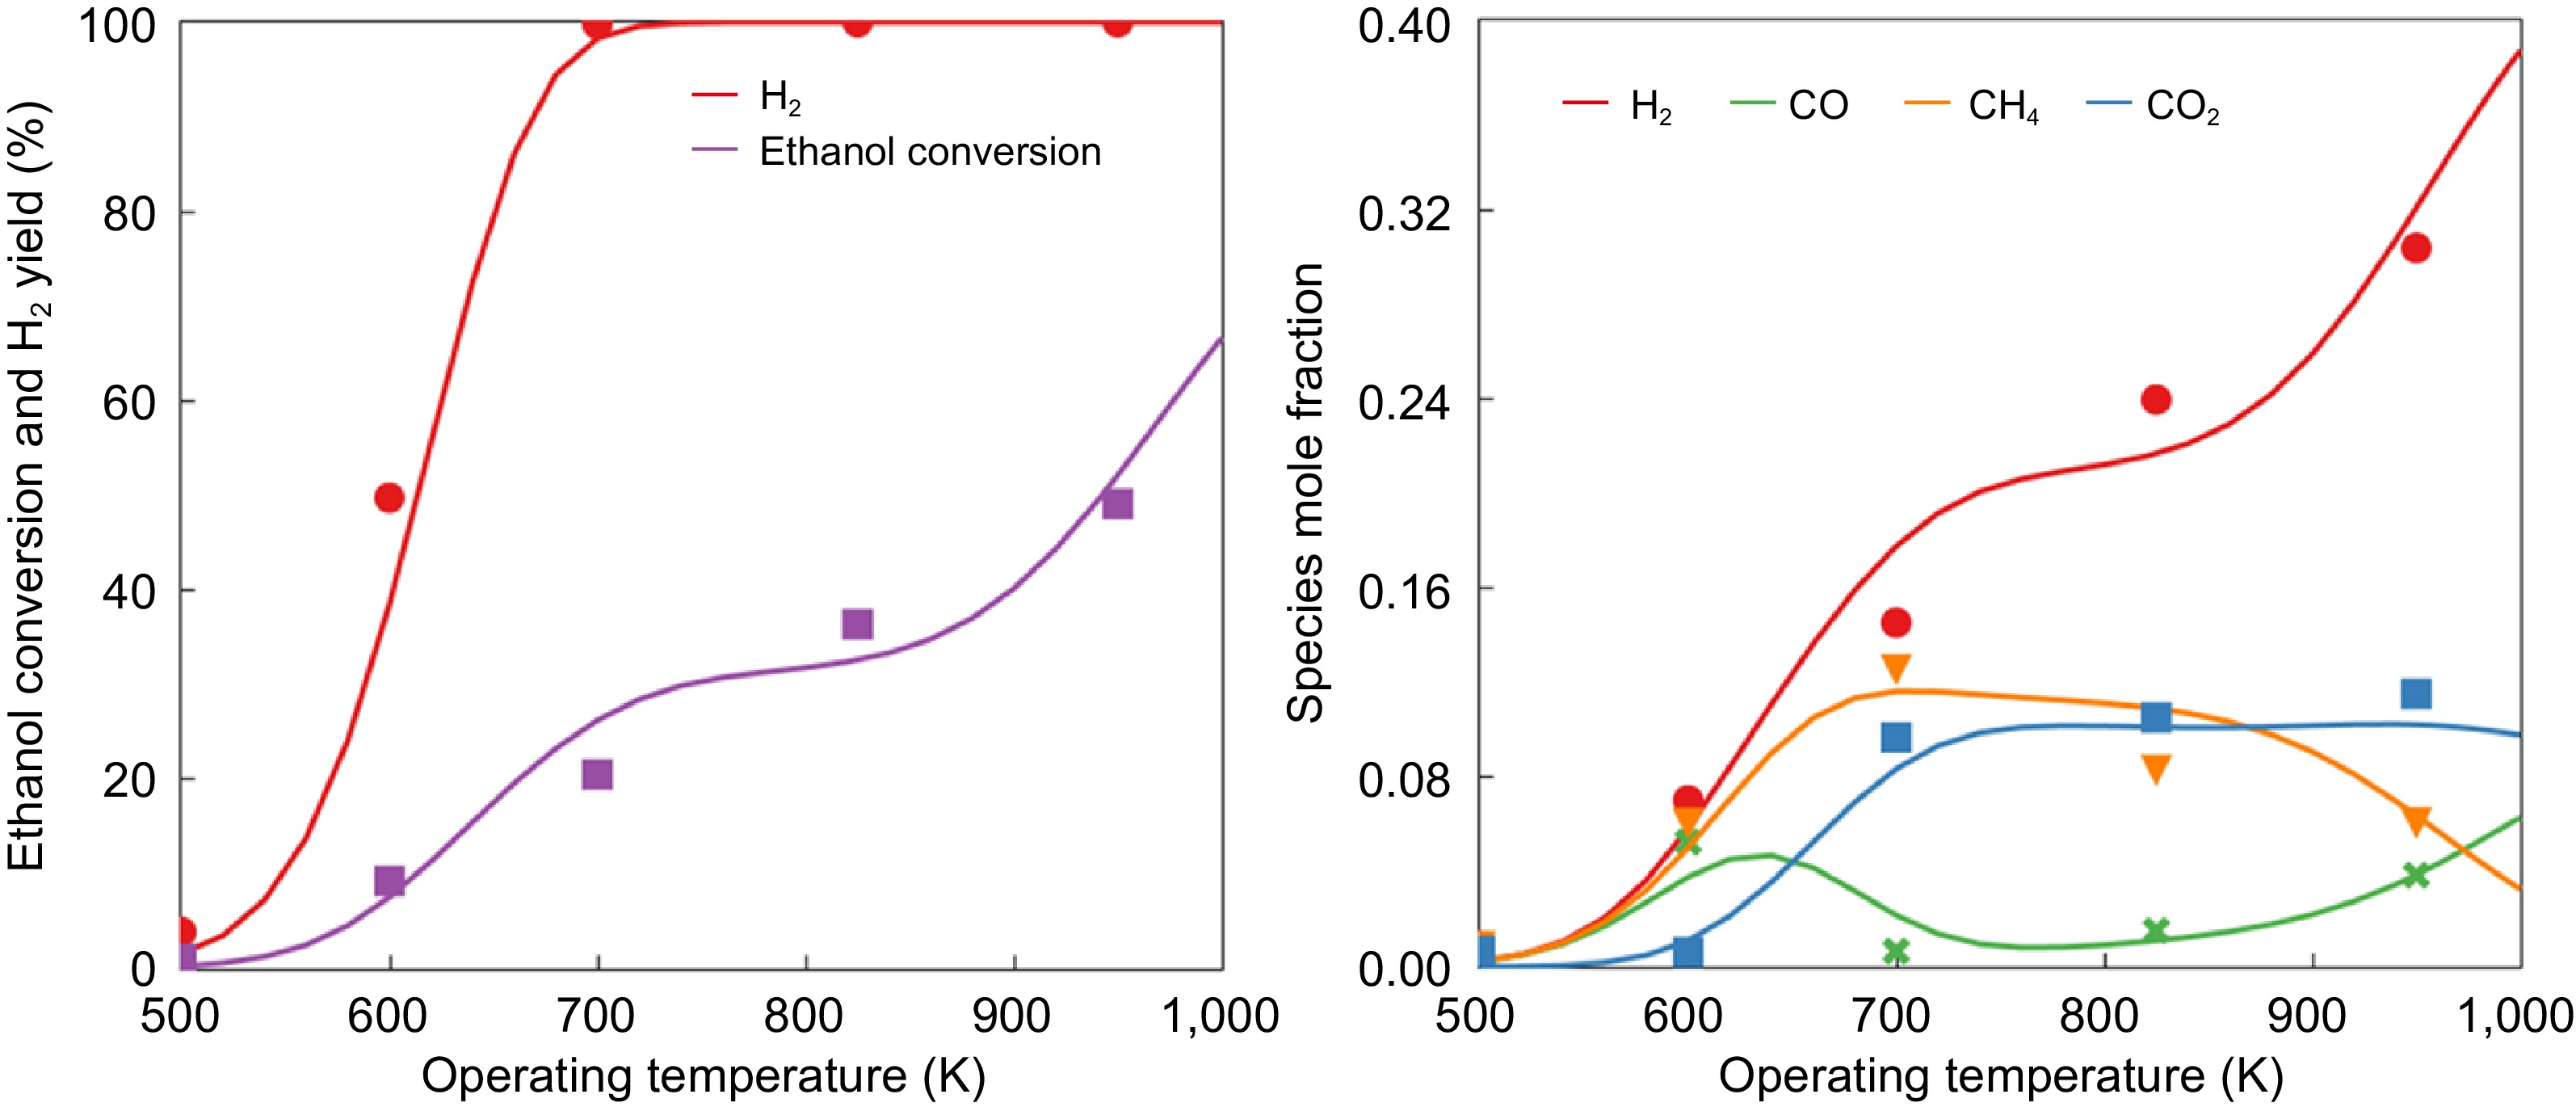
Figure 1.
Model validation on the effects of various operating temperatures on (a) ethanol conversion and H 2 yield, and (b) species mole fraction (lines represent the model results and the dots represent experimental measurements from López et al. [ 19] ).
-

Figure 2.
GT-SUITE model for direct reforming ethanol SOFC.
-
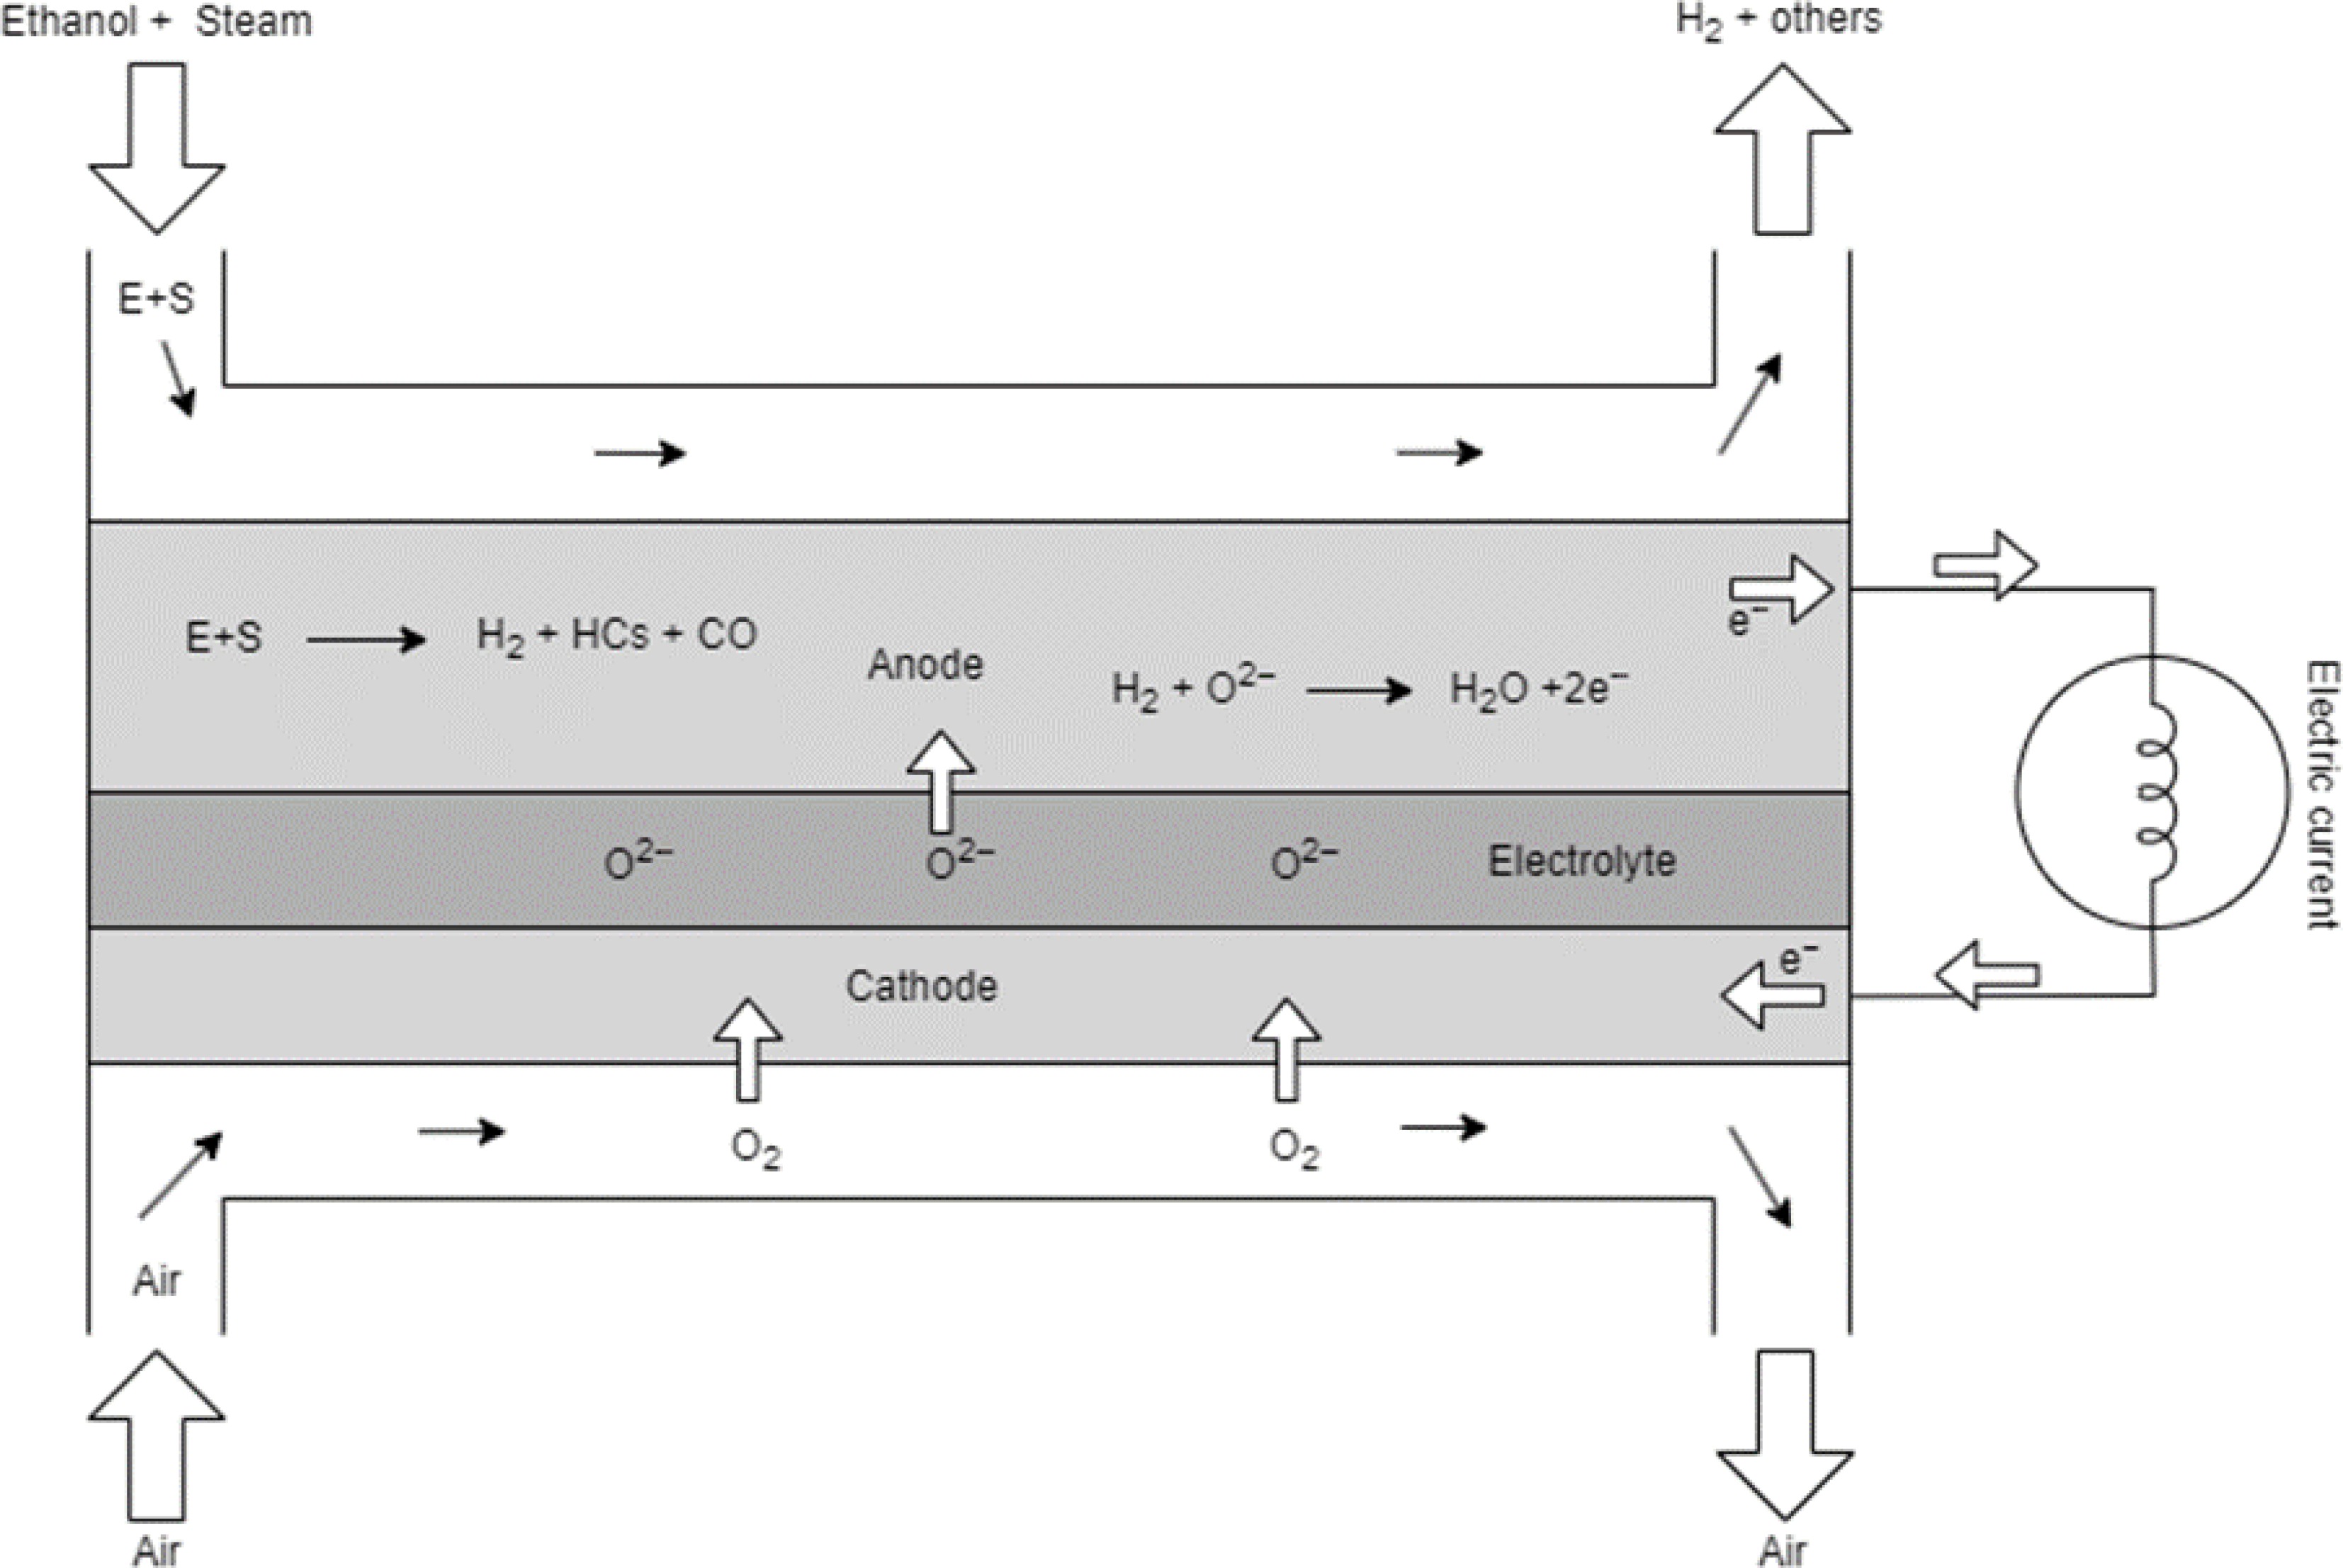
Figure 3.
Schematic diagram of direct reforming ethanol SOFC.
-
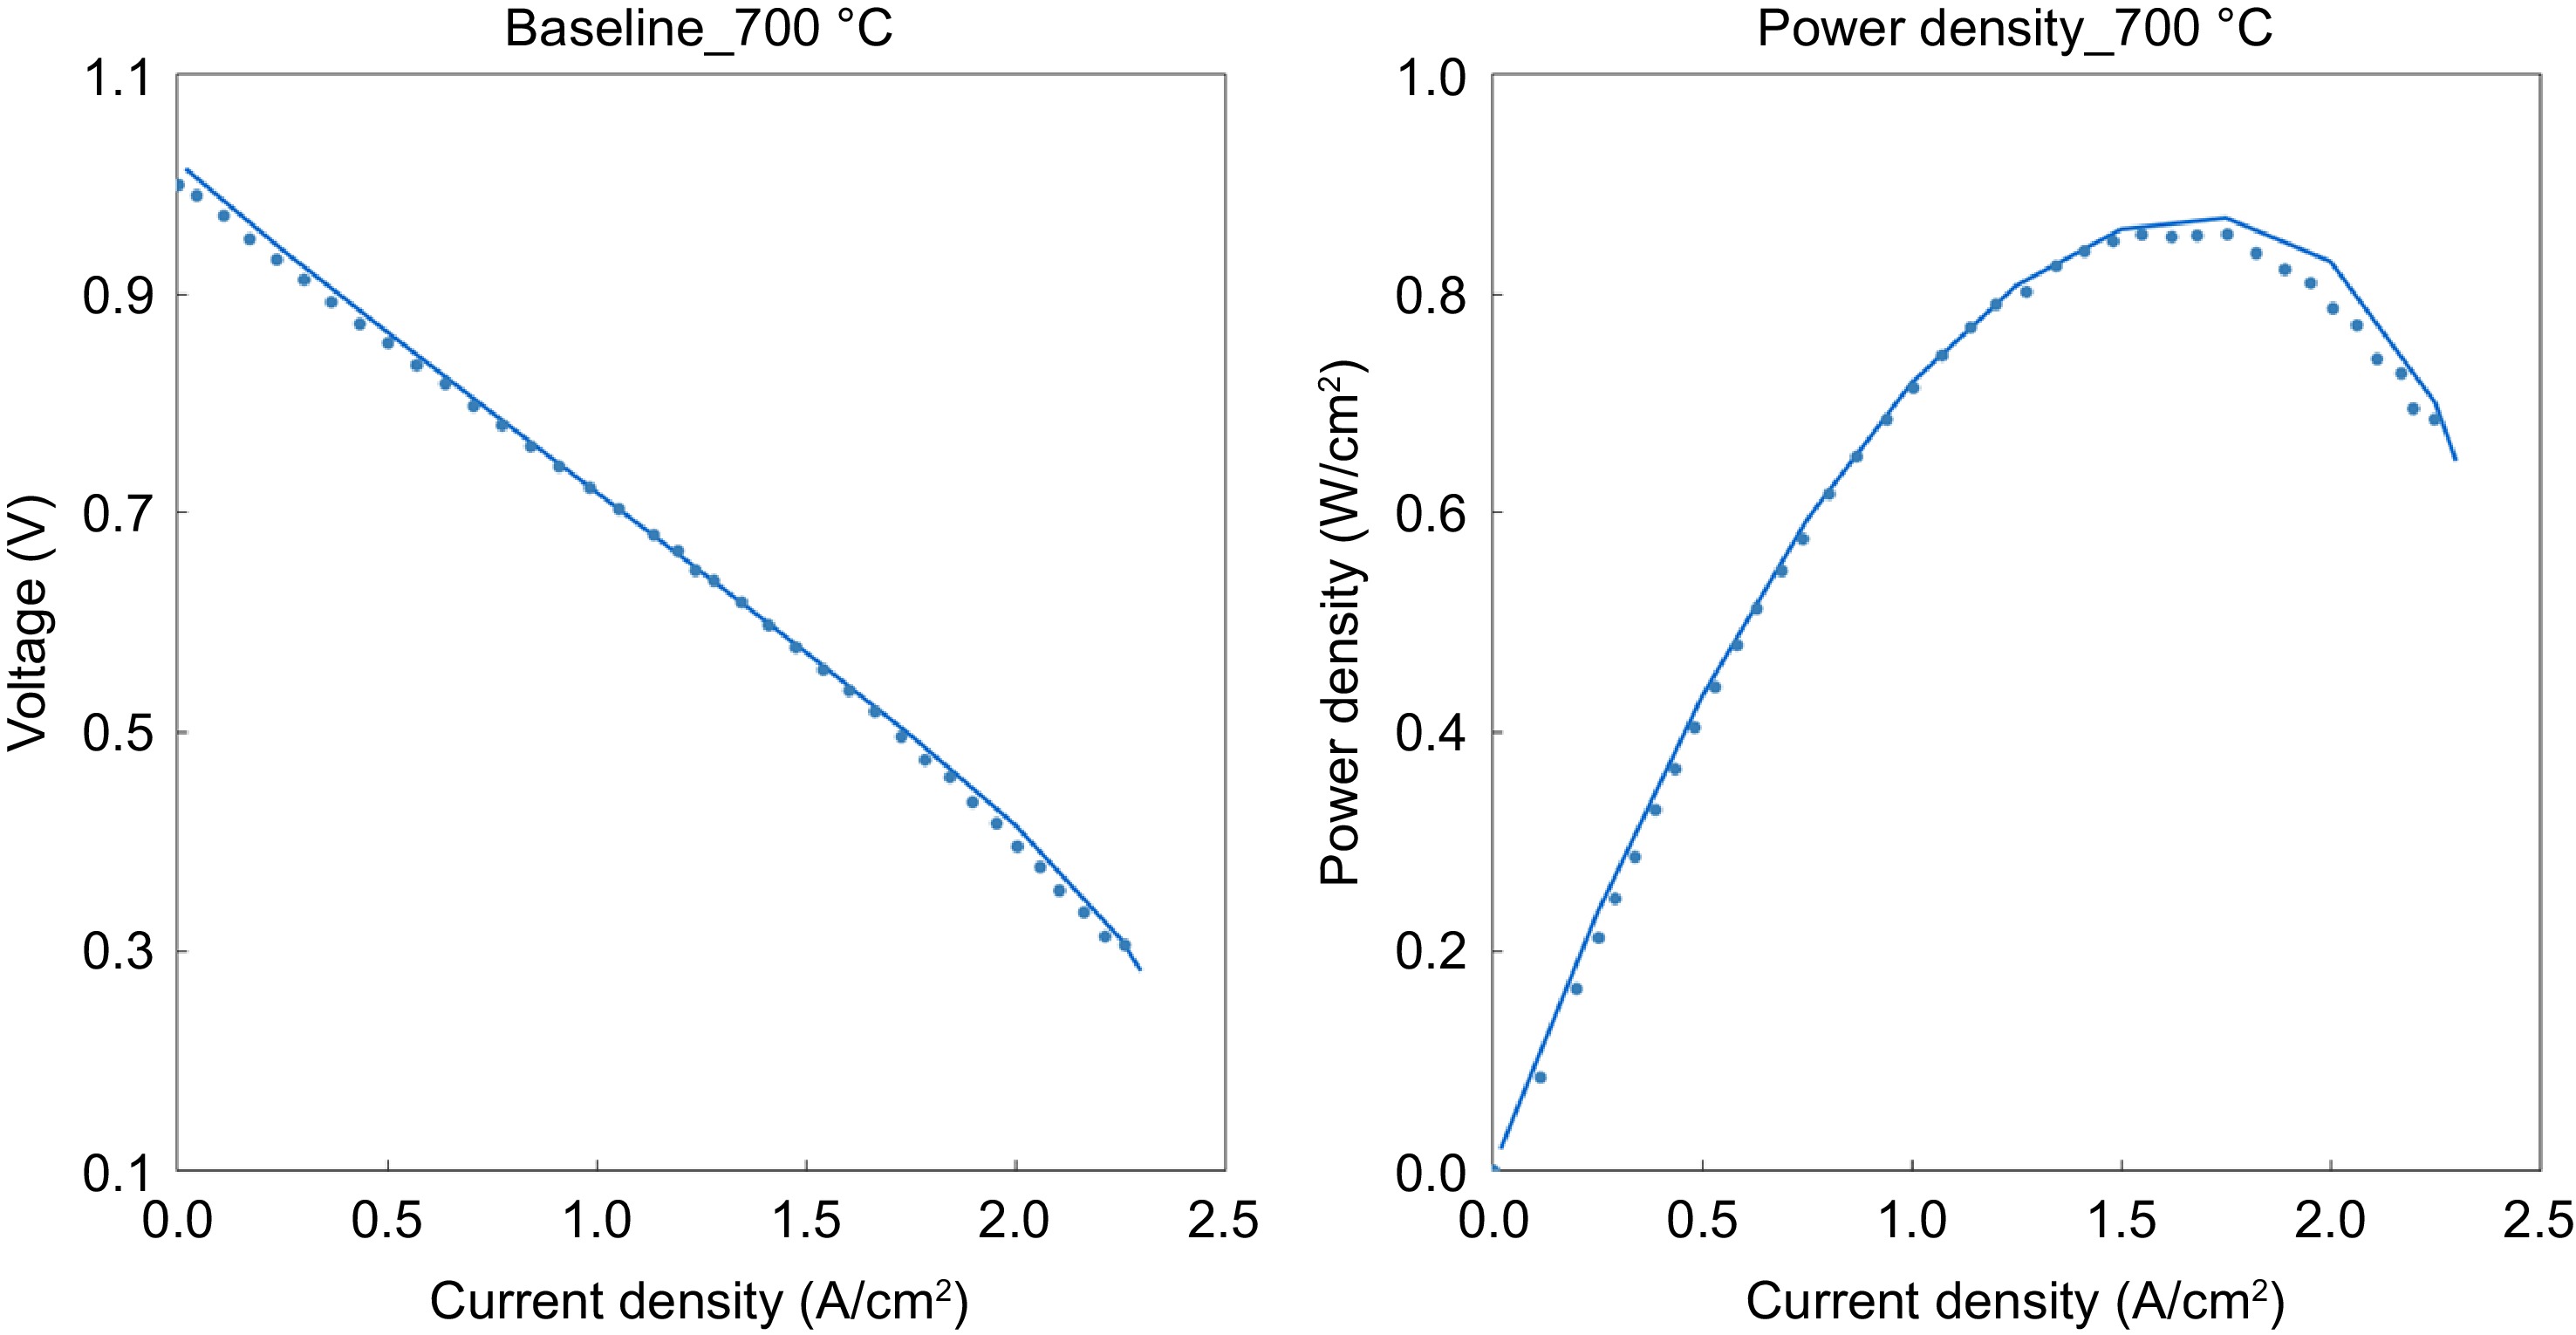
Figure 4.
The polarization curves of the fuel cell (lines represent the model results and the dots represent data from Dogdibegovic et al.) [ 26] .
-
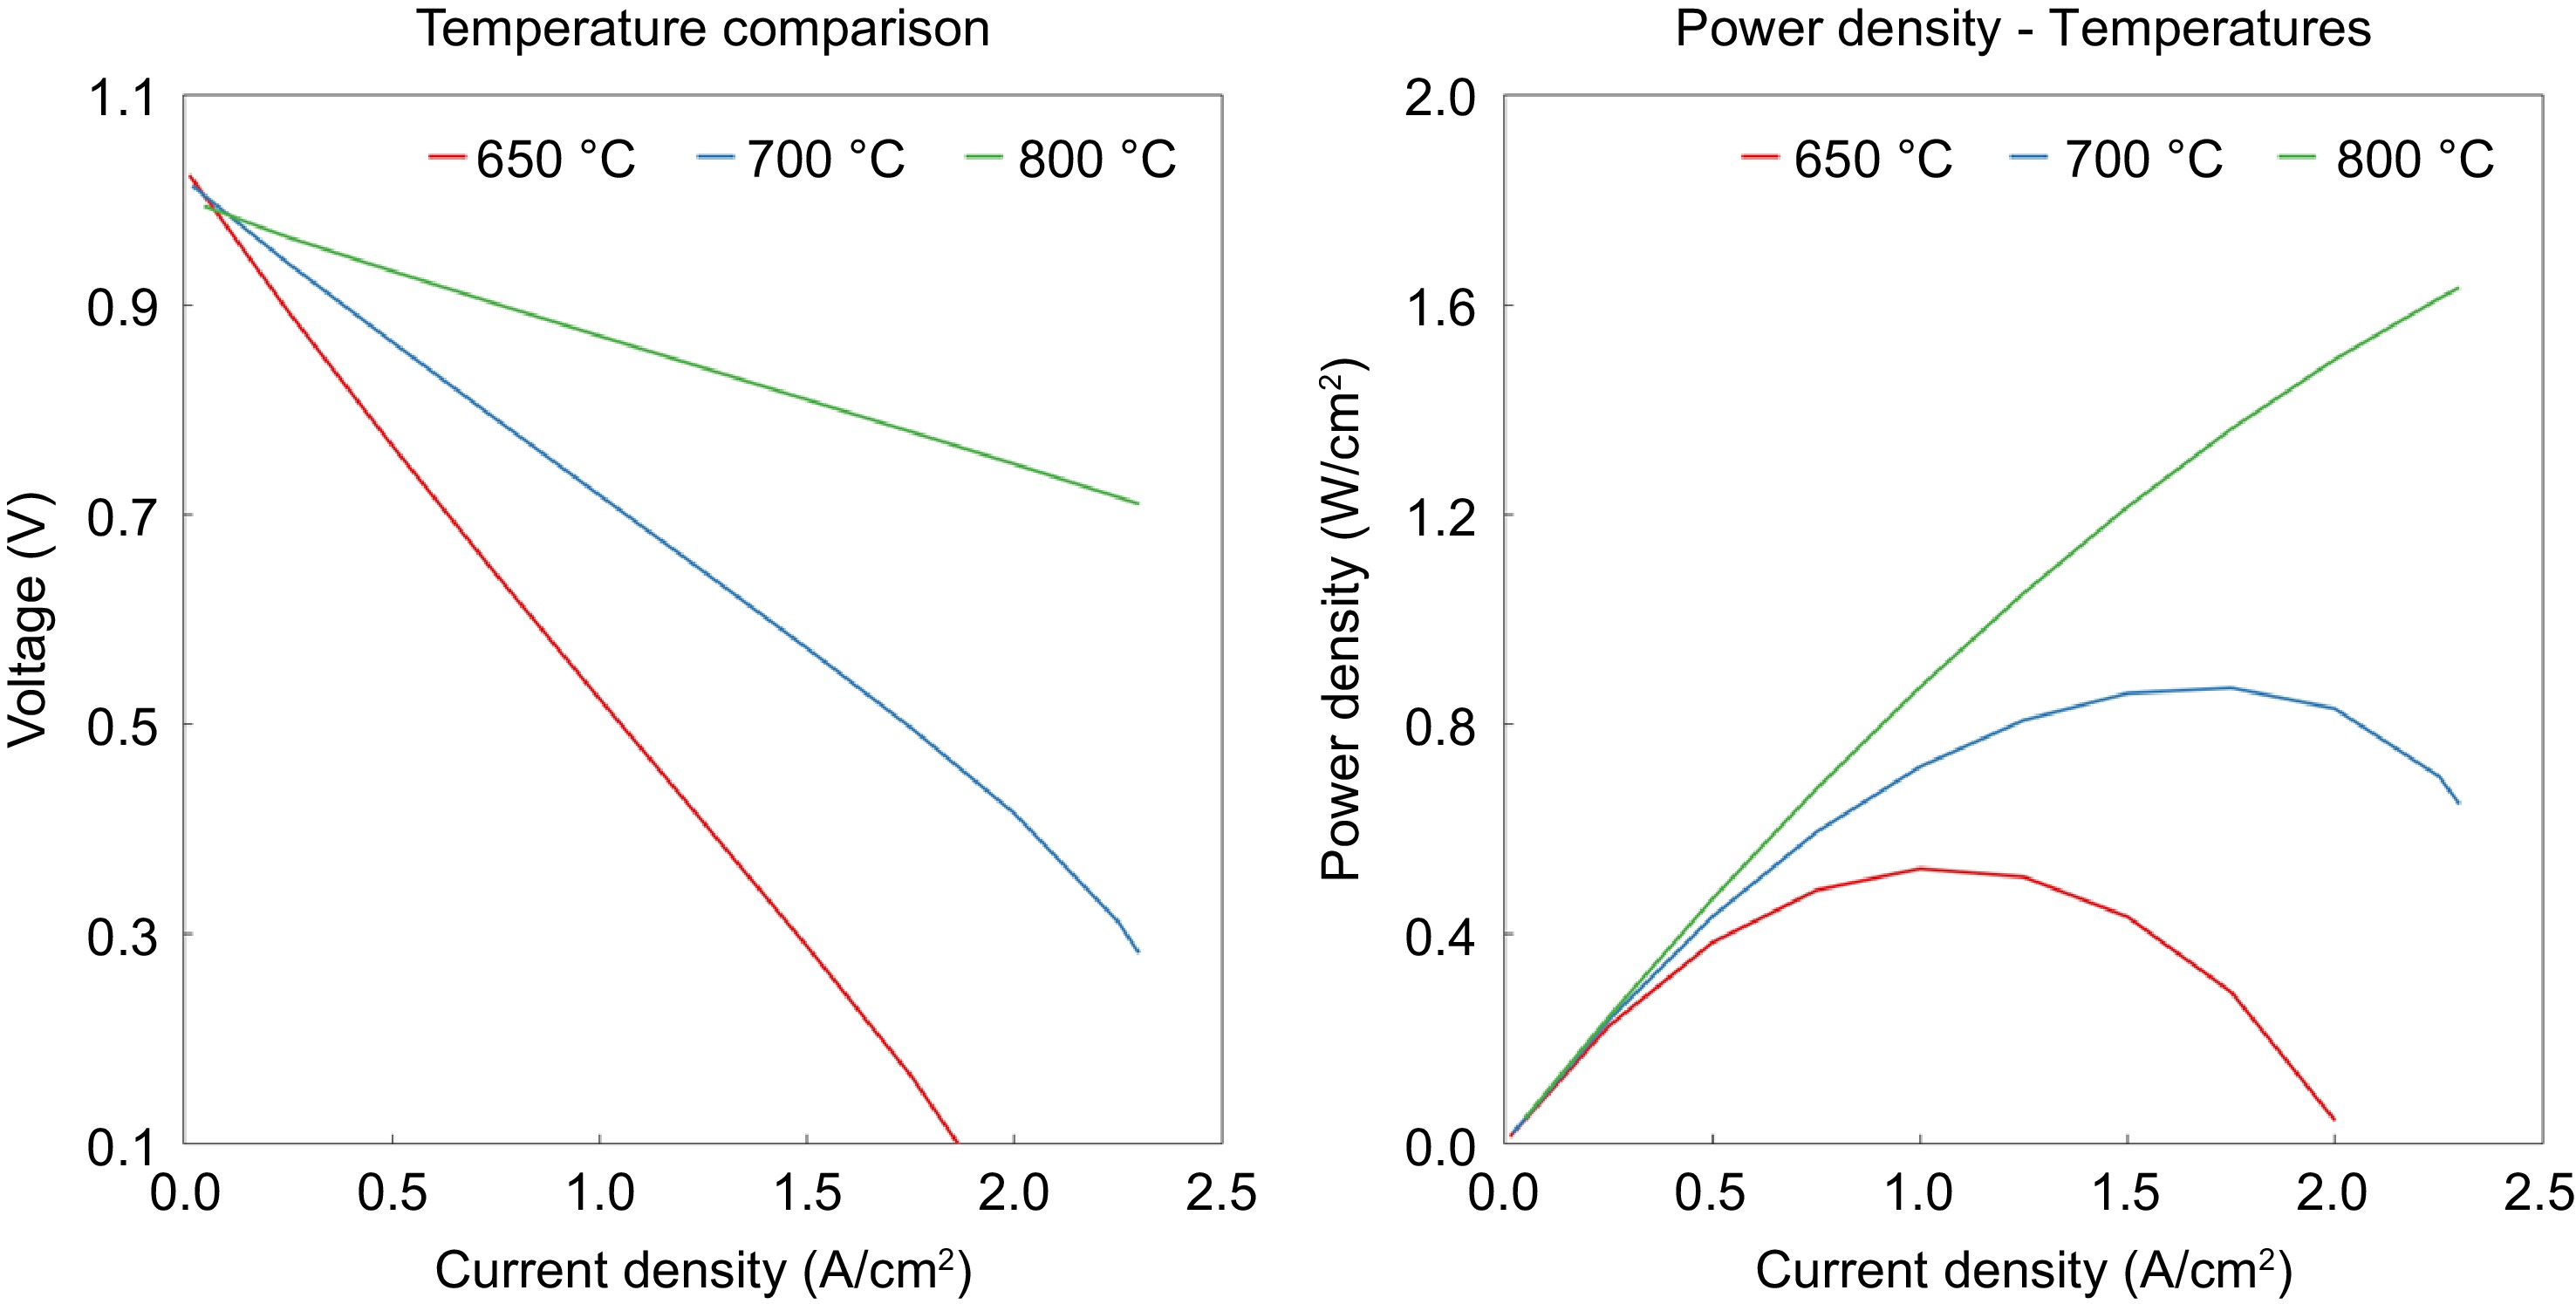
Figure 5.
Effect of current density on both the voltage and power density at 650 °C, 700 °C, and 800 °C.
-
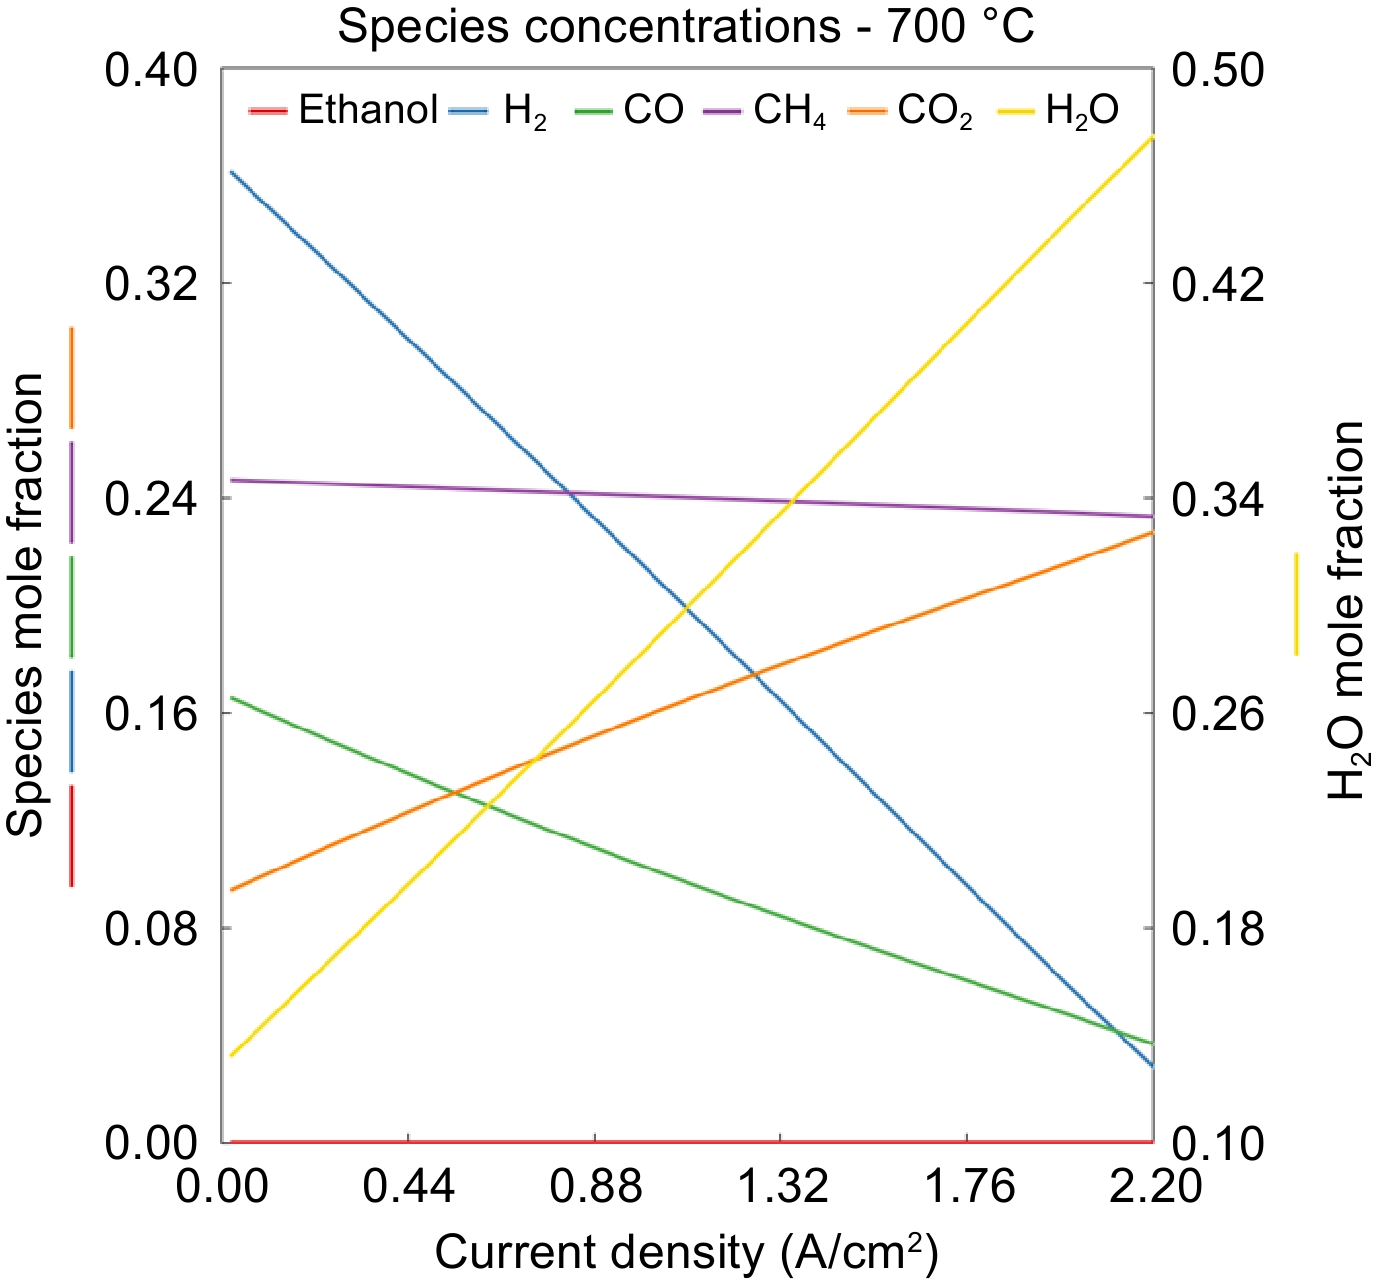
Figure 6.
Effect of current density on the species mole fraction for the 700 °C case.
-
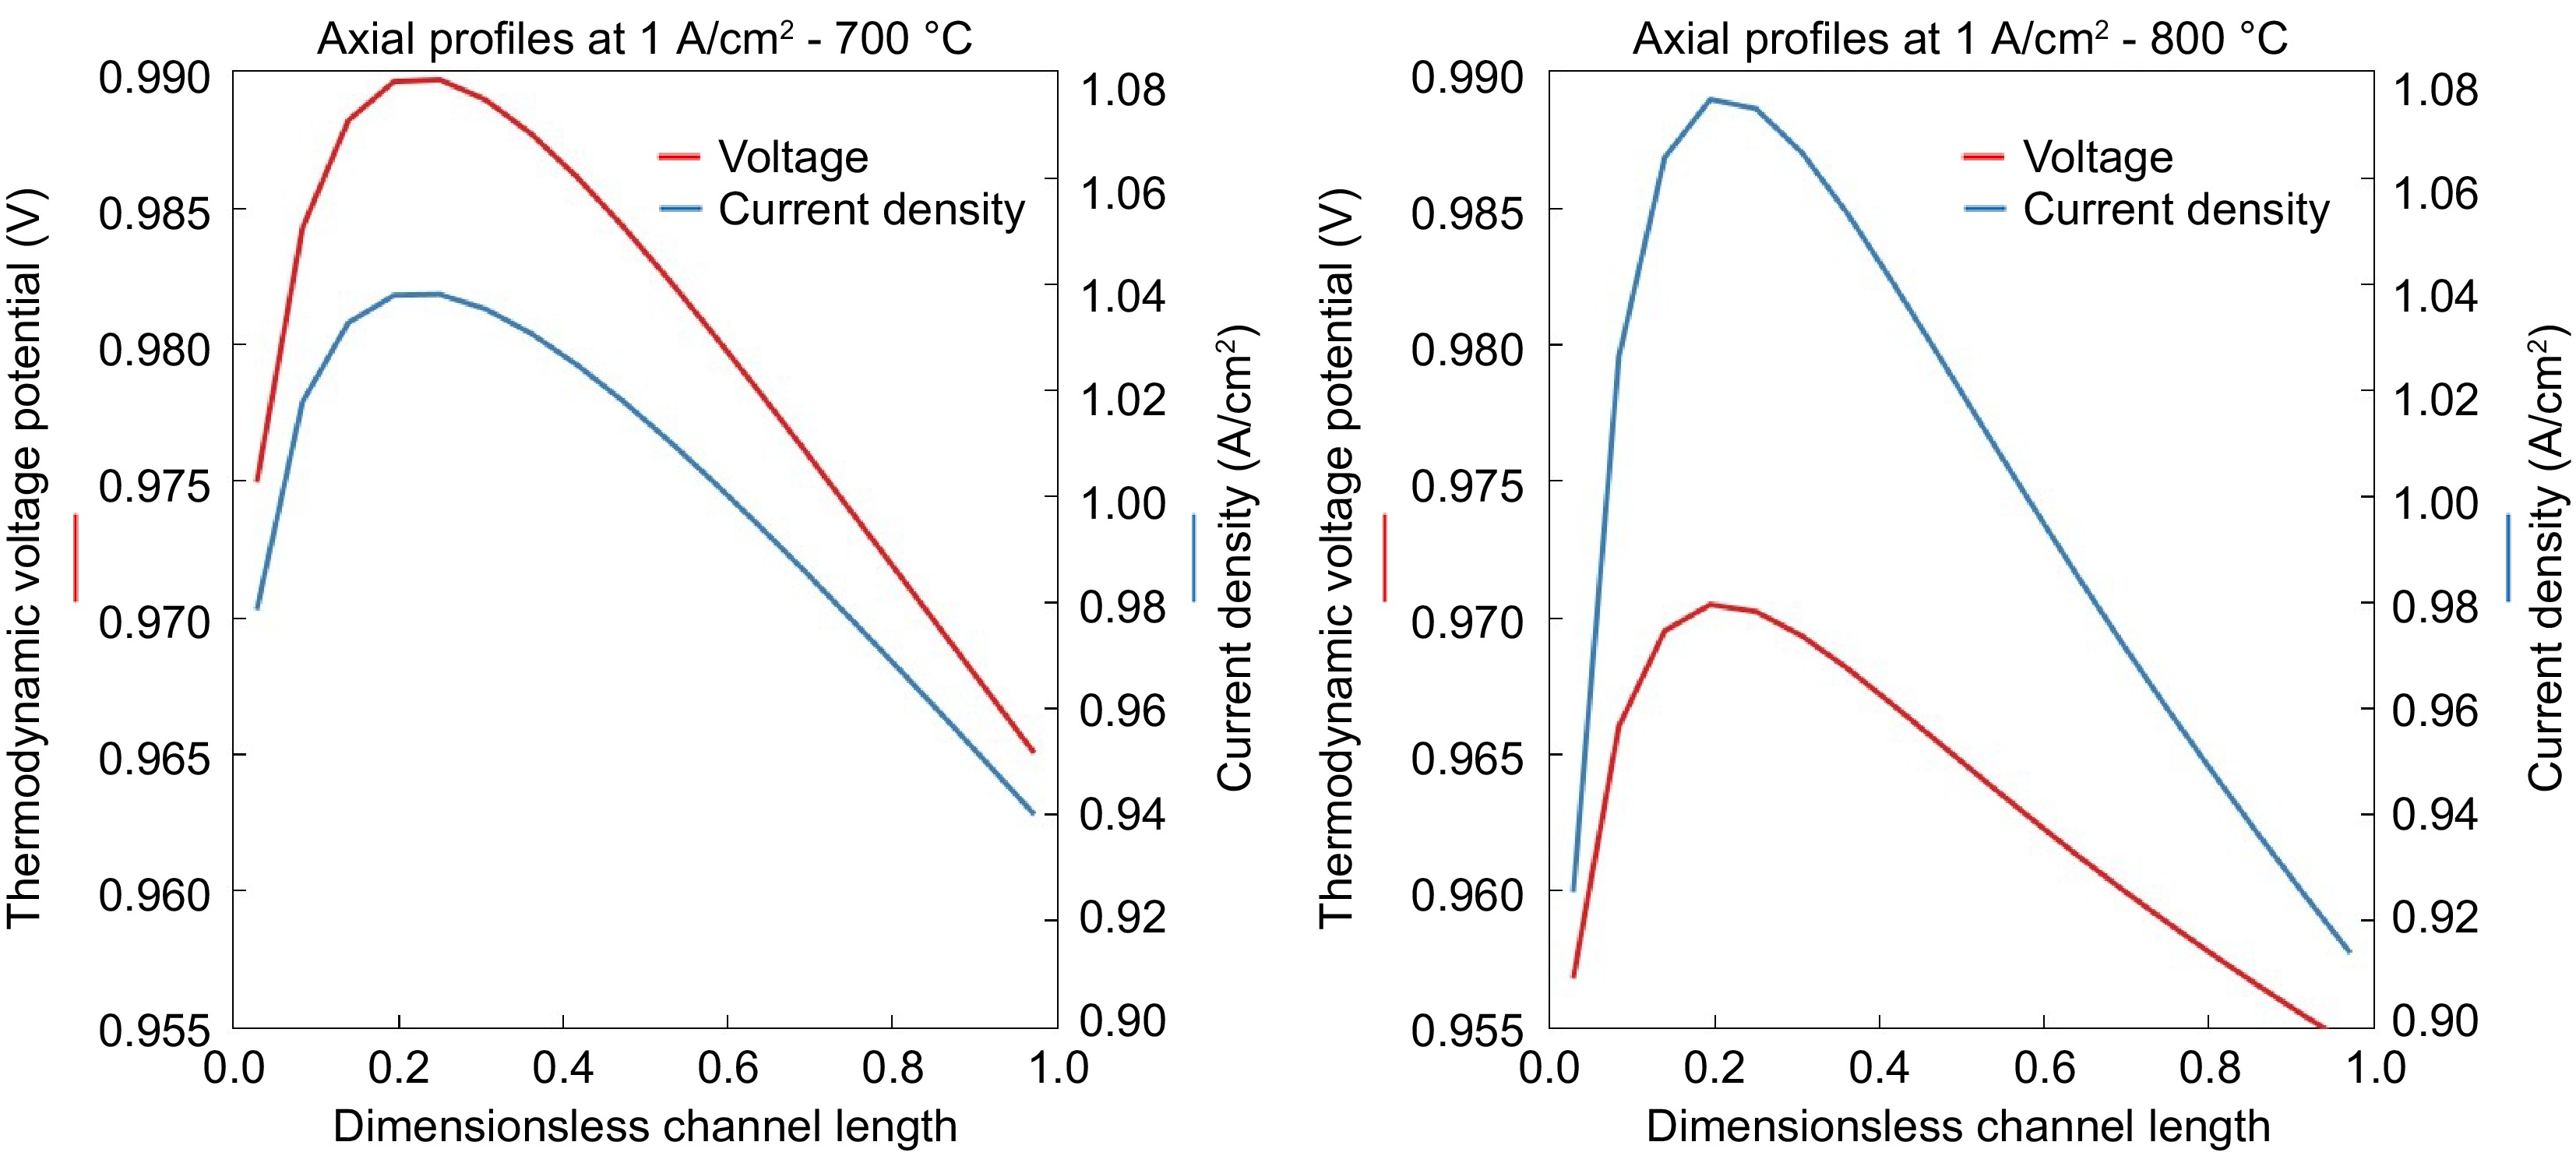
Figure 7.
Current density and thermodynamic voltage potential along the axis of SOFC at the operating temperatures of (a) 700 °C and (b) 800 °C.
-
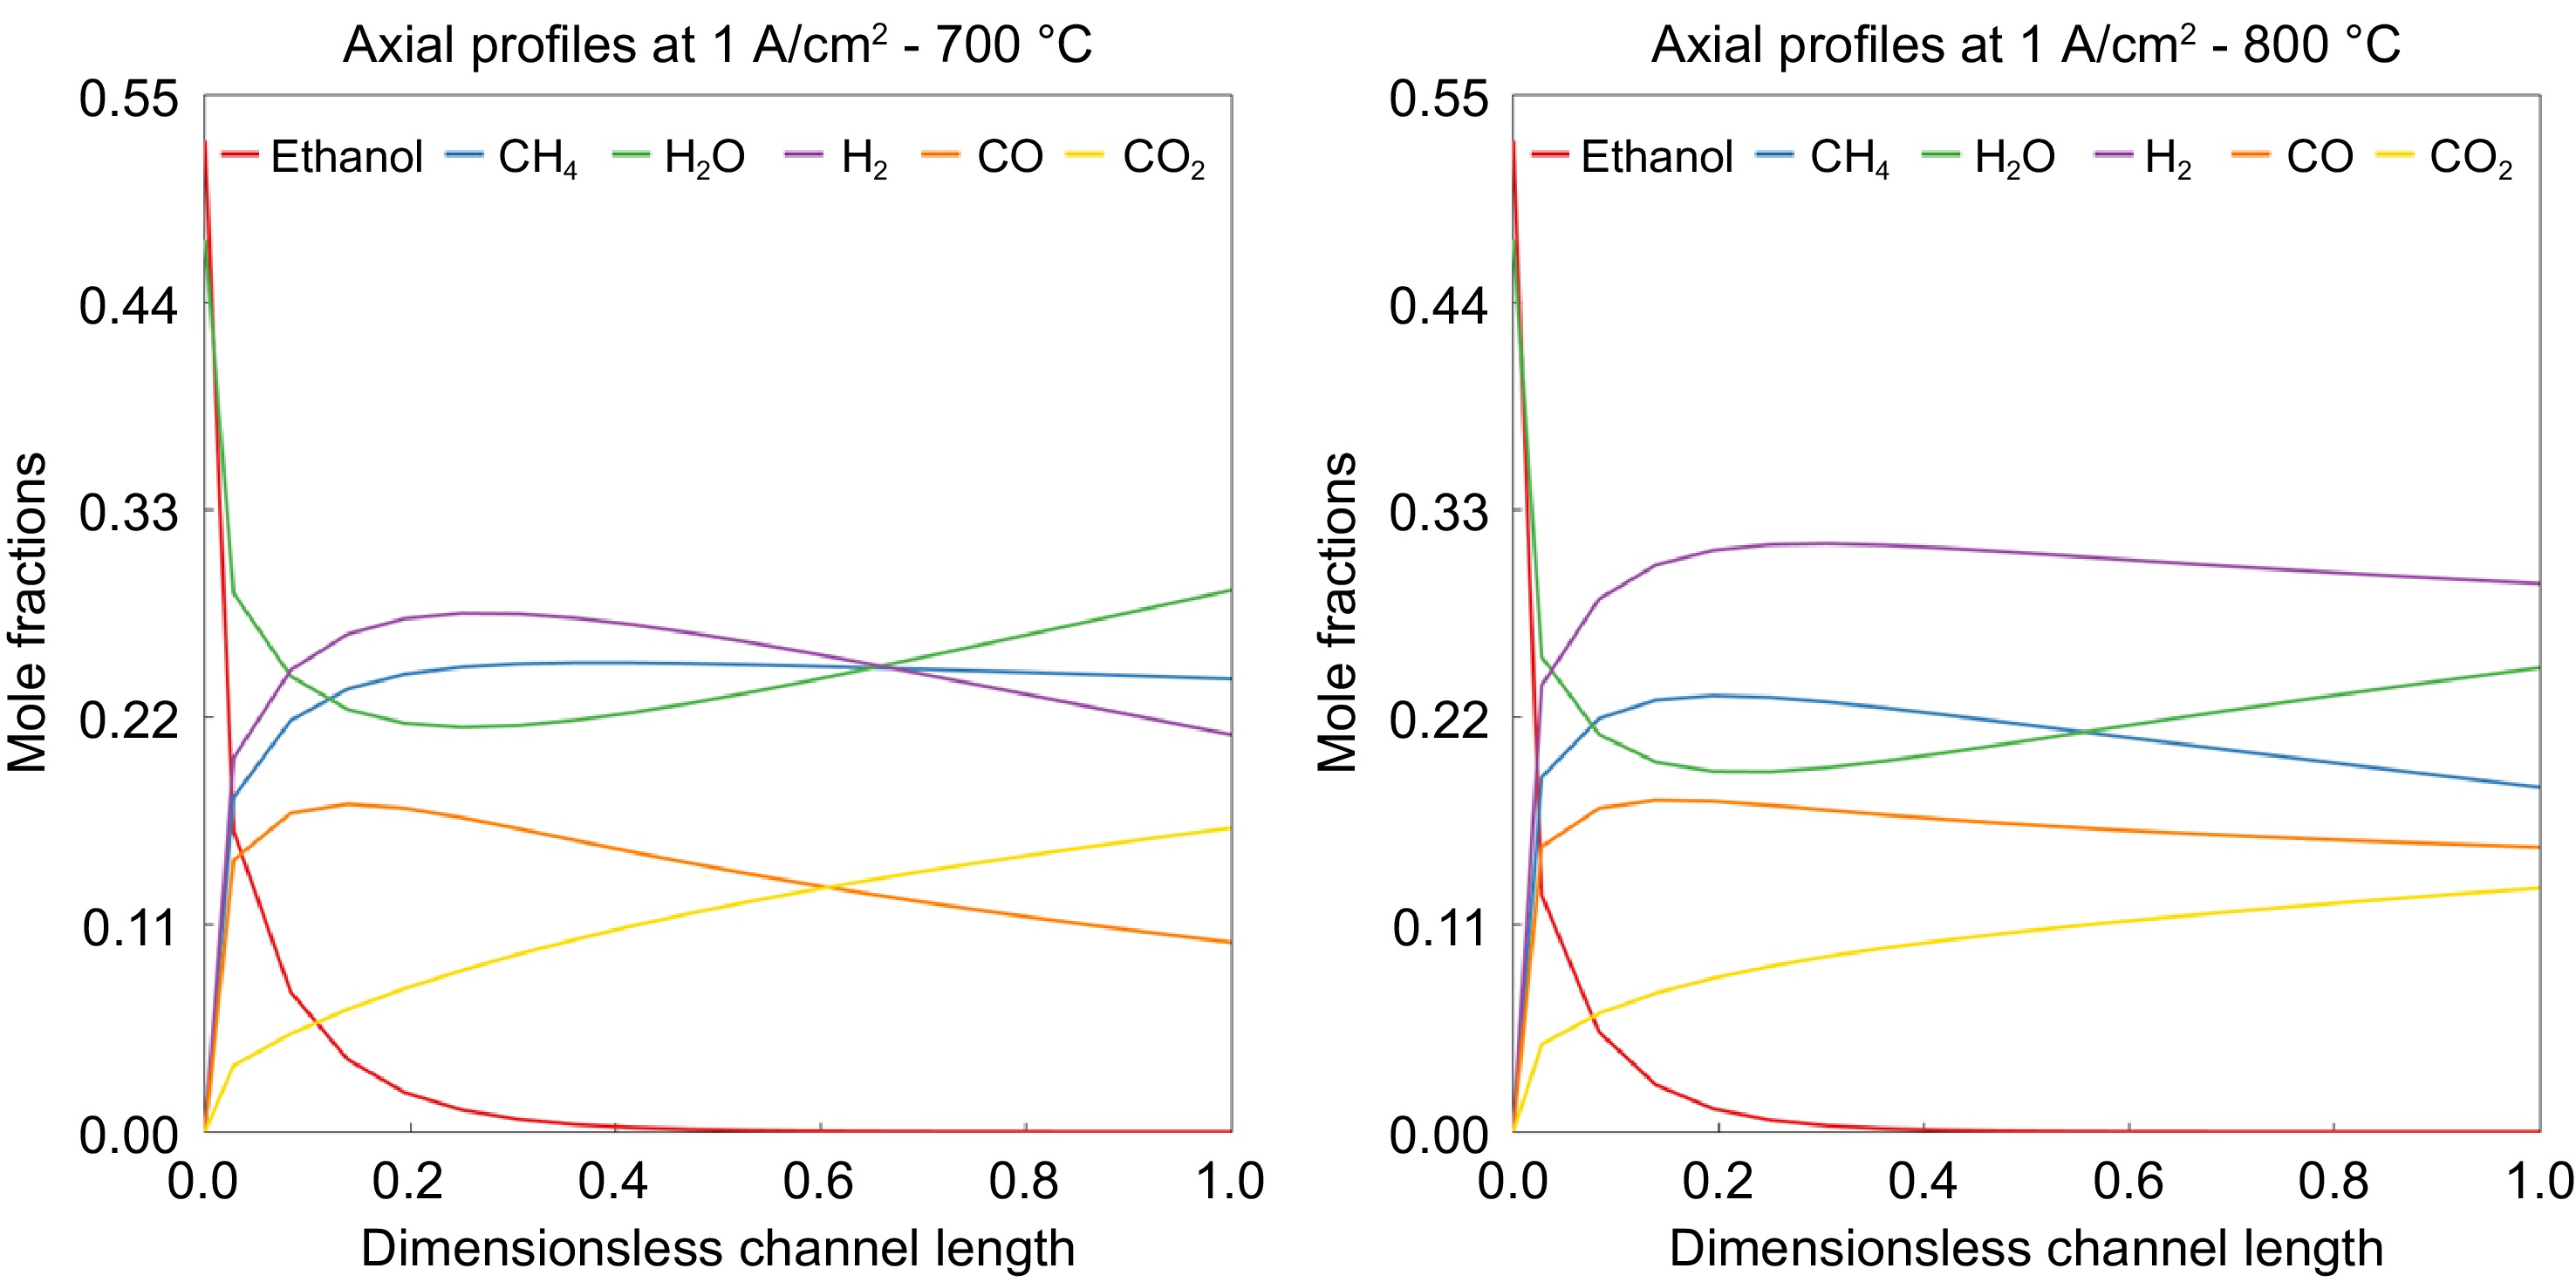
Figure 8.
Mole fractions of species along the axis of SOFC at the operating temperatures of (a) 700 °C and (b) 800 °C.
-
Reactions Reaction rate expression (mol/m 3/s) $ {\rm{C}_2H_5OH\to CH_4+H_2+CO }$ $ {716.67\;\mathrm{*}\;\mathrm{exp}\left(-\dfrac{87}{\mathrm{R}\mathrm{T}}\right)\;\mathrm{*}\;{\mathrm{p}}_{{\mathrm{C}}_{2}{\mathrm{H}}_{5}\mathrm{O}\mathrm{H}}\;\mathrm{*}\;{\mathrm{\rho }}_{\mathrm{c}\mathrm{a}\mathrm{t}} }$ $ {\mathrm{C}\mathrm{O}+{\mathrm{H}}_{2}\mathrm{O}\mathrm{ }\rightleftharpoons \mathrm{ }\mathrm{C}{\mathrm{O}}_{2}+{\mathrm{H}}_{2}} $ $ {6\;\mathrm{*}\;\mathrm{exp}\left(-\dfrac{70}{\mathrm{R}\mathrm{T}}\right)\;\mathrm{*}\;\left(\left({\mathrm{p}}_{\mathrm{C}\mathrm{O}}\;\mathrm{*}\;{\mathrm{p}}_{{\mathrm{H}}_{2}\mathrm{O}}\right)-\dfrac{\left({\mathrm{p}}_{\mathrm{C}{\mathrm{O}}_{2}}\;\mathrm{*}\;{\mathrm{p}}_{{\mathrm{H}}_{2}}\right)}{{\mathrm{K}}_{\mathrm{e}\mathrm{q}2}}\right)\;\mathrm{*}\;{\mathrm{\rho }}_{\mathrm{c}\mathrm{a}\mathrm{t}}} $ $ {\mathrm{C}{\mathrm{H}}_{4}+{\mathrm{H}}_{2}\mathrm{O}\mathrm{ }\rightleftharpoons \mathrm{ }3{\mathrm{H}}_{2}+\mathrm{C}\mathrm{O}} $ ${ 8833.33\;\mathrm{*}\;\mathrm{exp}\left(-\dfrac{162}{\mathrm{R}\mathrm{T}}\right)\;\mathrm{*}\;\left(\left({\mathrm{p}}_{\mathrm{C}{\mathrm{H}}_{4}}\;\mathrm{*}\;{\mathrm{p}}_{{\mathrm{H}}_{2}\mathrm{O}}\right)-\dfrac{\left({\mathrm{p}}_{\mathrm{C}\mathrm{O}}\;\mathrm{*}\;{{\mathrm{p}}_{{\mathrm{H}}_{2}}}^{3}\right)}{{\mathrm{K}}_{\mathrm{e}\mathrm{q}3}}\right)\;\mathrm{*}\;{\mathrm{\rho }}_{\mathrm{c}\mathrm{a}\mathrm{t}} }$ Table 1.
Global reaction rate expressions for the three reactions of ethanol reforming.
-
Aspect ratio 0.2 0.4 0.7 1.0 2.0 2.5 5.0 10.0 Sh 0.96 1.60 2.26 2.71 3.54 3.78 4.41 4.85 Table 2.
Sherwood number as a function of aspect ratio.
Figures
(8)
Tables
(2)