


-
Climate change and global warming are major concerns for countries worldwide, prompting the adoption of various measures to decrease carbon emissions. One such measure is the utilization of carbon-free fuel, such as hydrogen. Oxidizing hydrogen fuel with air produces only water as a byproduct. Thus, hydrogen fuel has the potential to eliminate carbon emissions and other harmful combustion products such as oxides of sulfur (SOx) and volatile organic compounds (VOC). Hydrogen is being aggressively consumed by industries such as transportation, power generation, chemical and industrial operations, fuel blending, and others. One of the most important applications of hydrogen during the last decade is in fuel cells for power generation. In a fuel cell, chemical energy is directly converted into electrical energy without combustion with just water as a byproduct. Fuel cells have a simplex nature resulting in an electrical efficiency of over 60% with minimal to no emissions compared to combustion engines [ 1] . Among the many types of fuel cells, solid oxide fuel cells (SOFC) are promising due to their fuel flexibility, low operating costs, and high electrical efficiency. Furthermore, SOFCs do not require precious metals or corrosive acids, unlike other types of fuel cells such as proton exchange membrane fuel cells (PEMFCs), Phosphoric acid fuel cells (PAFCs), and Direct methanol fuel cells (DMFCs).
SOFCs consist of a ceramic electrolyte, a cathode, and an anode. Oxygen is reduced in the cathode, forming oxygen ions that then diffuse through the solid electrolyte to the anode, where they oxidize the fuel. The ceramic material needs an extremely high temperature (> 500 °C) to conduct oxygen ions. SOFCs can be classified into two types based on how fuel is reformed: internal reforming SOFCs (DIR-SOFCs) and external reforming SOFCs. In external reforming SOFCs, hydrocarbon fuels are reformed outside the fuel cell in a separate reactor to produce hydrogen, which is then directed to the anode of the fuel cell. In DIR-SOFCs, hydrocarbon fuels are directly supplied to the anode, and reforming primarily takes place in the anode support layer. The ability to utilize a diverse range of conventional fuels expands the application of SOFCs because it eliminates the need for pure hydrogen as required by low temperature fuel cells such as PEMFCs.
In comparison to SOFCs with external reformers, DIR-SOFCs offer significant advantages such as improved thermal management, faster response time, simplicity, and compactness. These benefits stem from the direct supply of hydrocarbon fuels to the anode, where reforming primarily occurs within the anode support layer. This integrated approach not only simplifies the system architecture but also enhances overall efficiency and performance, making DIR-SOFCs a compelling choice for a wide range of applications.
One of the major obstacles in the worldwide adoption of hydrogen as a fuel is its lack of availability in a pure form. However, besides the traditional method of reforming conventional fuels to produce hydrogen, there are also alternative renewable sources like solar, wind, and e-fuels that make hydrogen a viable and eco-friendly option. Nonetheless, it is important to understand the practicality of meeting the increasing demand for hydrogen fuel. In 2021 [ 2] , global hydrogen production reached 94 million tons (Mt H 2), with the majority derived from natural gas (~62%) and coal. Only 0.04% of the hydrogen was derived from fossil-free sources through water electrolysis and the associated emissions for this production were more than 900 Mt of CO 2. To maintain the overall effectiveness of hydrogen fuel in reducing greenhouse gas emissions, the dependence on fossil fuels in its production process needs to be significantly reduced. Aside from electrolysis, alternative sources for producing clean hydrogen include biowaste and biofuels. However, all these sources significantly increase the cost of hydrogen. Hydrogen is categorized into various colors based on the energy sources for its production, ranging from black/brown to white [ 3, 4].
To be cost-effective and phase out fossil fuel dependence, renewable fuels, such as ethanol, are promising methods. Ethanol is readily available owing to its increasing use as a blending agent with gasoline, making it an ideal candidate for producing hydrogen through reforming. The US produces 17.5 billion gallons of ethanol per year as of 2021 [ 5] . Although reforming methane/methanol has been extensively studied for decades, ethanol reforming to produce hydrogen is more attractive due to its less toxic nature. Ethanol can be converted into hydrogen through thermochemical, hydrothermal, photochemical, and electrochemical processes [ 6] , among which steam reformation of ethanol to produce hydrogen, a thermochemical process, is the focus of the current work. Steam reforming is a widely used process due to its efficiency and versatility in utilizing various hydrocarbons and a wide range of operating temperatures.
Steam reforming is an endothermic process that involves reacting hydrocarbons, like methane or ethanol, with steam to produce syngas, a mixture of hydrogen and carbon monoxide. Catalysts are typically used to enhance the thermal breakdown of hydrocarbons during steam reforming. Noble metals, such as platinum (Pt) or rhodium (Rh), are excellent catalysts for low-temperature reforming to produce hydrogen. However, transition metals such as nickel (Ni) are often used in applications where temperatures greater than 600 °C due to their cost-effectiveness [ 7] . Additionally, researchers have discovered that bimetallic catalysts containing noble metals, such as cerium oxide, result in a higher hydrogen yield when producing hydrogen from ethanol [ 8] . One of the major challenges of steam reforming is coking, a process that creates solid carbon (known as coke) when hydrocarbons are reformed with little to no oxidizing agent. Coking deactivates the catalyst by depositing on its surface and prevents the reformation process. To prevent coking, high operating temperatures [ 9, 10] and a suitable steam-to-carbon molar ratio of between 3 and 5 [ 11− 15] are recommended.
Despite natural gas's current dominance in hydrogen production, ethanol's potential as an alternative source has been studied by various researchers. In particular, bioethanol has substantial benefits over methane/natural gas and should be explored further as a source fuel in hydrogen generation to meet current global warming targets. Furthermore, unlike methane, under specific operating conditions, the high temperature needs of ethanol reformation could be avoided. Garcia et al. [ 16] developed a model for reforming ethanol into acetaldehyde and subsequently hydrogen using SnO 2 and Co (Fe)/ZnO catalysts. The model has been validated using experimental data and can estimate the required inputs and operating conditions to produce enough H 2 to feed a 1 kW proton-exchange membrane (PEM) fuel cell. Ulejczyk et al. [ 17] employed a similar cobalt-based catalyst in a plasma catalytic reactor to produce hydrogen from ethanol at temperatures ranging from 250 °C to 450 °C (523 to 723 K).
Ni et al. [ 18] evaluated the work of many researchers on bioethanol reformation in hydrogen generation. The authors identified Rh and Ni as the best and most often utilized steam reforming catalysts, with MgO, ZnO, CeO 2, and La 2O 3 as appropriate support components. López et al. [ 19] published a comprehensive study on the production, characterization, and reaction assessment of structured catalysts used in ethanol steam reforming to produce hydrogen. Through mathematical modeling, the authors also established activation energy and pre-exponent multipliers for the four main reactions that capture the ethanol steam reforming process. This work served as the foundation for the ethanol reformer modeling in this study, and their experimental data is being utilized to validate our ethanol reformer model predictions.
Several studies have investigated the suitability of different fuels in SOFCs. Andersson et al. [ 20] used a computational fluid dynamics-based model to examine the impact of multiple renewable fuels, including ethanol on SOFCs. The authors determined that ethanol is one of the sustainable fuels in a SOFC system. In another study, Dokmaingam et al. [ 21] developed a mathematical model to analyze the influence of various primary fuels, including ethanol, on internal reforming SOFCs and discovered that co-flow patterns with a finer temperature gradient along the system worked better.
Laosiripojana & Assabumrungrat [ 22] determined that the Ni/YSZ catalyst is well suited for methane and methanol as the primary fuel, but not ethanol in a direct internal reforming SOFC (DIR-SOFC), due to the catalyst's rapid degradation by carbon deposition even at high steam content and operating temperatures. In contrast, Augusto et al. [ 23] studied the Ni/GDC catalyst and determined its ability to operate with dry ethanol for 50 h without carbon production. Despite the economic advantages of nickel-based catalysts, nickel-free anodes have been employed in SOFC for fuels such as methane and ethanol. Finally, Sarruf et al. [ 24] evaluated the impact of bimetallic cells (ceria-Co-Cu) with monometallic cells (ceria-Co and ceria-Cu) and exhibited over 24 h of continuous operation without coking. The examination of literature on both internal and external reforming SOFCs were vital for contextualizing this study and comprehensively understanding the range of reforming approaches, along with their respective advantages and limitations. By reviewing existing research, the aim was to identify gaps in the literature and delineate areas where further investigation is warranted.
First, a detailed mathematical model that includes diffusion in the catalyst/wash coat layer of a monolith reactor was developed and validated against the measurements for ethanol steam reforming [ 25] . This model was used to study the effect of different operating conditions on the ethanol conversion and the production of H 2 along with other species such as CH 4, CO, and CO 2. Building on that, in this work, an SOFC model with direct internal reforming of ethanol and electrochemical oxidation of H 2 was developed and calibrated using a polarization curve measurements obtained from the literature [ 26] . Finally, the SOFC model was used to study the performance of SOFC under different operating conditions along with a discussion of the key characteristics observed in the behavior of different reacting species.
-
An ethanol reformer model was developed and validated [ 25] with the experimental measurements from López et al. [ 19] . The reforming mechanism consists of the following three reactions:
$\begin{array}{*{20}{l}} \mathrm{C}_2\mathrm{H}_5\mathrm{O}\mathrm{H}\to\mathrm{C}\mathrm{H}_4+\mathrm{H}_2+\mathrm{C}\mathrm{O}\; \; \Delta\rm{H}=49.3\; kJ/mol &\quad {\rm{R1}} \\\mathrm{C}\mathrm{O}+{\mathrm{H}}_{2}\mathrm{O}\rightleftharpoons \mathrm{ }\mathrm{C}{\mathrm{O}}_{2}+{\mathrm{H}}_{2}\;\; \Delta \rm H = -41.16\;kJ/mol&\quad{\rm{ R2}}\\ \rm CH_4 + H_2O \rightleftharpoons 3H_2 + CO\;\; \Delta H = 206.17\;kJ/mol &\quad {\rm{R3}}\end{array}$ The optimized activation energy and pre-exponential factors are reported in Table 1.
Table 1. Global reaction rate expressions for the three reactions of ethanol reforming.
Reactions Reaction rate expression (mol/m 3/s) $ {\rm{C}_2H_5OH\to CH_4+H_2+CO }$ $ {716.67\;\mathrm{*}\;\mathrm{exp}\left(-\dfrac{87}{\mathrm{R}\mathrm{T}}\right)\;\mathrm{*}\;{\mathrm{p}}_{{\mathrm{C}}_{2}{\mathrm{H}}_{5}\mathrm{O}\mathrm{H}}\;\mathrm{*}\;{\mathrm{\rho }}_{\mathrm{c}\mathrm{a}\mathrm{t}} }$ $ {\mathrm{C}\mathrm{O}+{\mathrm{H}}_{2}\mathrm{O}\mathrm{ }\rightleftharpoons \mathrm{ }\mathrm{C}{\mathrm{O}}_{2}+{\mathrm{H}}_{2}} $ $ {6\;\mathrm{*}\;\mathrm{exp}\left(-\dfrac{70}{\mathrm{R}\mathrm{T}}\right)\;\mathrm{*}\;\left(\left({\mathrm{p}}_{\mathrm{C}\mathrm{O}}\;\mathrm{*}\;{\mathrm{p}}_{{\mathrm{H}}_{2}\mathrm{O}}\right)-\dfrac{\left({\mathrm{p}}_{\mathrm{C}{\mathrm{O}}_{2}}\;\mathrm{*}\;{\mathrm{p}}_{{\mathrm{H}}_{2}}\right)}{{\mathrm{K}}_{\mathrm{e}\mathrm{q}2}}\right)\;\mathrm{*}\;{\mathrm{\rho }}_{\mathrm{c}\mathrm{a}\mathrm{t}}} $ $ {\mathrm{C}{\mathrm{H}}_{4}+{\mathrm{H}}_{2}\mathrm{O}\mathrm{ }\rightleftharpoons \mathrm{ }3{\mathrm{H}}_{2}+\mathrm{C}\mathrm{O}} $ ${ 8833.33\;\mathrm{*}\;\mathrm{exp}\left(-\dfrac{162}{\mathrm{R}\mathrm{T}}\right)\;\mathrm{*}\;\left(\left({\mathrm{p}}_{\mathrm{C}{\mathrm{H}}_{4}}\;\mathrm{*}\;{\mathrm{p}}_{{\mathrm{H}}_{2}\mathrm{O}}\right)-\dfrac{\left({\mathrm{p}}_{\mathrm{C}\mathrm{O}}\;\mathrm{*}\;{{\mathrm{p}}_{{\mathrm{H}}_{2}}}^{3}\right)}{{\mathrm{K}}_{\mathrm{e}\mathrm{q}3}}\right)\;\mathrm{*}\;{\mathrm{\rho }}_{\mathrm{c}\mathrm{a}\mathrm{t}} }$ Where p x corresponds to the partial pressure of the corresponding species and K eq is the equilibrium constant. For additional details on the chemical kinetics, please refer to Hariharan et al. [ 25] .
Figure 1 shows the model validation for ethanol conversion and H 2 yield for different reactor temperatures. Ethanol conversion reaches 100% above 700 K, whereas hydrogen yield increases linearly until 700 K, primarily from ethanol decomposition. From 700 and 850 K, a marginal increase in H2 yield occurs which is due to the WGS reaction, followed by a sharp increase from methane reforming reactions. The model was also able to capture all species mole fractions for the entire operating temperature range of 500 to 1,000 K.
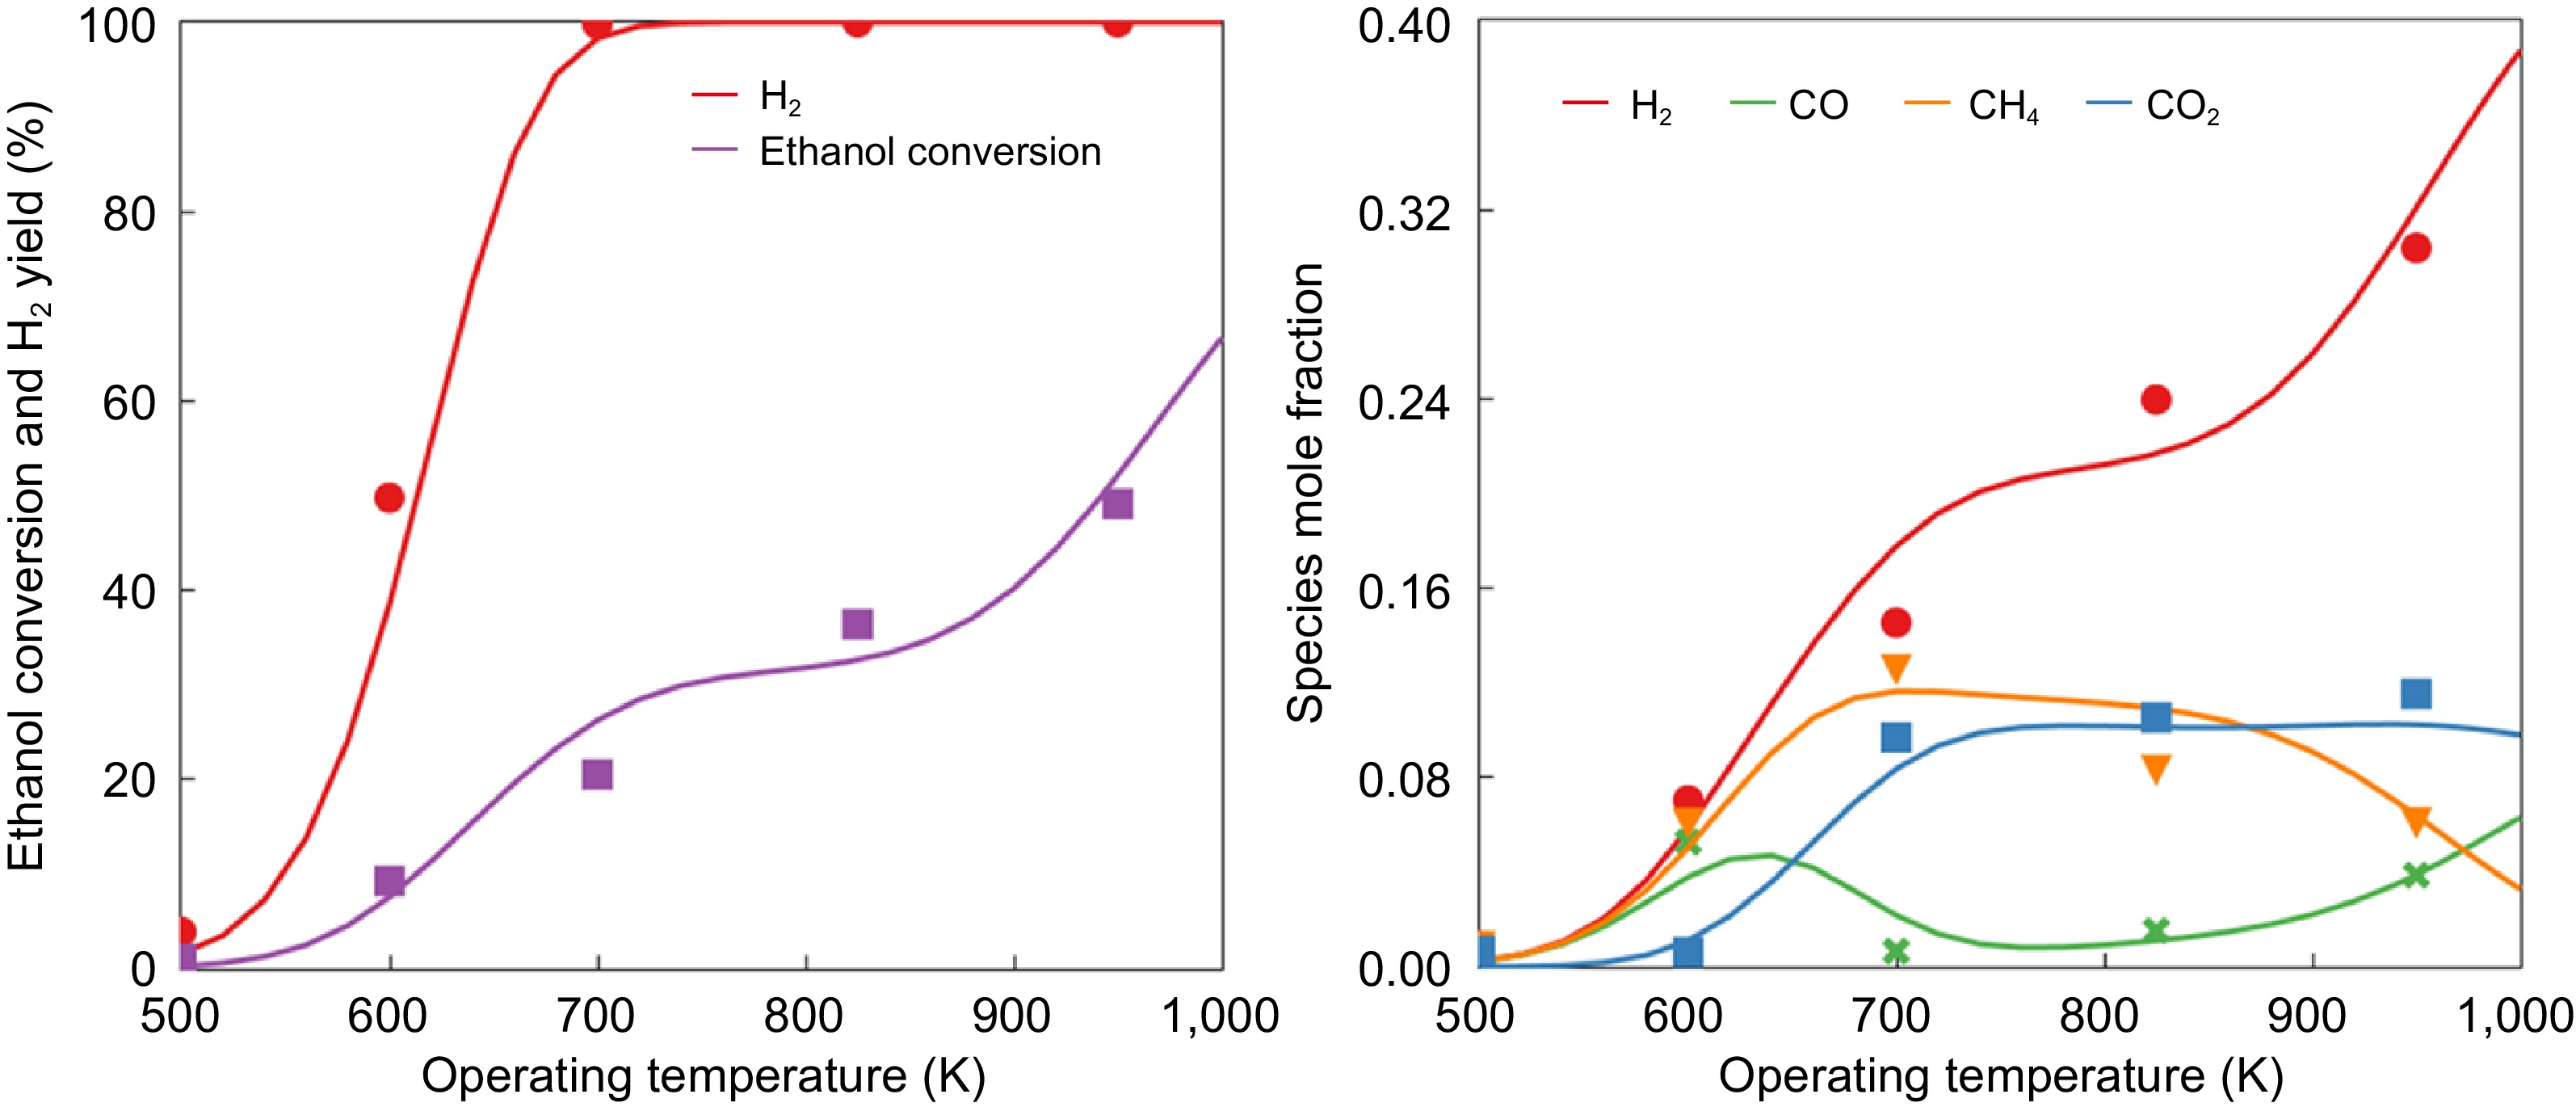
Figure 1.
Model validation on the effects of various operating temperatures on (a) ethanol conversion and H 2 yield, and (b) species mole fraction (lines represent the model results and the dots represent experimental measurements from López et al. [ 19] ).
-
An SOFC model with direct internal reforming of ethanol was developed based on the validated kinetics of ethanol reformer model as shown in Fig. 2. A schematic representation of the two-stage process of reforming ethanol to hydrogen and then to power with water as a byproduct is shown in Fig. 3. Laminar flow is assumed in the channel as the Reynolds numbers encountered in the fuel cells are less than 2,000 even at the highest current densities and the flow is assumed to be fully developed. Additionally, the axial diffusion in the channel is assumed negligible as flow is dominated by convection and radial diffusion in the channel is accounted for using the widely used mass transfer coefficient approach [ 27] .
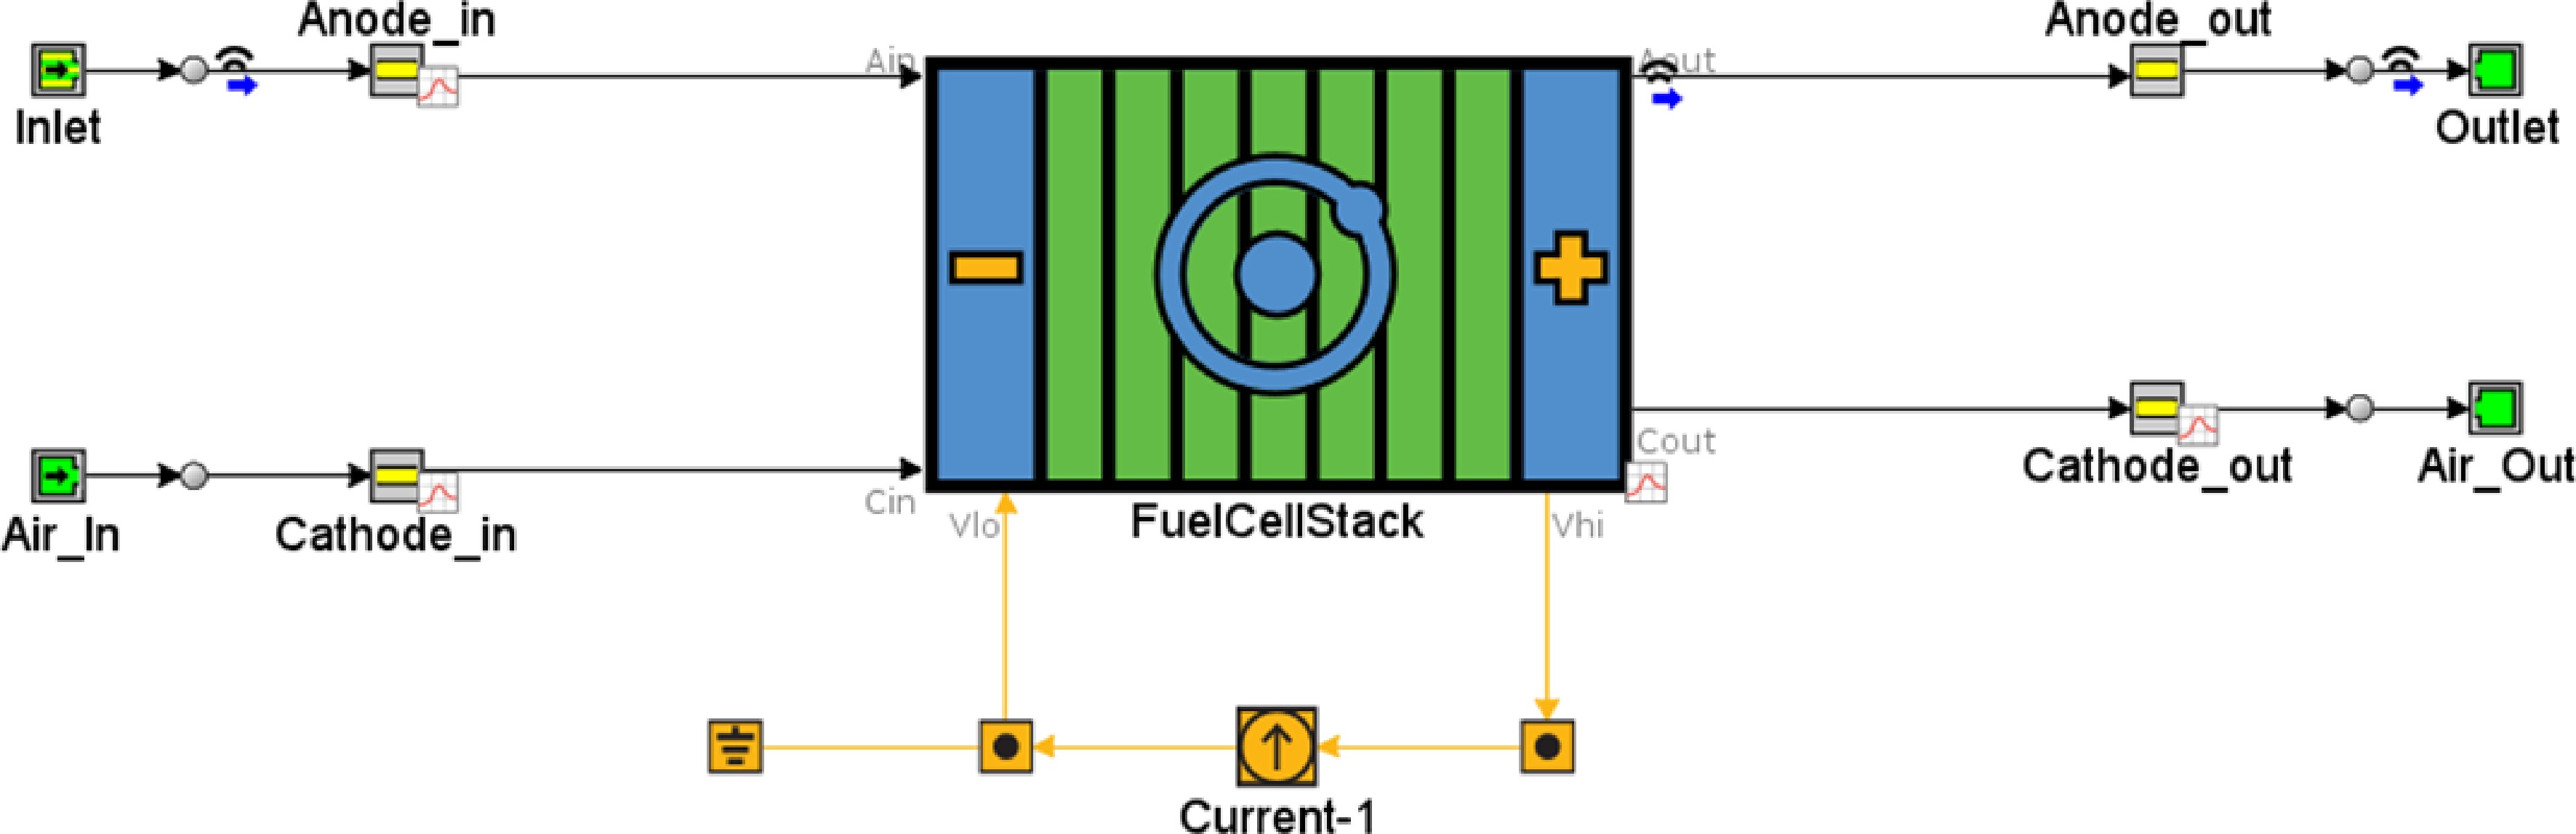
Figure 2.
GT-SUITE model for direct reforming ethanol SOFC.
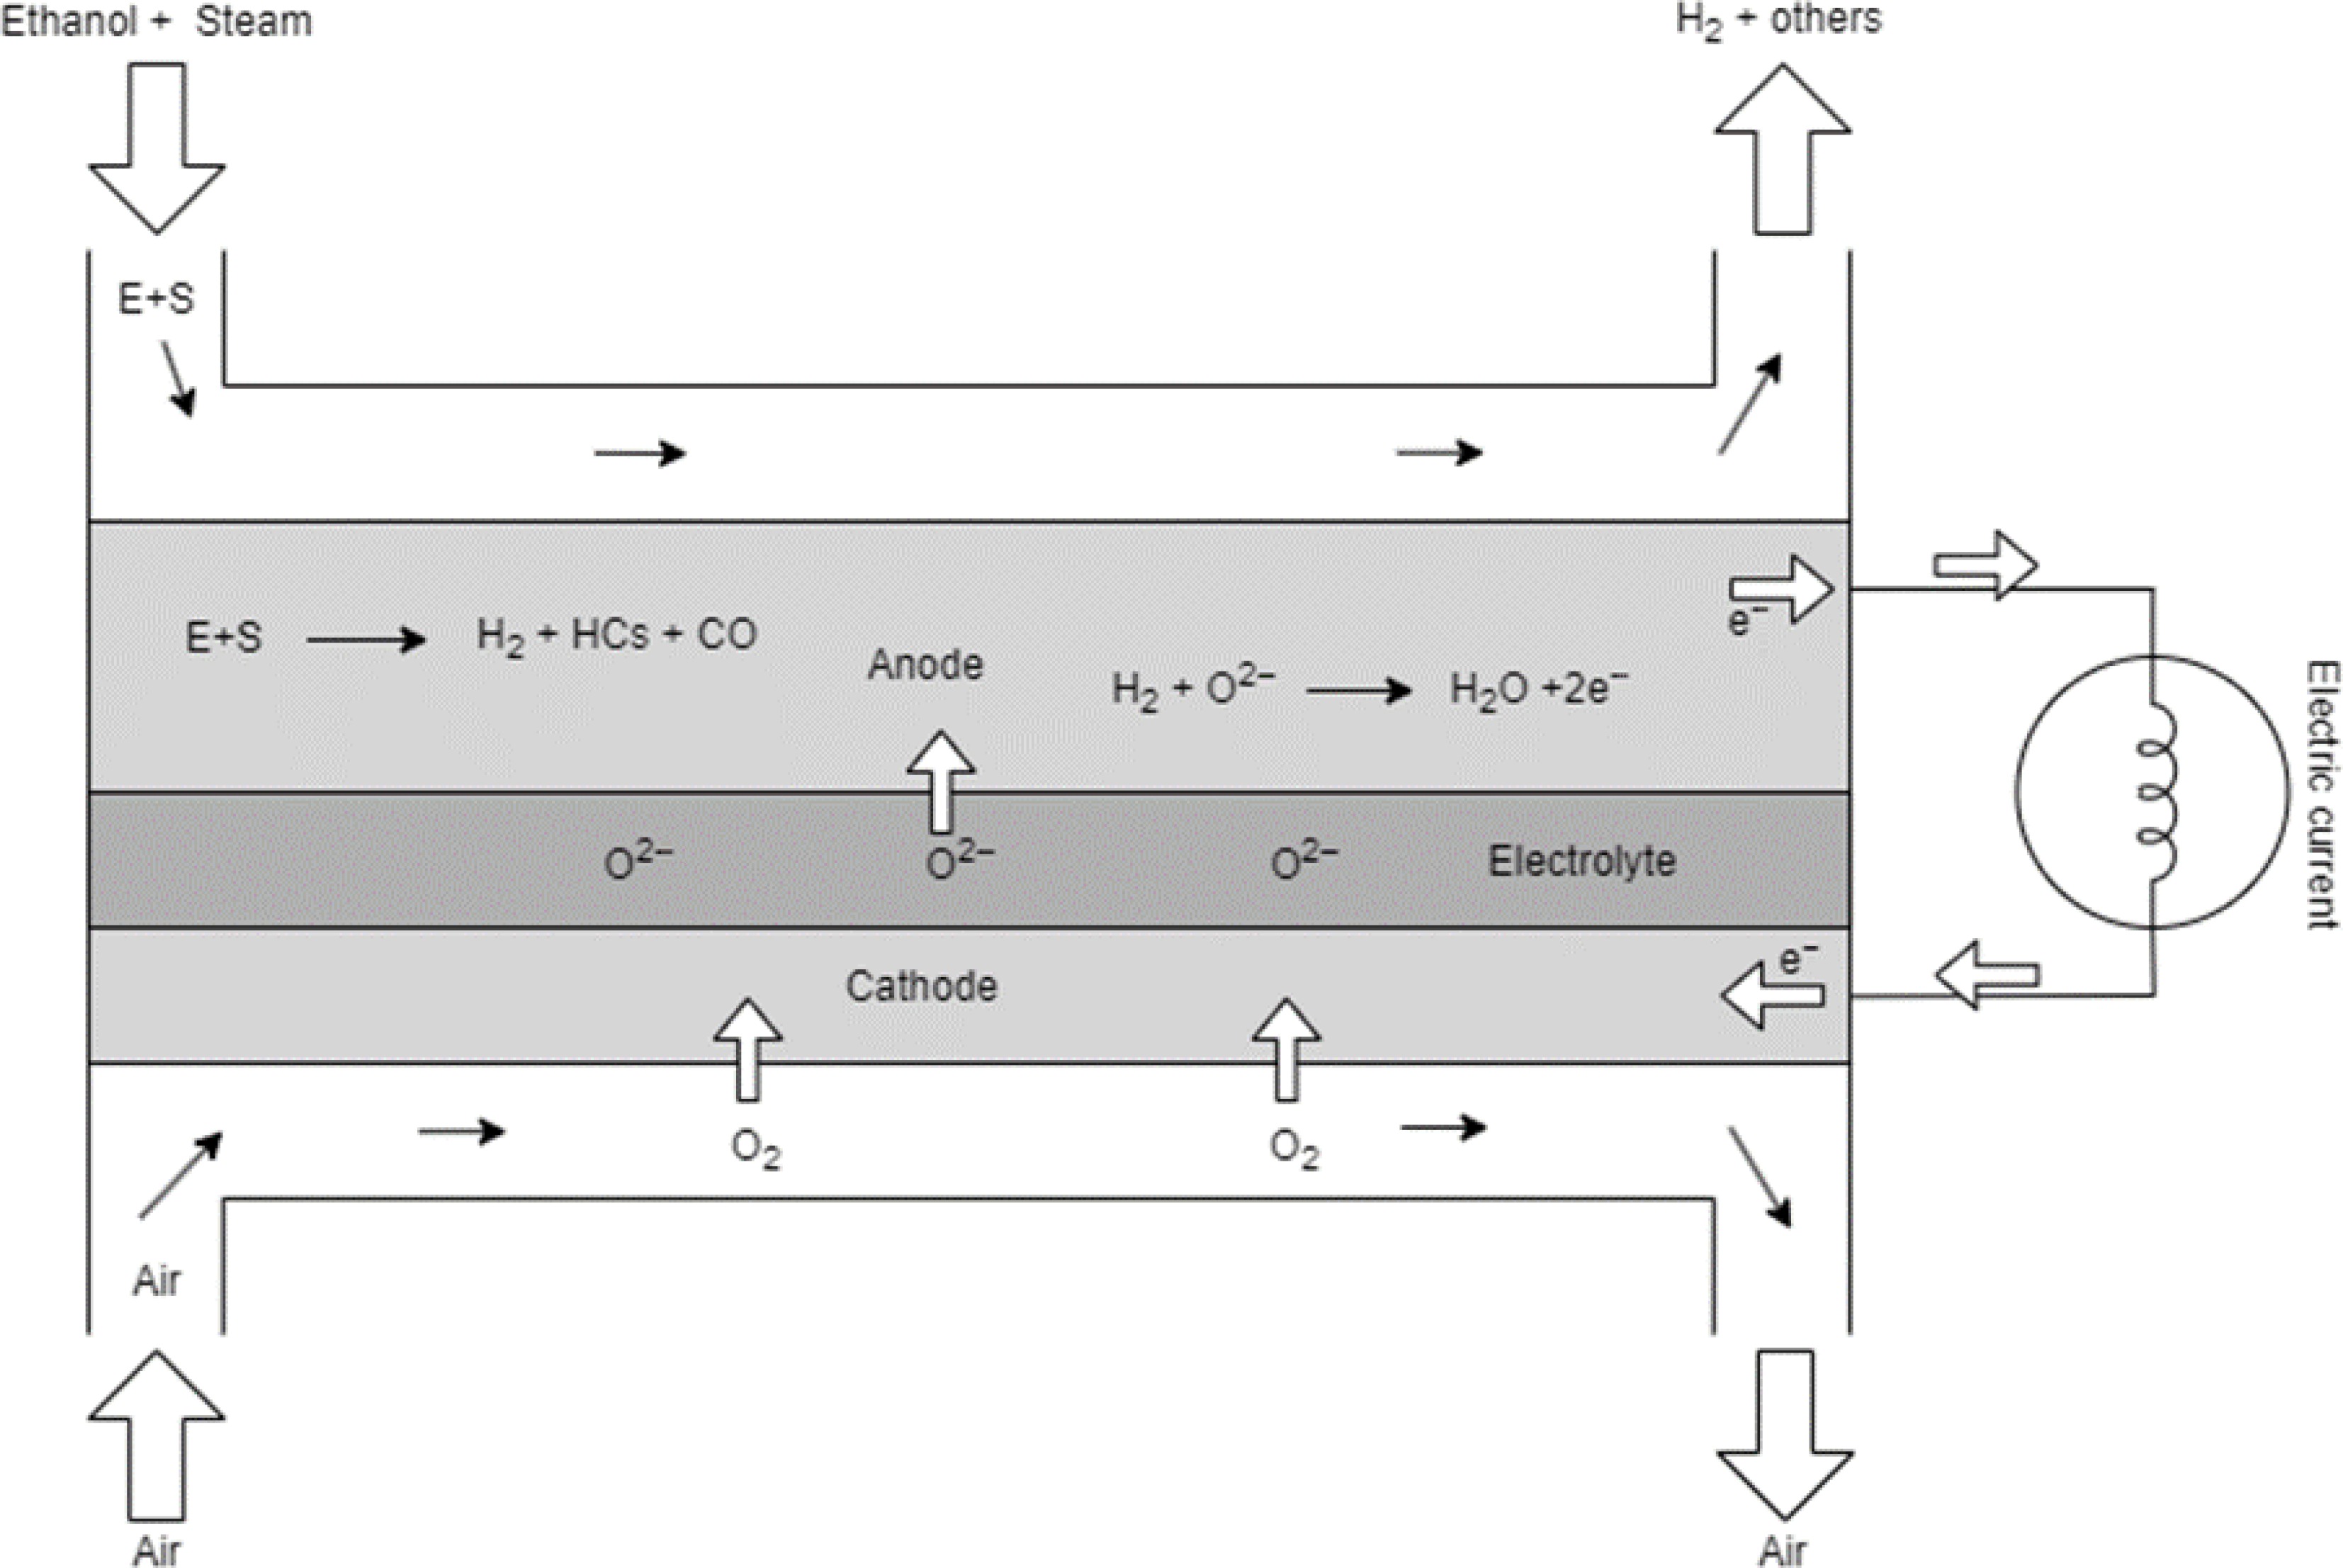
Figure 3.
Schematic diagram of direct reforming ethanol SOFC.
The governing equation of species concentrations in both the anode and cathode channels is given by:
$ \dfrac{\partial {\mathrm{\omega }}_{\mathrm{g},\mathrm{j}}}{\partial \mathrm{t}}=-\mathrm{u}\dfrac{\partial {\mathrm{\omega }}_{\mathrm{g},\mathrm{j}}}{\partial \mathrm{z}}-{\mathrm{k}}_{\mathrm{m}\mathrm{e},\mathrm{j}}{\mathrm{S}}_{\mathrm{f}\mathrm{l}\mathrm{u}\mathrm{x}}\left({\mathrm{\omega }}_{\mathrm{g},\mathrm{j}}-{\left.{\mathrm{\omega }}_{\mathrm{s},\mathrm{j}}\right|}_{\mathrm{y}=0}\right) $ (1) where,
$ {S}_{flux} $ $ {S}_{flux}=\dfrac{{A}_{s}}{{V}_{f}} $ Table 2. Sherwood number as a function of aspect ratio.
Aspect ratio 0.2 0.4 0.7 1.0 2.0 2.5 5.0 10.0 Sh 0.96 1.60 2.26 2.71 3.54 3.78 4.41 4.85 The governing reaction-diffusion equation for species balance in the anode support layer is:
$ \dfrac{\mathrm{d}{\mathrm{\omega }}_{\mathrm{s},\mathrm{j}}}{\mathrm{d}\mathrm{t}}=\dfrac{1}{{\mathrm{\epsilon }}_{\mathrm{s}}{\mathrm{\rho }}_{\mathrm{s}}}\left[{\mathrm{D}}_{\mathrm{s},\mathrm{j}}{\mathrm{\rho }}_{\mathrm{s}}\dfrac{{\partial }^{2}{\mathrm{\omega }}_{\mathrm{s},\mathrm{j}}}{\partial {\mathrm{y}}^{2}}+{\mathrm{R}}_{\mathrm{s},\mathrm{j}}\right]$ (2) with the boundary condition given as:
$ {\left.-{\mathrm{D}}_{\mathrm{s},\mathrm{j}}{\mathrm{\rho }}_{\mathrm{s}}\dfrac{\partial {\mathrm{\omega }}_{\mathrm{s},\mathrm{j}}}{\partial \mathrm{y}}\right|}_{\mathrm{y}=0}={\mathrm{k}}_{\mathrm{m}\mathrm{e},\mathrm{j}}{{\mathrm{\rho }}_{\mathrm{g}}\mathrm{S}}_{\mathrm{f}\mathrm{l}\mathrm{u}\mathrm{x}}\left({\mathrm{\omega }}_{\mathrm{g},\mathrm{j}}-{\left.{\mathrm{\omega }}_{\mathrm{s},\mathrm{j}}\right|}_{\mathrm{y}=0}\right) $ (3) $ {\left.-{\rm D}_{\rm{s,j}}{\rho }_{s}\dfrac{\partial {\omega }_{s,j}}{\partial y}\right|}_{y=\delta }={\rm R}_{\rm{ct}} $ (4) These equations account for the simultaneous diffusion and reactions within the anode support layer and the charge transfer reactions.
$ {R}_{s,j} $ $ j $ $ {V}_{s} $ $ {R}_{ct} $ $ {A}_{CT} $ $ {V}_{s}={A}_{s}{\delta }_{s}{N}_{cells} $ $ {A}_{s} $ $ {A}_{s} $ $ {A}_{CT} $ $ {A}_{CT}={A}_{s}{N}_{cells} $ The effective diffusivities are calculated as follows:
$ {\mathrm{D}}_{\mathrm{s},\mathrm{j}}=\dfrac{\mathrm{\tau }}{{\mathrm{\varepsilon }}_{\mathrm{s}}}{\left(\dfrac{1}{{\mathrm{D}}_{\mathrm{f},\mathrm{j}}}+\dfrac{1}{{\mathrm{D}}_{\mathrm{k}\mathrm{n},\mathrm{j}}}\right)}^{-1} $ (5) $ {\mathrm{D}}_{\mathrm{k}\mathrm{n},\mathrm{j}}=\dfrac{{\mathrm{d}}_{\mathrm{p}}}{3}\sqrt{\dfrac{8\mathrm{R}{\mathrm{T}}_{\mathrm{s}}}{\mathrm{\pi }\mathrm{M}{\mathrm{W}}_{\mathrm{j}}}} $ (6) where,
$ {D}_{f,j} $ $ {D}_{kn,j} $ $ \text{j} $ $ {\varepsilon }_{s} $ $ \text{τ} $ $ {d}_{p} $ Alternatively, the effect of diffusional limitations on voltage output can be considered by an empirical approach as described in later sections. In the limit of negligible diffusional limitation, (Eqn 2) can be integrated along with the boundary conditions to obtain the following form:
$ \dfrac{\mathrm{d}{\mathrm{\omega }}_{\mathrm{s},\mathrm{j}}}{\mathrm{d}\mathrm{t}}=\dfrac{1}{{\mathrm{\varepsilon }}_{\mathrm{s}}{\mathrm{\rho }}_{\mathrm{s}}}\left[{\mathrm{k}}_{\mathrm{m}\mathrm{e},\mathrm{j}}{\mathrm{\rho }}_{\mathrm{g}}\dfrac{{\mathrm{A}}_{\mathrm{f}\mathrm{l}\mathrm{u}\mathrm{x}}}{{\mathrm{V}}_{\mathrm{s}}}\left({\mathrm{\omega }}_{\mathrm{g},\mathrm{j}}-{\mathrm{\omega }}_{\mathrm{s},\mathrm{j}}\right)+{\mathrm{R}}_{\mathrm{s},\mathrm{j}}+{\mathrm{R}}_{\mathrm{C}\mathrm{T}}\dfrac{{\mathrm{A}}_{\mathrm{C}\mathrm{T}}}{{\mathrm{V}}_{\mathrm{S}}}\right] $ (7) Once the species concentration fields are calculated with the above equations following the similar numerical solution approaches reported previously [ 29, 30] for a specified current density, SOFC voltage output is calculated by subtracting different voltage losses from the theoretical reversible cell voltage. It is known that oxidation of both H 2and CO species can contribute to the charge transfer:
$\begin{array}{*{20}{c}} \quad\mathrm{C}\mathrm{O}+1/2\;{\mathrm{O}}_{2}\to {\mathrm{C}\mathrm{O}}_{2}&\rm R4 \\ \quad \mathrm{H}_2+1/2\; \mathrm{O}_2\to\mathrm{H}_2\mathrm{O}& \rm{R}5\end{array}$ However, it is reported that the electrochemical oxidation of H 2 is about 10 times faster than that of CO. As a result, most of the CO is consumed indirectly via water gas shift reaction which converts CO to H 2. Jiang & Virkar [ 31] investigated different ratios of CO/H 2 and reported that even with 55% of CO in the mixture of H 2 and CO, the performance of the cell was only slightly different from pure H 2, since most of the CO undergoes the WGS reaction with the available water. Conversely, when enough water is in the mixture, which is true for the steam reforming of ethanol, charge transfer predominantly occurs via H 2 oxidation reaction. Thus, in this work, the H 2 oxidation reaction only was considered as this considerably simplifies voltage loss calculations.
The output voltage of the SOFC is calculated by subtracting different losses from the theoretical voltage calculated by the Nernst equation:
$ \mathrm{V=V_{Nernst}-\eta_{act,a}-\eta_{act,c}-\eta_{ohmic}-\eta_{conc,a}-\eta_{conc,c}} $ (8) Each term in the above equation is discussed next. Nernst potential is calculated by the Gibbs free energy of formation of species involved in the hydrogen reaction as:
$ {\mathrm{V}}_{\mathrm{N}\mathrm{e}\mathrm{r}\mathrm{n}\mathrm{s}\mathrm{t}}=-\dfrac{{\Delta \mathrm{G}}_{\mathrm{r}\mathrm{x}\mathrm{n}}}{2\mathrm{F}}=-\dfrac{{\Delta \mathrm{G}}_{\mathrm{f},{\mathrm{H}}_{2}\mathrm{O}}-{\Delta \mathrm{G}}_{\mathrm{f},{\mathrm{H}}_{2}}-{0.5\mathrm{ }\mathrm{ }\mathrm{ }\mathrm{ }\mathrm{ }\mathrm{ }\mathrm{ }\mathrm{ }\Delta \mathrm{G}}_{\mathrm{f},{\mathrm{O}}_{2}}}{2\mathrm{F}} $ (9) where,
$ {\Delta G}_{f} $ $ {\Delta \mathrm{G}}_{\mathrm{f}}={\Delta \mathrm{G}}_{\mathrm{f}}^{0}+\mathrm{R}\mathrm{T}\mathrm{l}\mathrm{n}\left(P/P_0\right) $ (10) Substituting the above equation in Eqn 9 gives the Nernst equation in terms of partial pressures of species:
$ {\mathrm{V}}_{\mathrm{N}\mathrm{e}\mathrm{r}\mathrm{n}\mathrm{s}\mathrm{t}}={\mathrm{E}}^{0}-\dfrac{\mathrm{R}\mathrm{T}}{2\mathrm{F}}\mathrm{l}\mathrm{n}\left(\dfrac{{\mathrm{P}}_{{\mathrm{H}}_{2}\mathrm{O}}}{{\mathrm{P}}_{{\mathrm{H}}_{2}}{\mathrm{P}}_{{\mathrm{O}}_{2}}^{1/2}}\right) $ (11) Activation loss,
$ {\eta }_{act} $ $ \mathrm{i}={\mathrm{i}}_{0}\left[\mathrm{e}\mathrm{x}\mathrm{p}\left(\dfrac{\mathrm{\alpha }\mathrm{F}{\mathrm{\eta }}_{\mathrm{a}\mathrm{c}\mathrm{t}}}{\mathrm{R}\mathrm{T}}\right)-\mathrm{e}\mathrm{x}\mathrm{p}\left(\dfrac{-\left(1-\mathrm{\alpha }\right)\mathrm{F}{\mathrm{\eta }}_{\mathrm{a}\mathrm{c}\mathrm{t}}}{\mathrm{R}\mathrm{T}}\right)\right] $ (12) where,
$ i $ $ {i}_{0} $ $ \alpha $ $ {\mathrm{i}}_{0}^{\mathrm{a}\mathrm{n}}={\mathrm{\gamma }}^{\mathrm{a}\mathrm{n}}{\left(\dfrac{{\mathrm{p}}_{{\mathrm{H}}_{2}}^{\mathrm{*}}}{{\mathrm{p}}_{\mathrm{r}\mathrm{e}\mathrm{f}}}\right)}^{\mathrm{a}}{\left(\dfrac{{\mathrm{p}}_{{\mathrm{H}}_{2}\mathrm{O}}^{\mathrm{*}}}{{\mathrm{p}}_{\mathrm{r}\mathrm{e}\mathrm{f}}}\right)}^{\mathrm{b}}\mathrm{exp}\left[-\dfrac{{\mathrm{E}}_{\mathrm{a}}^{\mathrm{a}\mathrm{n}}}{\mathrm{R}\mathrm{T}}\right] $ (13) $ {\mathrm{i}}_{0}^{\mathrm{c}\mathrm{a}}={\mathrm{\gamma }}^{\mathrm{c}\mathrm{a}}{\left(\dfrac{{\mathrm{p}}_{{\mathrm{O}}_{2}}^{\mathrm{*}}}{{\mathrm{p}}_{\mathrm{r}\mathrm{e}\mathrm{f}}}\right)}^{\mathrm{c}}\mathrm{exp}\left[-\dfrac{{\mathrm{E}}_{\mathrm{a}}^{\mathrm{c}\mathrm{a}}}{\mathrm{R}\mathrm{T}}\right] $ (14) Voltage losses due to concentration polarization are implicitly accounted for when the full reaction-diffusion equation is solved, whereas they need to be explicitly calculated when the simplified equation given by (Eqn 7) is used in the support layer. The following function is widely used to calculate the concentration polarization,
$ \mathrm{V}_{\mathrm{m}\mathrm{t}}=\mathrm{ }-\mathrm{C}\mathrm{\ \times\ }\mathrm{ln}\left(1-\dfrac{\mathrm{i}}{\mathrm{i}_{\mathrm{l}}}\right) $ (15) where, C represents the mass transport loss coefficient and i l is the limiting current density. They are related to physical variables as:
$ \mathrm{C}=\dfrac{\mathrm{R}\mathrm{T}}{\mathrm{n}\mathrm{F}}\left(1+\dfrac{1}{\mathrm{\alpha }}\right) $ (16) $ {\mathrm{i}}_{\mathrm{l}}=\dfrac{{\mathrm{C}}_{\mathrm{b}}{\mathrm{D}}_{\mathrm{e}}}{\mathrm{\delta }} $ (17) However, it is known that the theoretical limiting current density calculated using the above relations yields much higher current densities than the measured values as the additional resistances such as surface diffusion of adsorbed species on the catalysts can contribute to the voltage loss. Surface diffusion is a highly localized phenomenon, and it is difficult to separate it from kinetics resistance. Considering this, C and
$ {i}_{l} $ Ohmic losses are calculated as:
$ \mathrm{\eta}_{\mathrm{o}\mathrm{h}\mathrm{m}\mathrm{i}\mathrm{c}}=\mathrm{i}\mathrm{\ \times\ }\mathrm{A}\mathrm{S}\mathrm{R} $ (18) where, ASR represents the area species Ohmic resistance, which predominantly depends on the conductivity of the electrolyte. Conduction of oxygen ions in the YSZ electrolyte takes place via the hopping mechanism and is an activated process with an activation temperature of about 10,300 K (activation energy of about 85 kJ/mol) [ 32] . Conductivity is evaluated by using an Arrhenius expression as:
$ \mathrm{\sigma }={\mathrm{\sigma }}_{0}\mathrm{exp}\left[-\dfrac{10300}{\mathrm{T}}\right] $ (19) $ \mathrm{A}\mathrm{S}\mathrm{R}=\dfrac{\mathrm{l}}{\mathrm{\sigma}} $ (20) -
In this section the results from several exploratory simulations carried out are presented and discussed with the aim of analyzing the effect of different operating conditions on the internal reforming and voltage performance. The reaction mechanism calibrated in the previous section is used in SOFC direct internal reforming model without any changes. Fuel cell performance related parameters, such as activation losses, ohmic resistance, and mass transfer losses, are calibrated to match the ethanol reforming results reported by López et al [ 19] . Figure 4 shows the comparison between the model and measurements for the voltage and power density. The polarization curve shows characteristics typical for a high-temperature SOFC: negligible activation losses but dominating ohmic losses due to oxygen ion conduction in the electrolyte.
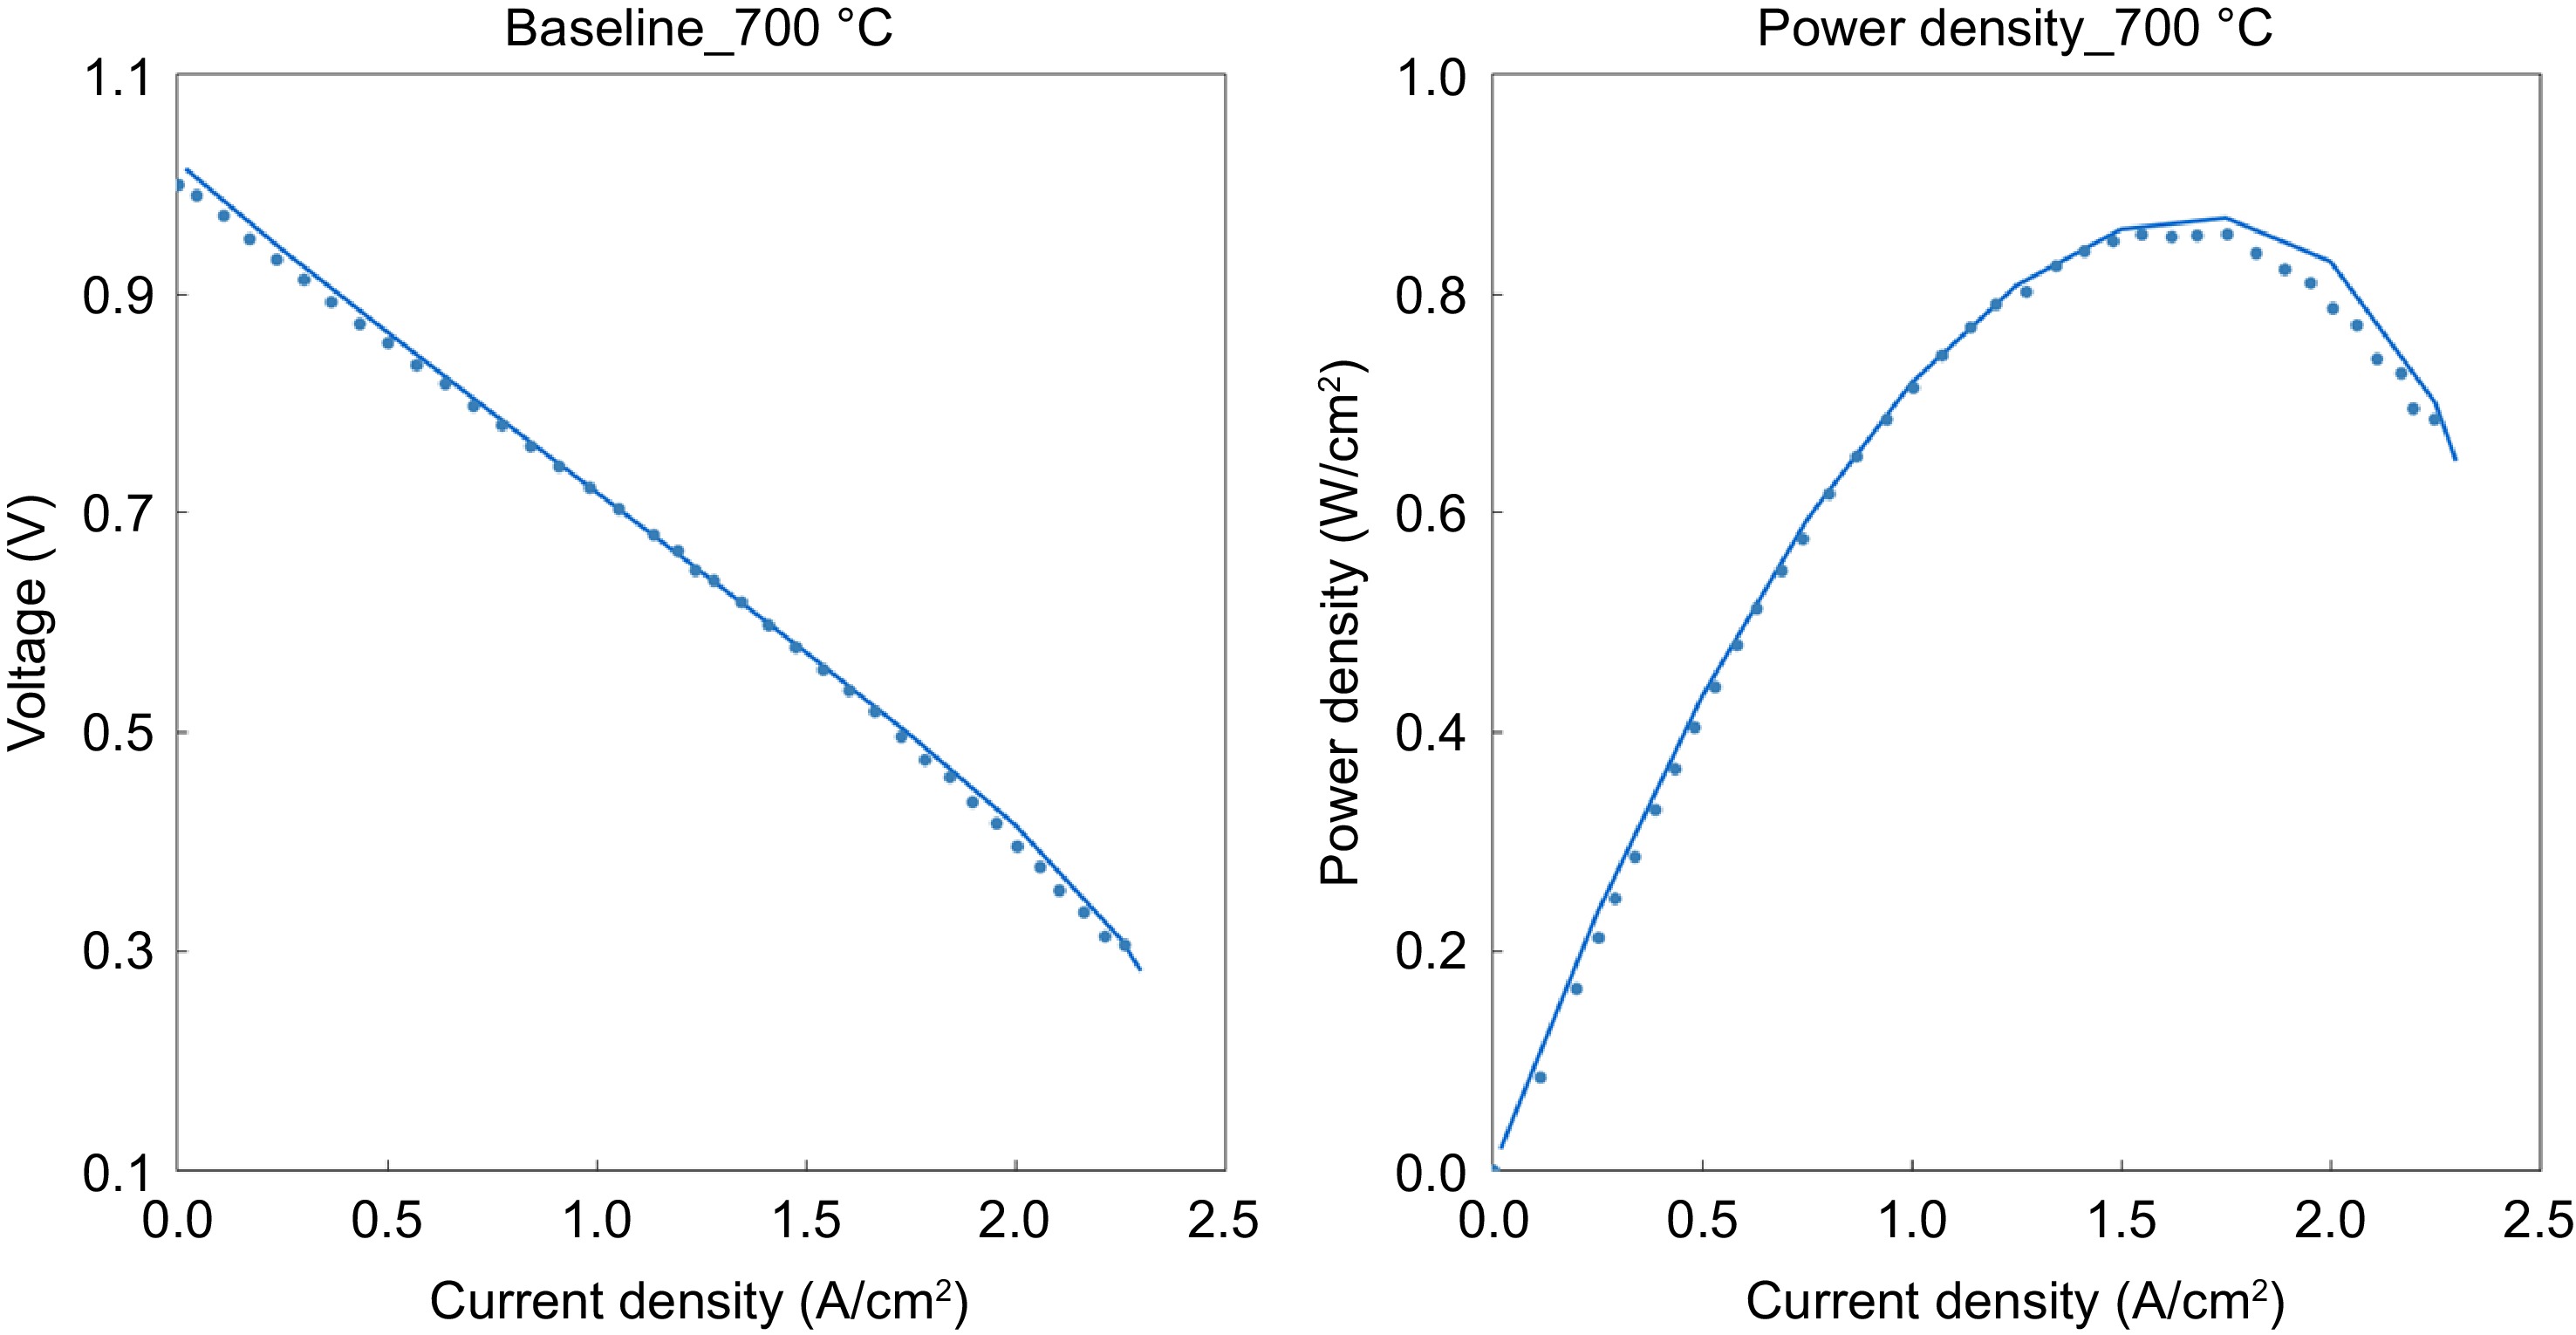
Figure 4.
The polarization curves of the fuel cell (lines represent the model results and the dots represent data from Dogdibegovic et al.) [ 26] .
Figure 5 shows the effect of operating temperature on the polarization curve. Hydrogen yield is higher at high temperatures. Nernst voltage is lower at high temperatures and hence voltage is lower for high temperatures at very low current densities (< 0.1 A/cm 2). At higher current densities (> 0.1 A/cm 2), high temperature leads to better performance due to lower activation and ohmic losses. It can be seen that performance improvement at high temperatures is primarily due to a large reduction in ohmic resistance.
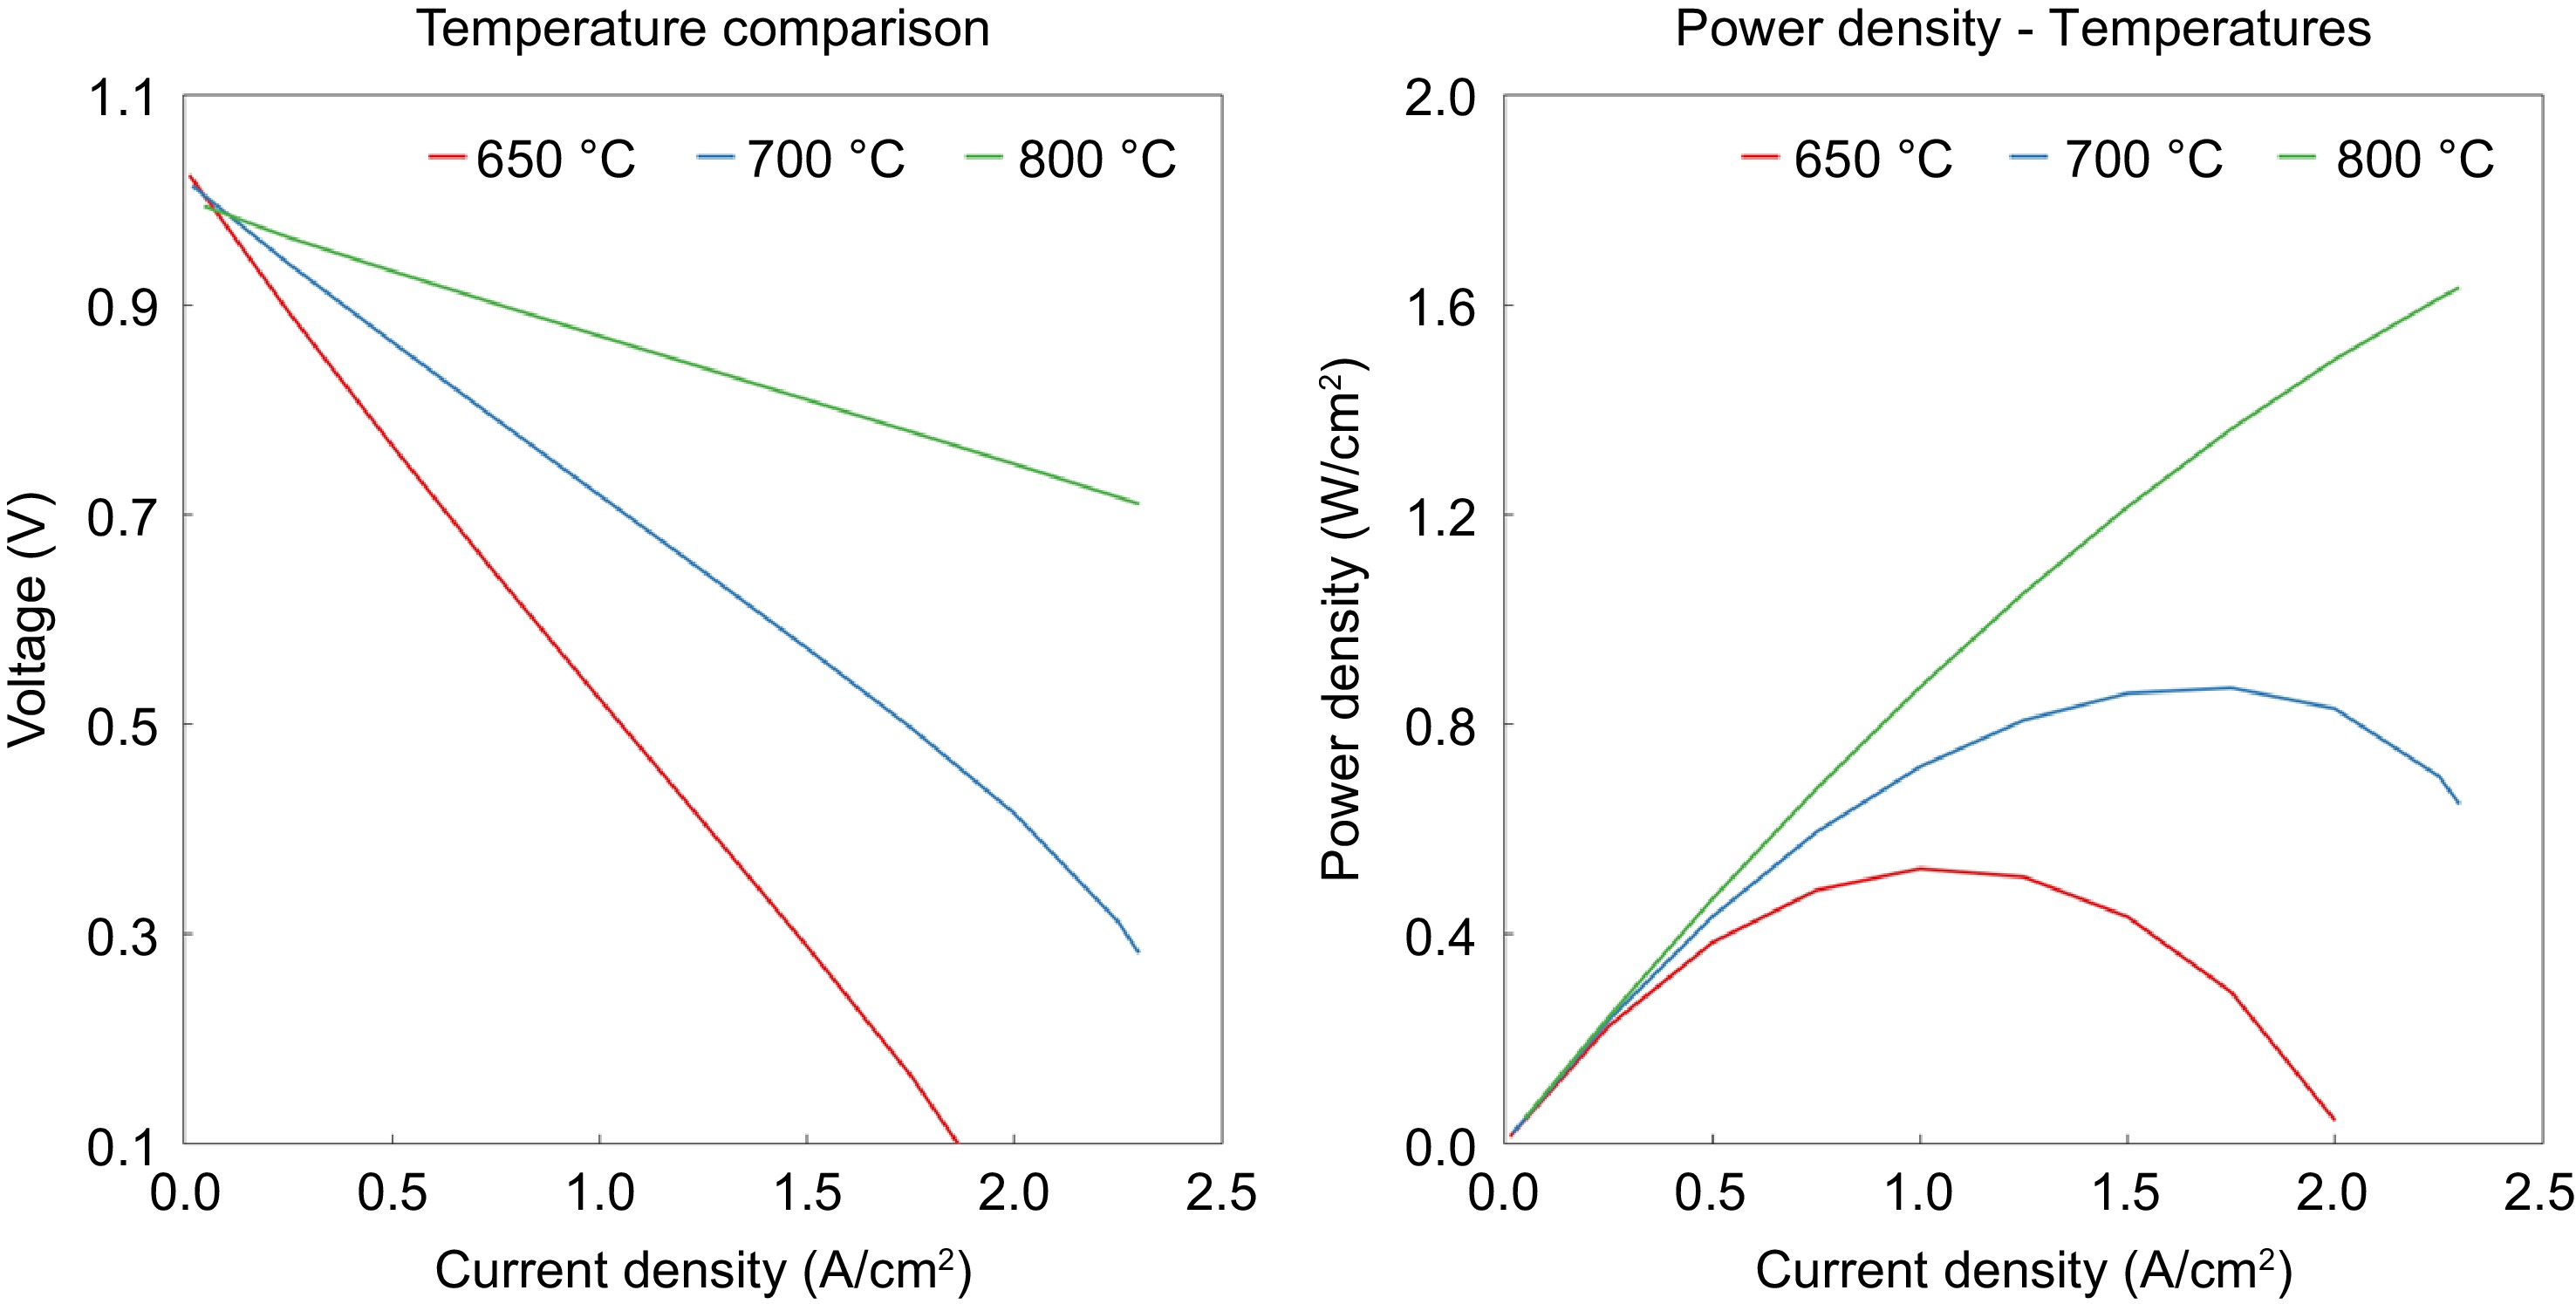
Figure 5.
Effect of current density on both the voltage and power density at 650 °C, 700 °C, and 800 °C.
The effect of current density on species mole fraction at the anode outlet for 700 °C is presented in Fig. 6. Hydrogen fraction reduced linearly with current density as expected due to the Faradaic relationship which relates to molar consumption of H 2 flux to be linearly related to the current density. As H 2 is consumed, CO fraction reduces, and CO 2 fraction increases because the water gas shift reaction converts CO to H 2 and CO 2. Meanwhile, CH 4 concentration remains almost the same because reaction 3 doesn't take place significantly at this temperature.
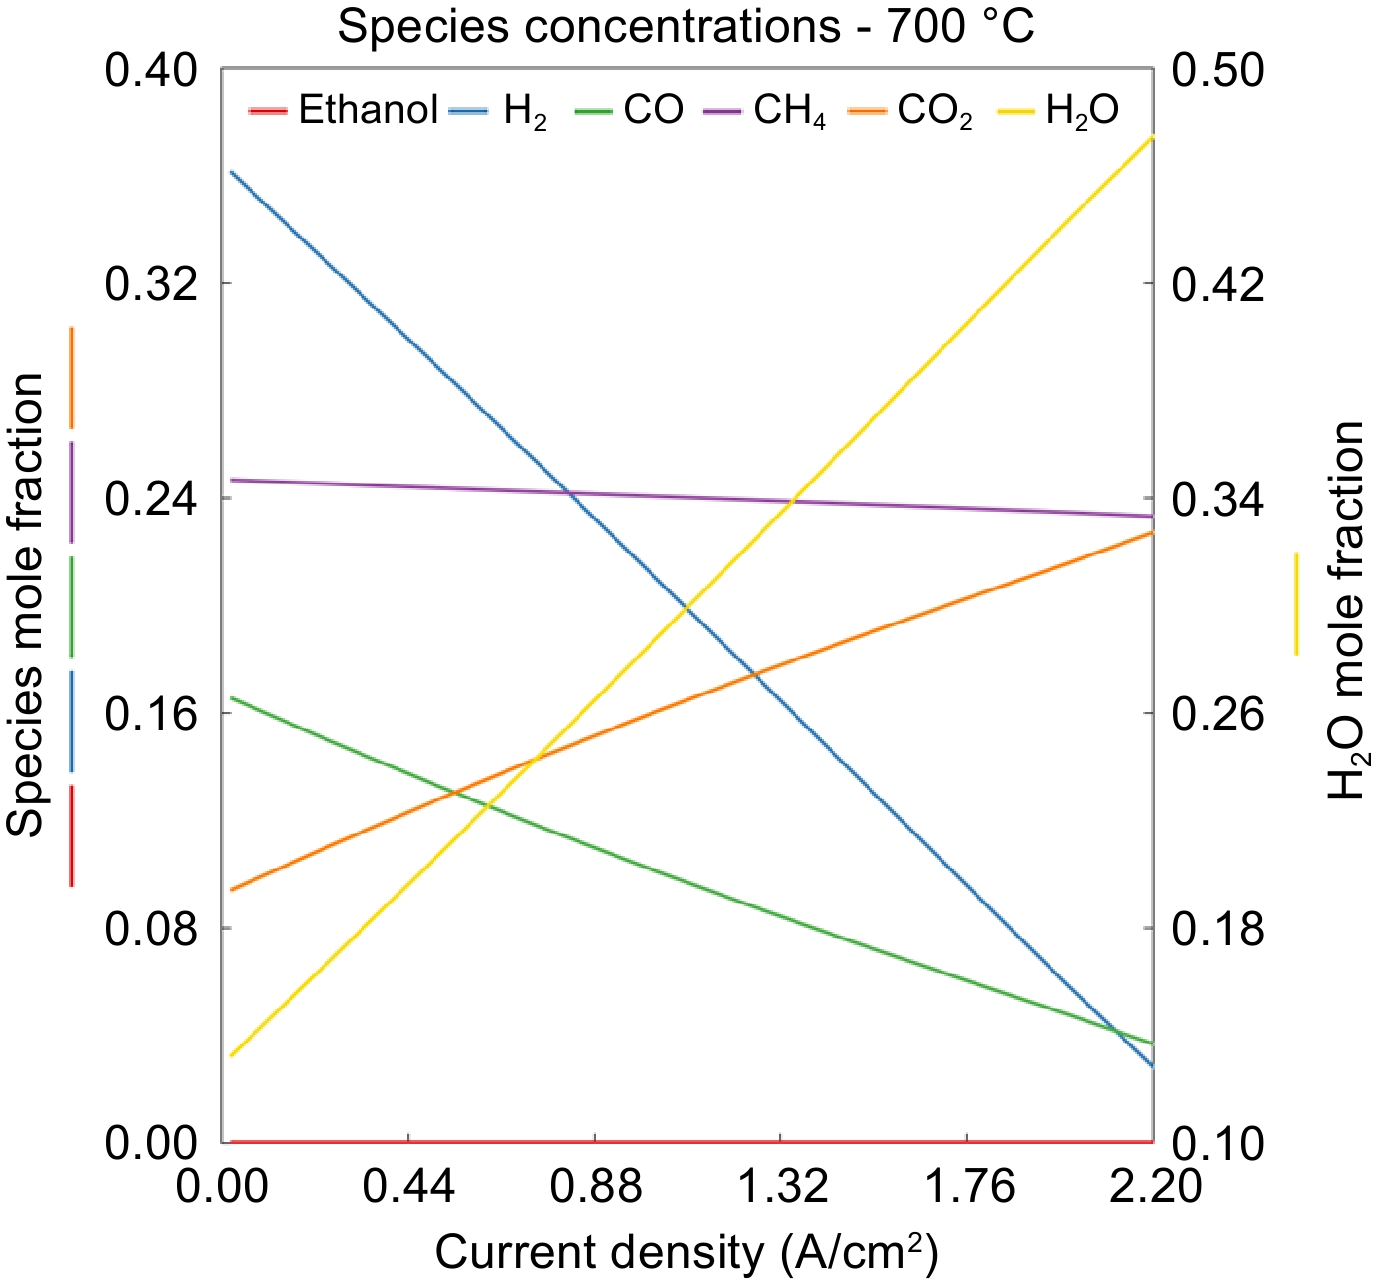
Figure 6.
Effect of current density on the species mole fraction for the 700 °C case.
The current density and thermodynamic voltage potential across the fuel cell are presented in Fig. 7. It can be observed that the current density and voltage increase up to 0.25 (25% of the volume) and then start to decrease for 700 °C and slightly earlier for 800 °C. This is mainly because, unlike the fuel cells running with hydrogen, there is no hydrogen present at the entrance of the anode side of the fuel cell. The initial increase in the 25% is due to the reformation of ethanol to produce H 2, which is then oxidized in the anode to meet the current demand. This phenomenon is evident in the molar fraction of species across the length of the fuel cell, as depicted in Fig. 8. The molar fraction of ethanol decreases significantly up to 0.3 due to decomposition reactions, resulting in the production of CH 4, CO, and H 2. Subsequently, the water-gas shift (WGS) reaction and methane steam reforming (MSR) reactions come into play, utilizing available steam to generate more H 2 along with CO and CO 2. This trend is clearly illustrated in Fig. 8, where H 2, CO, and CO 2 consistently increase up to 0.25. Beyond this point, most of the ethanol has already decomposed, causing a decline in H 2 production from ethanol. Additionally, H 2 is continuously oxidized to produce H 2O and power output, resulting in an overall decrease in H 2 and an increase in H 2O. CO exhibits a similar trend as H 2, as the WGS reaction progresses in the forward direction due to the electrochemical oxidation depleting H 2.
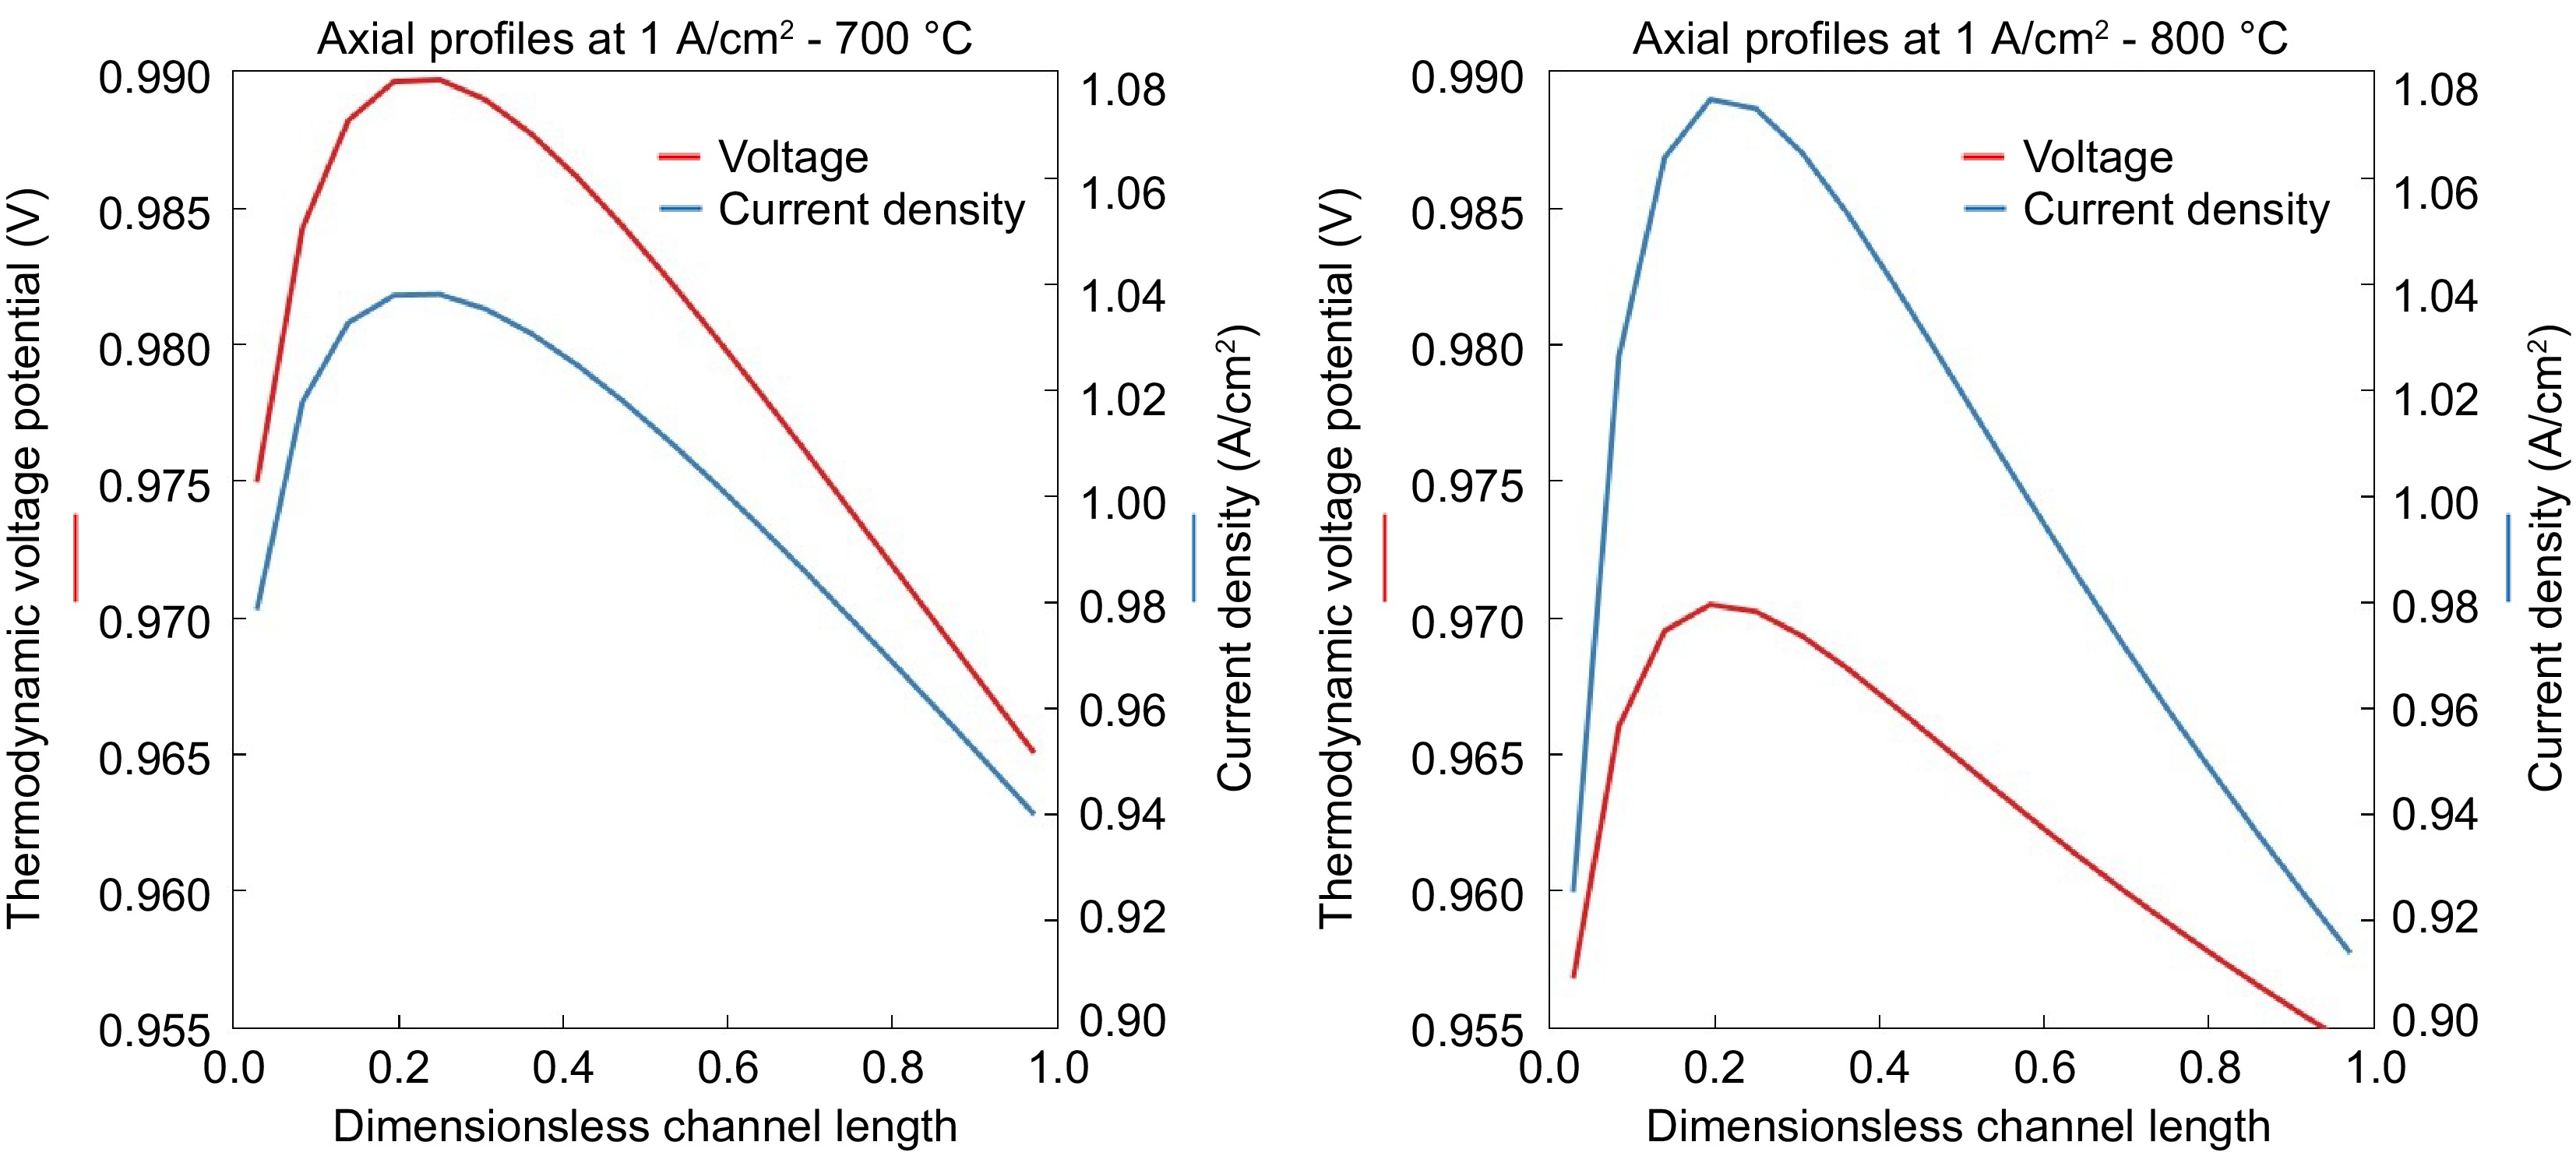
Figure 7.
Current density and thermodynamic voltage potential along the axis of SOFC at the operating temperatures of (a) 700 °C and (b) 800 °C.
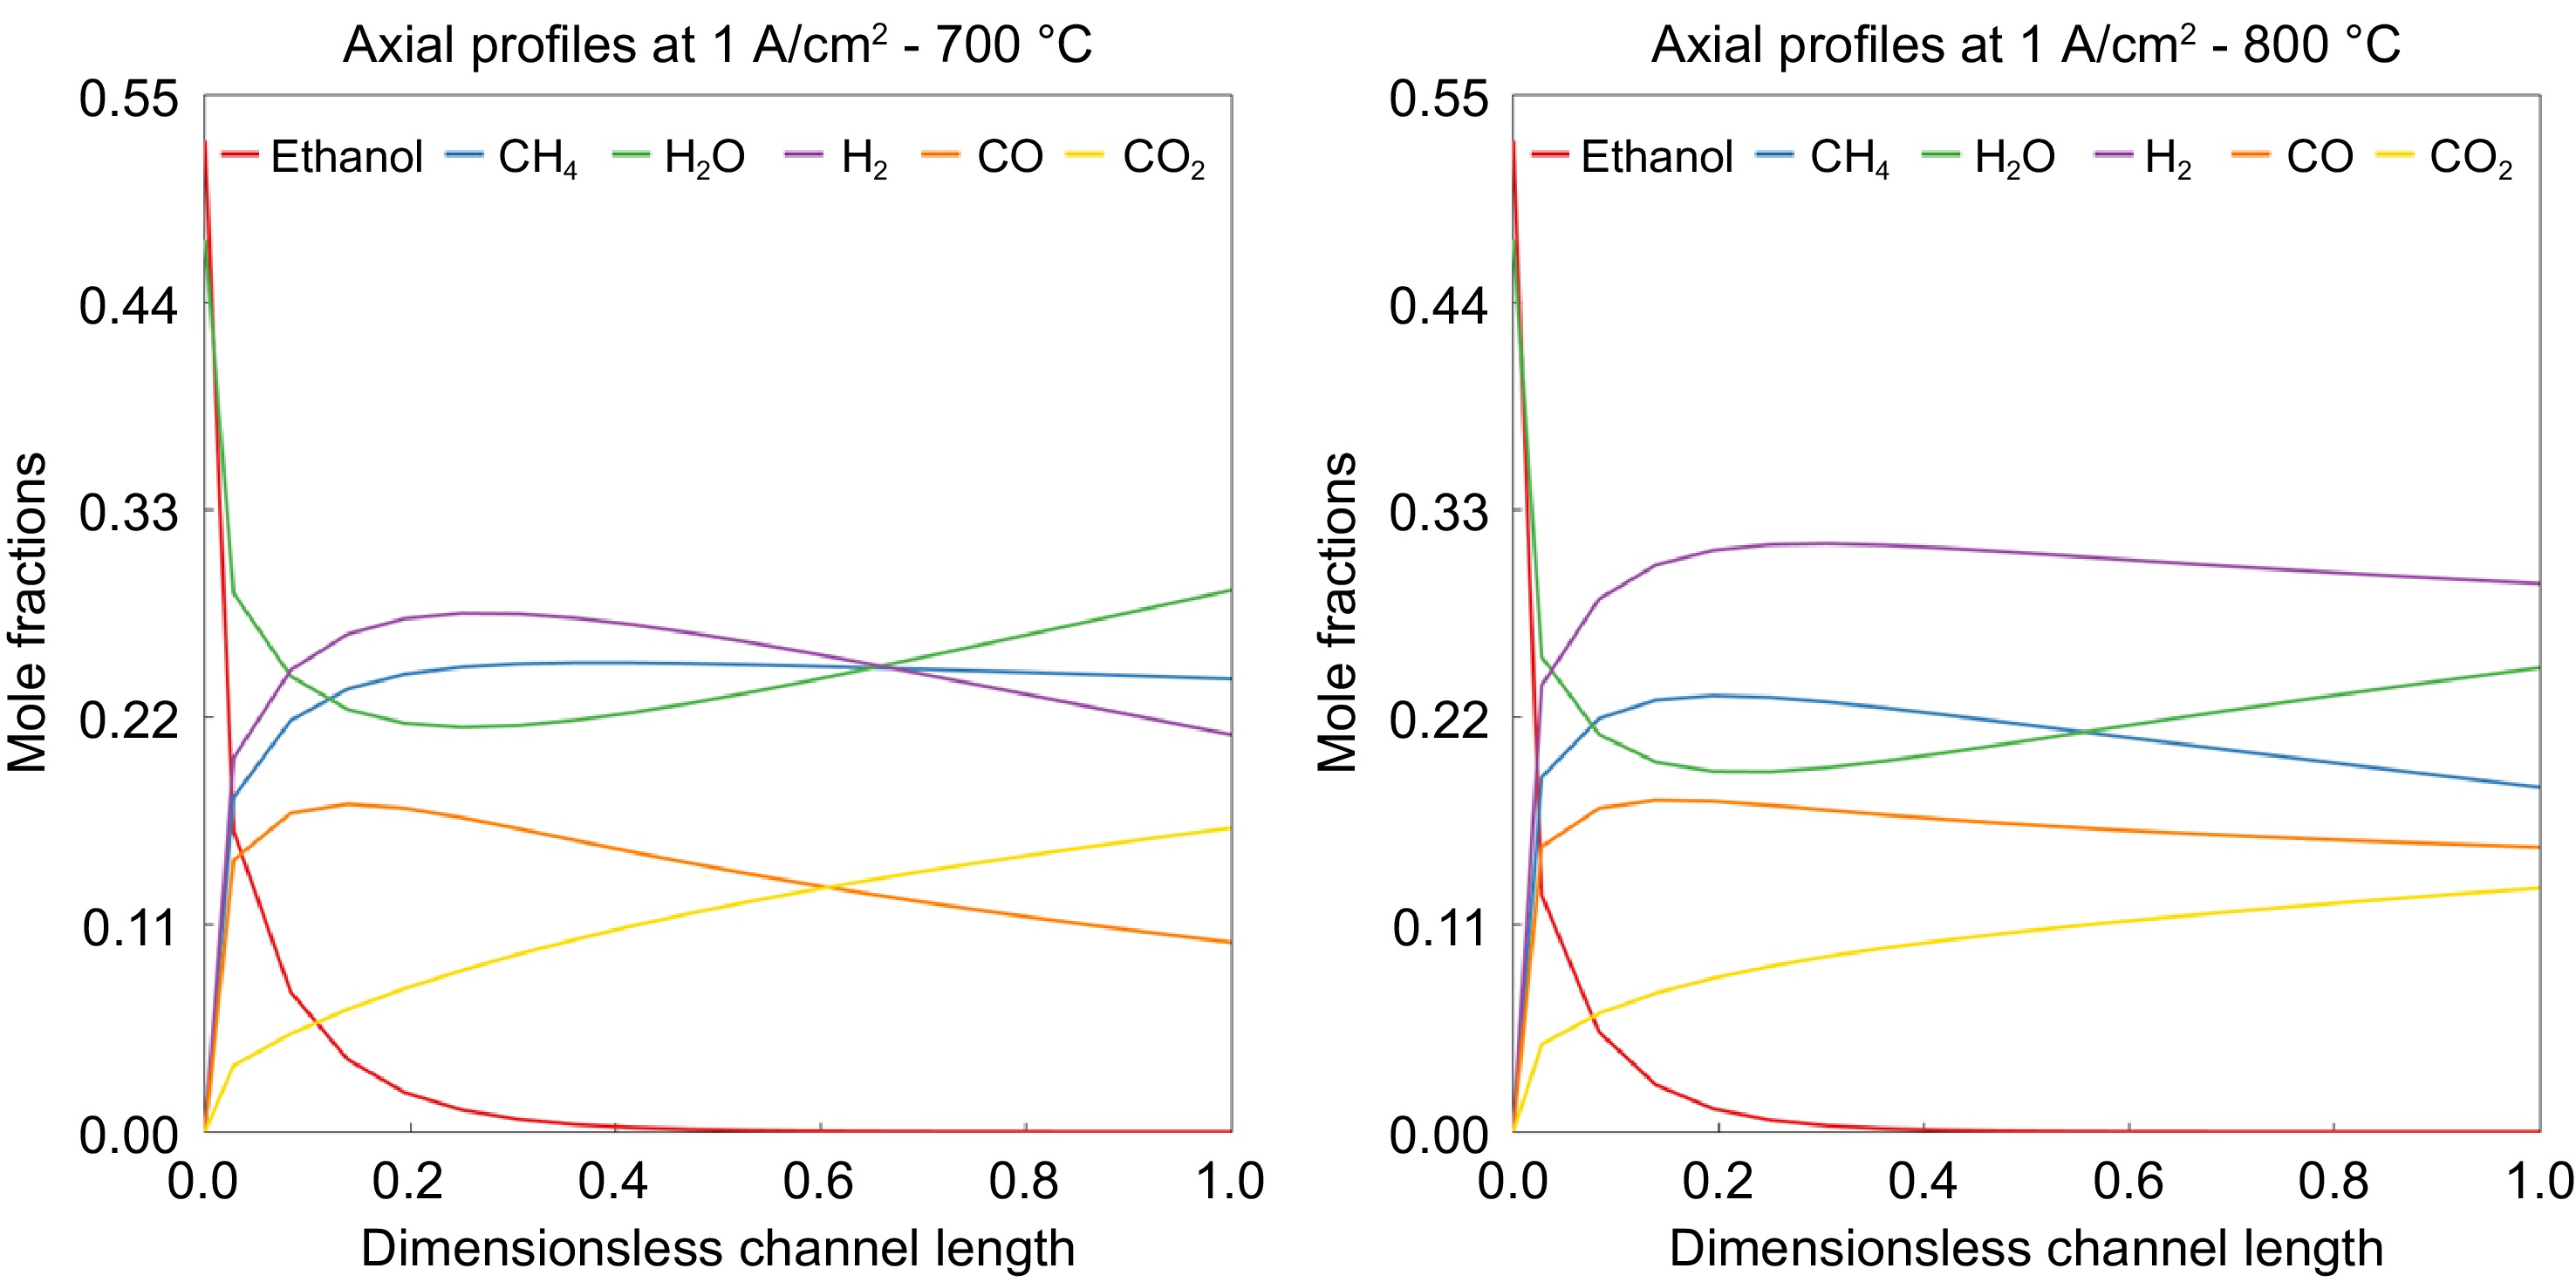
Figure 8.
Mole fractions of species along the axis of SOFC at the operating temperatures of (a) 700 °C and (b) 800 °C.
When comparing the CH 4 concentration at temperatures of 700 °C, and 800 °C, it can be observed that its concentration remains constant along the length after initial production at the lower temperature, while some methane is converted to CO through SMR reaction at higher temperatures.
-
In the increasing demand for clean energy, the importance of solid oxide fuel cells (SOFCs) lies in their high efficiency and fuel flexibility. The two-stage process of reforming hydrocarbon fuels to hydrogen and then to power with water as a by-product, is a key aspect of SOFCs. The present work involves the development of an SOFC model with direct internal reforming based on a validated reformer model. Through detailed investigation, it is concluded that with the increasing operating temperature, the reaction rates of ethanol decomposition and WGS reactions increase exponentially around 600 K, while methane steam reforming shows an exponential increase after approximately 850 K. Species concentration profiles along the channel length confirm that ethanol decomposition occurs near the front and H 2 yield increases along the reactor length due to water gas shift and methane steam reforming reactions. The polarization curve demonstrates that higher temperatures result in increased hydrogen yield, higher Nernst voltage, and improved performance at higher current densities primarily due to reduced ohmic resistance. With increasing current density at fixed feed flow rate, hydrogen, and CO fractions decrease, while CO 2 fraction increases due to the water gas shift reaction. In contrast, the CH 4 concentration remains relatively unchanged at the given temperature due to the slow methane reforming reaction.
-
The authors confirm contribution to the paper as follows: study conception and design: Sarkar B, Gundlapally S; analysis and interpretation of results: Hariharan D, Gundlapally S; draft manuscript preparation: Hariharan D, Gundlapally S. All authors reviewed the results and approved the final version of the manuscript.
-
The datasets generated during and/or analyzed during the current study are available from the corresponding author on reasonable request.
-
The authors declare that they have no conflict of interest.
- Copyright: © 2024 by the author(s). Published by Maximum Academic Press on behalf of Nanjing Tech University. This article is an open access article distributed under Creative Commons Attribution License (CC BY 4.0), visit https://creativecommons.org/licenses/by/4.0/.
-
About this article
Cite this article
Hariharan D, Sarkar B, Gundlapally S. 2024. Modeling and analysis of direct internal reforming in ethanol-fueled SOFC. Emergency Management Science and Technology 4: e016 doi: 10.48130/emst-0024-0017 

Modeling and analysis of direct internal reforming in ethanol-fueled SOFC
- Received: 30 April 2024
- Revised: 24 June 2024
- Accepted: 15 July 2024
- Published online: 13 August 2024
Abstract: Solid oxide fuel cells (SOFCs), in which the chemical energy of the fuel is directly converted to electrical energy, offer a compelling alternative to combustion-based power technologies due to their fuel flexibility, high efficiency, and low emissions, especially when coupled with combined heat and power (CHP) systems. SOFCs hold significant promise due to their potential to serve as distributed power sources and as reliable backup solutions during primary power disruptions. Among the various configurations of SOFC systems, those employing direct internal reforming stand out. This approach involves the in-situ conversion of hydrocarbon fuels like methane and diesel into hydrogen inside an SOFC device, which is subsequently electrochemically oxidized to generate power. This method offers distinct advantages over other configurations. In this study, a newly developed model is introduced that is specifically tailored for SOFCs with direct internal reforming of ethanol. By comparing the model's predictions with experimental data, its accuracy and reliability was validated. Additionally, a comprehensive analysis of polarization curves under varying operating conditions were conducted, examining factors such as hydrogen yield and species distribution along the channel length. This investigation enhanced our understanding of the internal reactions within SOFCs, providing valuable insights for optimizing their technology.
-
Key words:
- SOFC model /
- Ethanol /
- Hydrogen /
- Direct Internal Reforming