-
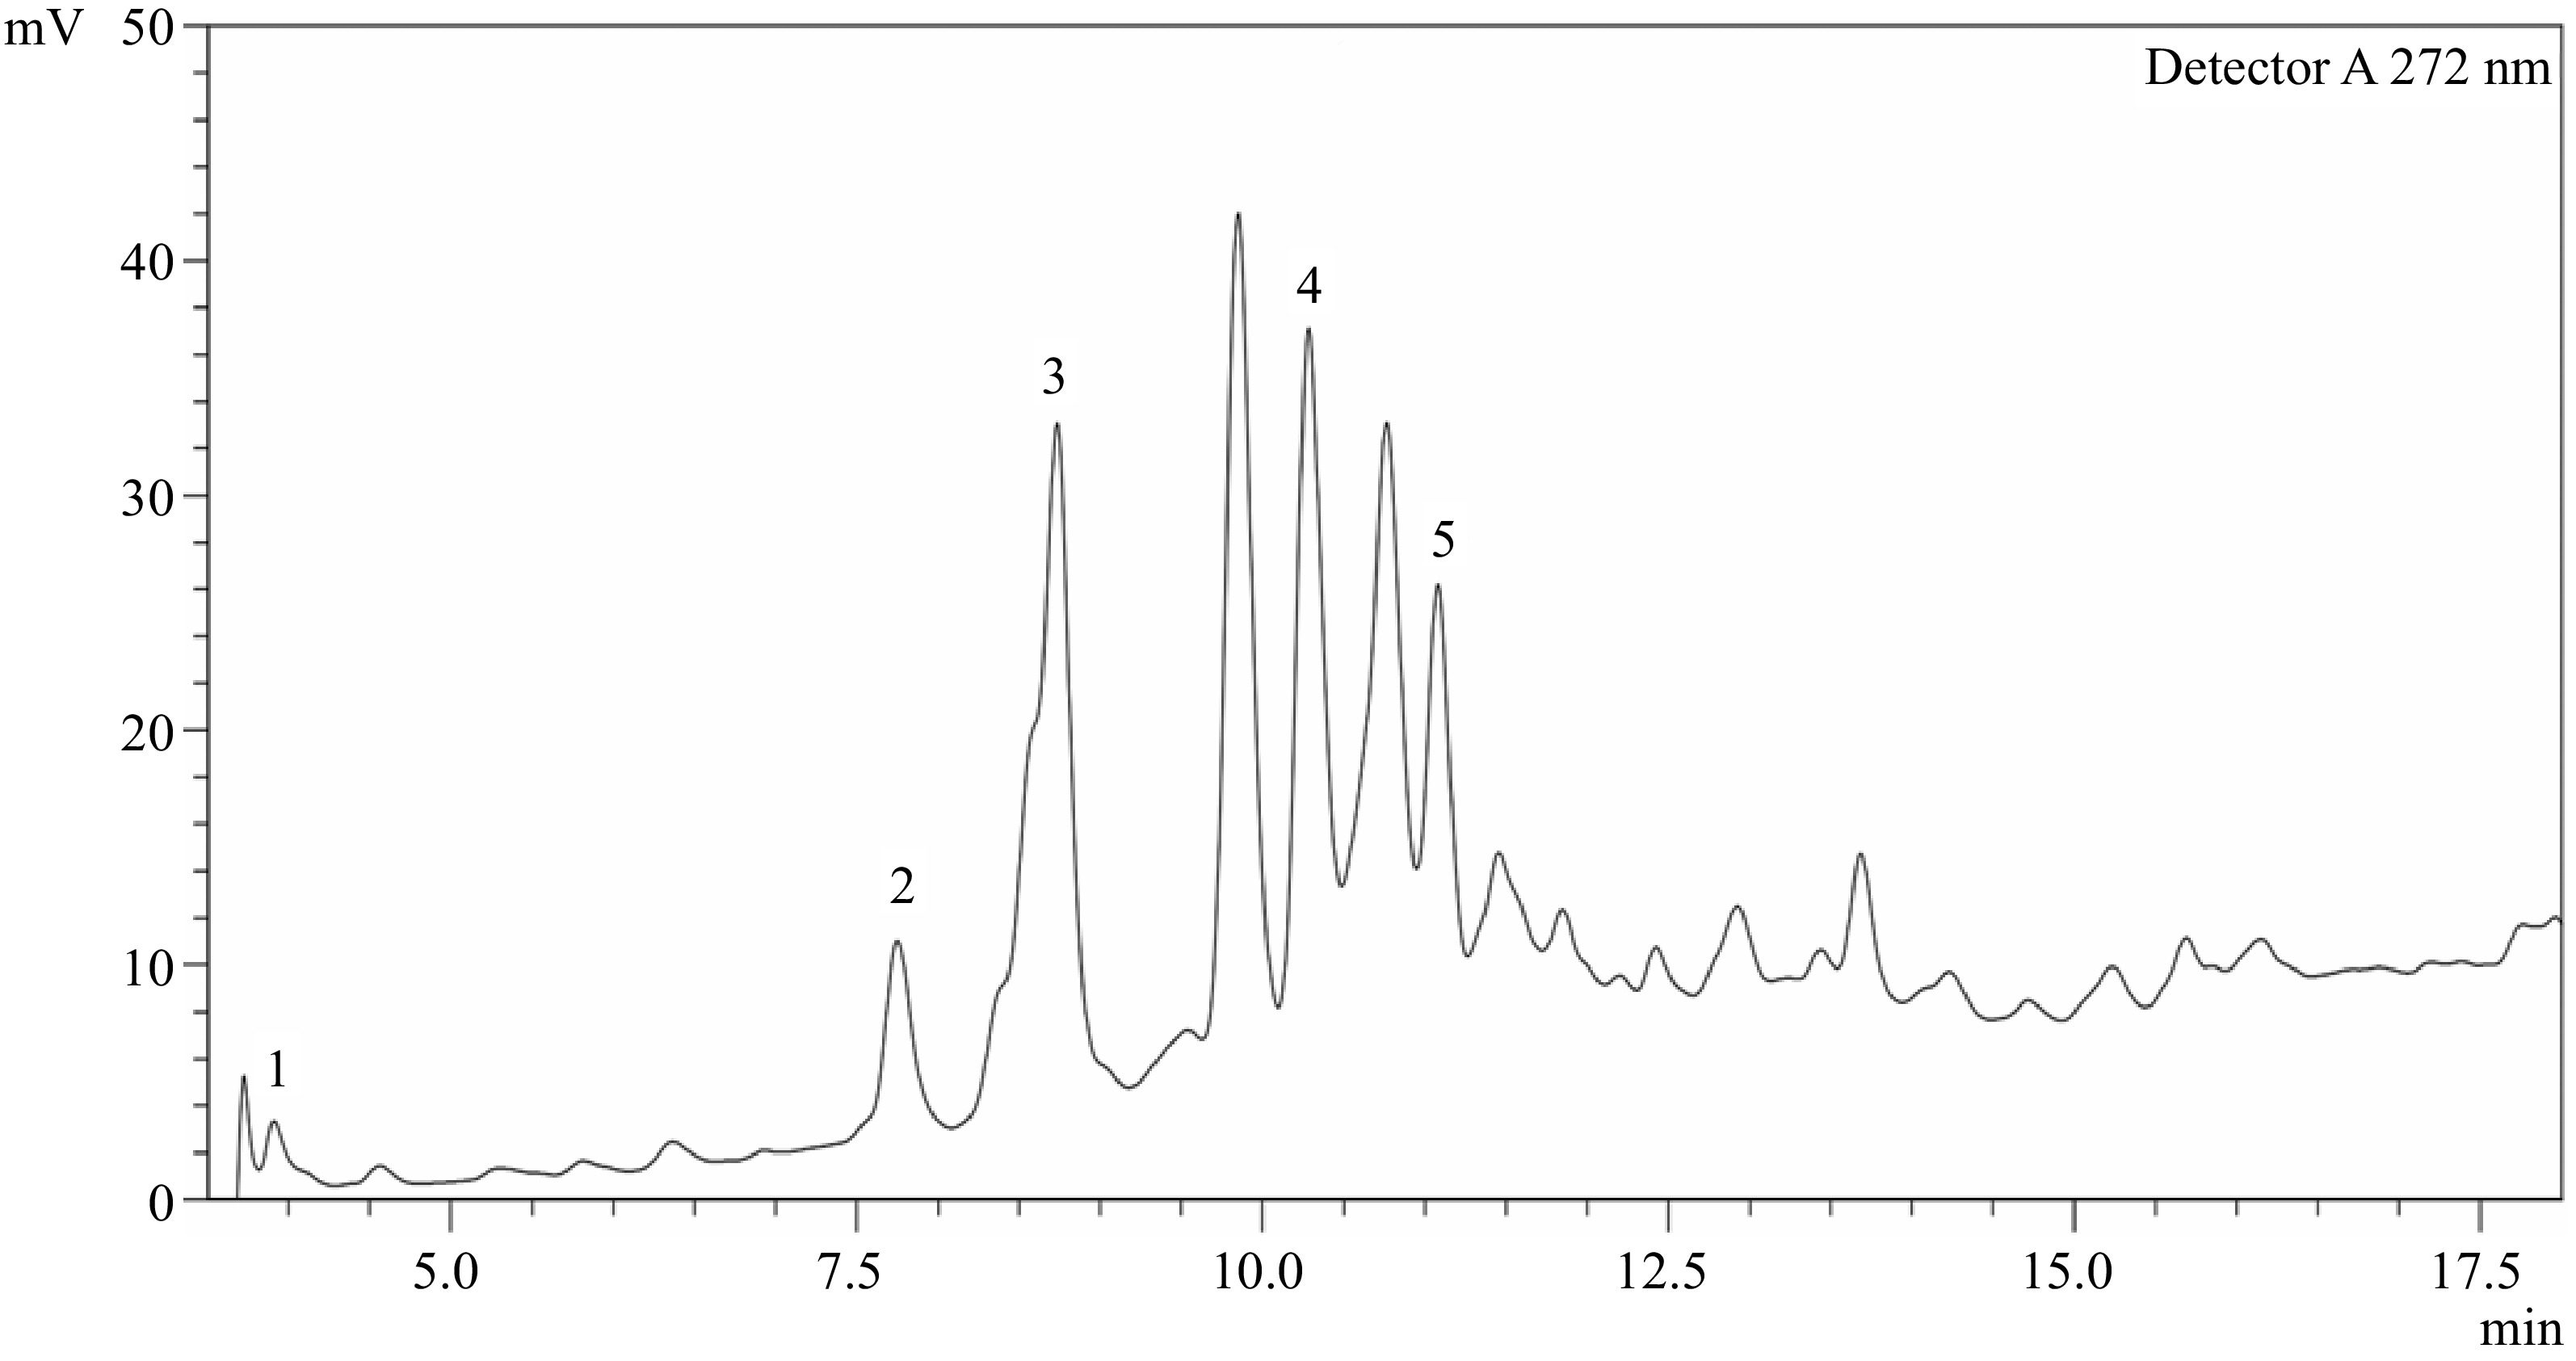
Figure 1.
HPLC chromatogram of phenolic acids present in desugared sugarcane extract. Peaks identified: 1 − Gallic acid; 2 − p-Hydroxybenzoic acid; 3 − Vanillic acid; 4 − p-Coumaric acid; 5 − Sinapic acid. Peaks with no label are unknown.
-
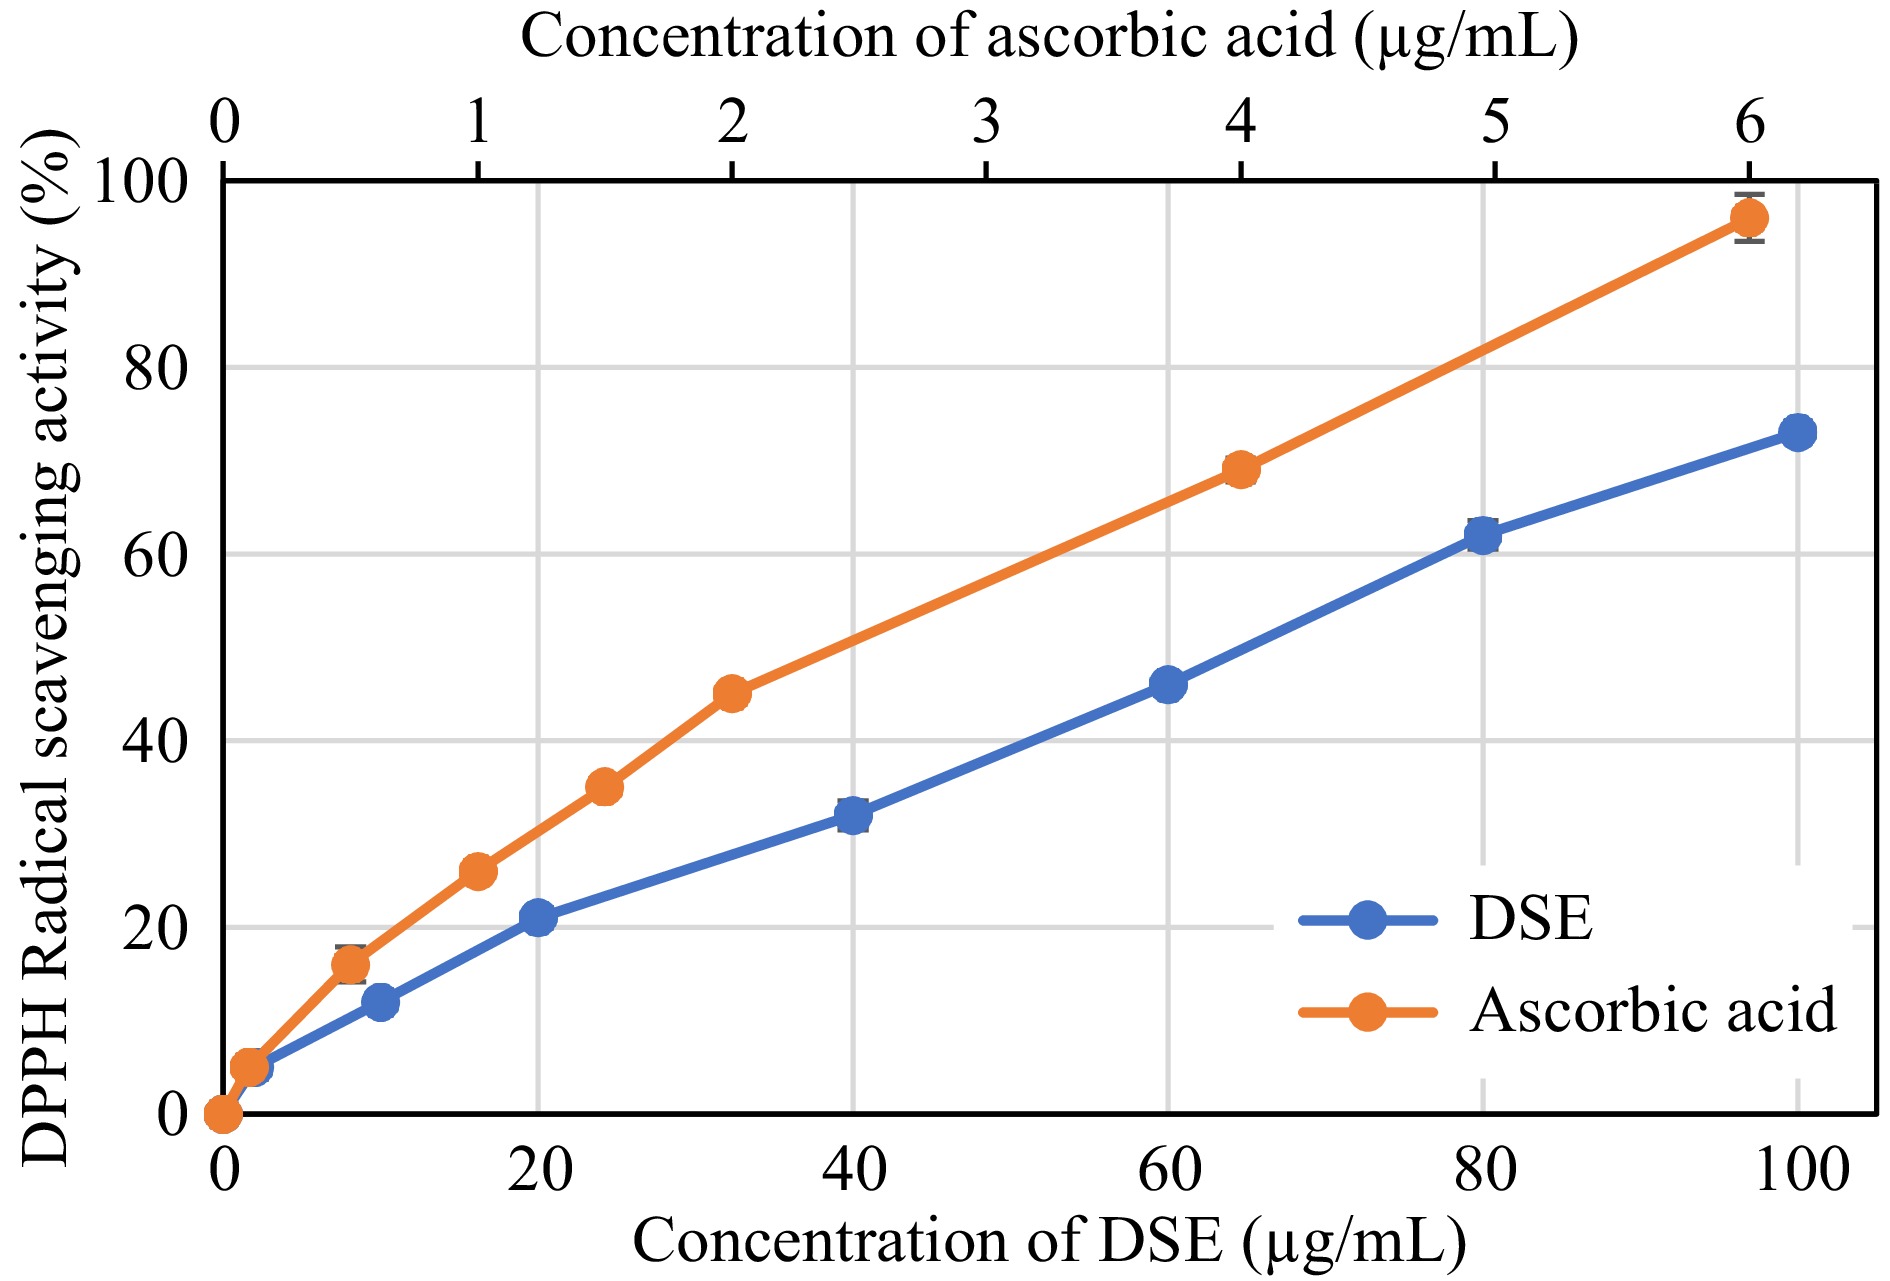
Figure 2.
DPPH radical scavenging activity of desugared sugarcane extract (DSE) and ascorbic acid (positive control).
-
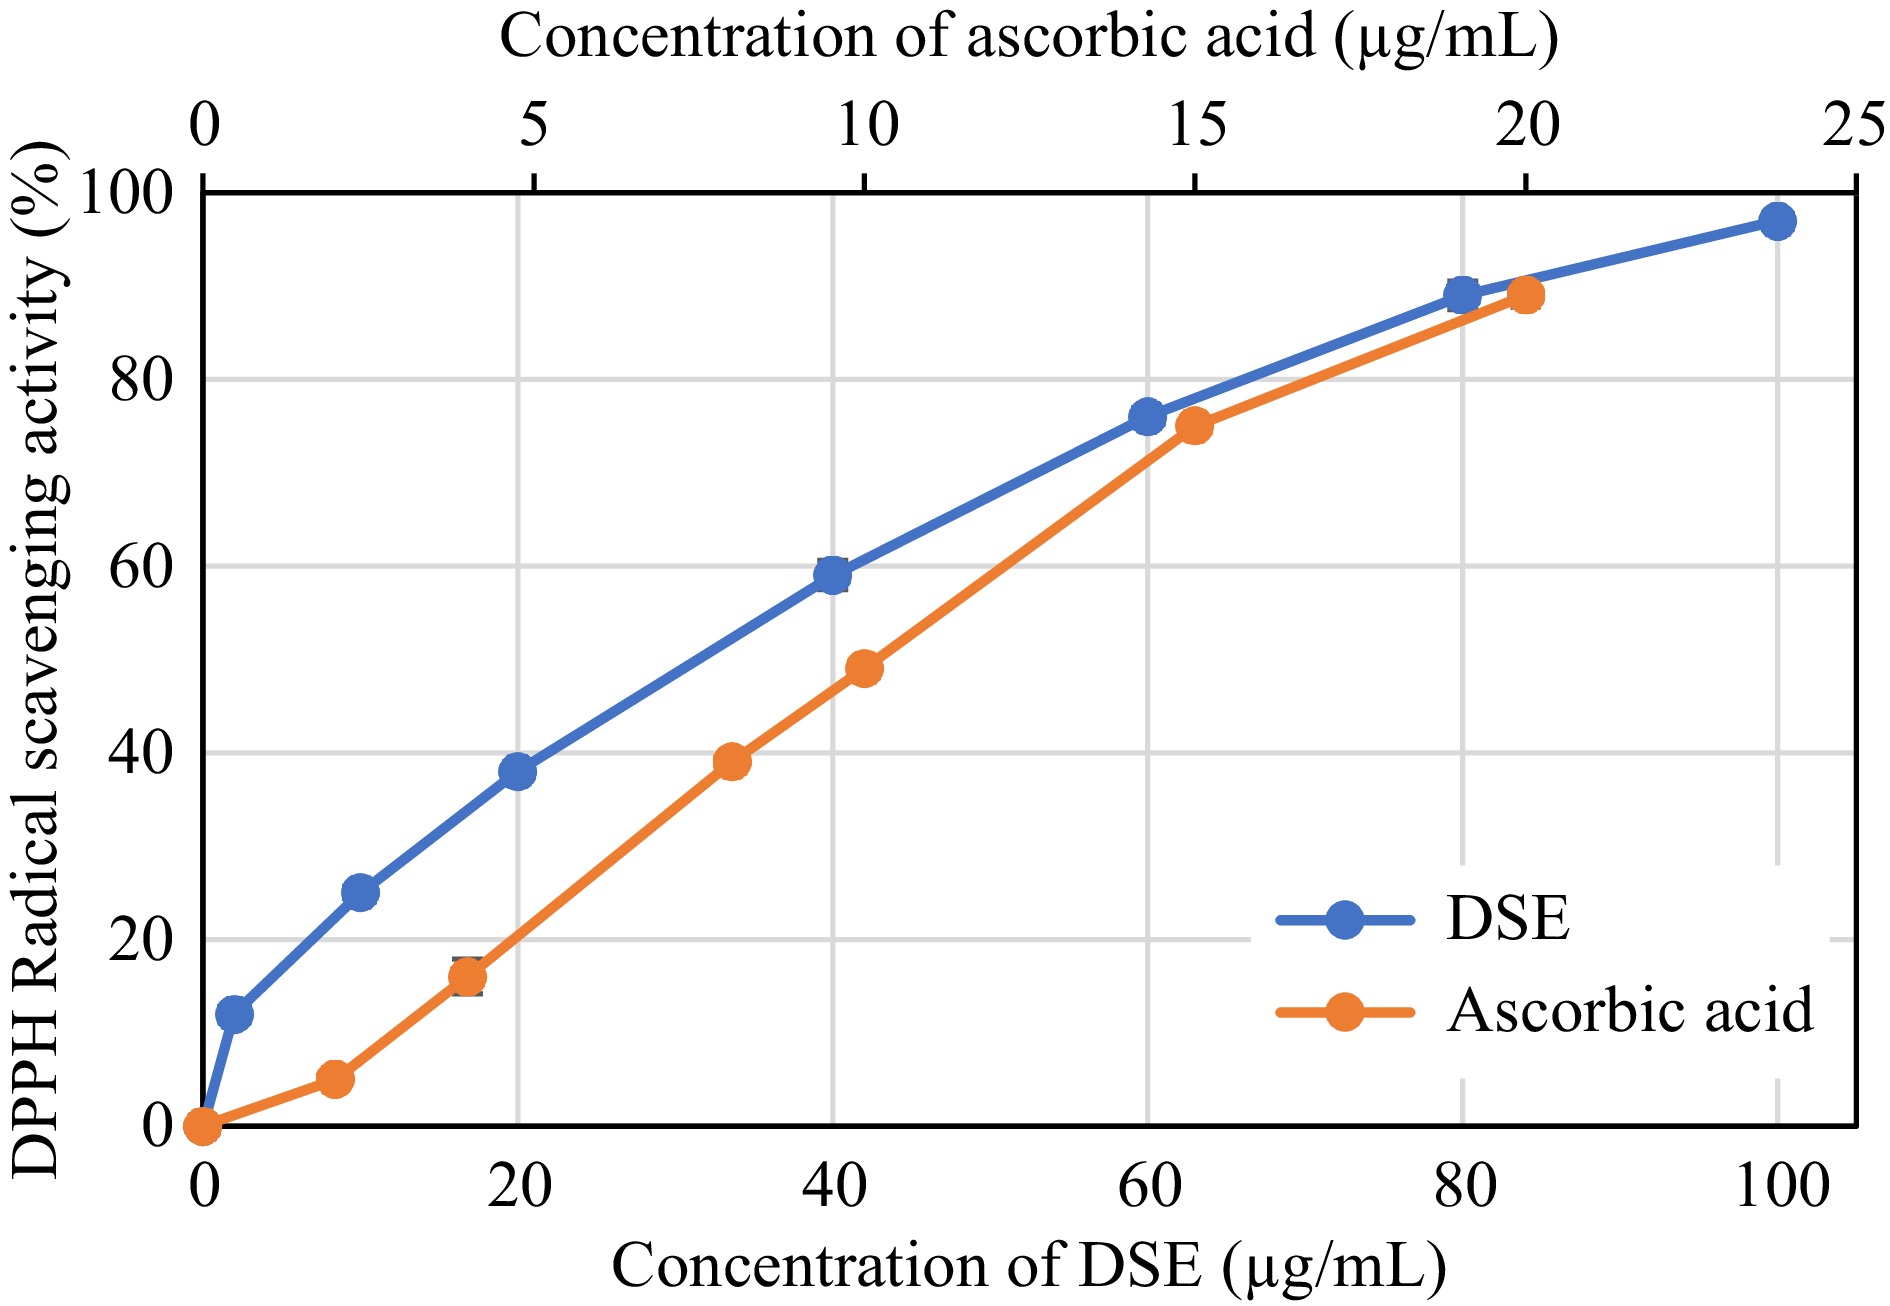
Figure 3.
ABTS radical scavenging activity of desugared sugarcane extract (DSE) and ascorbic acid (positive control).
-
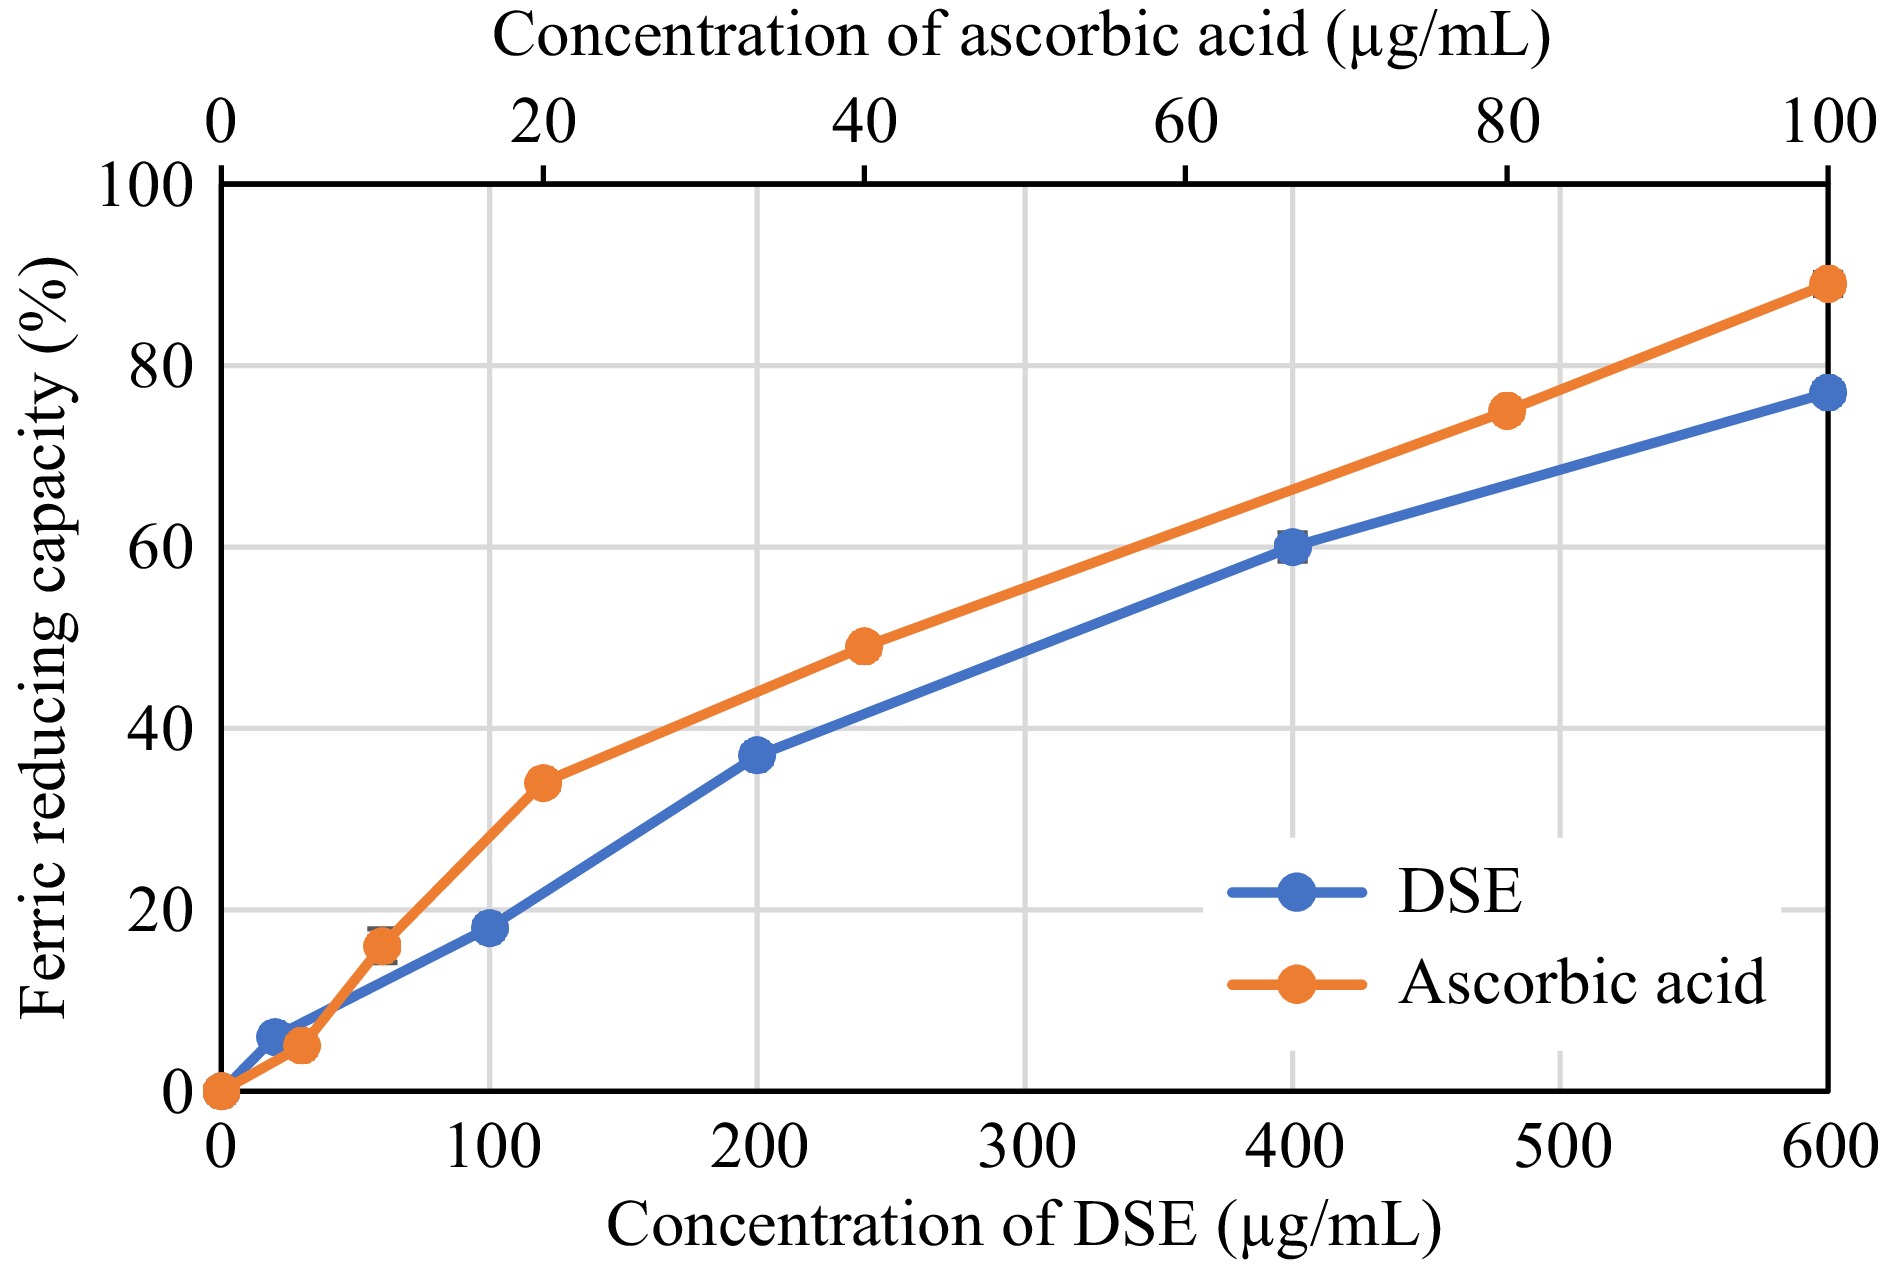
Figure 4.
Ferric Reducing Capacity of desugared sugarcane extract (DSE) and ascorbic acid (positive control).
-
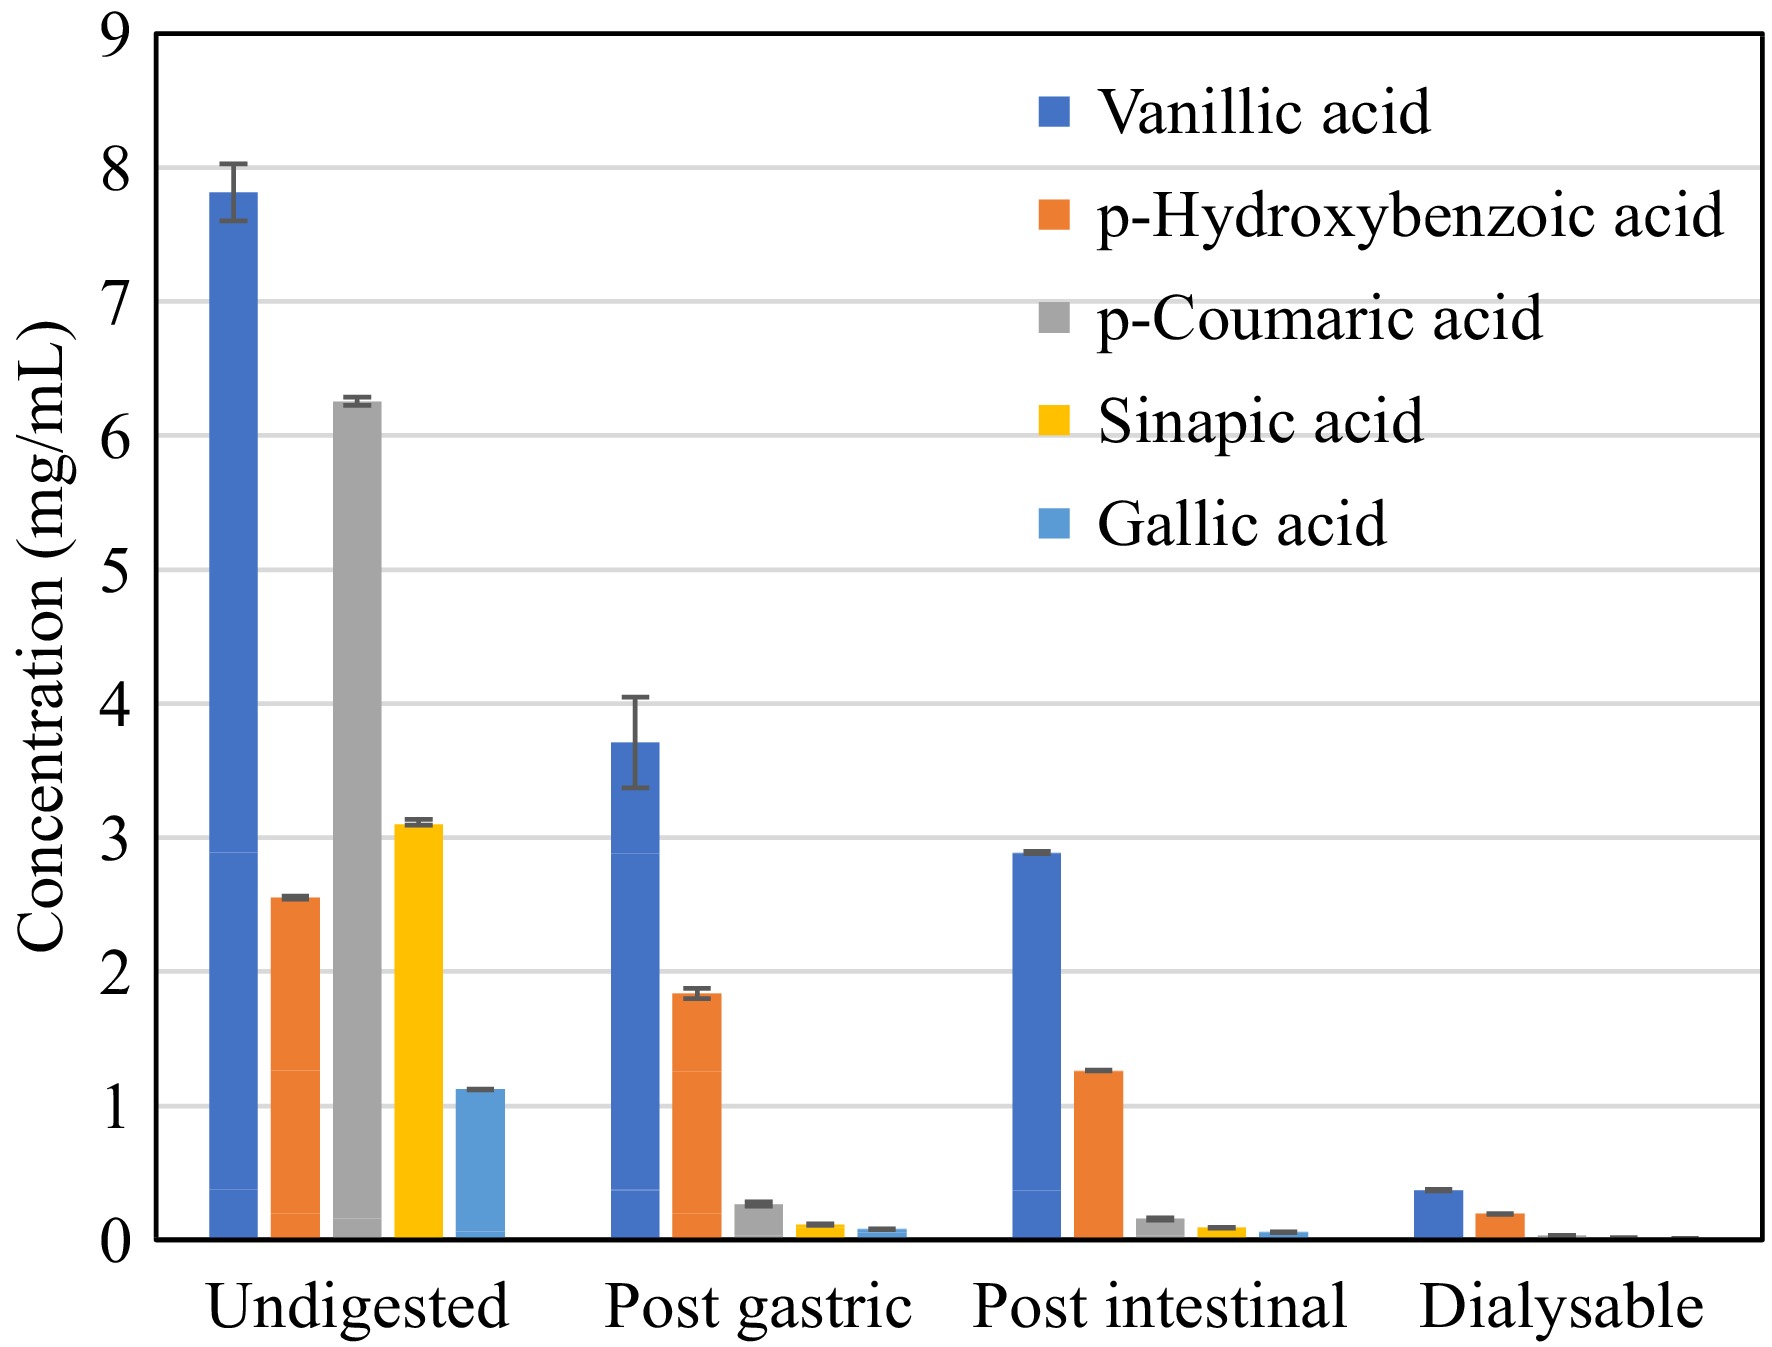
Figure 5.
Phenolic acid content of desugared sugarcane extract during simulated gastrointestinal digestion.
-
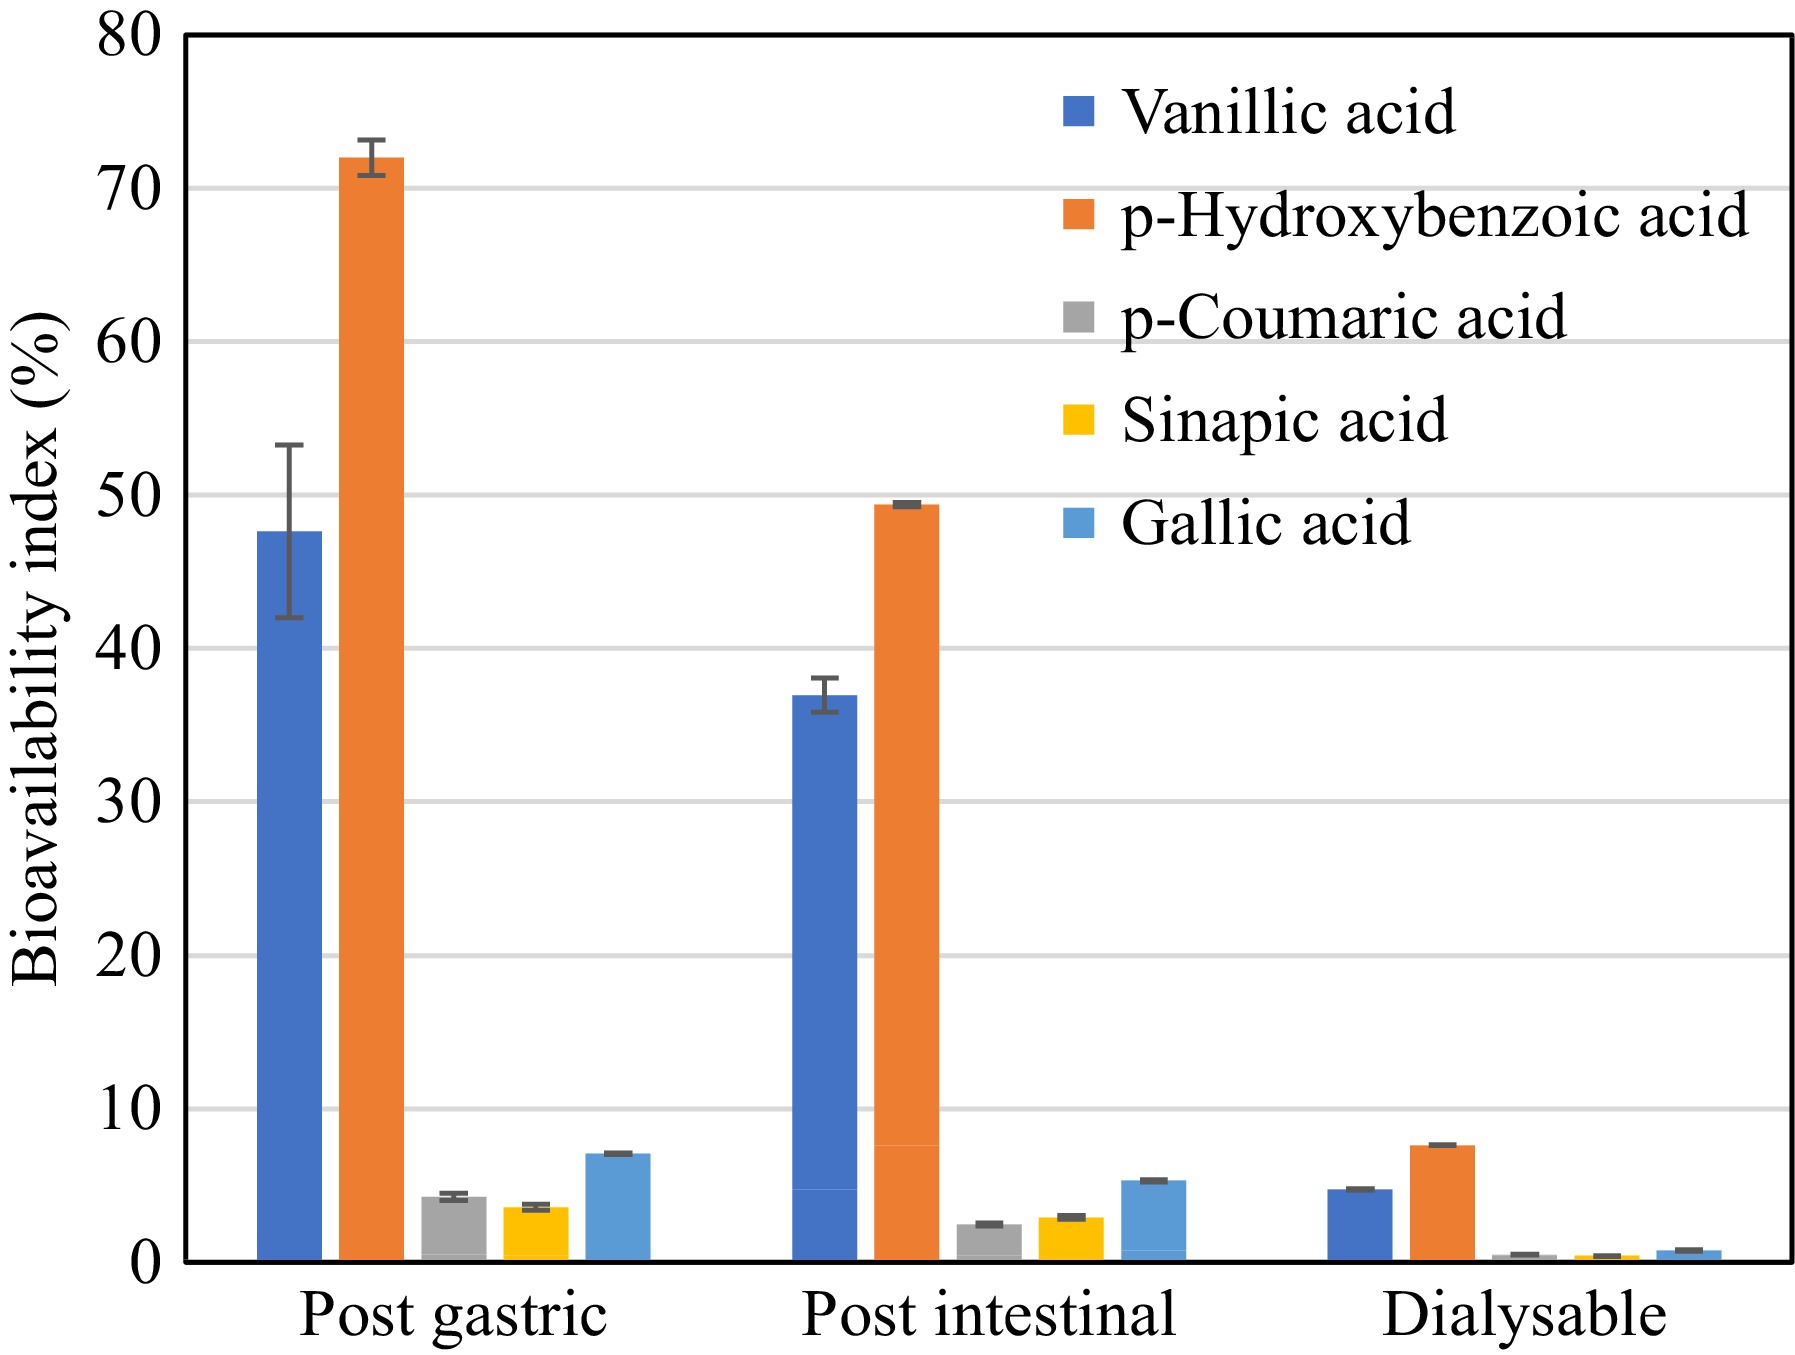
Figure 6.
Bioaccessibility Index of phenolic acids present in desugared sugarcane extract during simulated gastrointestinal digestion.
-
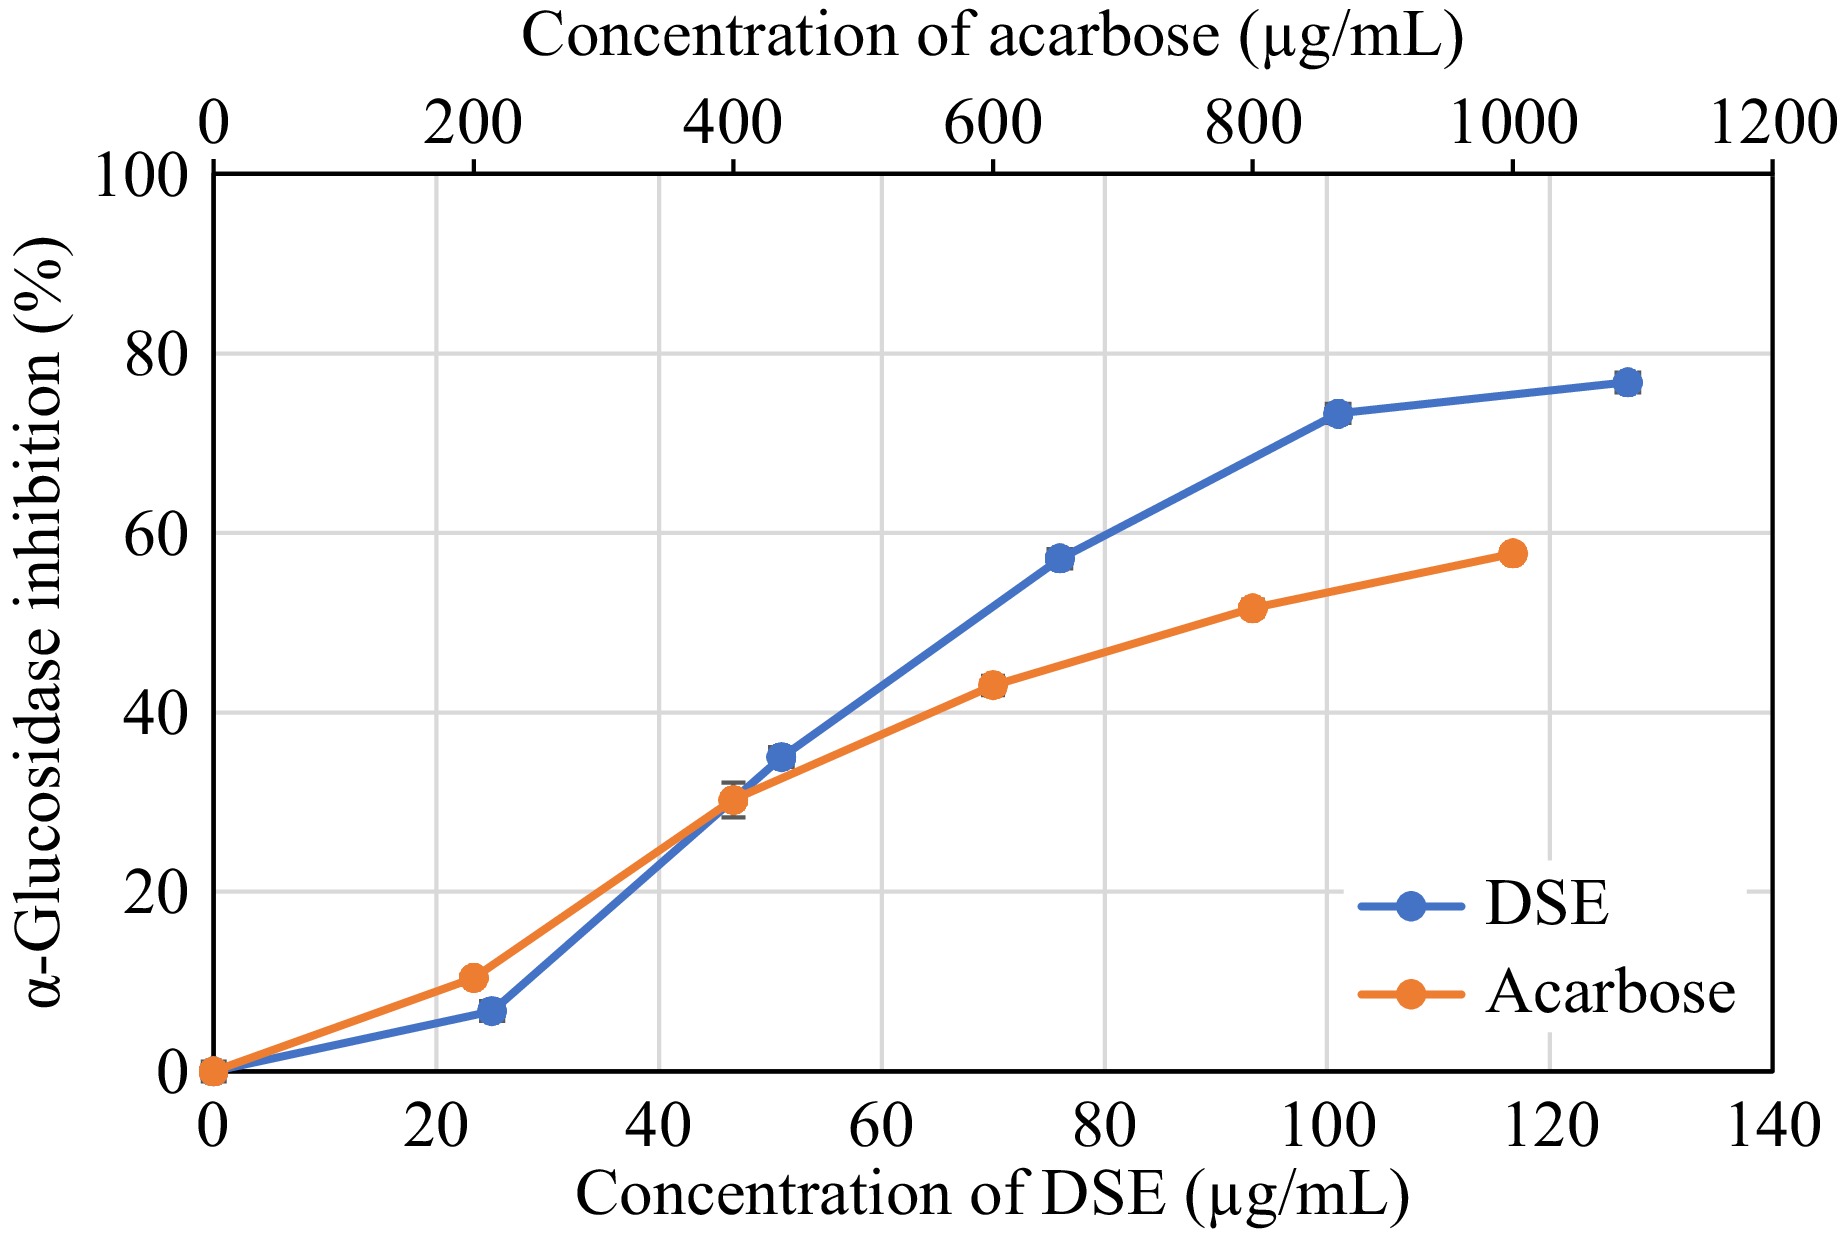
Figure 7.
Alpha-glucosidase inhibition activity of desugared sugarcane extract (DSE) and acarbose (positive control).
-
Composition Parameters Moisture 2.50% ± 0.69% Ash 3.28% ± 0.01% Crude protein 5.98% ± 0.03% Crude fiber 0.06% ± 0.00 Crude fat 0.07% ± 0.02% Phytochemical compounds Total phenolic content (g GAE/100 g) 32.21 ± 0.59 Total flavonoid content (mg QE/100 g) 4.50 ± 0.2 Total anthocyanin content (mg CYE/ 100 g) ND Condensed tannins content (mg CE/ 100 g) ND Phenolic acid profiling (mg/100 mg sample)a p-Hydroxybenzoic acid 172.15 ± 1.70 Gallic acid 101.48 ± 2.47 p-Coumaric acid 390.65 ± 5.00 Sinapic acid 638.37 ± 19.32 Ferulic acid ND Rosmarinic acid ND Caffeic acid ND Chlorogenic acid ND Vanillic acid 724.56 ± 15.25 ND – not detected; a HPLC quantification (Linearity and Pearson correlation coefficient of standards). p-hydroxybenzoic acid: y = 74,436.78x – 43,860.17, R2 = 0.9972; Gallic acid: y = 32,740.20x – 15,807.20, R2 = 0.9980; p-coumaric acid: y = 75,863.84x – 28,155.51, R2 = 0.9940; Sinapic acid: y = 15,554.05x + 11,652.20, R2 = 0.9917; Ferulic acid: y= 38,241.65x – 26421.30, R2 = 0.9915; Rosmarinic acid: y = 26,606.15x + 3,964.90, R2 = 0.9815; Caffeic acid: y = 44,829.65x + 22,565.10, R2 = 0.9886; Chlorogenic acid: y = 15,347.45x – 12,230.50, R2 = 0.9975; Vanillic acid: y = 47,194.62x + 928.95, R2 = 0.9955. Table 1.
Proximate composition, phytochemical profiling, and phenolic acid quantification in desugared sugarcane extract.
-
Sample Antioxidant activity (EC50 μg/mL) DPPH radical scavenging ABTS radical scavenging Ferric reducing capacity DSE 64.77 ± 1.19a 31.26 ± 1.17a 345.04 ± 3.08a Ascorbic acid (control) 2.54 ± 0.28b 10.42 ± 2.45b 42.21 ± 0.59a a, b Different superscripts in the same column denotes significant differences (p < 0.05) as analyzed by one-way ANOVA and the Tukey HSD test; DSE: Desugared sugarcane extract. Table 2.
DPPH and ABTS radical scavenging activity, and ferric reducing capacity of desugared sugarcane extract.
-
Digestion phase Total phenolic content† DPPH radical scavenging capacity‡ Bioaccessibility index Undigested 34.91 ± 0.40b 122.29 ± 1.29a − Post gastric 21.17 ± 0.89c 126.73 ± 1.65a 60.44% Post intestinal 55.99 ± 3.26a 37.49 ± 1.45b 160.38% Dialysable
(free soluble)13.41 ± 0.41d 29.59 ± 1.78c 38.41% a−d Different superscripts in the same column denotes significant differences (p < 0.05) as analyzed by one-way ANOVA and the Tukey HSD test.
† Expressed as g gallic acid equivalent (GAE) per 100 g sample;
‡ Expressed as μg Trolox equivalent (TE) per 100 g sample.Table 3.
Total phenolic content, DPPH radical scavenging capacity and bioaccessibility of desugared sugarcane extract during simulated gastrointestinal digestion.
-
Sample Alpha-glucosidase inhibition activity (IC50 μg/mL) DSE 67.78 ± 0.05b Acarbose (control) 762.00 ± 31.82a a, b Different superscripts in the same column denotes significant differences (p <0.05) as analyzed by one-way ANOVA and the Tukey HSD test. DSE: Desugared sugarcane extract. Table 4.
Alpha-glucosidase inhibition activity of desugared sugarcane extract and acarbose (control).
Figures
(7)
Tables
(4)