-
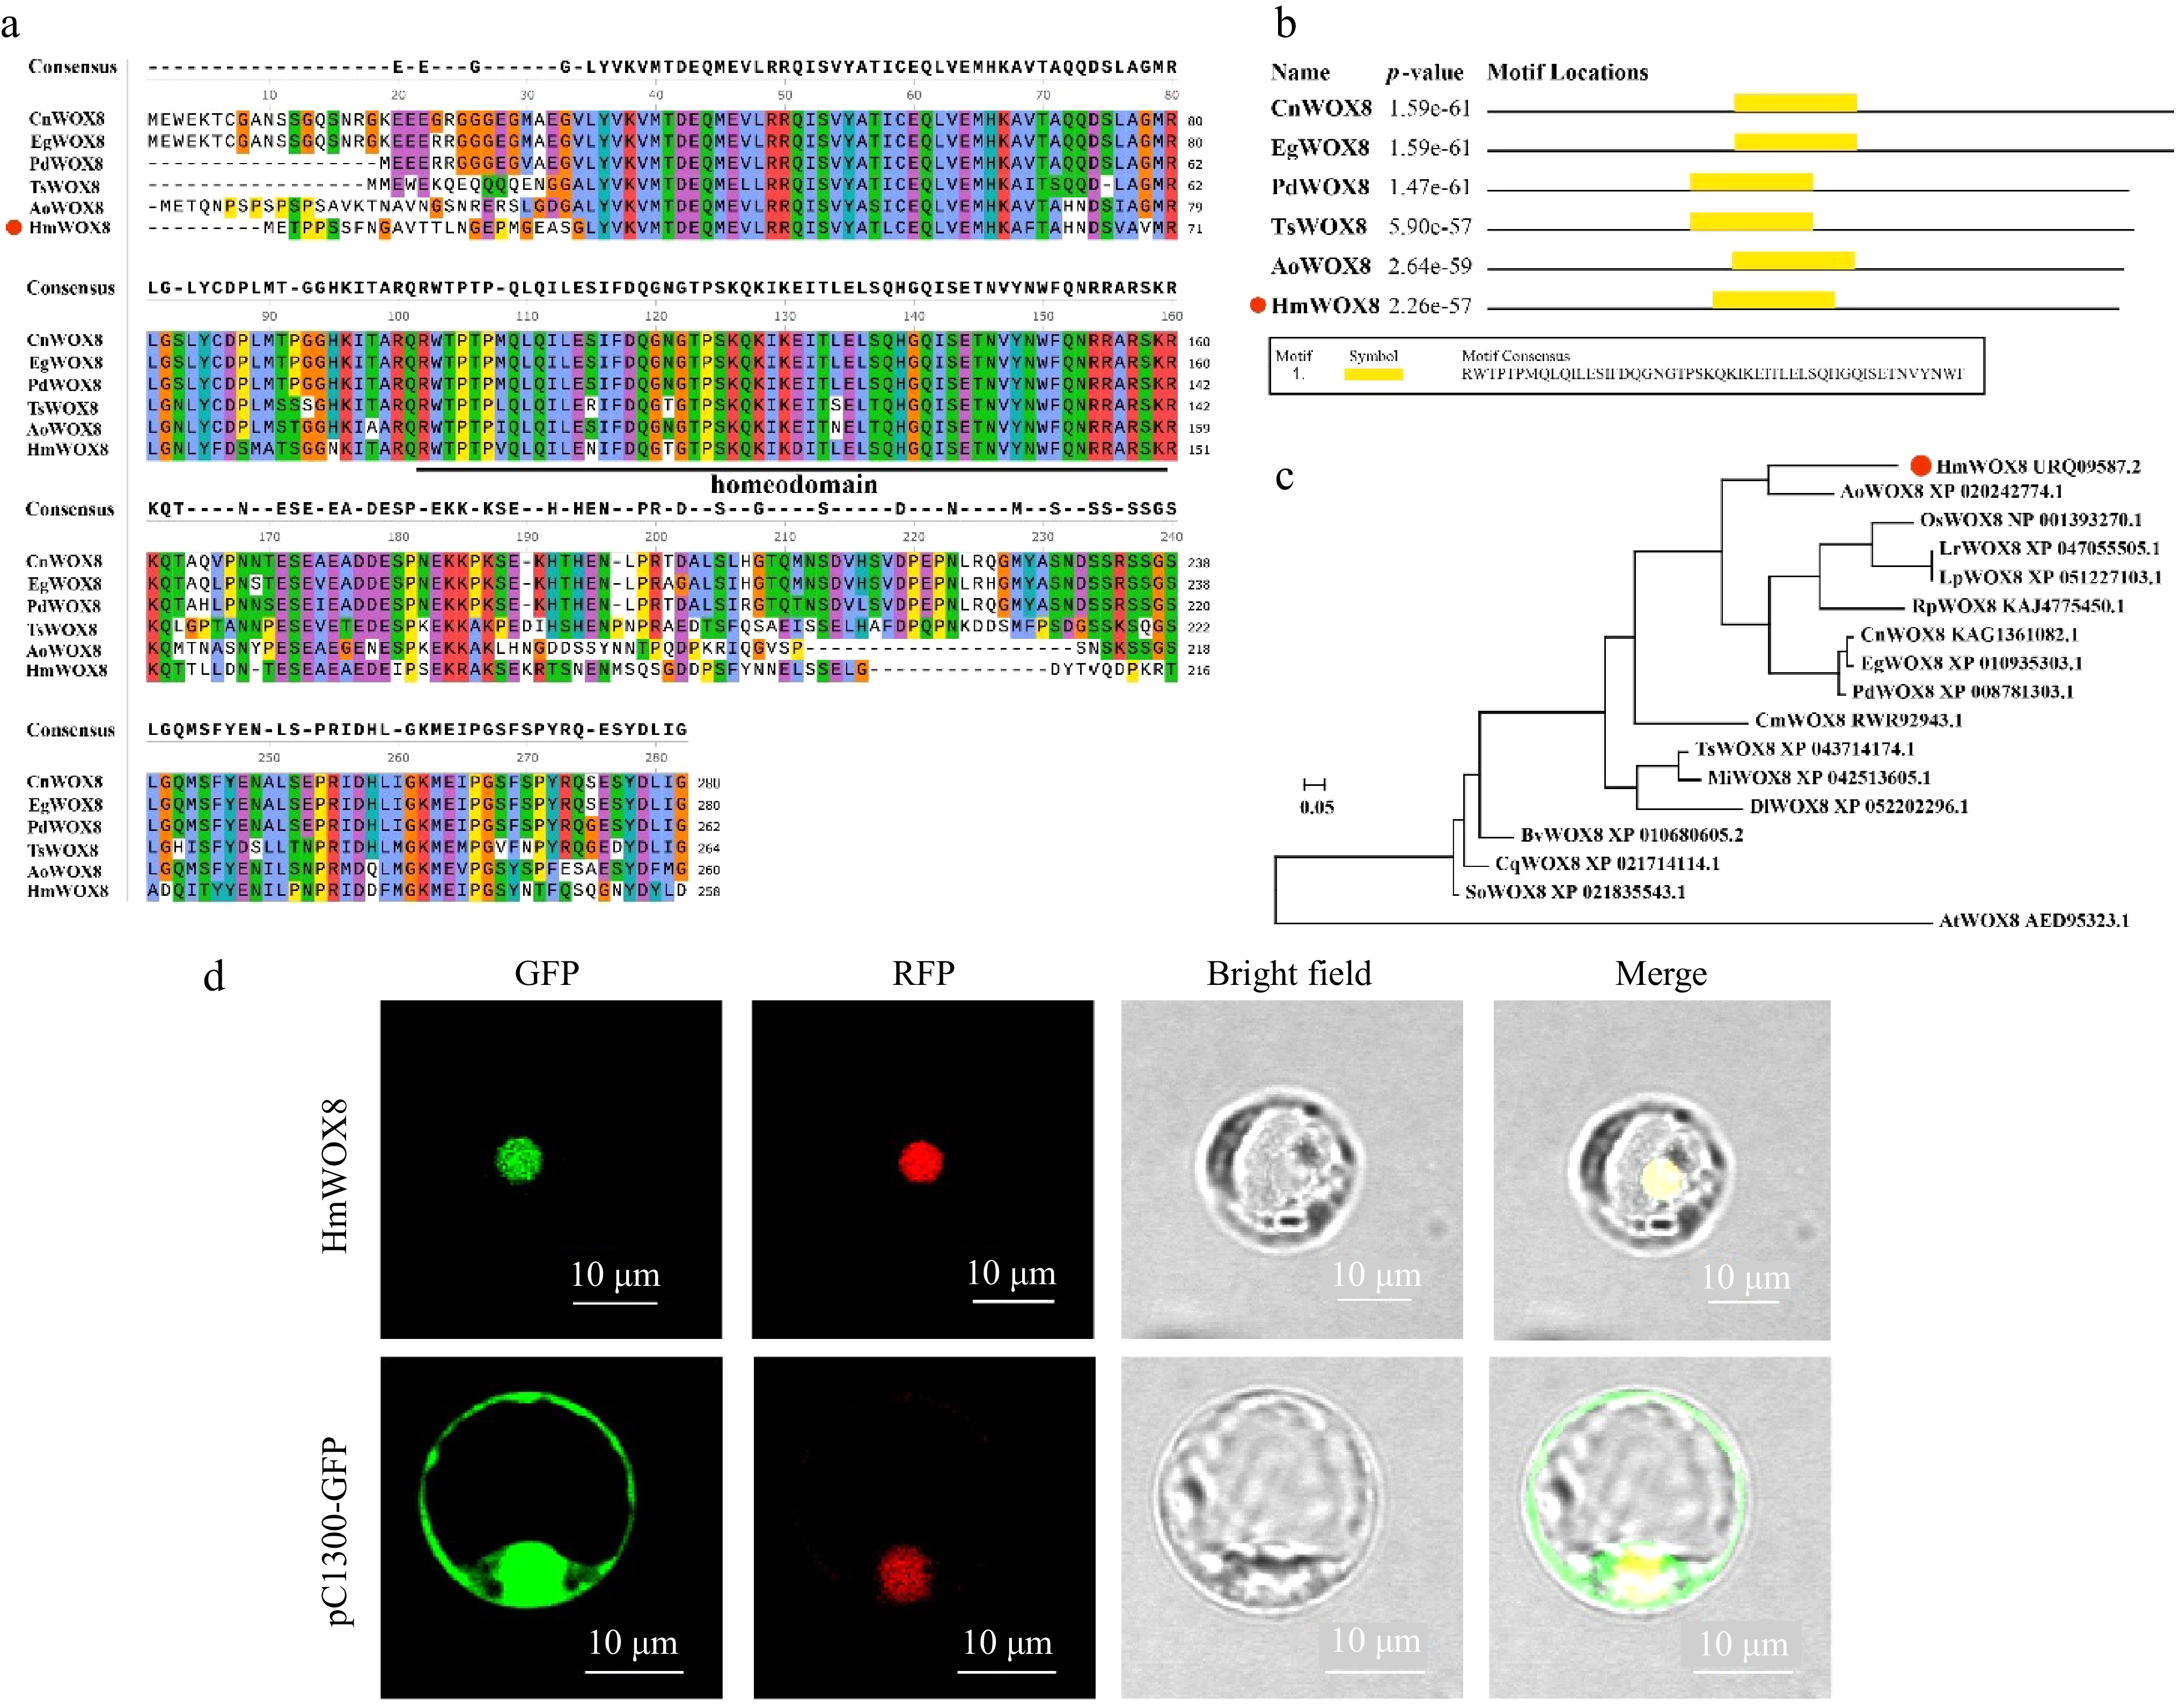
Figure 1.
Multiple sequence alignment, phylogenetic tree analysis and subcellular localization. (a) Multiple sequence alignment. (b) Conserved domain of HmWOX8 and five orthologous WOX8 proteins. The orthologous proteins were Cocos nucifera (CnWOX8), Elaeis guineensis (EgWOX8), Phoenix dactylifera (PdWOX8), Telopea speciosissima (TsWOX8), Asparagus officinalis (AoWOX8). (c) The Neighbor-Joining phylogenetic tree analysis of the amino acid sequence alignment of the HmWOX8 protein and WOX8 proteins from other plant species. The N-J phylogenetic tree was constructed using MEGA11. AoWOX8 (Asparagus officinalis, XP_0202427), OsWOX8 (Oryza sativa, NP_001393270.1), LrWOX8 (Lolium rigidum, XP_047055505.1), LpWOX8 (Lolium perenne, XP_051227103.1), RpWOX8 (Rhynchospora pubera, KAJ4775450.1), CnWOX8 (Cocos nucifera, KAG1361082.1), EgWOX8 (Elaeis guineensis, XP_010935303.1), PdWOX8 (Phoenix dactylifera, XP_008781303.1), CmWOX8 (Cinnamomum micranthum f. kanehirae, RWR92943.1), TsWOX8 (Telopea speciosissima, XP_043714174.1), MiWOX8 (Macadamia integrifolia, XP_042513605.1), DlWOX8 (Diospyros lotus, XP_052202296.1), BvWOX8 (Beta vulgaris subsp. Vulgaris, XP_010680605.2), CqWOX8 (Chenopodium quinoa, XP_021714114.1), SoWOX8 (Spinacia oleracea, XP_021835543.1), AtWOX8 (Arabidopsis thaliana, AED95323.1). (d) Subcellular localization of HmWOX8 protein in rice protoplasts. Scale bars = 10 μm.
-
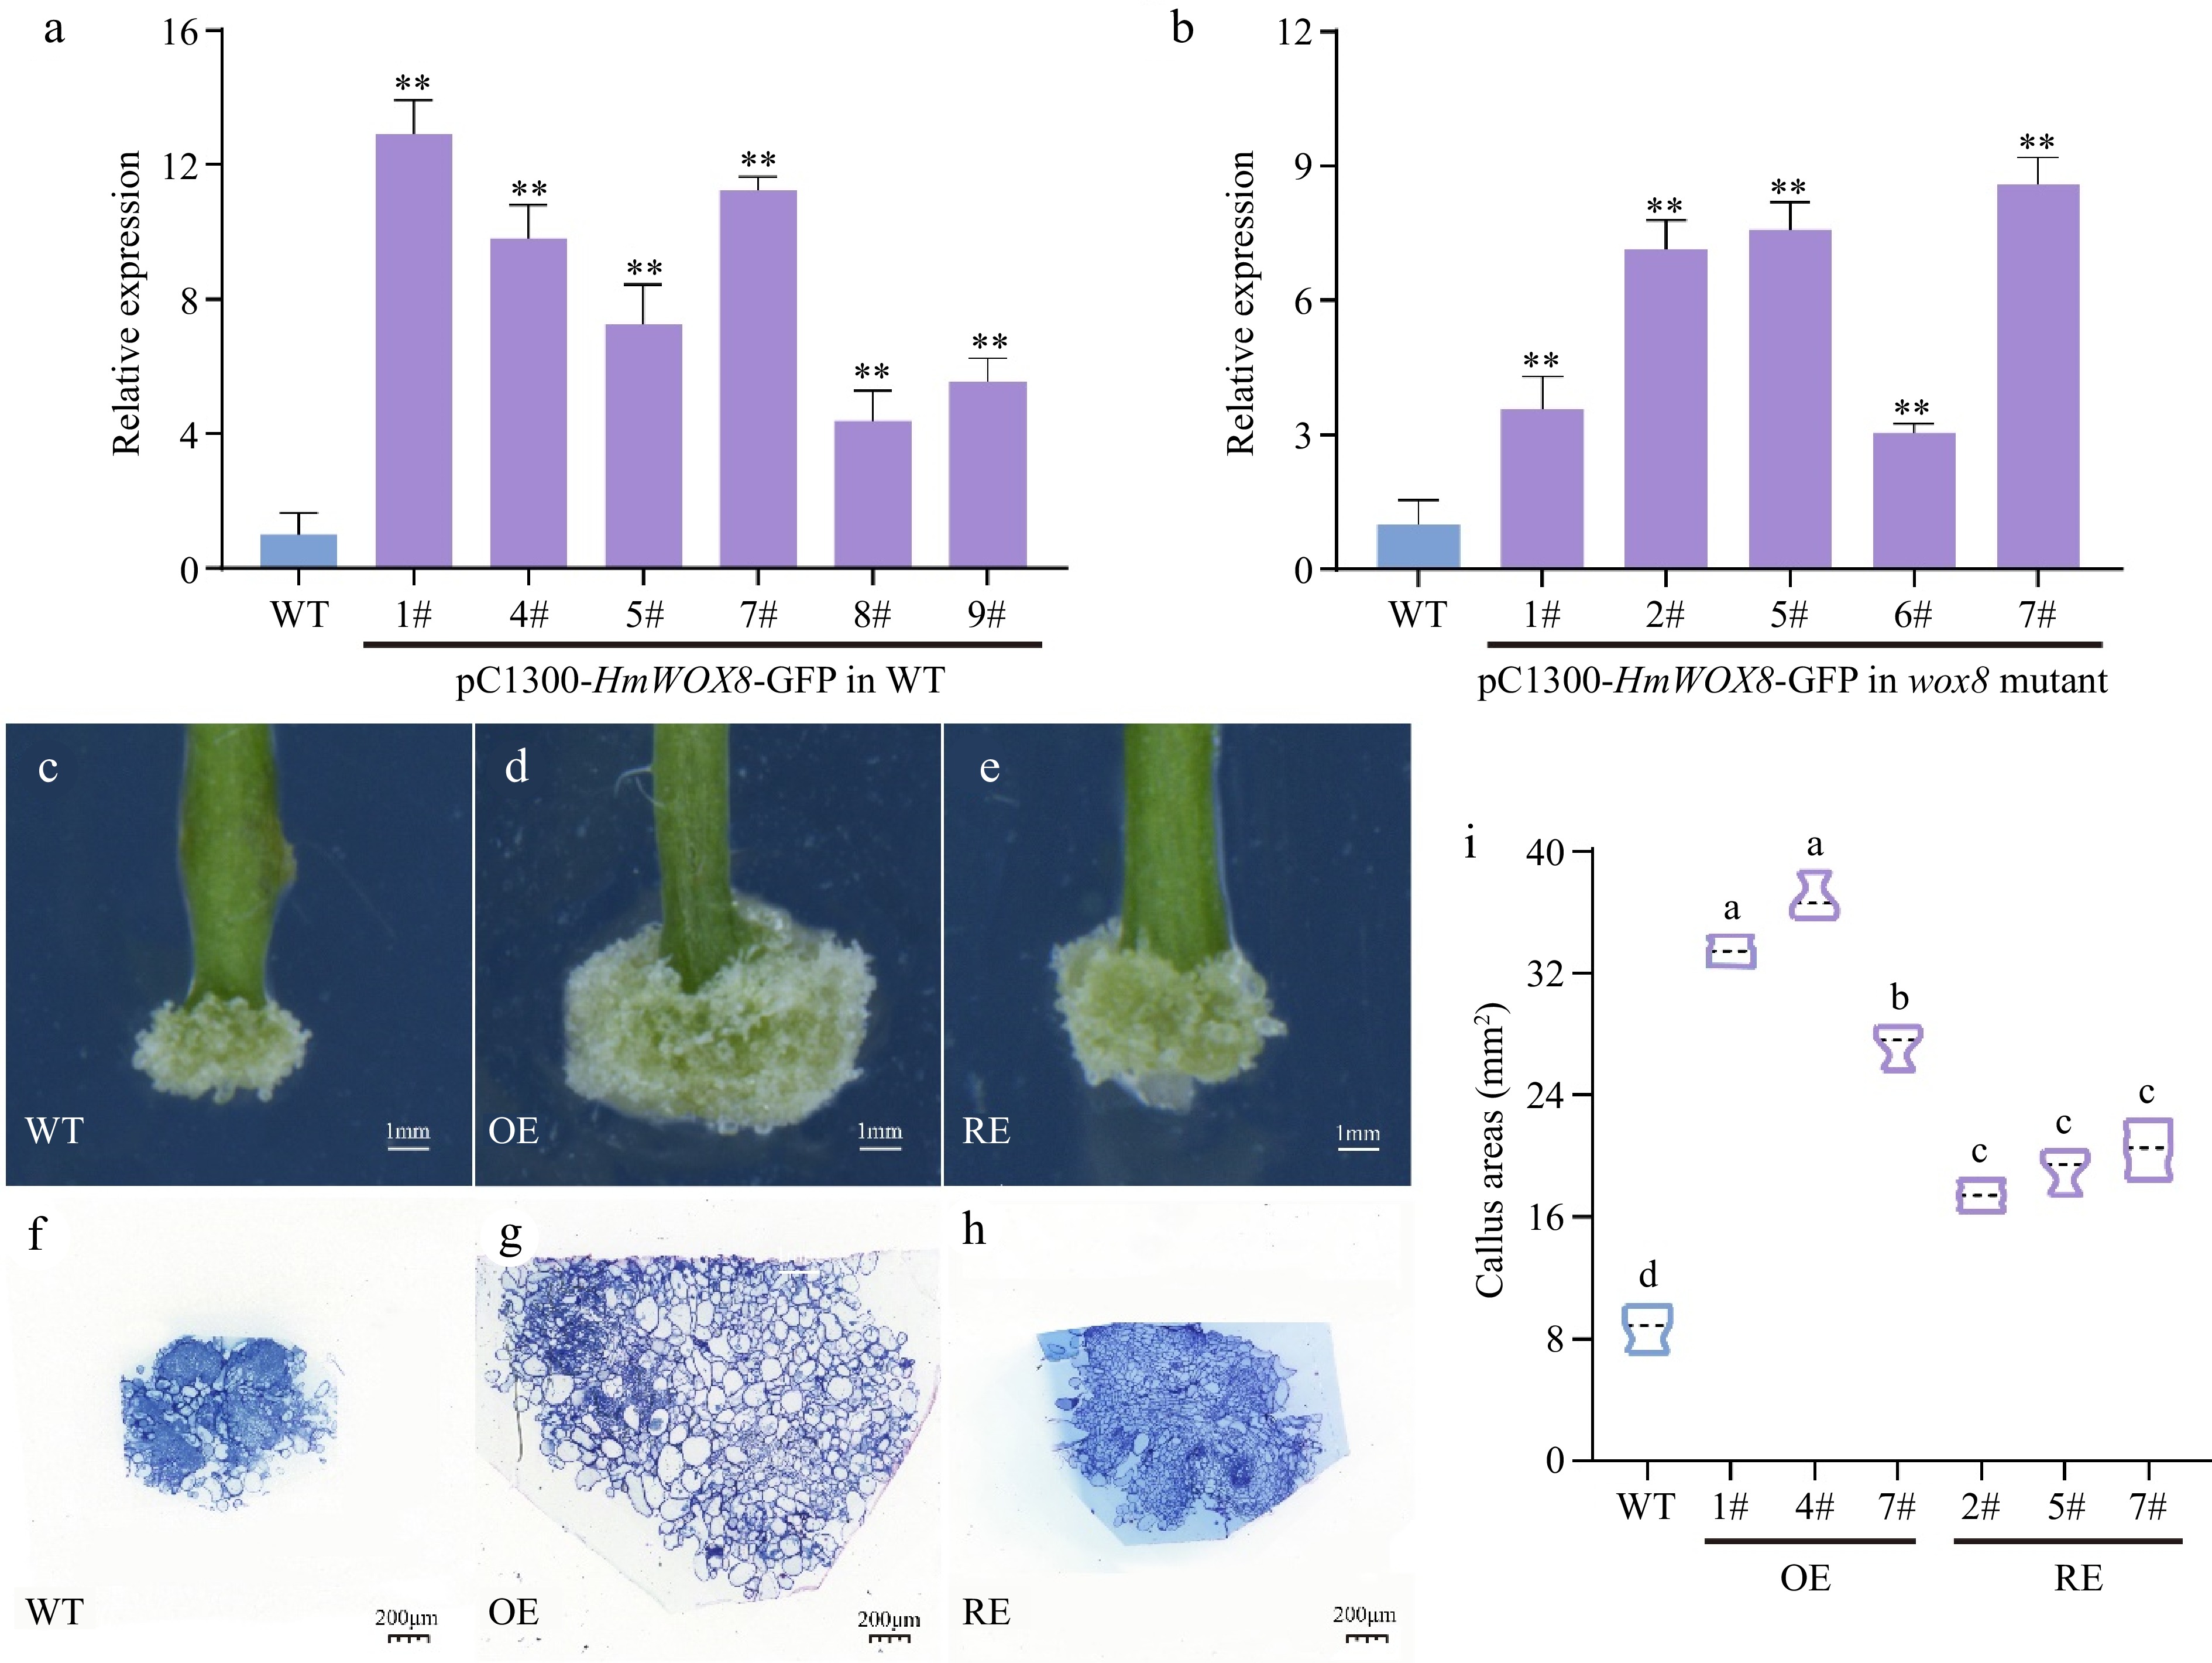
Figure 2.
Functional analysis of HmWOX8 transgenic A. thaliana. (a), (b) Identification of HmWOX8 gene expression in transformed Arabidopsis positive plants and wox8 mutant positive plants. (c)−(e) Callus phenotype of wild-type, HmWOX8-overexpression and recovery T3 transgenic plants. Scale bars = 1 mm. (f)−(h) Semi-thin cross sections of wild-type, HmWOX8-overexpression and recovery T3 transgenic plants, Scale bars = 200 μm. (i) Comparison of Wild-type (WT), HmWOX8 overexpression (OE) and recovery (RE) of callus areas in Arabidopsis. ** indicate significance at p < 0.01. The different lowercase letters indicate significant differences (p < 0.05).
-
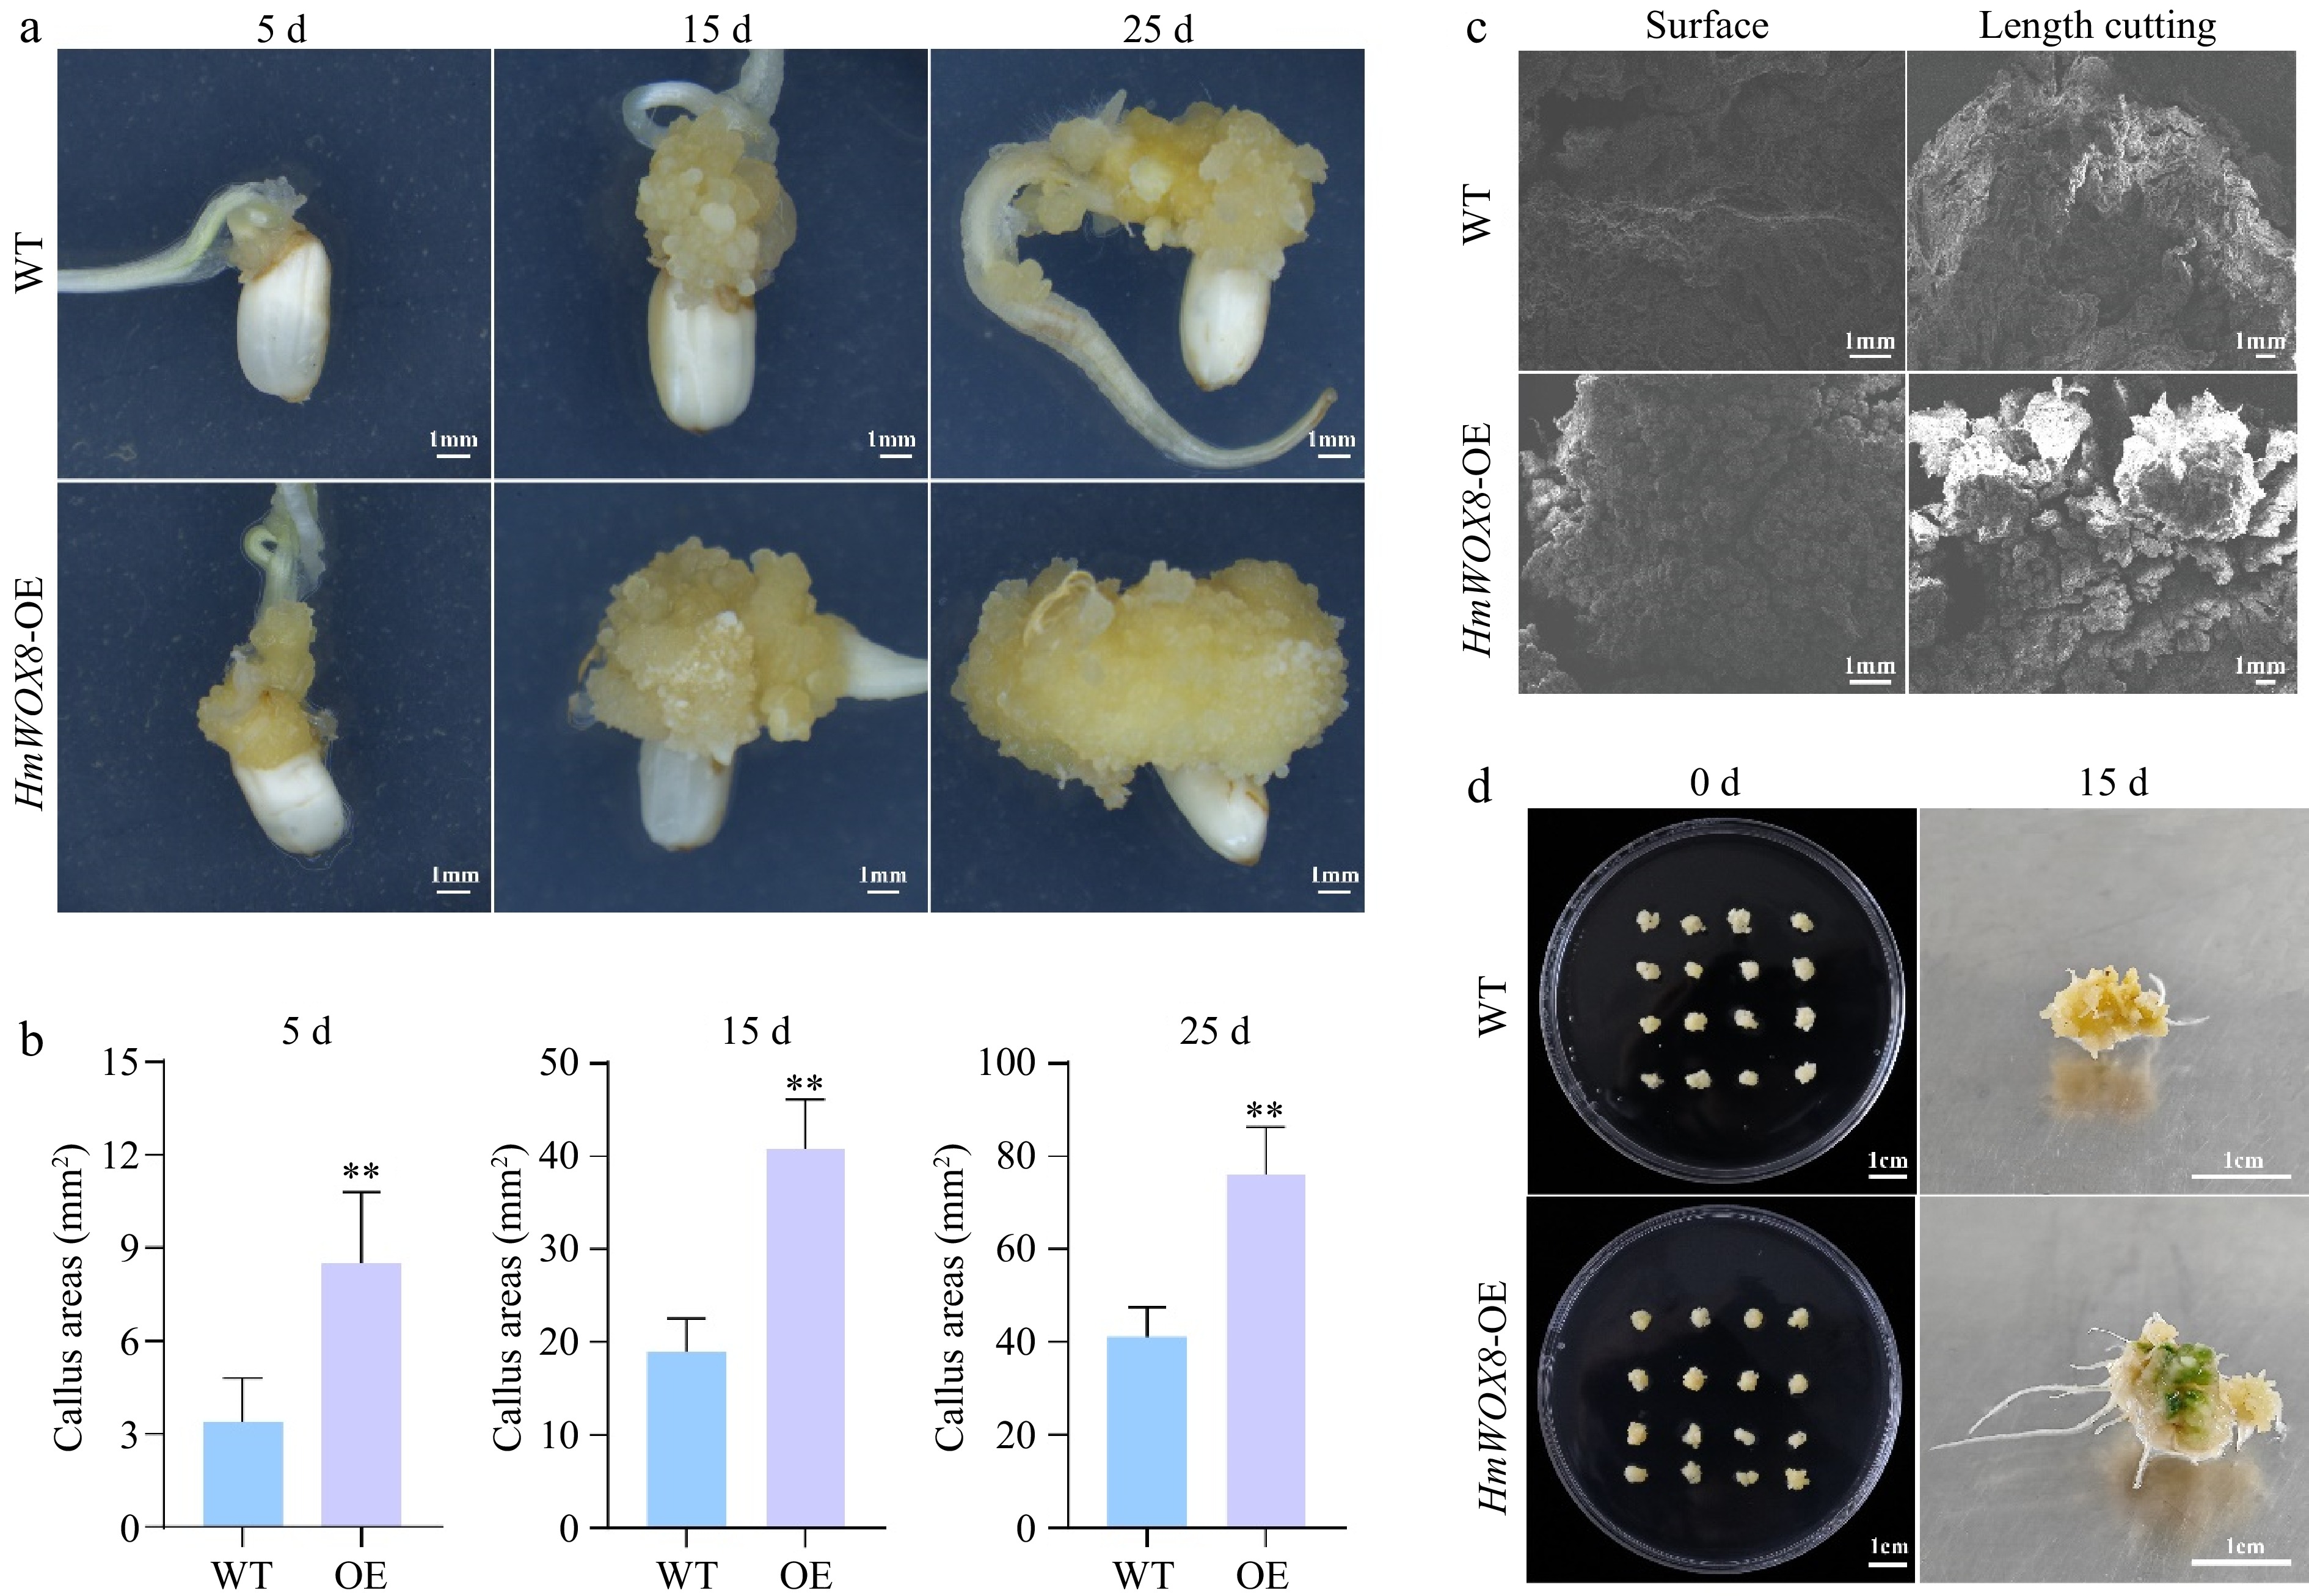
Figure 3.
Effects of HmWOX8 overexpression on callus proliferation and shoot regeneration in rice. (a) The callus phenotype of WT and HmWOX8-OE after continuous culture for 5 d, 15 d, and 25 d. Scale bars = 1 cm. (b) Comparison of callus area between WT and HmWOX8-OE after continuous culture for 5 d, 15 d, and 25 d. (c) The scanning electron microscope of WT and HmWOX8-OE. Scale bars = 1 mm. (d) The shoot phenotype of WT and HmWOX8-OE after 15 d in regeneration medium. Scale bars = 1 cm. ** indicate significance at p < 0.01.
-
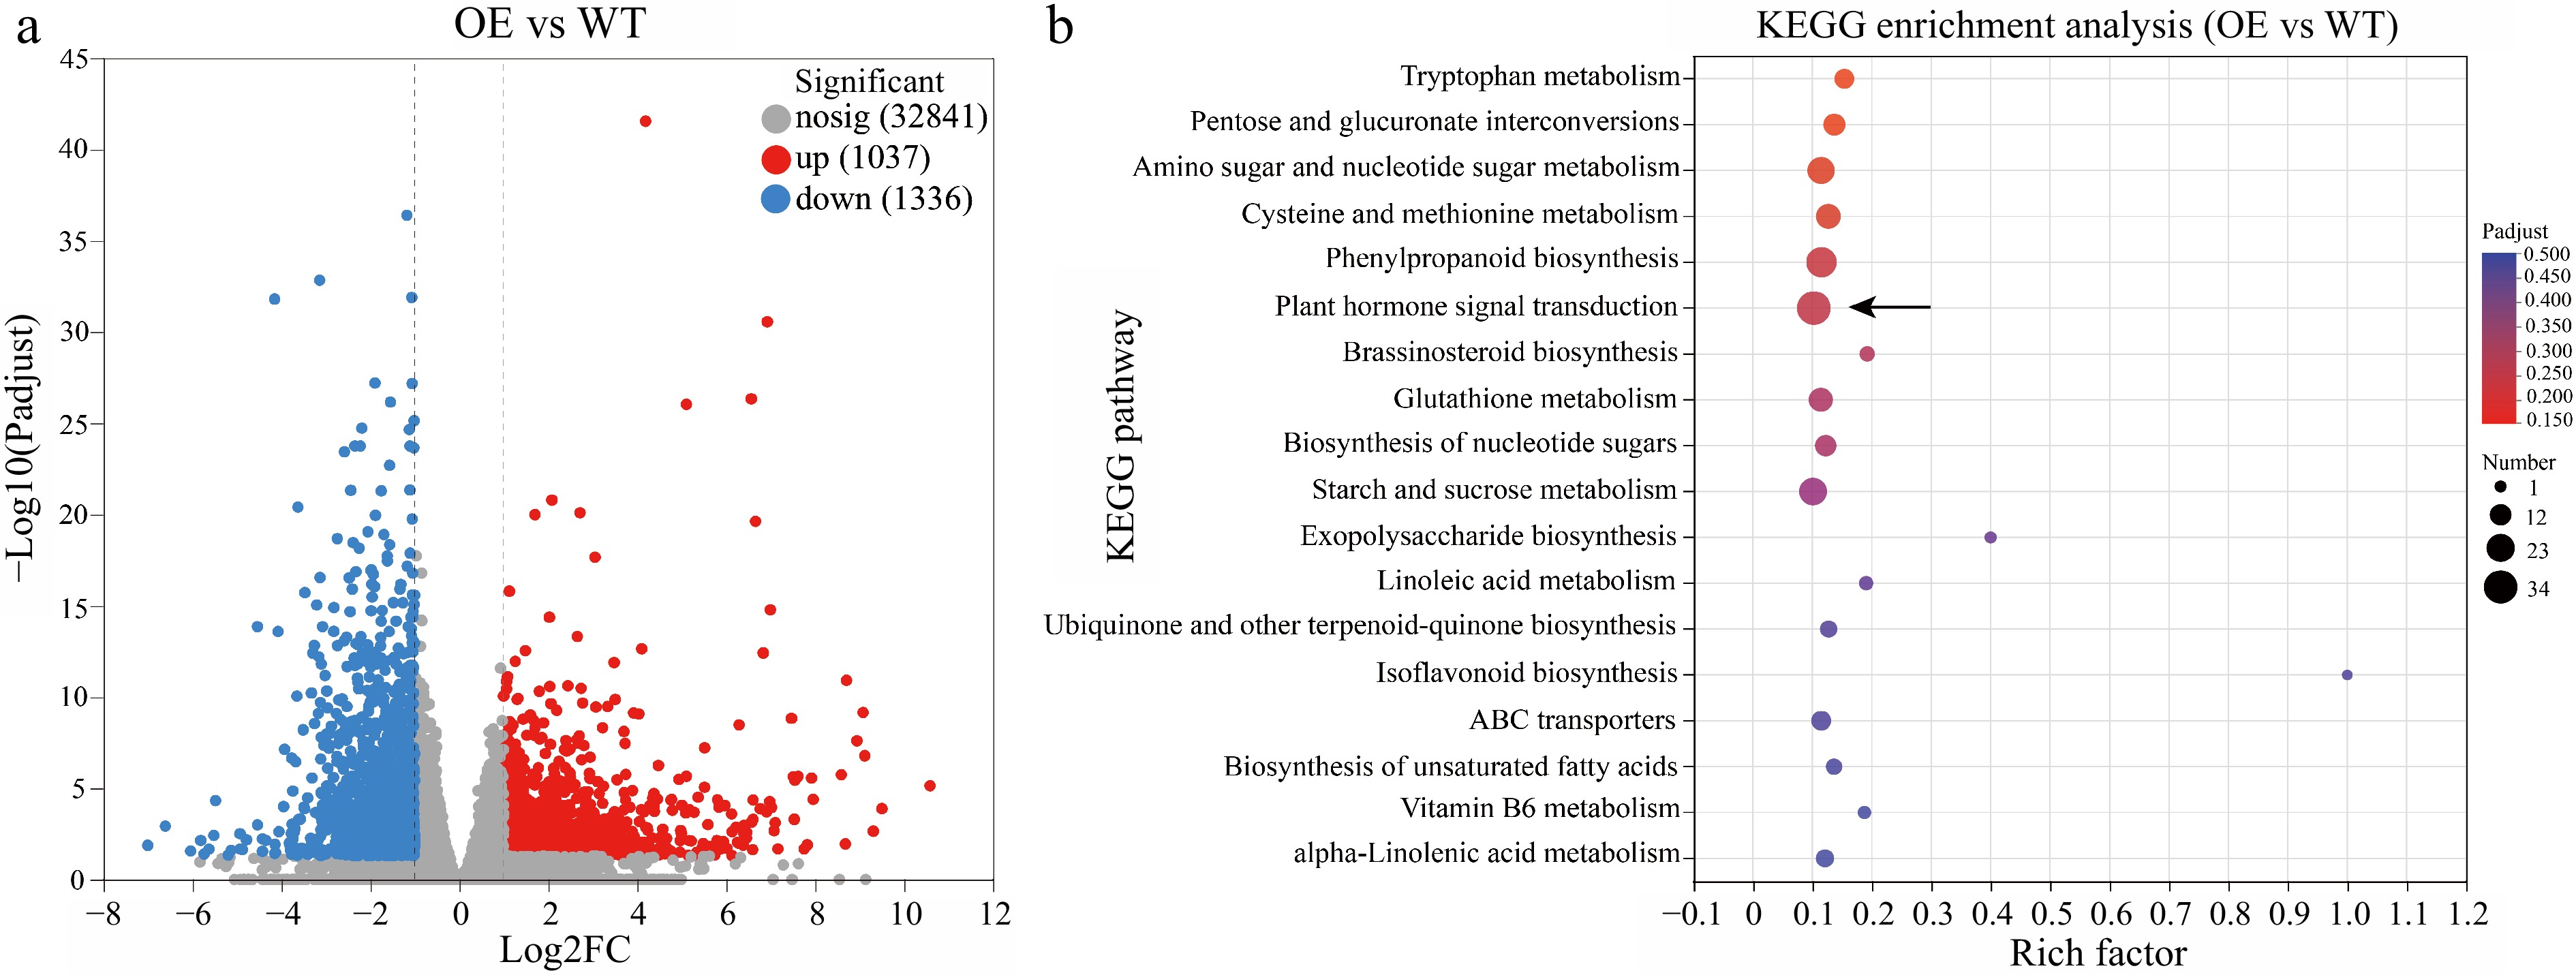
Figure 4.
Volcano map and KEGG enrichment analysis. (a) Volcano map analysis. (b) KEGG enrichment analysis of differentially expressed genes (DEGs) between HmWOX8-OE and WT.
-
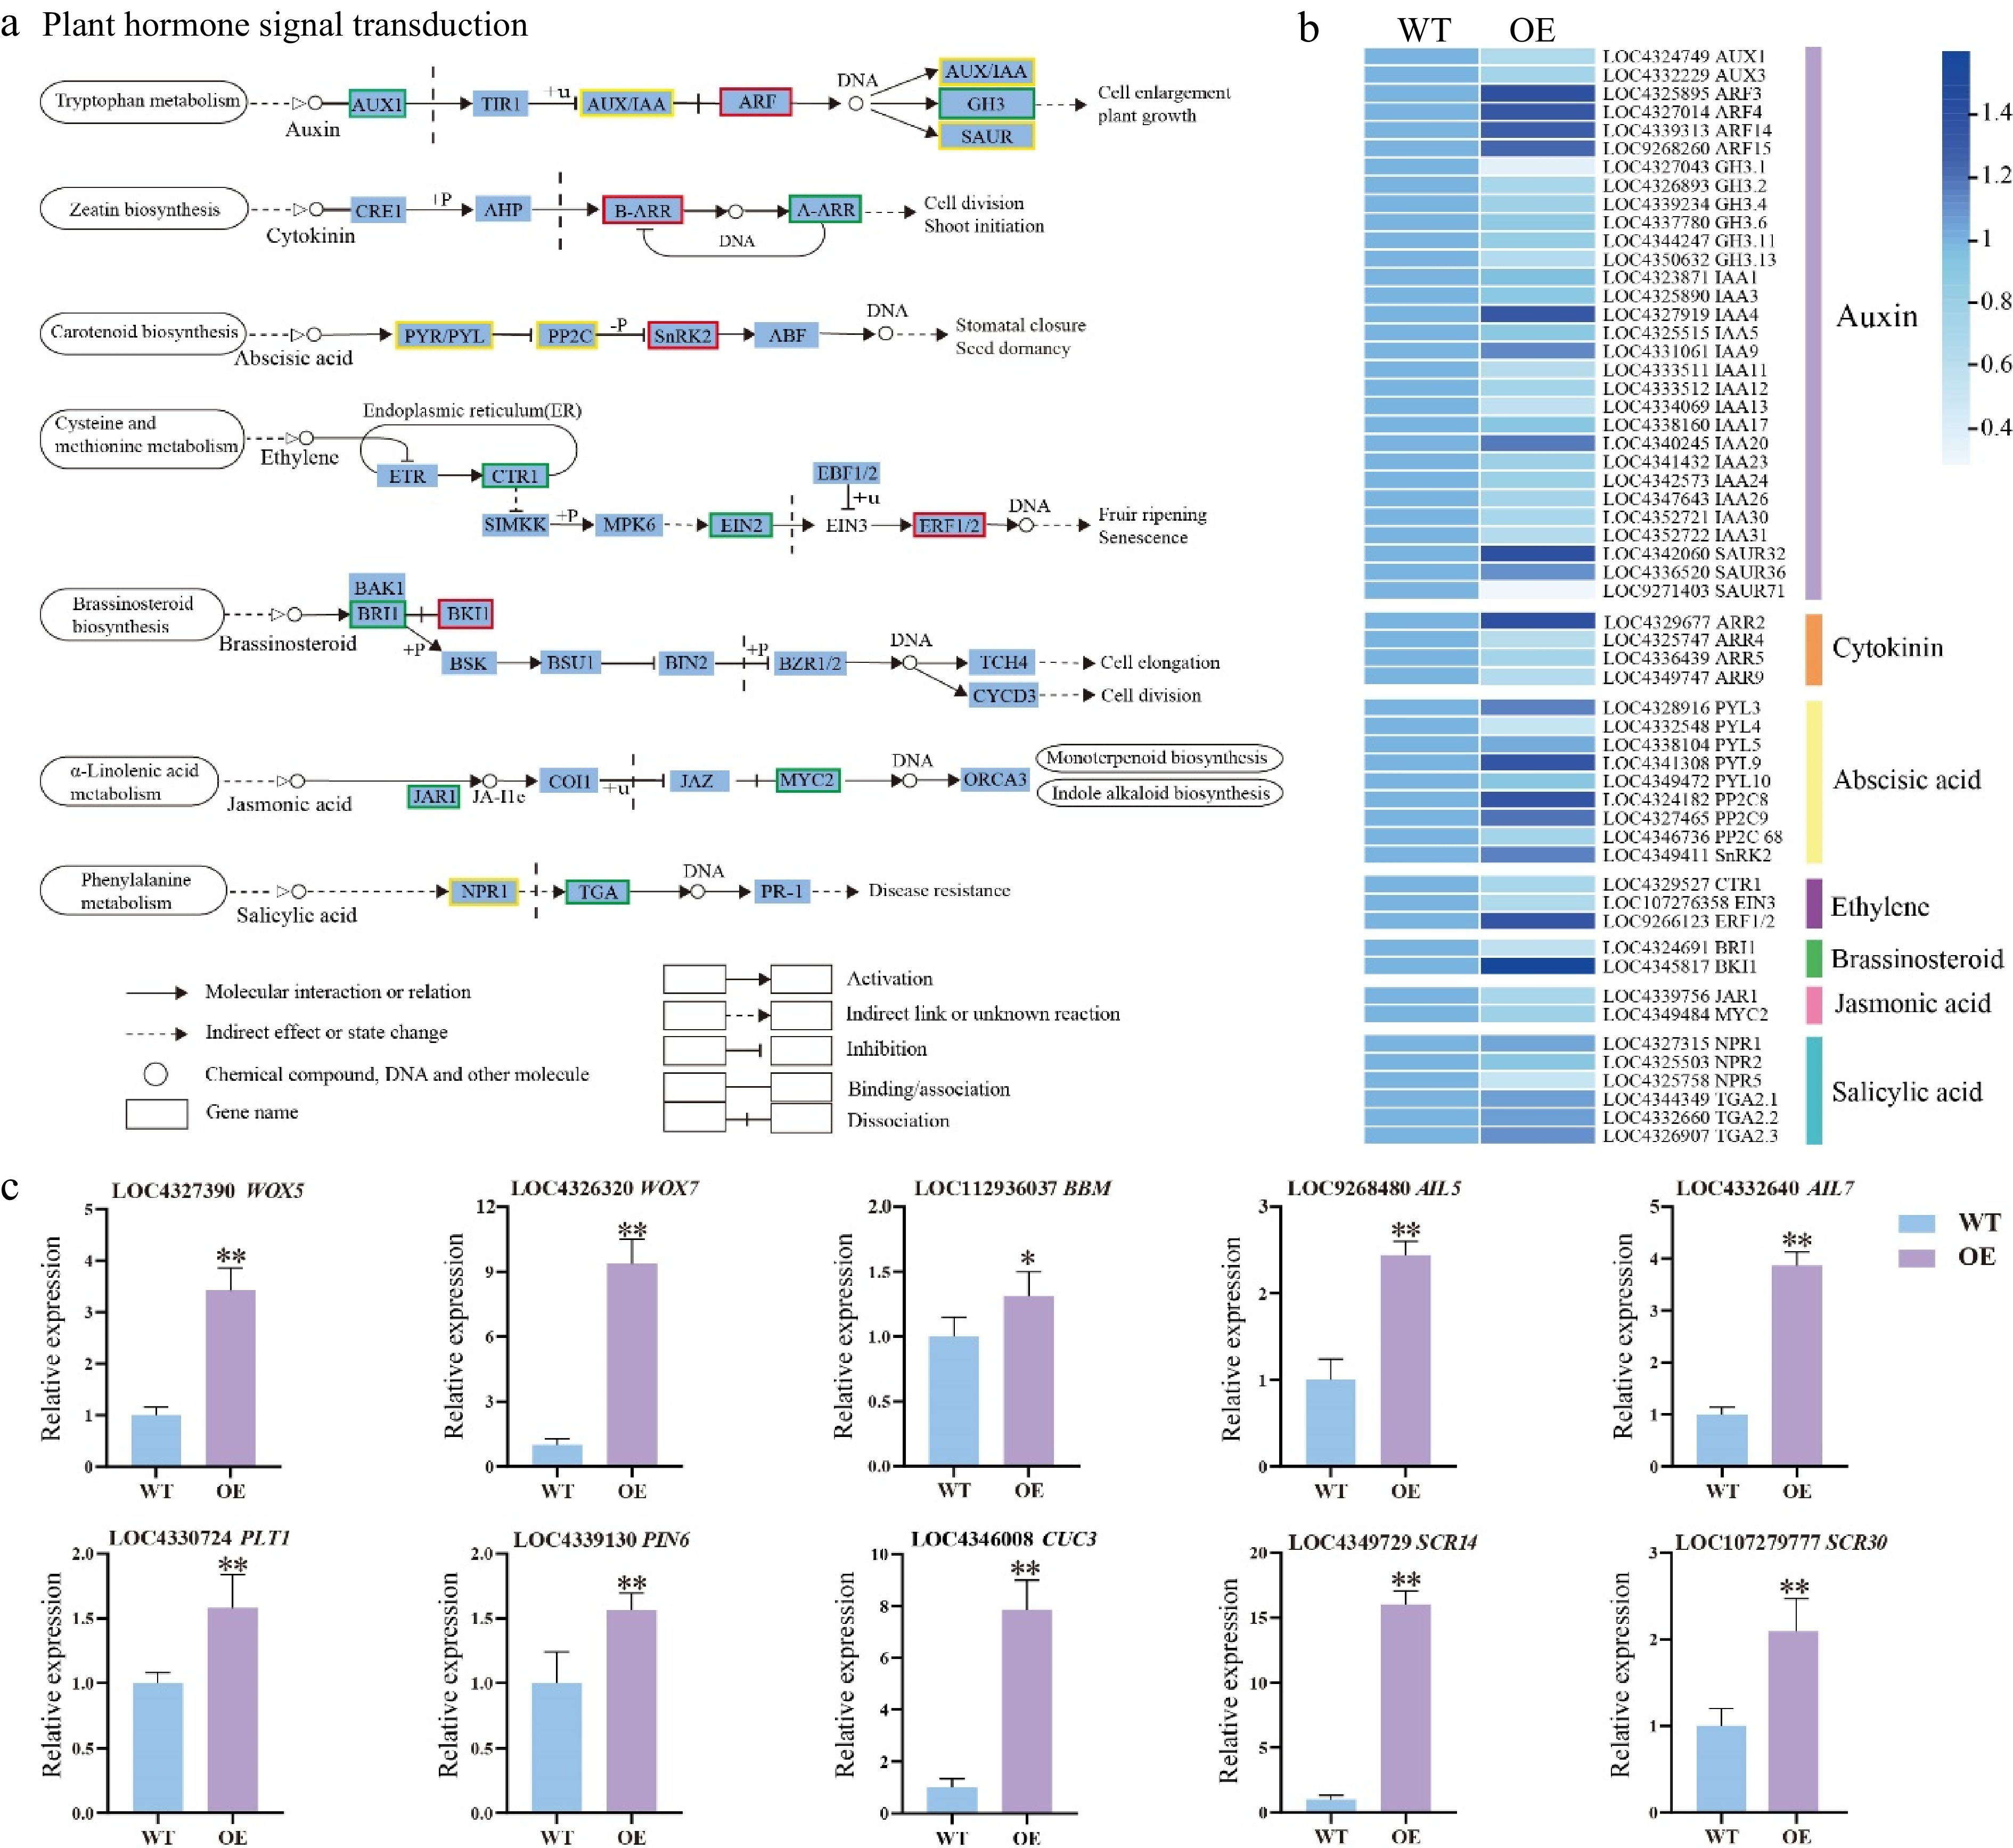
Figure 5.
DEGs related to phytohormone signaling transduction pathway and shoot development-related genes. (a) Expression of the phytohormone signal pathway. The color of the background frame indicates the pattern of gene expression: red for upregulation, green for downregulation, and yellow for both upregulation and downregulation. The bars represent standard deviation. (b) Heatmap of the DEGs related to plant hormone signal transduction pathway. (c) Relative expression of shoot development-related genes. Error bars = standard deviation. * p < 0.05, ** p < 0.01 (Student's t-test).
-
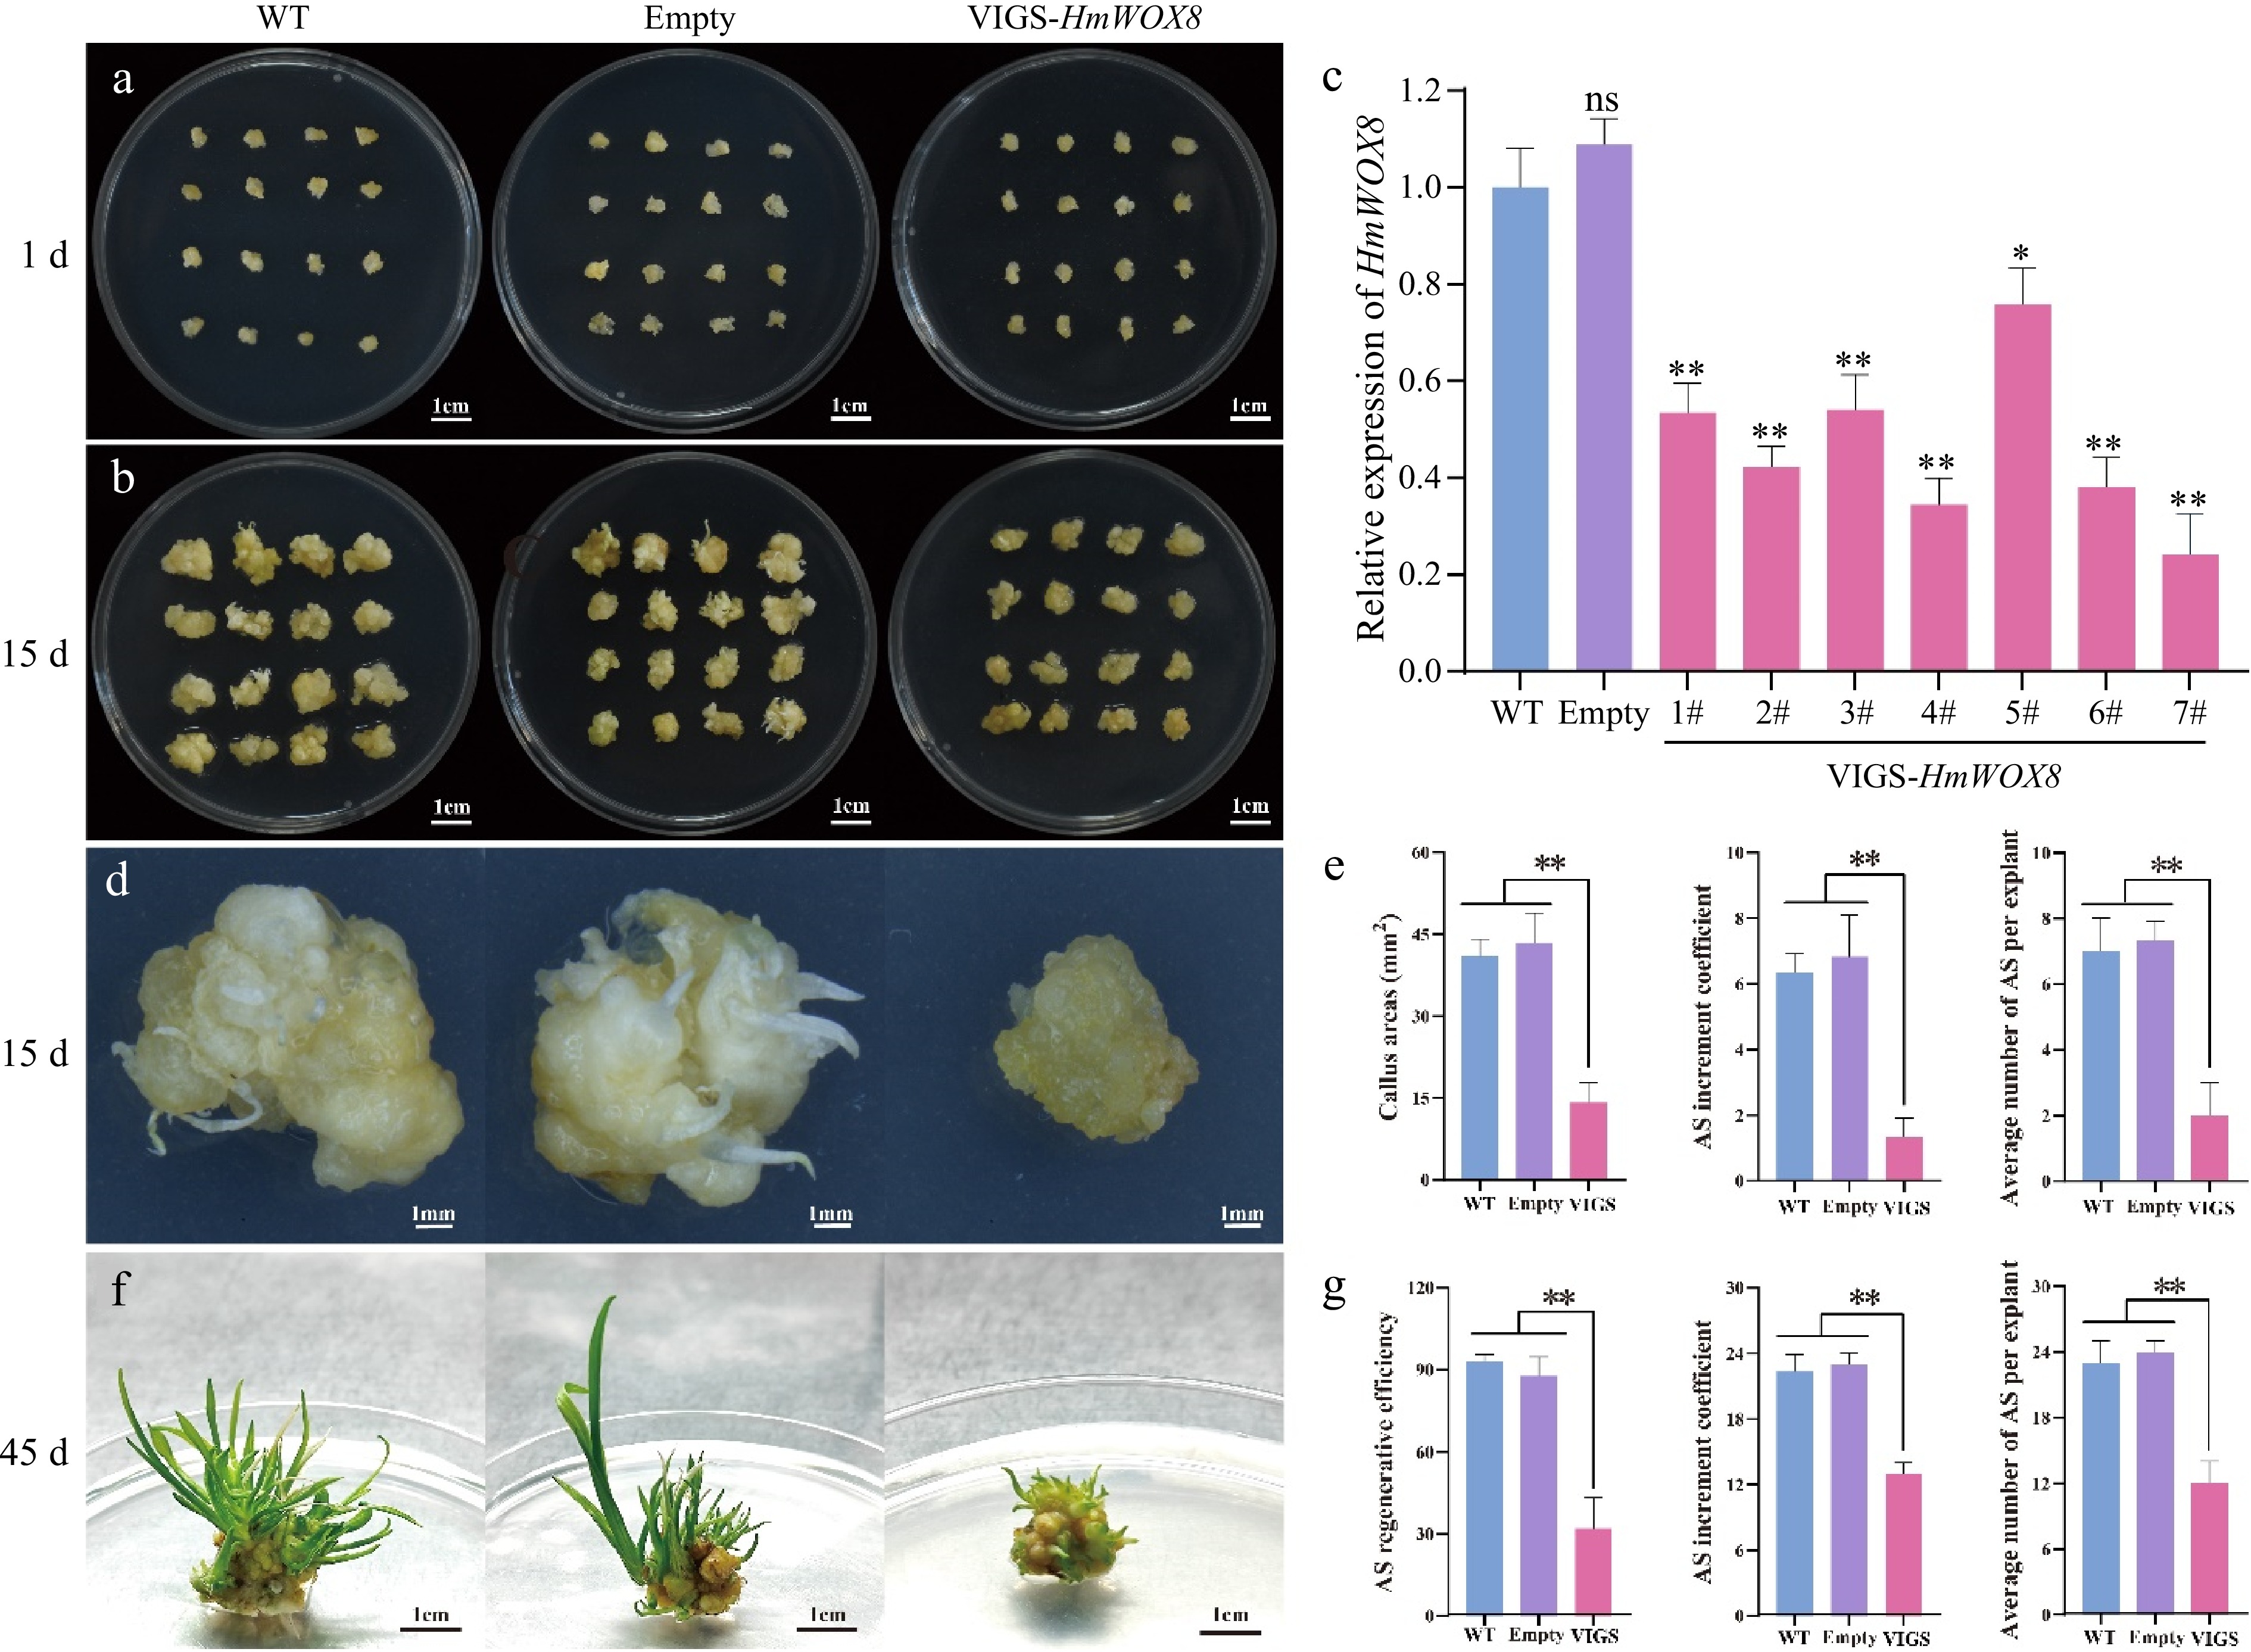
Figure 6.
TRV-mediated VIGS of the HmWOX8 gene in H. middendorffii. (a) Callus morphology of VIGS-HmWOX8 lines cultured on induction medium for 1 d compared with WT (uninfected callus) and empty (infection with pTRV1+pTRV2 agrobacterium). Scale bar = 1 cm. (b) Callus morphology of VIGS-HmWOX8 lines cultured on induction medium for 15 d compared with WT and empty. Scale bar = 1 cm. (c) HmWOX8 expression levels in WT, empty and VIGS-HmWOX8 lines. (d) Morphology of callus and AS regeneration in WT, empty, and VIGS-HmWOX8 in 15 d. Scale bar = 1 cm. (e) Callus areas, AS increment coefficient and the average number of per explant of WT, empty, and VIGS-HmWOX8 lines in 15 d. (f) Morphology of AS regenerated from callus in WT, empty, and VIGS-HmWOX8 for 45 d. Scale bar = 1 cm. (g) AS regenerative efficiency, AS increment coefficient and average number of AS per explant of WT, empty, and VIGS-HmWOX8 lines in 45 d. Error bars = standard deviation. *p <0.05, **p <0.01 (Student's t-test).
-
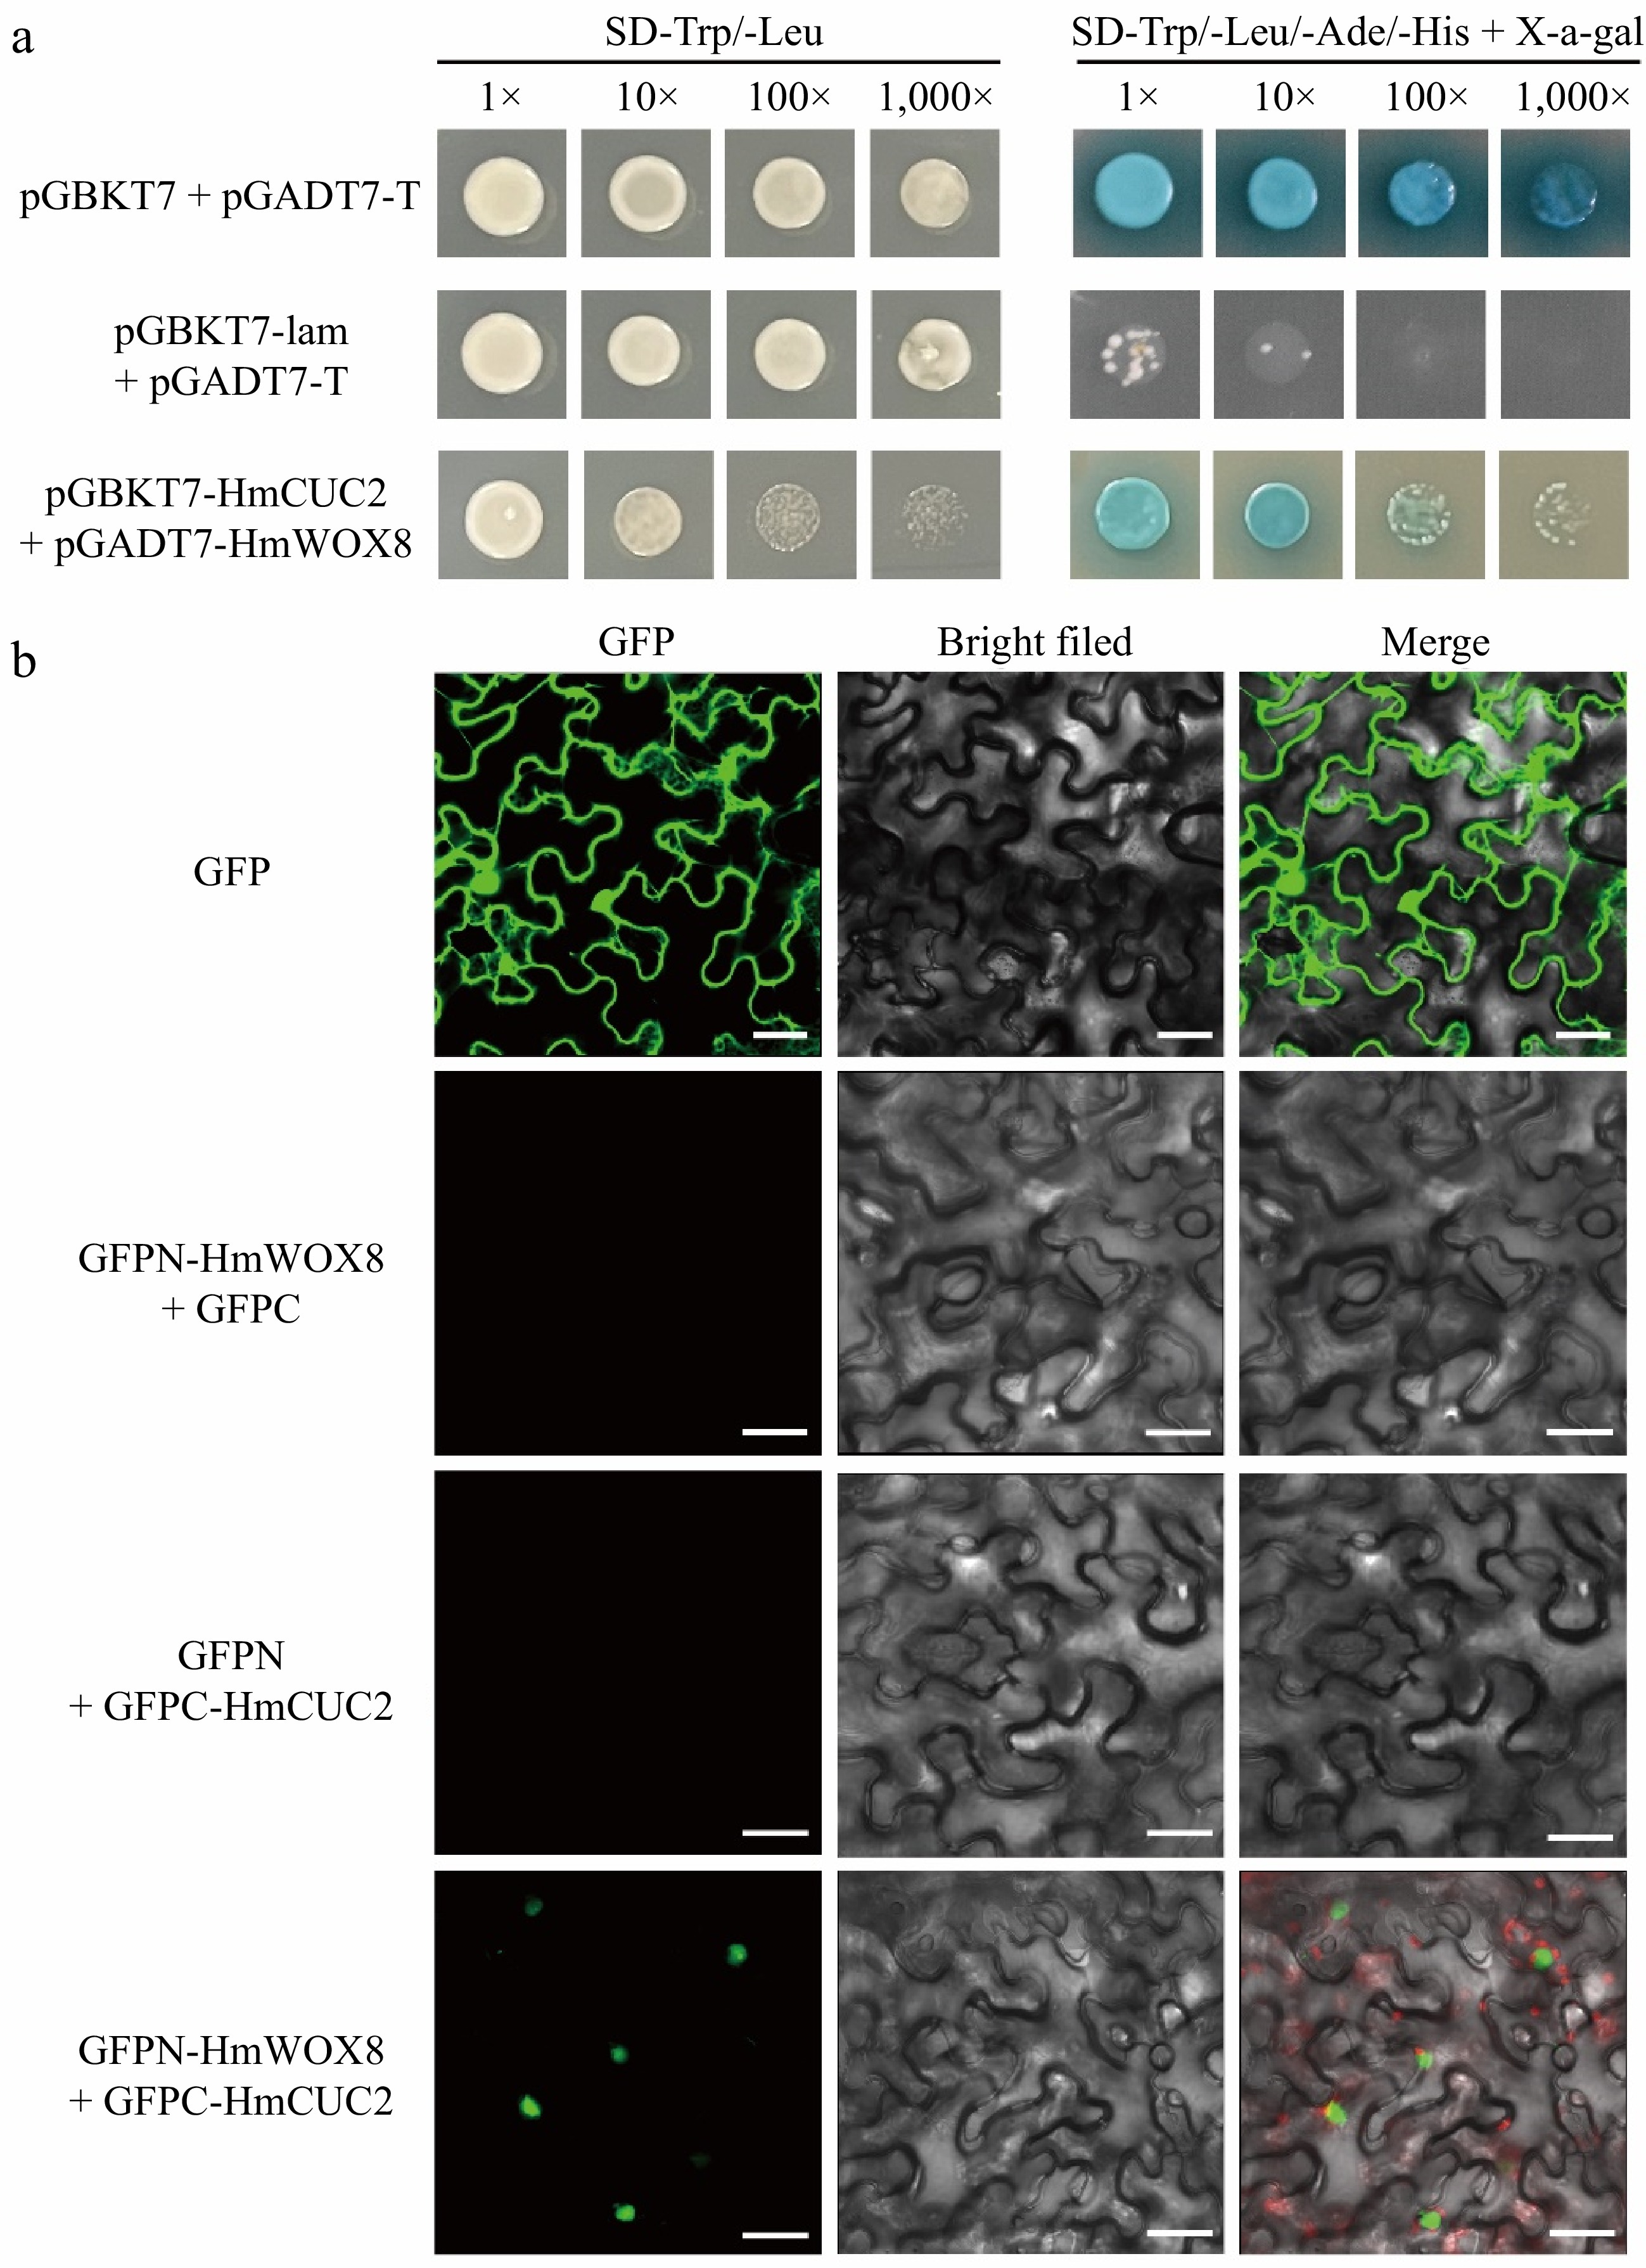
Figure 7.
Direct interaction between HmWOX8 and HmCUC2. (a) Yeast two-hybrid assay. pGBKT7 + pGADT7-T was used as a positive control, and pGBKT7-lam + pGADT7-T was used as a negative control. (b) Bimolecular fluorescence complementation assay. GFP was used as a positive control, GFPN-HmWOX8 + GFPC and GFPN + GFPC-HmCUC2 were used as a negative control. Scale bar = 30 μm.
-
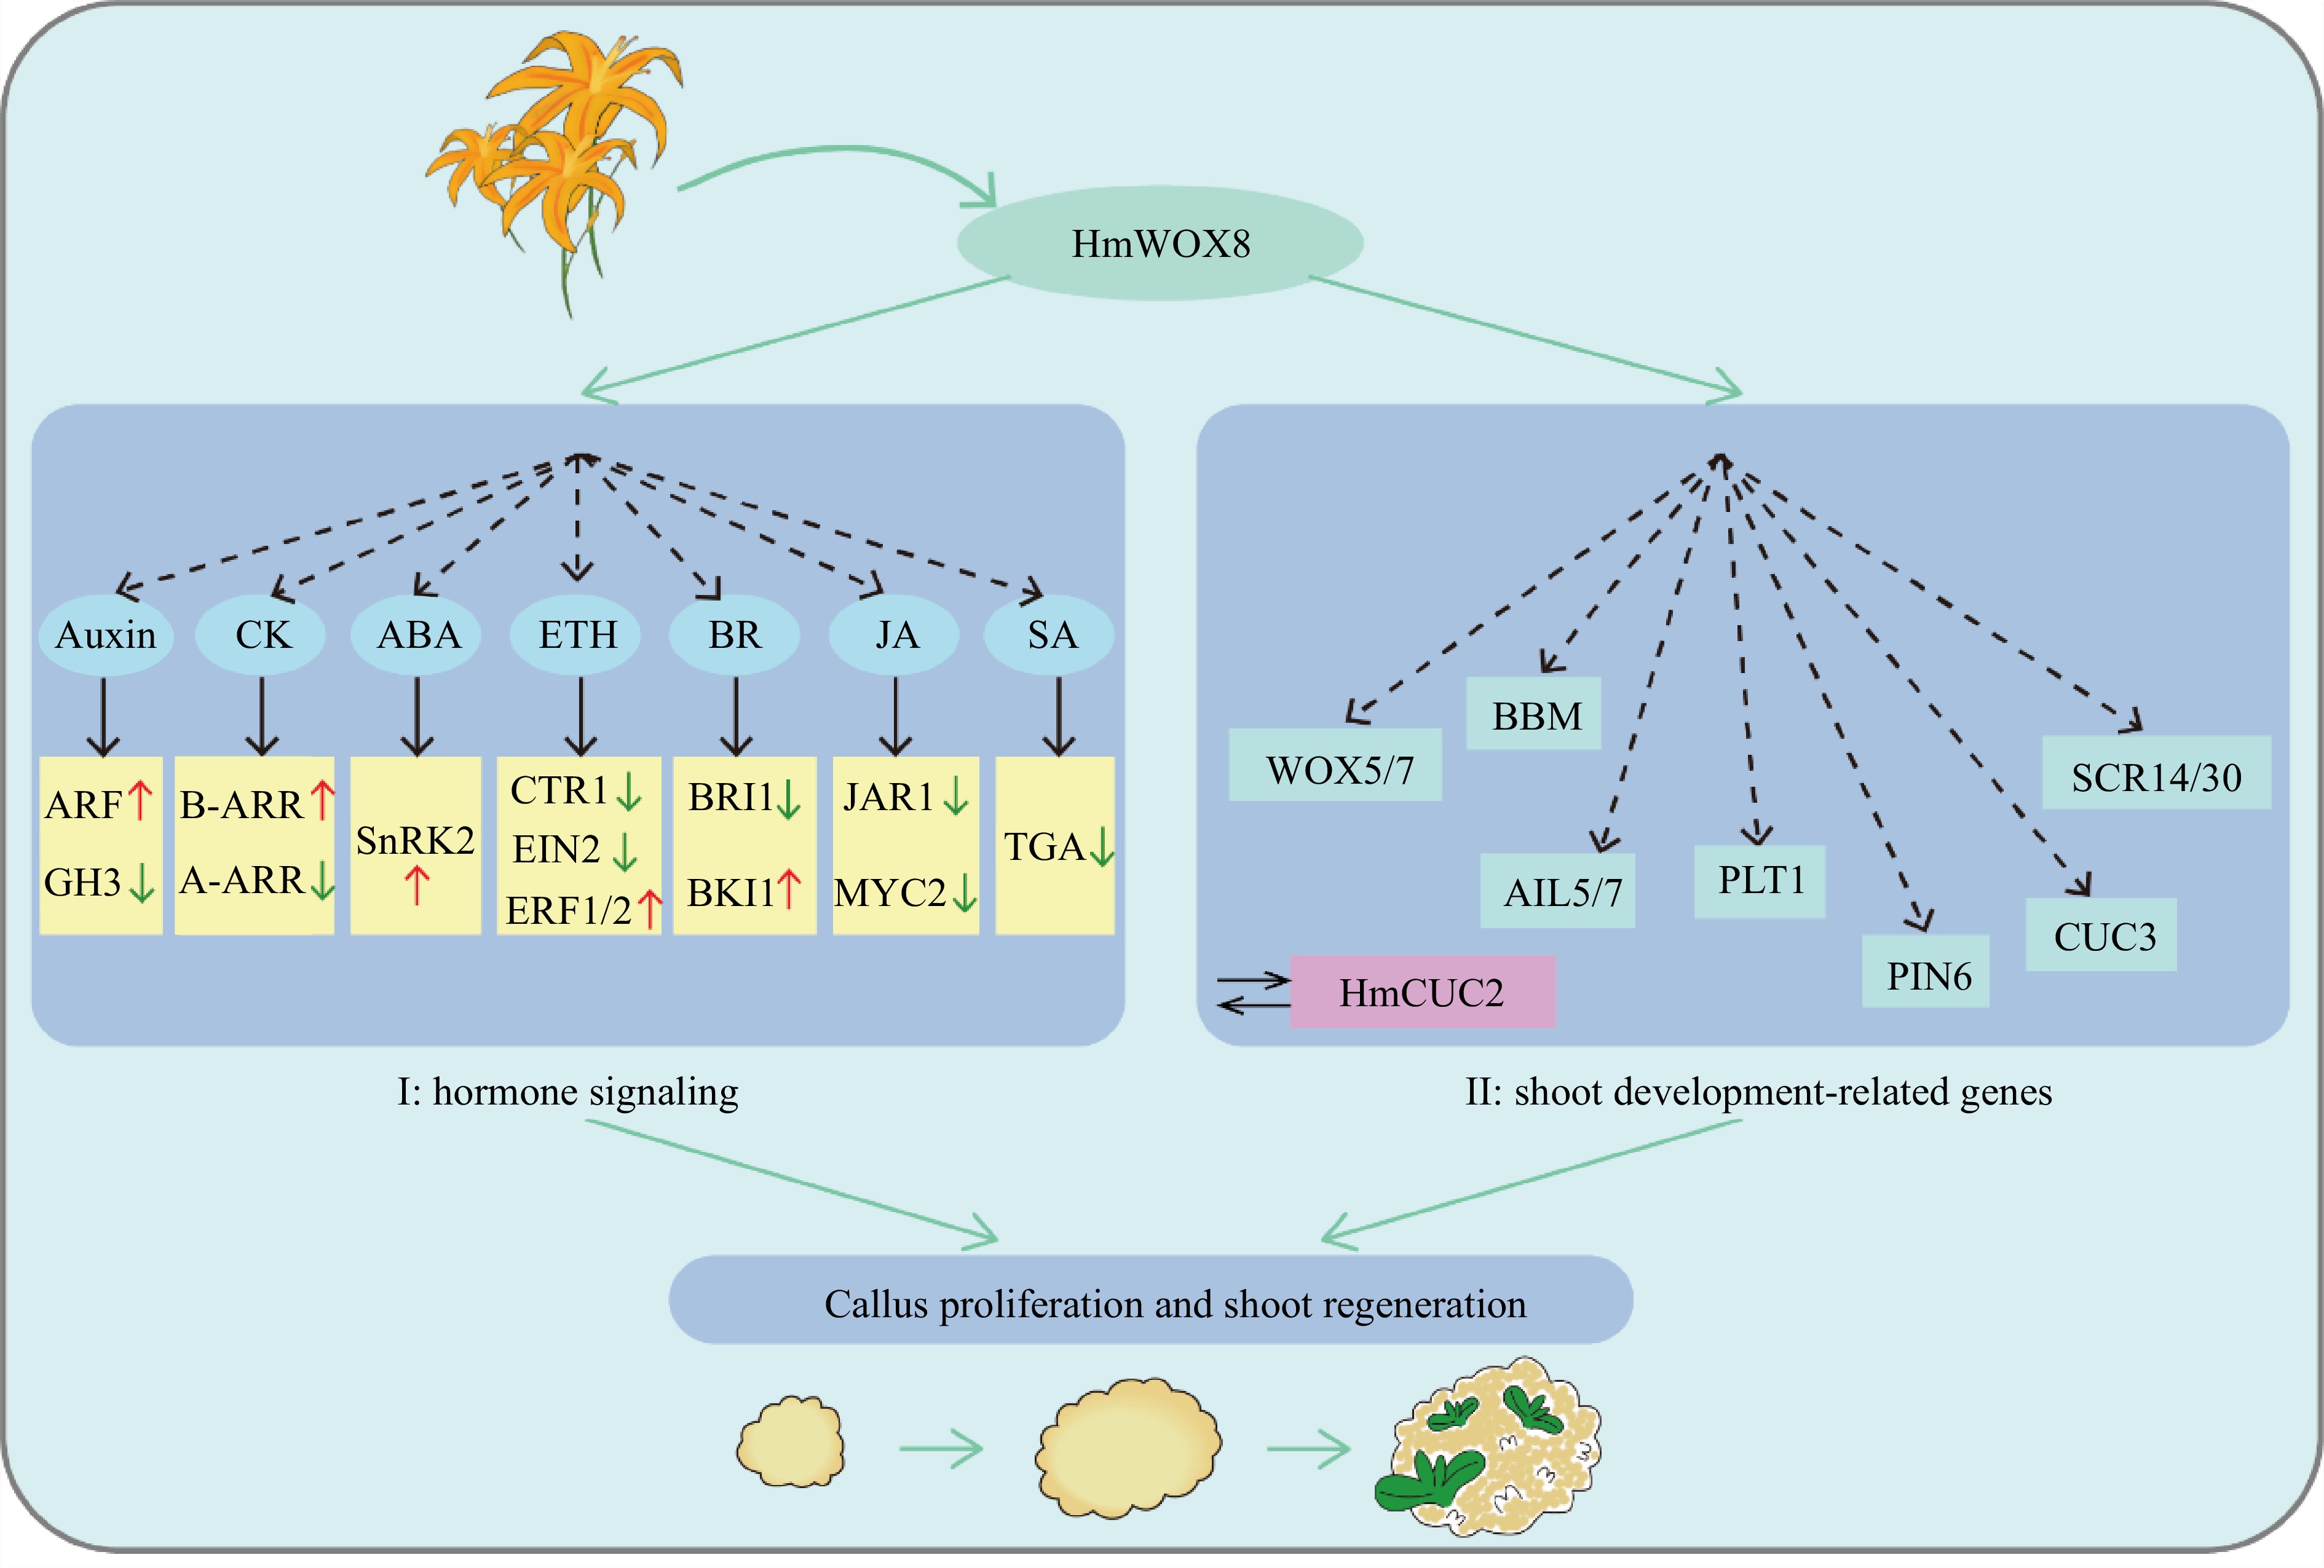
Figure 8.
Hypothetical model of HmWOX8 regulating callus proliferation and shoot regeneration.
Figures
(8)
Tables
(0)