-
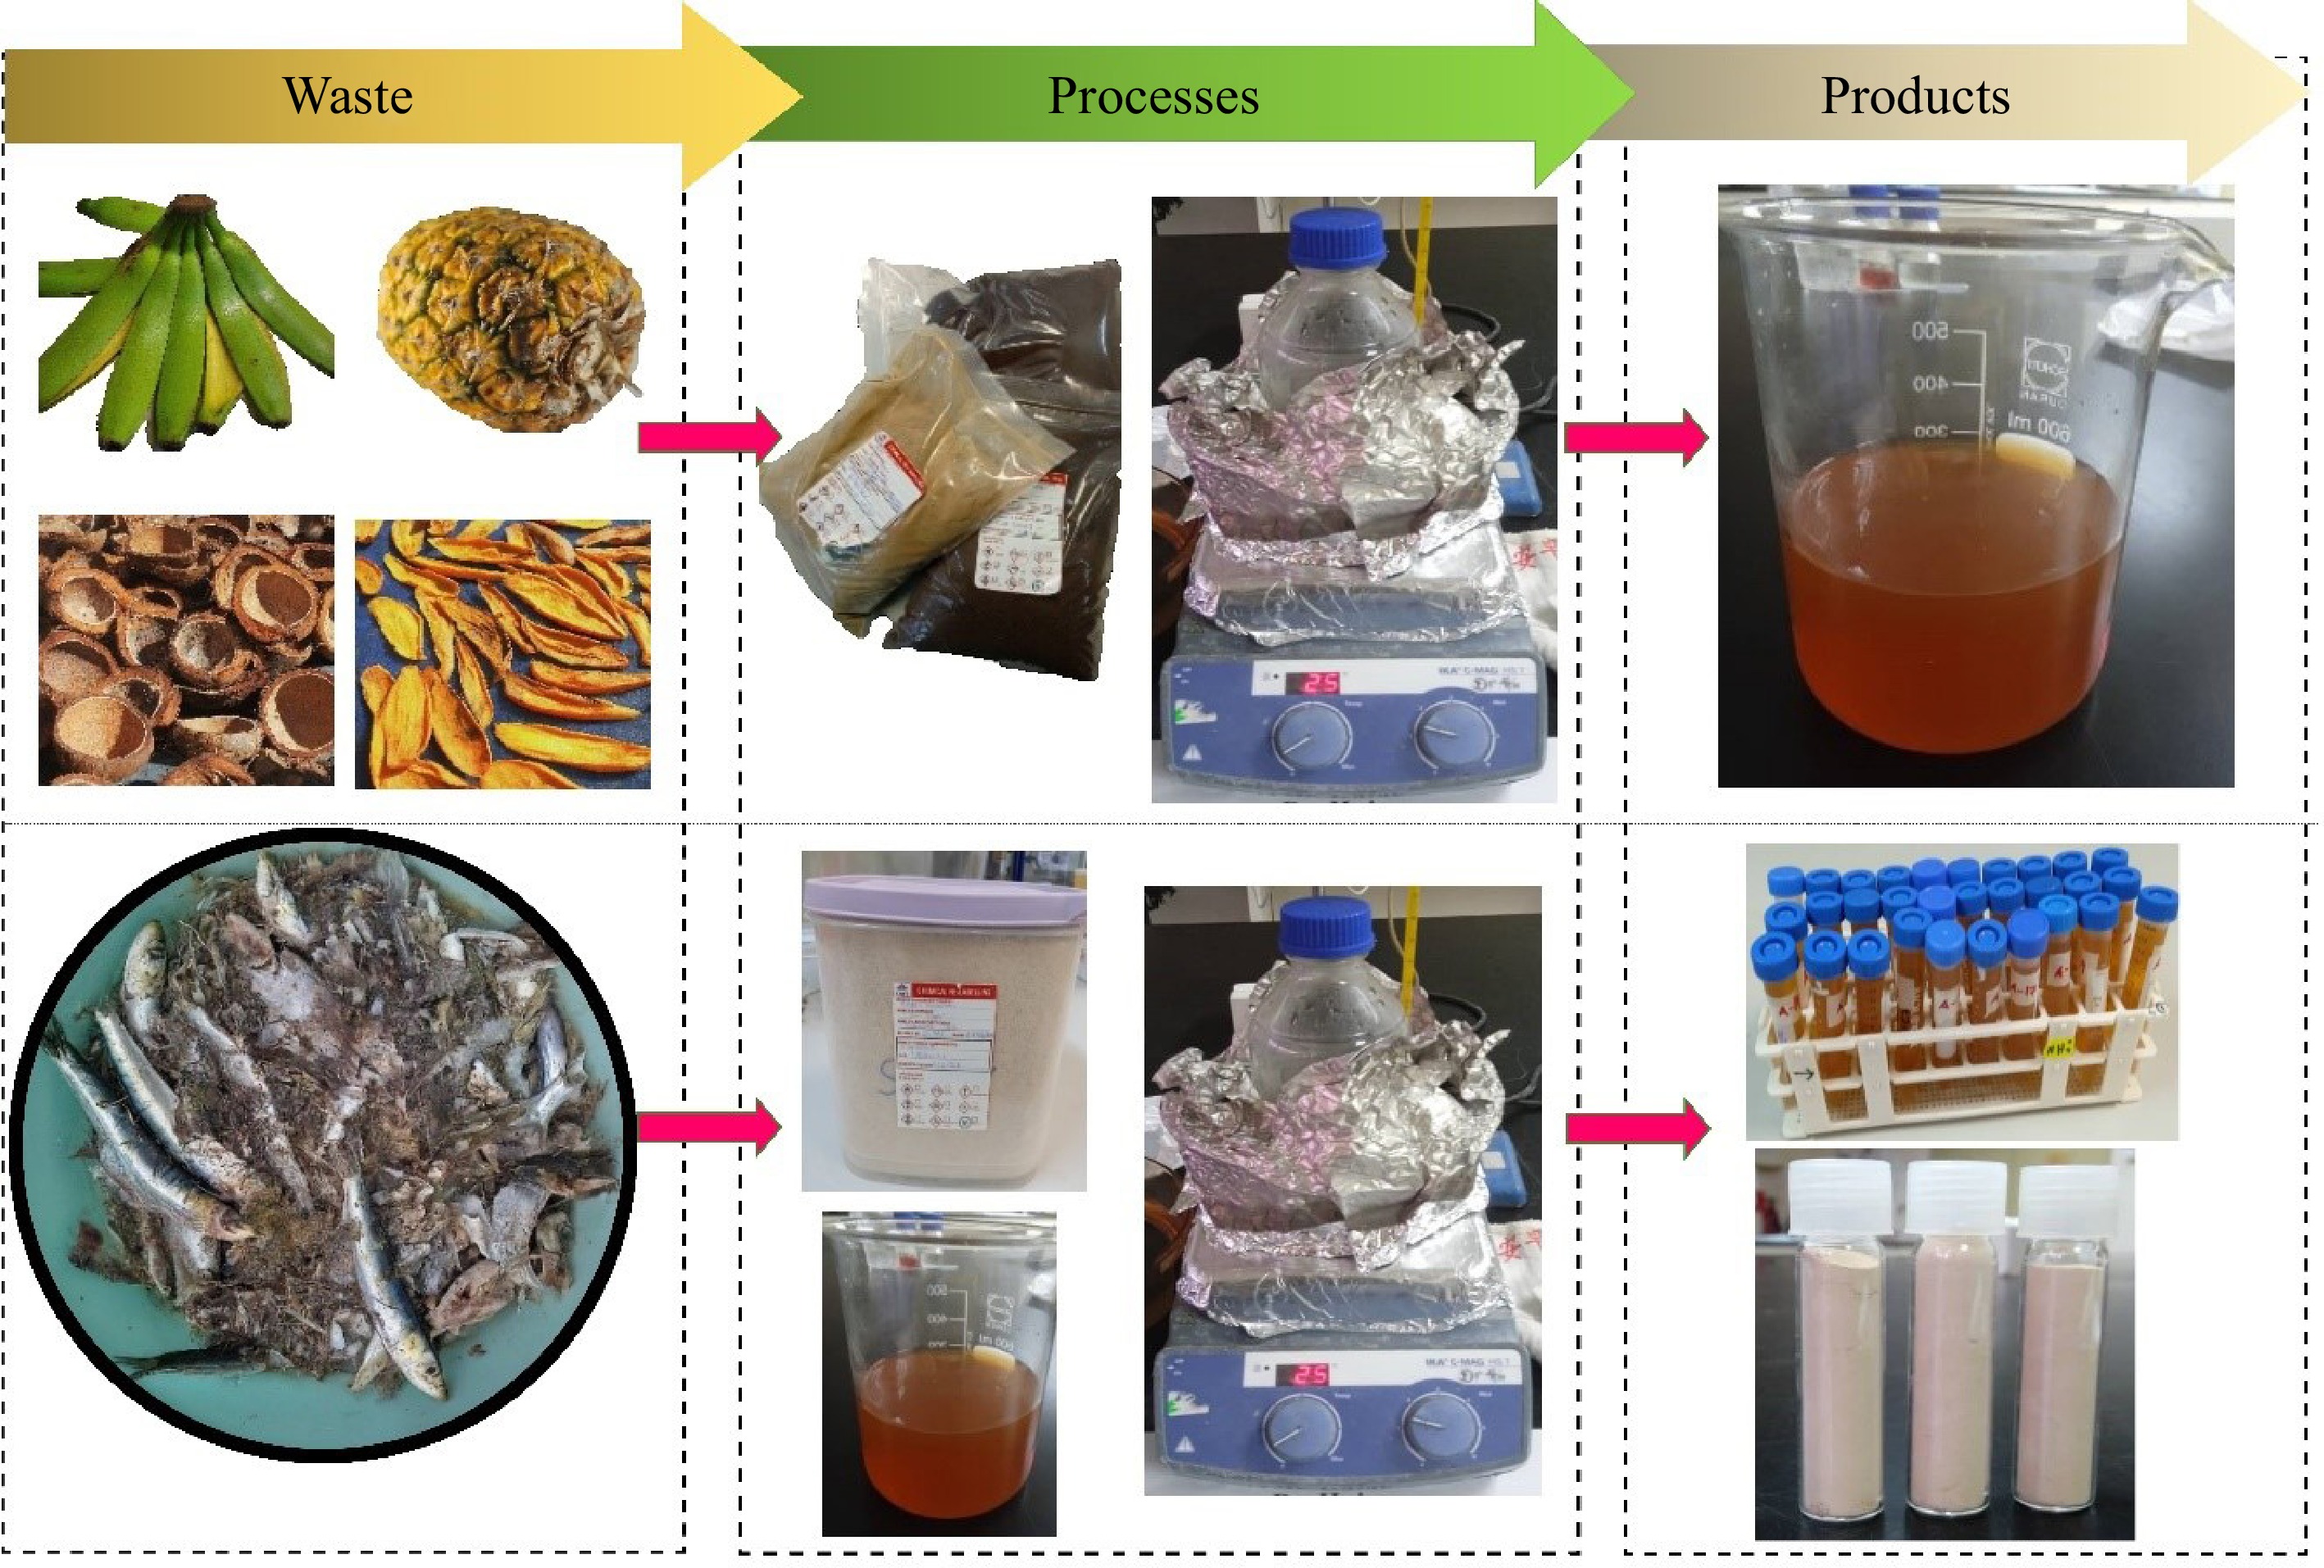
Figure 1.
The processes involved in preparation of water extracts from fruit waste (top), and extraction of collagen from sardine bone using the water extracts (bottom).
-
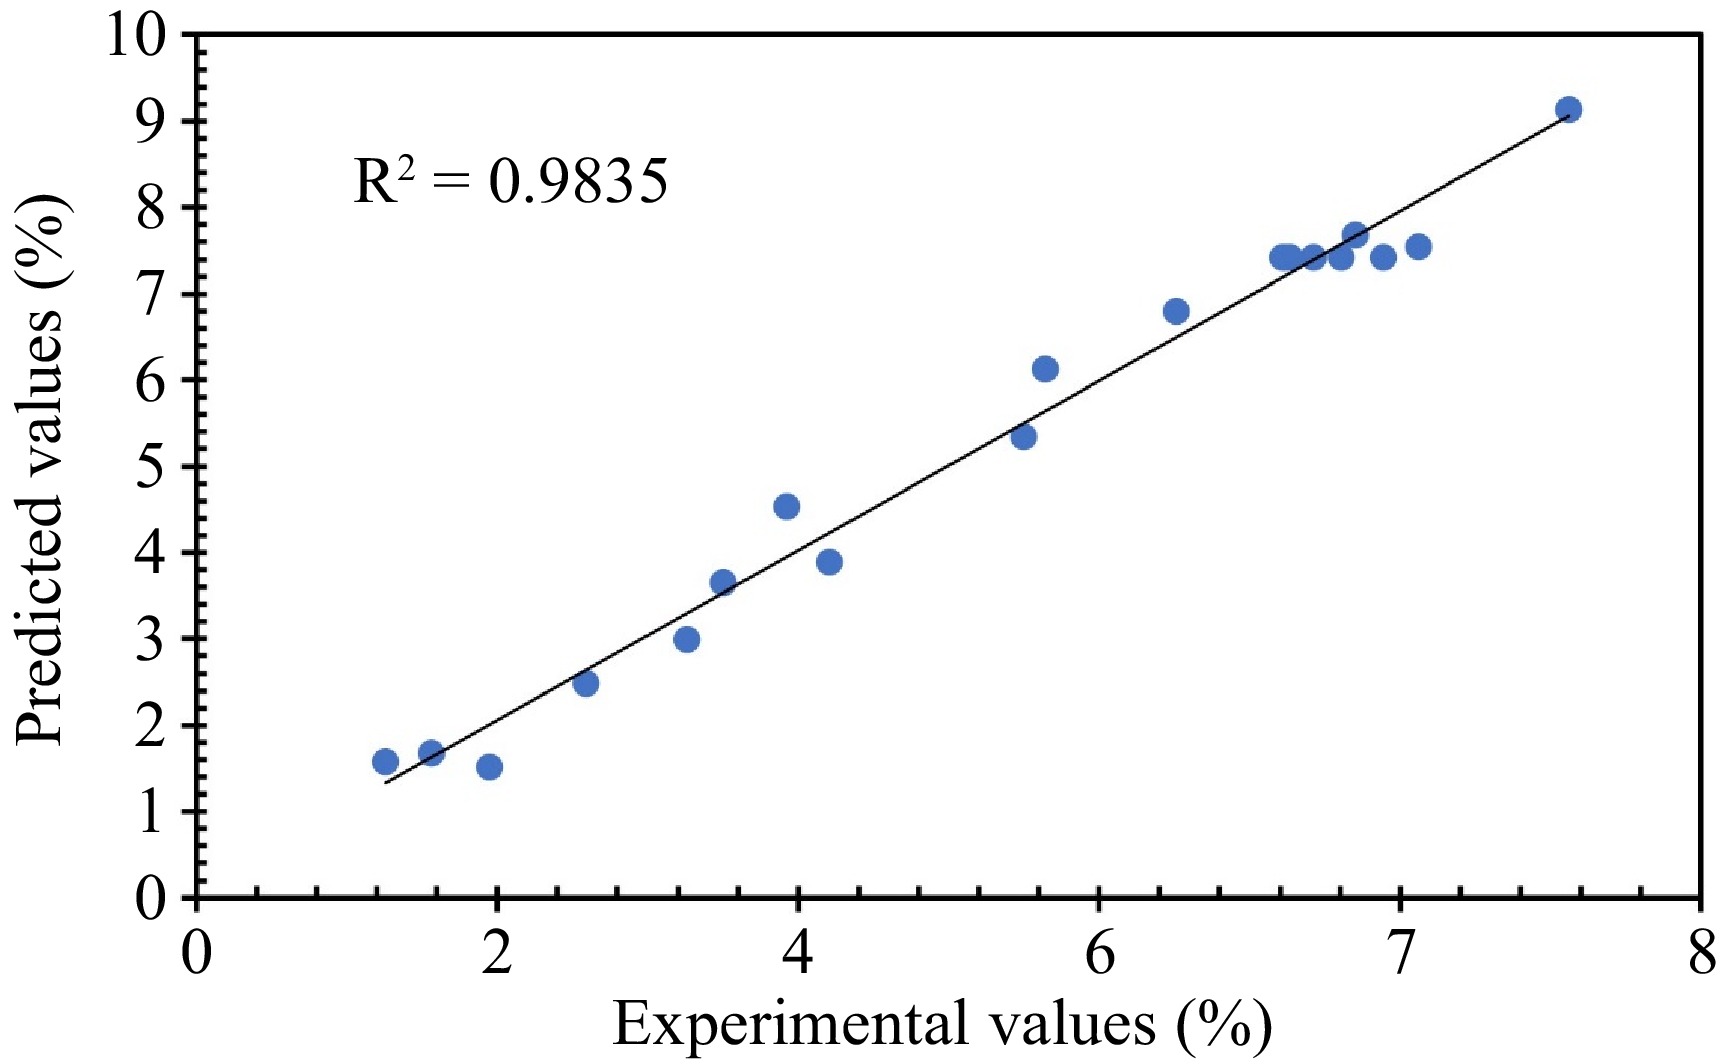
Figure 2.
The plot of the predicted values, calculated by fitting the models, vs experimental values for collagen extraction yield using the water extract from BP.
-
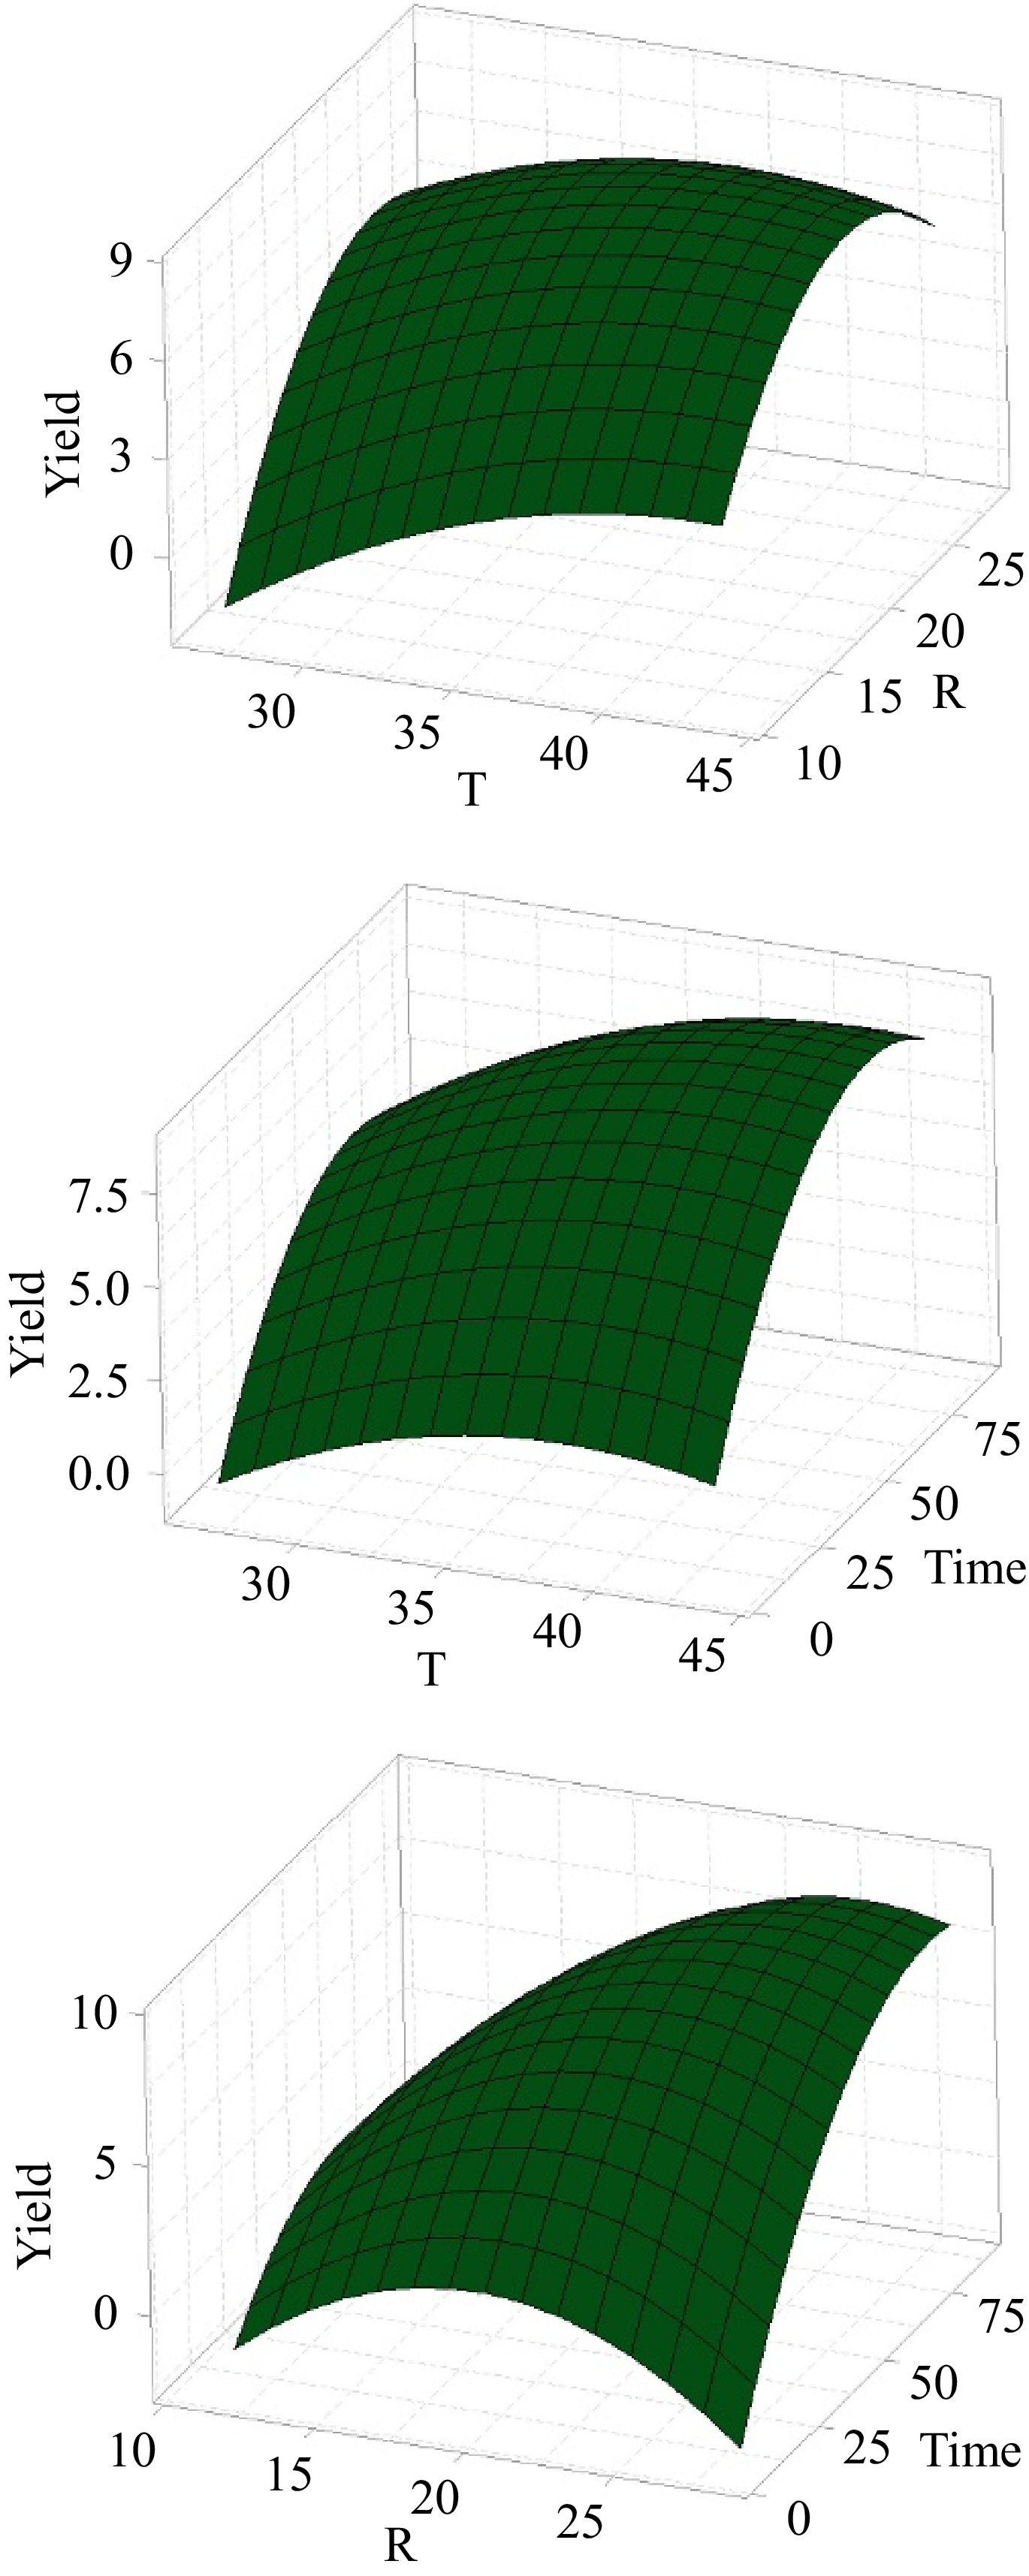
Figure 3.
Surface plots for the collagen extraction from sardine bone in water extract of BP.
-
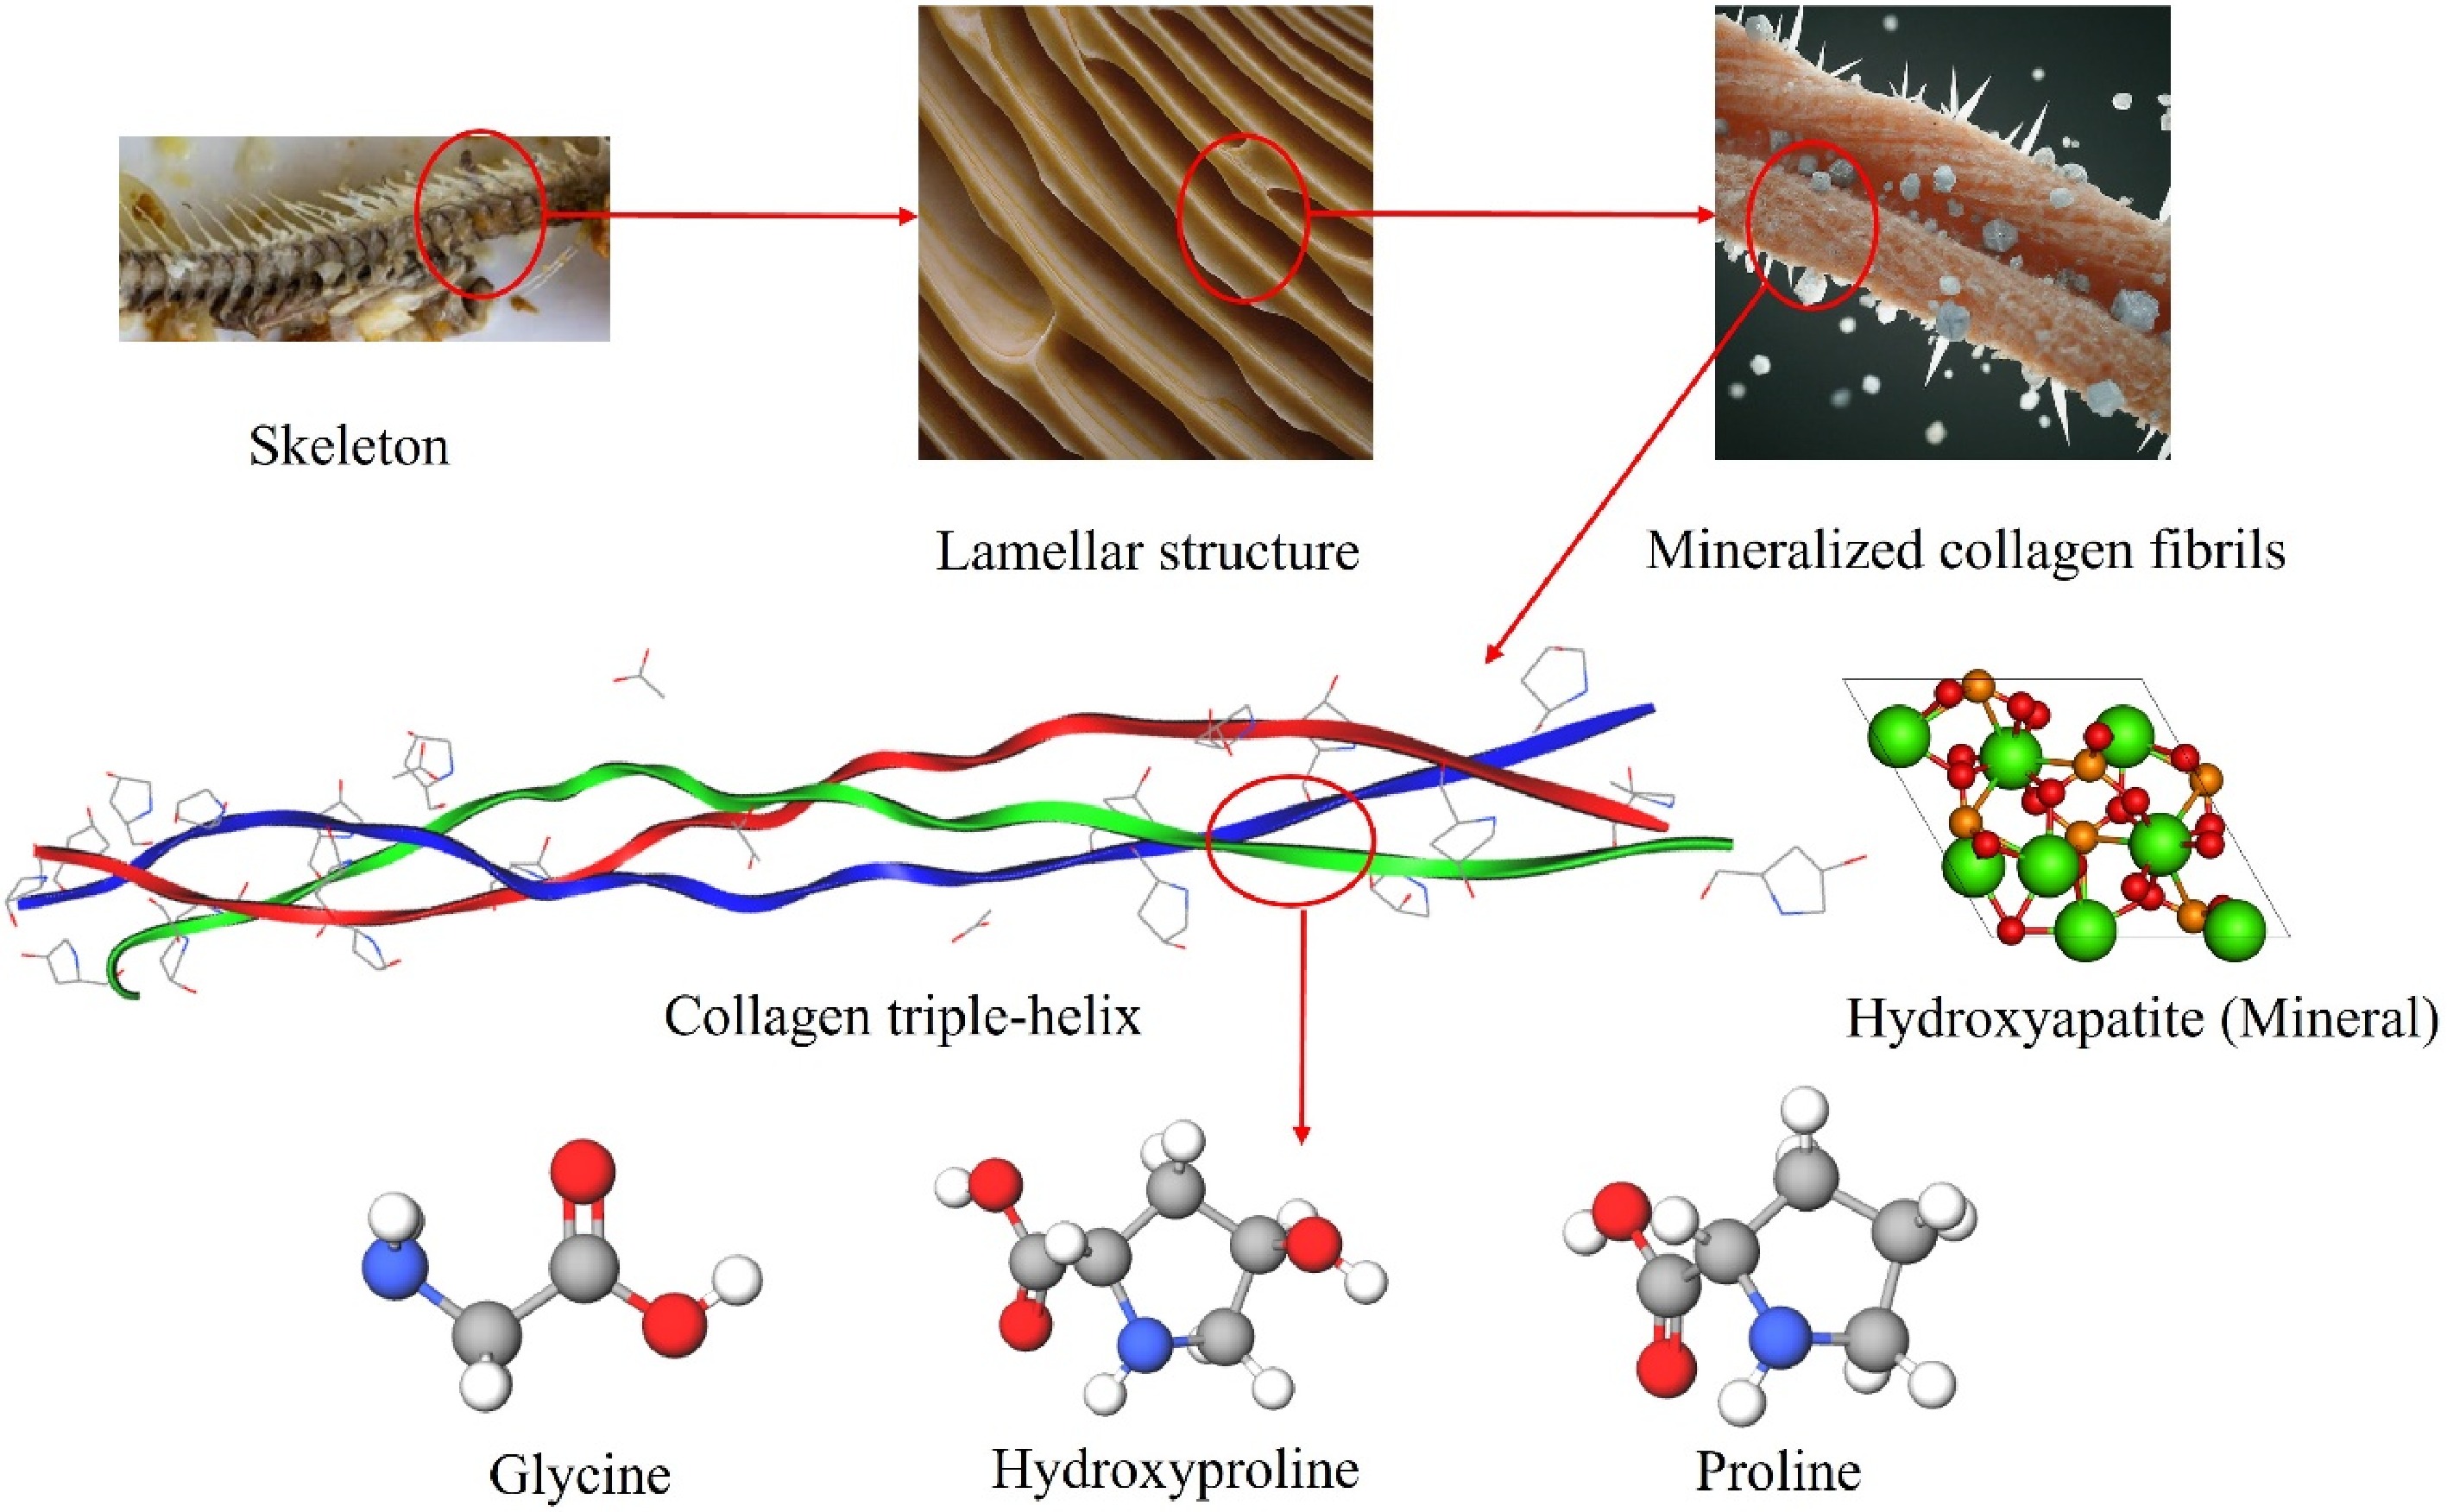
Figure 4.
Hierarchical structure of fish bone and amino acids found in collagen structure[33].
-
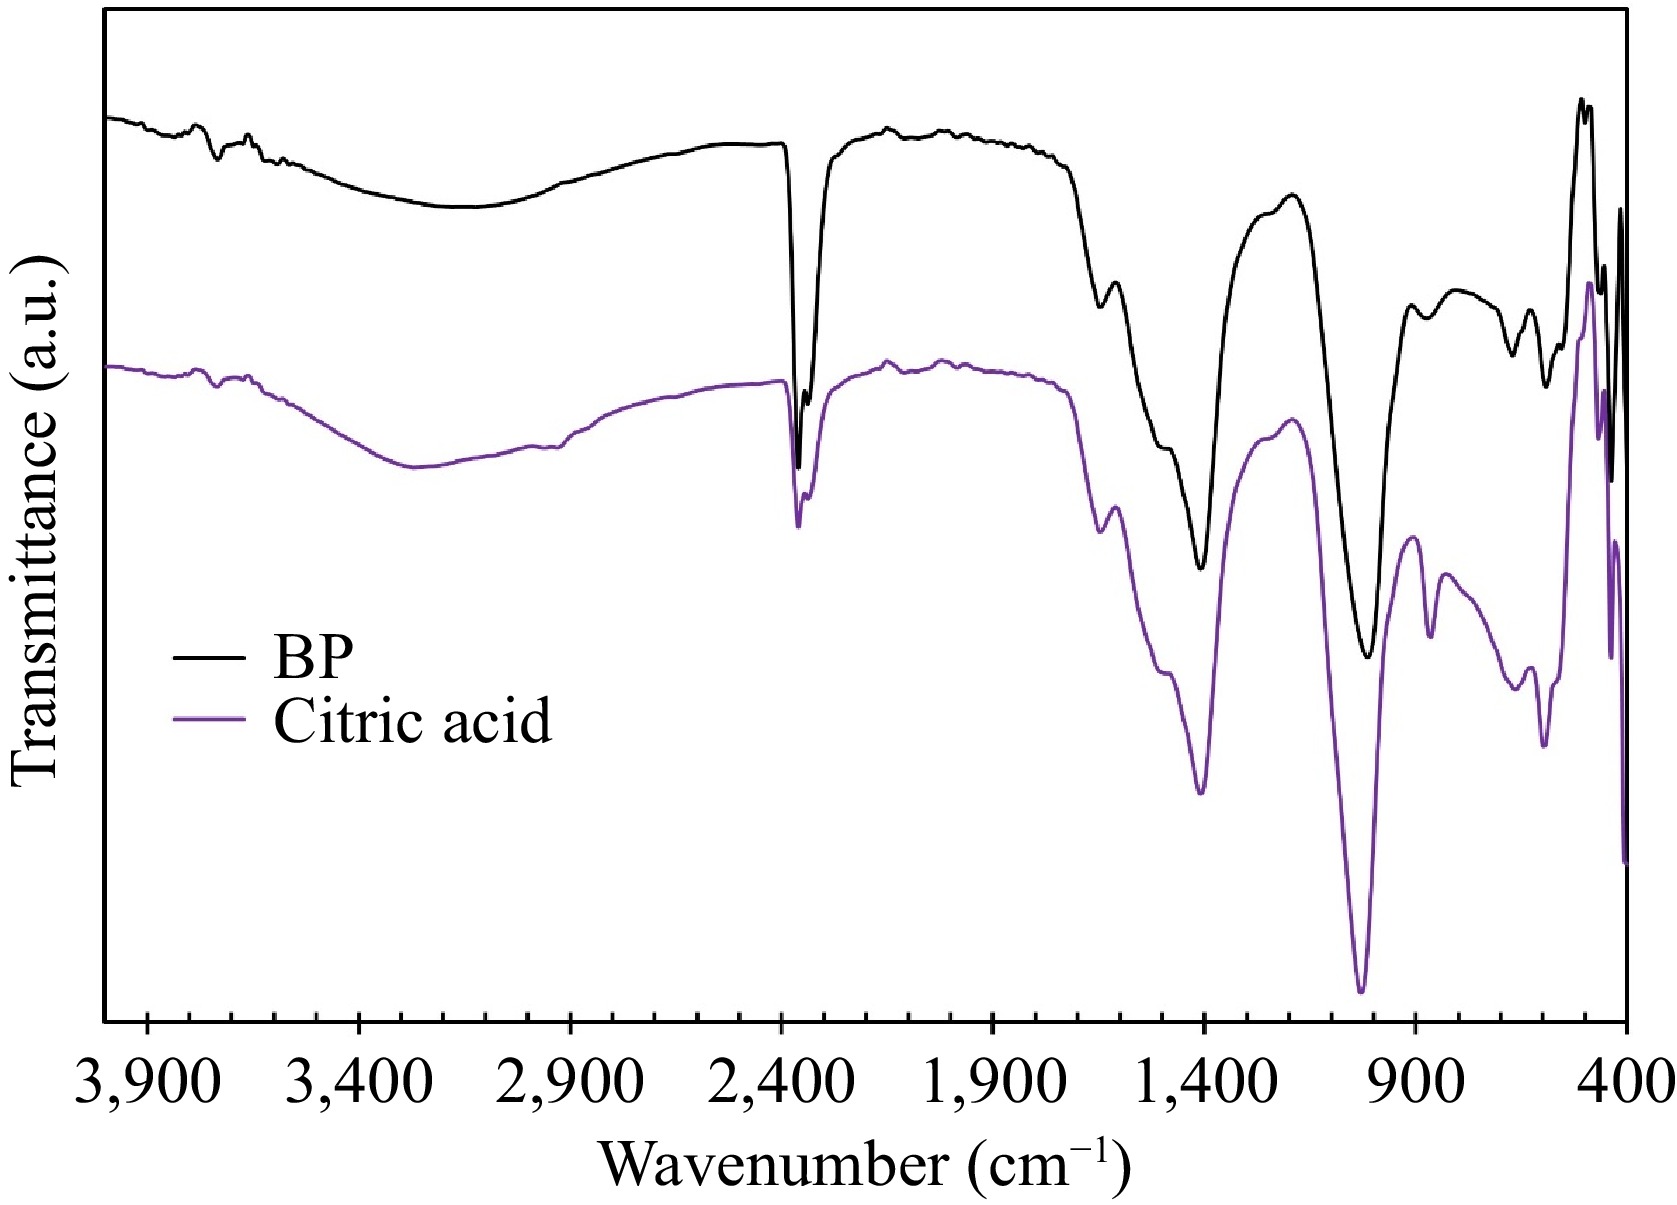
Figure 5.
FT-IR spectra of the collagen samples extracted in citric acid and BP.
-
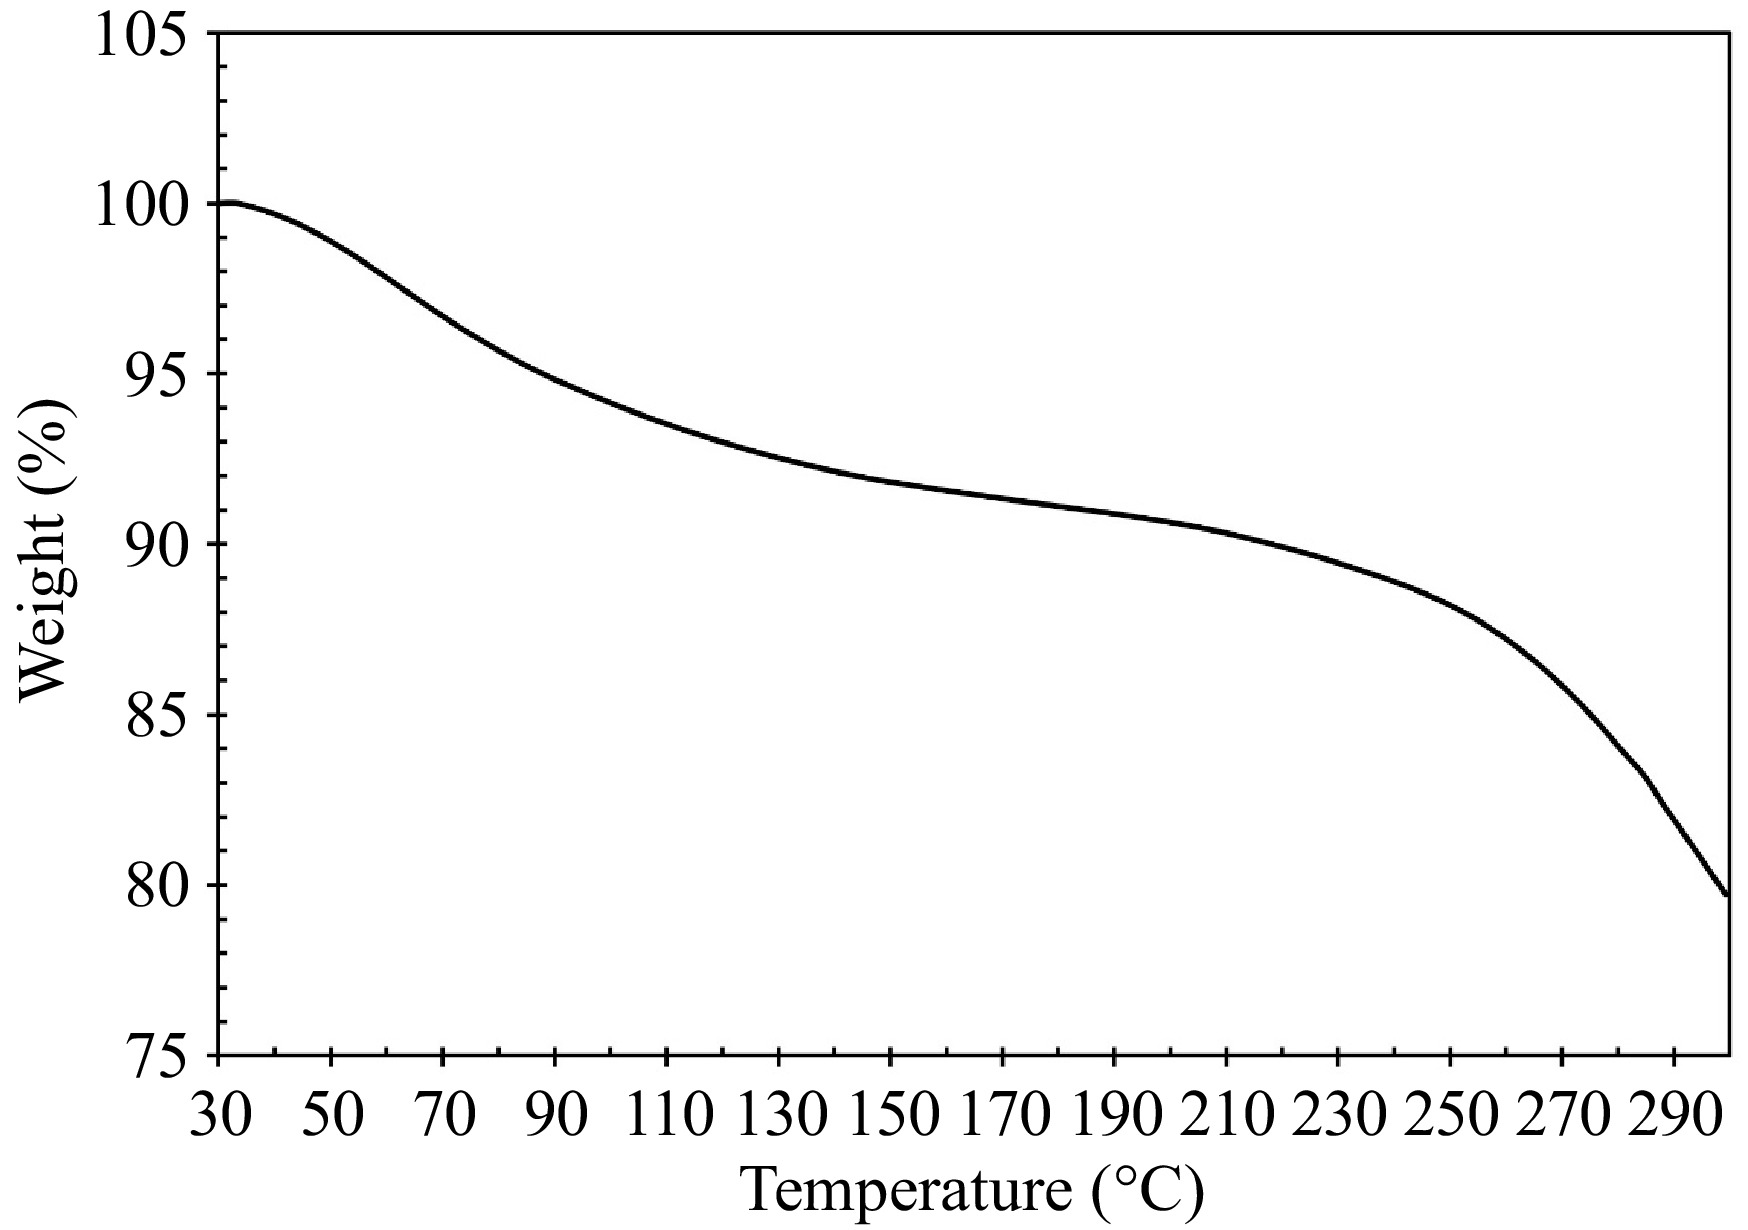
Figure 6.
TGA curve for collagen analysis.
-
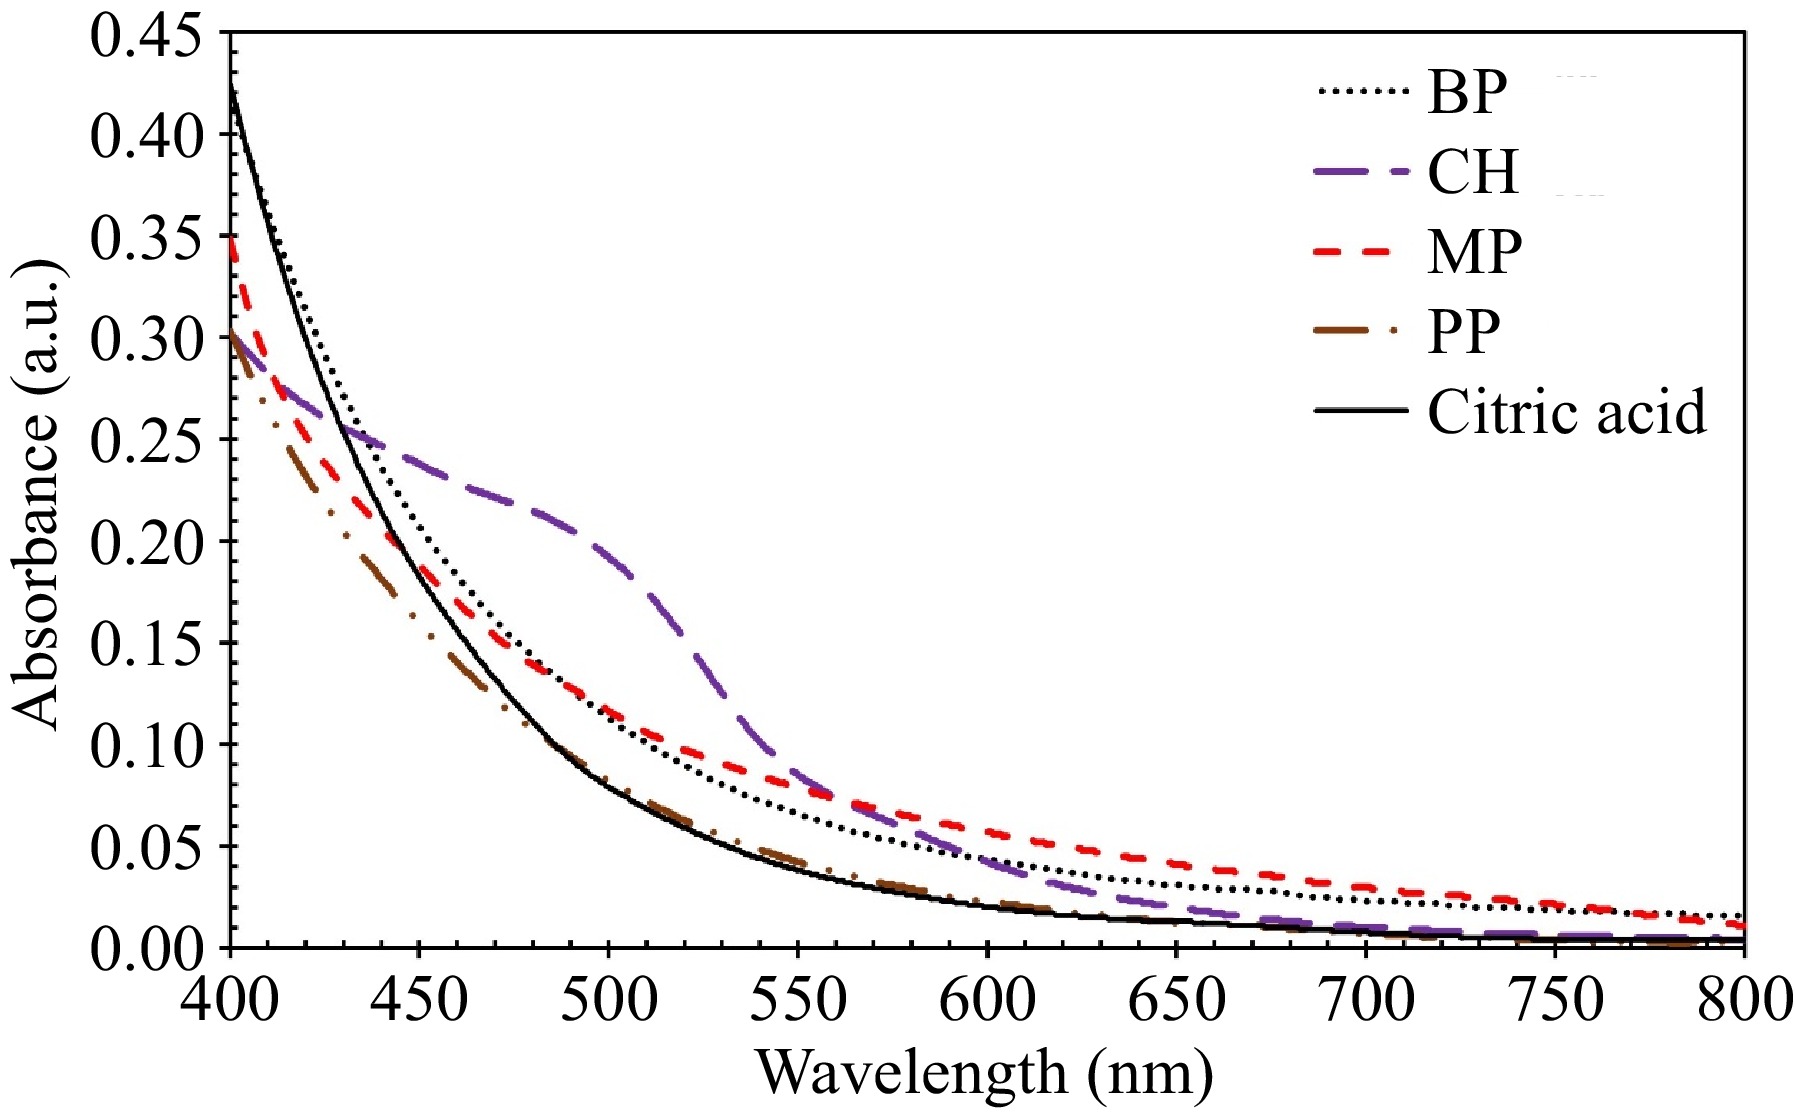
Figure 7.
UV-Vis spectra of water extracts from different types of biomass waste including BP, CH, PP, and MP, along with citric acid as a reference.
-
Trial no. Variables Yield (%) T (°C) R (g mL−1) time (h) 1 35 1:20 48 7.2 2 30 1:25 24 3.3 3 40 1:15 24 3.5 4 30 1:15 24 2.0 5 35 1:20 48 7.9 6 35 1:20 8 1.3 7 40 1:25 72 9.1 8 40 1:15 72 5.5 9 27 1:20 48 3.9 10 30 1:15 72 2.6 11 35 1:12 48 1.6 12 35 1:20 88 6.5 13 35 1:28 48 5.6 14 35 1:20 48 7.6 15 35 1:20 48 7.3 16 40 1:25 24 4.2 17 43 1:20 48 7.7 18 30 1:25 72 8.1 19 35 1:20 48 7.4 20 35 1:20 48 7.2 Table 1.
Collagen extraction experimental yield from sardine bone using water extract from BP according to a three-level-three factors CCD experimental matrix.
-
Term Coefficient T-value p-value Constant 7.424 41.50 0.000 T 0.935 7.88 0.000 R 1.320 11.12 0.000 time 1.555 13.10 0.000 T × T −0.465 −4.02 0.002 R × R −1.246 −10.78 0.000 time × time −1.145 −9.91 0.000 T × R −0.314 −2.02 0.071 T × time 0.176 1.14 0.282 R × time 0.891 5.75 0.000 Table 2.
Estimated regression coefficients of the model, T-value, and p-value for the collagen extraction yield using the water extract from BP.
-
Biomass source for water extract Solvent pH Collagen yield (%) BP 5.87 9.82 CH 6.85 2.10 PP 4.46 13.58 MP 4.80 11.79 Citric acid 5.87 4.06 Table 3.
Collagen extraction yield for different solvents under optimum conditions, including temperature of 40 °C, sardine fish bone to solvent ratio of 24, after 74 h of extraction.
-
Retention time Name Molecular formula Molecular
weight (g mol−1)BP 3.136 Oxalic acid C2H2O4 90.036 6.331 Malic acid C4H6O5 134.088 8.102 Citric acid C6H8O7 192.124 9.634 2,4-di-tert-butylphenol C14H22O 220.33 14.638 Methyl palmitate C17H34O2 270.46 CH 3.892 p-Coumaric acid C9H8O3 164.154 8.102 Syringic acid C9H10O5 198.17 16.551 Epicatechin C15H14O6 290.27 PP 6.331 Malic acid C4H6O5 134.088 8.102 Citric acid C6H8O7 192.124 8.587 Ferulic acid C10H10O4 194.18 MP 4.743 Succinic acid C4H6O4 118.088 6.331 Malic acid C4H6O5 134.088 8.102 Citric acid C6H8O7 192.124 10.660 3-Deoxy-d-mannoic lactone C6H10O4 146.14 10.985 3-Deoxy-d-mannoic acid C6H12O5 162.14 20.551 Mangiferin C19H18O11 422.38 Table 4.
GC-MS profile of solvents extracted from biomass including BP, CH, PP, and MP.
-
Sardine fish bone Collagen sample Total ash (%) 51.04 12.76 Moisture (%) 8.0 8.0 Protein (%) 22.3 73.3 Total fat (%) 0.9 0.1 Carbohydrate (%) 5 5 Crude fiber (%) < 0.1 < 0.1 Energy kcal 100 g−1 117 316 Table 5.
Proximate analysis of sardine fish bone and extracted collagen at optimum conditions; temperature of 40 °C, fishbone to solvent ratio of 24, and extraction time of 74 h.
Figures
(7)
Tables
(5)