ARTICLE   Open Access    

Water extract of banana peel as a green solvent for extraction of collagen from sardine bone

More Information
  • Common collagen extraction methods are outdated and unsustainable. This study introduces a more sustainable method using water extract from banana peel to extract collagen from sardine bone, a prevalent marine fish in Malaysia. Banana peel was chosen as the feedstock for solvent preparation due to its abundance and agricultural significance in Malaysia. This study examined how extraction parameters including temperature (27−43 °C), sardine bone-to-solvent ratio (1:15−1:28), and extraction time (8−88 h) affect the collagen extraction yield. FT-IR, TGA, and proximate analysis were used to characterize the collagen extracted, while the water extracts were analyzed using UV-Vis and GC-MS. Under optimum conditions of 40 °C, a sardine bone-to-solvent ratio of 1:24, and an extraction time of 74 h, yielded 9.82% collagen. When citric acid was used as the common solvent, the collagen extracted yield was 4.06%. Further investigation of water extracts from other fruit waste sources, including mango peel, coconut husk, and pineapple pomace, under optimum conditions, obtained an extraction yield of 11.79%, 2.10%, and 13.58%, respectively. This study demonstrated the use of fruit waste extract as an environmentally sustainable method for extracting collagen from marine fish, highlighting an efficient approach to waste valorization.
  • Crops require a variety of nutrients for growth and nitrogen is particularly important. Nitrogen is the primary factor limiting plant growth and yield formation, and it also plays a significant role in improving product quality[14]. Nitrogen accounts for 1%−3% of the dry weight of plants and is a component of many compounds. For example, it is an important part of proteins, a component of nucleic acids, the skeleton of cell membranes, and a constituent of chlorophyll[5,6]. When the plant is deficient in nitrogen, the synthesis process of nitrogen-containing substances such as proteins decrease significantly, cell division and elongation are restricted, and chlorophyll content decreases, and this leads to short and thin plants, small leaves, and pale color[2,7,8]. If nitrogen in the plant is in excess, a large number of carbohydrates will be used for the synthesis of proteins, chlorophyll, and other substances, so that cells are large and thin-walled, and easy to be attacked by pests and diseases. At the same time, the mechanical tissues in the stem are not well developed and are prone to collapse[3,8,9]. Therefore, the development of new crop varieties with both high yields and improved nitrogen use efficiency (NUE) is an urgently needed goal for more sustainable agriculture with minimal nitrogen demand.

    Plants obtain inorganic nitrogen from the soil, mainly in the form of NH4+ and nitrate (NO3)[1013]. Nitrate uptake by plants occurs primarily in aerobic environments[3]. Transmembrane proteins are required for nitrate uptake from the external environment as well as for transport and translocation between cells, tissues, and organs. NITRATE TRANSPORTER PROTEIN 1 (NRT1)/PEPTIDE TRANSPORTER (PTR) family (NPF), NRT2, CHLORIDE CHANNEL (CLC) family, and SLOW ACTIVATING ANION CHANNEL are four protein families involved in nitrate transport[14]. One of the most studied of these is NRT1.1, which has multiple functions[14]. NRT1.1 is a major nitrate sensor, regulating many aspects of nitrate physiology and developmental responses, including regulating the expression levels of nitrate-related genes, modulating root architecture, and alleviating seed dormancy[1518].

    There is mounting evidence that plant growth and development are influenced by interactions across numerous phytohormone signaling pathways, including abscisic acid, gibberellins, growth hormones, and cytokinins[3,19,20]. To increase the effectiveness of plant nitrogen fertilizer application, it may be possible to tweak the signaling mediators or vary the content of certain phytohormones. Since the 1930s, research on the interplay between growth factors and N metabolism has also been conducted[3]. The Indole acetic acid (IAA) level of plant shoots is shown to decrease in early studies due to N shortage, although roots exhibit the reverse tendency[3,21]. In particular, low NO3 levels caused IAA buildup in the roots of Arabidopsis, Glycine max, Triticum aestivum, and Zea mays, indicating that IAA is crucial for conveying the effectiveness of exogenous nitrogen to the root growth response[20,22,23].

    Studies have shown that two families are required to control the expression of auxin-responsive genes: one is the Auxin Response Factor (ARF) and the other is the Aux/IAA repressor family[2426]. As the transcription factor, the ARF protein regulates the expression of auxin response genes by specifically binding to the TGTCNN auxin response element (AuxRE) in promoters of primary or early auxin response genes[27]. Among them, rice OsARF18, as a class of transcriptional repressor, has been involved in the field of nitrogen utilization and yield[23,28]. In rice (Oryza sativa), mutations in rice salt tolerant 1 (rst1), encoding the OsARF18 gene, lead to the loss of its transcriptional repressor activity and up-regulation of OsAS1 expression, which accelerates the assimilation of NH4+ to Asn and thus increases N utilization[28]. In addition, dao mutant plants deterred the conversion of IAA to OxIAA, thus high levels of IAA strongly activates OsARF18, which subsequently represses the expression of OsARF2 and OsSUT1 by directly binding to the AuxRE and SuRE promoter motifs, resulting in the inhibition of carbohydrate partitioning[23]. As a result, rice carrying the dao has low yields.

    Apples (Malus domestica) are used as a commercially important crop because of their high ecological adaptability, high nutritional value, and annual availability of fruit[29]. To ensure high apple yields, growers promote rapid early fruit yield growth by applying nitrogen. However, the over-application of nitrogen fertilizer to apples during cultivation also produces common diseases and the over-application of nitrogen fertilizer is not only a waste of resources but also harmful to the environment[29]. Therefore, it is of great significance to explore efficient nitrogen-regulated genes to understand the uptake and regulation of nitrogen fertilizer in apples, and to provide reasonable guidance for nitrogen application during apple production[30]. In this study, MdARF18 is identified which is a key transcription factor involved in nitrate uptake and transport in apples and MdARF18 reduces NO3 uptake and assimilation. Further analysis suggests that MdRF18 may inhibit the transcriptional level of MdNRT1.1 promoter by directly binding to its TGTCTT target, thus affecting normal plant growth.

    The protein sequence of apple MdARF18 (MD07G1152100) was obtained from The Apple Genome (https://iris.angers.inra.fr/gddh13/). Mutant of arf18 (GABI_699B09) sequence numbers were obtained from the official TAIR website (www.arabidopsis.org). The protein sequences of ARF18 from different species were obtained from the protein sequence of apple MdARF18 on the NCBI website. Using these data, a phylogenetic tree with reasonably close associations was constructed[31].

    Protein structural domain prediction of ARF18 was performed on the SMART website (https://smart.embl.de/). Motif analysis of ARF18 was performed by MEME (https://meme-suite.org/meme/tools/meme). Clustal was used to do multiple sequence comparisons. The first step was accessing the EBI web server through the Clustal Omega channel. The visualization of the results was altered using Jalview, which may be downloaded from www.jalview.org/download.[32]

    The apple 'Orin' callus was transplanted on MS medium containing 1.5 mg·L−1 6-benzylaminopurine (6-BA) and 0.5 mg·L−1 2,4 dichlorophenoxyacetic acid (2,4-D) at 25 °C, in the dark, at 21-d intervals. 'Royal Gala' apple cultivars were cultured in vermiculite and transplanted at 25 °C every 30 d. The Arabidopsis plants used were of the Columbia (Col-0) wild-type variety. Sowing and germinating Arabidopsis seeds on MS nutrient medium, and Arabidopsis seeds were incubated and grown at 25 °C (light/dark cycle of 16 h/8 h)[33].

    The nutrient solution in the base contained 1.0 mM CaCl2, 1.0 mM KH2PO4, 1.0 mM MgSO4, 0.1 mM FeSO4·7H2O 0.1 mM Na2EDTA·2H2O, 50 μM MnSO4·H2O, 50 μM H3BO3, 0.05 μM CuSO4·5H2O, 0.5 μM Na2MoO4·2H2O, 15 μM ZnSO4·7H2O, 2.5 μM KI, and 0.05 μM CoCl·6H2O, and 0.05 μM CoCl·6H2O, and 0.05 μM CoCl· 6H2O. 2H2O, 15 μM ZnSO4·7H2O, 2.5 μM KI and 0.05 μM CoCl·6H2O, and 0.05 μM CoCl·6H2O, supplemented with 0.5 mM, 2 mM, and 10 mM KNO3 as the sole nitrogen source, and added with the relevant concentrations of KCl to maintain the same K concentration[33,34].

    For auxin treatment, 12 uniformly growing apple tissue-cultured seedlings (Malus domestica 'Royal Gala') were selected from each of the control and treatment groups, apple seedlings were incubated in a nutrient solution containing 1.5 mg·L−1 6-BA, 0.2 mg·L−1 naphthalene acetic acid, and IAA (10 μM) for 50 d, and then the physiological data were determined. Apple seedlings were incubated and grown at 25 °C (light/dark cycle of 16 h/8 h).

    For nitrate treatment, Arabidopsis seedlings were transferred into an MS medium (containing different concentrations of KNO3) as soon as they germinated to test root development. Seven-day-old Arabidopsis were transplanted into vermiculite and then treated with a nutrient solution containing different concentrations of KNO3 (0.5, 2, 10 mM) and watered at 10-d intervals. Apple calli were treated with medium containing 1.5 mg·L−1 6-BA, 0.5 mg·L−1 2,4-D, and varying doses of KNO3 (0.5, 2, and 10 mM) for 25 d, and samples were examined for relevant physiological data. Apple calli were subjected to the same treatment for 1 d for GUS staining[35].

    To obtain MdARF18 overexpression materials, the open reading frame (ORF) of MdARF18 was introduced into the pRI-101 vector. To obtain pMdNRT1.1 material, the 2 kb segment located before the transcription start site of MdNRT1.1 was inserted into the pCAMBIA1300 vector. The Agrobacterium tumefaciens LBA4404 strain was cultivated in lysozyme broth (LB) medium supplemented with 50 mg·L−1 kanamycin and 50 mg·L−1 rifampicin. The MdARF18 overexpression vector and the ProMdNRT1.1::GUS vector were introduced into Arabidopsis and apple callus using the flower dip transformation procedure. The third-generation homozygous transgenic Arabidopsis (T3) and transgenic calli were obtained[36]. Information on the relevant primers designed is shown in Supplemental Table S1.

    Plant DNA and RNA were obtained using the Genomic DNA Kit and the Omni Plant RNA Kit (tDNase I) (Tiangen, Beijing, China)[37].

    cDNA was synthesized for qPCR by using the PrimeScript First Strand cDNA Synthesis Kit (Takara, Dalian, China). The cDNA for qPCR was synthesized by using the PrimeScript First Strand cDNA Synthesis Kit (Takara, Dalian, China). Quantitative real-time fluorescence analysis was performed by using the UltraSYBR Mixture (Low Rox) kit (ComWin Biotech Co. Ltd., Beijing, China). qRT-PCR experiments were performed using the 2−ΔΔCᴛ method for data analysis. The data were analyzed by the 2−ΔΔCᴛ method[31].

    GUS staining buffer contained 1 mM 5-bromo-4-chloro-3-indolyl-β-glutamic acid, 0.01 mM EDTA, 0.5 mM hydrogen ferrocyanide, 100 mM sodium phosphate (pH 7.0), and 0.1% (v/v) Triton X-100 was maintained at 37 °C in the dark. The pMdNRT1.1::GUS construct was transiently introduced into apple calli. To confirm whether MdNRT1.1 is activated or inhibited by MdARF18, we co-transformed 35S::MdARF18 into pMdNRT1.1::GUS is calling. The activity of transgenic calli was assessed using GUS labeling and activity assays[33,38].

    The specimens were crushed into fine particles, combined with 1 mL of ddH2O, and thereafter subjected to a temperature of 100 °C for 30 min. The supernatant was collected in a flow cell after centrifugation at 12,000 revolutions per minute for 10 min. The AutoAnalyzer 3 continuous flow analyzer was utilized to measure nitrate concentrations. (SEAL analytical, Mequon, WI, USA). Nitrate reductase (NR) activity was characterized by the corresponding kits (Solarbio Life Science, Beijing, China) using a spectrophotometric method[31].

    Y1H assays were performed as previously described by Liu et al.[39]. The coding sequence of MdARF18 was integrated into the pGADT7 expression vector, whereas the promoter region of MdNRT1.1 was included in the pHIS2 reporter vector. Subsequently, the constitutive vectors were co-transformed into the yeast monohybrid strain Y187. The individual transformants were assessed on a medium lacking tryptophan, leucine, and histidine (SDT/-L/-H). Subsequently, the positive yeast cells were identified using polymerase chain reaction (PCR). The yeast strain cells were diluted at dilution factors of 10, 100, 1,000, and 10,000. Ten μL of various doses were added to selective medium (SD-T/-L/-H) containing 120 mM 3-aminotriazole (3-AT) and incubated at 28 °C for 2−3 d[37].

    Dual-luciferase assays were performed as described previously[40]. Full-length MdARF18 was cloned into pGreenII 62-SK to produce MdARF18-62-SK. The promoter fragment of MdNRT1.1 was cloned into pGreenII 0800-LUC to produce pMdNRT1.1-LUC. Different combinations were transformed into Agrobacterium tumefaciens LBA4404 and the Agrobacterium solution was injected onto the underside of the leaves of tobacco (Nicotiana benthamiana) leaves abaxially. The Dual Luciferase Reporter Kit (Promega, www.promega.com) was used to detect fluorescence activity.

    Total protein was extracted from wild-type and transgenic apple calli with or without 100 μM MG132 treatment. The purified MdARF18-HIS fusion protein was incubated with total protein[41]. Samples were collected at the indicated times (0, 1, 3, 5, and 7 h).

    Protein gel blots were analyzed using GST antibody. ACTIN antibody was used as an internal reference. All antibodies used in this study were provided by Abmart (www.ab-mart.com).

    Unless otherwise noted, every experiment was carried out independently in triplicate. A one-way analysis of variance (ANOVA) was used to establish the statistical significance of all data, and Duncan's test was used to compare results at the p < 0.05 level[31].

    To investigate whether auxin affects the effective uptake of nitrate in apple, we first externally applied IAA under normal N (5 mM NO3) environment, and this result showed that the growth of Gala apple seedlings in the IAA-treated group were better than the control, and their fresh weights were heavier than the control group (Fig. 1a, d). The N-related physiological indexes of apple seedlings also showed that the nitrate content and NR activity of the root part of the IAA-treated group were significantly higher than the control group, while the nitrate content and NR activity of the shoot part were lower than the control group (Fig. 1b, c). These results demonstrate that auxin could promote the uptake of nitrate and thus promotes growth of plants.

    Figure 1.  Auxin enhances nitrate uptake of Gala seedlings. (a) Phenotypes of apple (Malus domestica 'Royal Gala') seedlings grown nutritionally for 50 d under IAA (10 μM) treatment. (b) Nitrate content of shoot and root apple (Malus domestica 'Royal Gala') seedlings treated with IAA. (c) NR activity in shoot and root of IAA treatment apple (Malus domestica 'Royal Gala') seedlings. (d) Seedling fresh weight under IAA treatment. Bars represent the mean ± SD (n = 3). Different letters above the bars indicate significant differences using the LSD test (p < 0.05).

    To test whether auxin affects the expression of genes related to nitrogen uptake and metabolism. For the root, the expression levels of MdNRT1.1, MdNRT2.1, MdNIA1, MdNIA2, and MdNIR were higher than control group (Supplemental Fig. S1a, f, hj), while the expression levels of MdNRT1.2, MdNRT1.6 and MdNRT2.5 were lower than control group significantly (Supplemental Fig. S1b, d, g). For the shoot, the expression of MdNRT1.1, MdNRT1.5, MdNRT1.6, MdNRT1.7, MdNRT2.1, MdNRT2.5, MdNIA1, MdNIA2, and MdNIR genes were significantly down-regulated (Supplemental Fig. S1a, cj). This result infers that the application of auxin could mediate nitrate uptake in plants by affecting the expression levels of relevant nitrate uptake and assimilation genes.

    Since the auxin signaling pathway requires the regulation of the auxin response factors (ARFs)[25,27], it was investigated whether members of ARF genes were nitrate responsive. Firstly, qPCR quantitative analysis showed that the five subfamily genes of MdARFs (MdARF9, MdARF2, MdARF12, MdARF3, and MdARF18) were expressed at different levels in various organs of the plant (Supplemental Fig. S2). Afterward, the expression levels of five ARF genes were analyzed under different concentrations of nitrate treatment (Fig. 2), and it was concluded that these genes represented by each subfamily responded in different degrees, but the expression level of MdARF18 was up-regulated regardless of low or high nitrogen (Fig. 2i, j), and the expression level of MdARF18 showed a trend of stable up-regulation under IAA treatment (Supplemental Fig. S3). The result demonstrates that MdARFs could affect the uptake of external nitrate by plants and MdARF18 may play an important role in the regulation of nitrate uptake.

    Figure 2.  Relative expression analysis of MdARFs subfamilies in response to different concentrations of nitrate. Expression analysis of representative genes from five subfamilies of MdARF transcription factors. Bars represent the mean ± SD (n = 3). Different letters above the bars indicate significant differences using the LSD test (p < 0.05).

    MdARF18 (MD07G1152100) was predicted through The Apple Genome website (https://iris.angers.inra.fr/gddh13/) and it had high fitness with AtARF18 (AT3G61830). The homologs of ARF18 from 15 species were then identified in NCBI (www.ncbi.nlm.nih.gov) and then constructed an evolutionary tree (Supplemental Fig. S4). The data indicates that MdARF18 was most closely genetically related to MbARF18 (Malus baccata), indicating that they diverged recently in evolution (Supplemental Fig. S4). Conserved structural domain analyses indicated that all 15 ARF18 proteins had highly similar conserved structural domains (Supplemental Fig. S5). In addition, multiple sequence alignment analysis showed that all 15 ARF18 genes have B3-type DNA-binding domains (Supplemental Fig. S6), which is in accordance with the previous reports on ARF18 protein structure[26].

    To explore whether MdARF18 could affect the development of the plant's root system. Firstly, MdARF18 was heterologously expressed into Arabidopsis, and an arf18 mutant (GABI_699B09) Arabidopsis was also obtained (Supplemental Fig. S7). Seven-day-old MdARF18 transgenic Arabidopsis and arf18 mutants were treated in a medium with different nitrate concentrations for 10 d (Fig. 3a, b). After observing results, it was found that under the environment of high nitrate concentration, the primary root of MdARF18 was shorter than arf18 and wild type (Fig. 3c), and the primary root length of arf18 is the longest (Fig. 3c), while there was no significant difference in the lateral root (Fig. 3d). For low nitrate concentration, there was no significant difference in the length of the primary root, and the number of lateral roots of MdARF18 was slightly more than wild type and arf18 mutant. These results suggest that MdARF18 affects root development in plants. However, in general, low nitrate concentrations could promote the transport of IAA by NRT1.1 and thus inhibit lateral root production[3], so it might be hypothesized that MdARF18 would have some effect on MdNRT1.1 thus leading to the disruption of lateral root development.

    Figure 3.  MdARF18 inhibits root development. (a) MdARF18 inhibits root length at 10 mM nitrate concentration. (b) MdARF18 promotes lateral root growth at 0.5 mM nitrate concentration. (c) Primary root length statistics. (d) Lateral root number statistics. Bars represent the mean ± SD (n = 3). Different letters above the bars indicate significant differences using the LSD test (p < 0.05).

    To investigate whether MdARF18 affects the growth of individual plants under different concentrations of nitrate, 7-day-old overexpression MdARF18, and arf18 mutants were planted in the soil and incubated for 20 d. It was found that arf18 had the best growth of shoot, while MdARF18 had the weakest shoot growth at any nitrate concentration (Fig. 4a). MdARF18 had the lightest fresh weight and the arf18 mutant had the heaviest fresh weight (Fig. 4b). N-related physiological indexes revealed that the nitrate content and NR activity of arf18 were significantly higher than wild type, whereas MdARF18 materials were lower than wild type (Fig. 4c, d). More detail, MdARF18 had the lightest fresh weight under low and normal nitrate, while the arf18 mutant had the heaviest fresh weight, and the fresh weight of arf18 under high nitrate concentration did not differ much from the wild type (Fig. 4b). Nitrogen-related physiological indexes showed that the nitrate content of arf18 was significantly higher than wild type, while MdARF18 was lower than wild type. The NR activity of arf18 under high nitrate did not differ much from the wild type, but the NR activity of MdARF18 was the lowest in any treatment (Fig. 4c, d). These results indicate that MdARF18 significantly inhibits plant growth by inhibiting plants to absorb nitrate, and is particularly pronounced at high nitrate concentrations.

    Figure 4.  Ectopic expression of MdARF18 inhibits Arabidopsis growth. (a) Status of Arabidopsis growth after one month of incubation at different nitrate concentrations. (b) Fresh weight of Arabidopsis. (c) Nitrate content of Arabidopsis. (d) NR activity in Arabidopsis. Bars represent the mean ± SD (n = 3). Different letters above the bars indicate significant differences using the LSD test (p < 0.05).

    In addition, to further validate this conclusion, MdARF18 overexpression calli were obtained and treated with different concentrations of nitrate (Supplemental Fig. S8). The results show that the growth of overexpressed MdARF18 was weaker than wild type in both treatments (Supplemental Fig. S9a). The fresh weight of MdARF18 was significantly lighter than wild type (Supplemental Fig. S9b), and its nitrate and NR activity were lower than wild type (Supplemental Fig. S9c, d), which was consistent with the above results (Fig. 4). This result further confirms that MdARF18 could inhibit the development of individual plants by inhibiting the uptake of nitrate.

    Nitrate acts as a signaling molecule that takes up nitrate by activating the NRT family as well as NIAs and NIR[3,34]. To further investigate the pathway by which MdARF18 inhibits plant growth and reduces nitrate content, qRT-PCR was performed on the above plant materials treated with different concentrations of nitrate (Fig. 5). The result shows that the expression levels of AtNRT1.1, AtNIA1, AtNIA2, and AtNIR were all down-regulated in overexpression of MdARF18, and up-regulated in the arf18 mutant (Fig. 5a, hj). There was no significant change in AtNRT1.2 at normal nitrate levels, but AtNRT1.2 expression levels were down-regulated in MdARF18 and up-regulated in arf18 at both high and low nitrate levels (Fig. 5b). This trend in the expression levels of these genes might be consistent with the fact that MdARF18 inhibits the expression of nitrogen-related genes and restricts plant growth. The trend in the expression levels of these genes is consistent with MdARF18 restricting plant growth by inhibiting the expression of nitrogen-related genes. However, AtNRT1.5, AtNRT1.6, AtNRT1.7, AtNRT2.1, and AtNRT2.5 did not show suppressed expression levels in MdARF18 (Fig. 5cg). These results suggest that MdARF18 inhibits nitrate uptake and plant growth by repressing some of the genes for nitrate uptake or assimilation.

    Figure 5.  qPCR-RT analysis of N-related genes. Expression analysis of N-related genes in MdARF18 transgenic Arabidopsis at different nitrate concentrations. Bars represent the mean ± SD (n = 3). Different letters above the bars indicate significant differences using the LSD test (p < 0.05).

    In addition, to test whether different concentrations of nitrate affect the protein stability of MdARF18. However, it was found that there was no significant difference in the protein stability of MdARF18 at different concentrations of nitrate (Supplemental Fig. S10). This result suggests that nitrate does not affect the degradation of MdARF18 protein.

    To further verify whether MdARF18 can directly bind N-related genes, firstly we found that the MdNRT1.1 promoter contains binding sites to ARF factors (Fig. 6a). The yeast one-hybrid research demonstrated an interaction between MdARF18 and the MdNRT1.1 promoter, as shown in Fig. 6b. Yeast cells that were simultaneously transformed with MdNRT1.1-P-pHIS and pGADT7 were unable to grow in selected SD medium. However, cells that were transformed with MdNRT1.1-P-pHIS and MdARF18-pGADT7 grew successfully in the selective medium. The result therefore hypothesizes that MdARF18 could bind specifically to MdNRT1.1 promoter to regulate nitrate uptake in plants.

    Figure 6.  MdARF18 binds directly to the promoter of MdNRT1.1. (a) Schematic representation of MdNRT1.1 promoter. (b) Y1H assay of MdARF18 bound to the MdNRT1.1 promoter in vitro. 10−1, 10−2, 10−3, and 10−4 indicate that the yeast concentration was diluted 10, 100, 1,000, and 10,000 times, respectively. 3-AT stands for 3-Amino-1,2,4-triazole. (c) Dual luciferase assays demonstrate the binding of MdARF18 with MdNRT1.1 promoter. The horizontal bar on the left side of the right indicates the captured signal intensity. Empty LUC and 35S vectors were used as controls. Representative images of three independent experiments are shown here.

    To identify the inhibition or activation of MdNRT1.1 by MdARF18, we analyzed their connections by Dual luciferase assays (Fig. 6c), and also analyzed the fluorescence intensity (Supplemental Fig. S11). It was concluded that the fluorescence signals of cells carrying 35Spro and MdNRT1.1pro::LUC were stronger, but the mixture of 35Spro::MdARF18 and MdNRT1.1pro::LUC injected with fluorescence signal intensity was significantly weakened. Next, we transiently transformed the 35S::MdARF18 into pMdNRT1.1::GUS transgenic calli (Fig. 7). GUS results first showed that the color depth of pMdNRT1.1::GUS and 35S::MdARF18 were significantly lighter than pMdnNRT1.1::GUS alone (Fig. 7a). GUS enzyme activity, as well as GUS expression, also indicated that the calli containing pMdnNRT1.1::GUS alone had a stronger GUS activity (Fig. 7b, c). In addition, the GUS activity of calli containing both pMdNRT1.1:GUS and 35S::MdARF18 were further attenuated under both high and low nitrate concentrations (Fig. 7a). These results suggest that MdARF18 represses MdNRT1.1 expression by directly binding to the MdNRT1.1 promoter region.

    Figure 7.  MdARF18 inhibits the expression of MdNRT1.1. (a) GUS staining experiment of pMdNRT1.1::GUS transgenic calli and transgenic calli containing both pMdNRT1.1::GUS and 35S::MdARF18 with different nitrate treatments. (b) GUS activity assays in MdARF18 overexpressing calli with different nitrate treatments. (c) GUS expression level in MdARF18 overexpressing calli with different nitrate treatments. Bars represent the mean ± SD (n = 3). Different numbers of asterisk above the bars indicate significant differences using the LSD test (*p < 0.05 and **p< 0.01).

    Plants replenish their nutrients by absorbing nitrates from the soil[42,43]. Previous studies have shown that some of the plant hormones such as IAA, GA, and ABA interact with nitrate[25,4445]. The effect of nitrate on the content and transport of IAA has been reported in previous studies, e.g., nitrate supply reduced IAA content in Arabidopsis, wheat, and maize roots and inhibited the transport of IAA from shoot to root[20,21]. In this study, it was found that auxin treatment promoted individual fresh weight gain and growth (Fig. 1a, b). Nitrate content and NR activity were also significantly higher in their root parts (Fig. 1c, d) and also affected the transcript expression levels of related nitrate uptake and assimilation genes (Supplemental Fig. S1). Possibly because IAA can affect plant growth by influencing the uptake of external nitrates by the plant.

    ARFs are key transcription factors to regulate auxin signaling[4649]. We identified five representative genes of the apple MdARFs subfamily and they all had different expression patterns (Supplemental Fig. S2). The transcript levels of each gene were found to be affected to different degrees under different concentrations of nitrate, but the expression level of MdARF18 was up-regulated under both low and high nitrate conditions (Fig. 2). The transcript level of MdARF18 was also activated under IAA treatment (Supplemental Fig. S3), so MdARF18 began to be used in the study of the mechanism of nitrate uptake in plants. In this study, an Arabidopsis AtARF18 homolog was successfully cloned and named MdARF18 (Supplemental Figs S4, S5). It contains a B3-type DNA-binding structural domain consistent with previous studies of ARFs (Supplemental Fig. S6), and arf18 mutants were also obtained and their transcript levels were examined (Supplemental Fig. S7).

    Plants rely on rapid modification of the root system to efficiently access effective nitrogen resources in the soil for growth and survival. The plasticity of root development is an effective strategy for accessing nitrate, and appropriate concentrations of IAA can promote the development of lateral roots[7,44]. The present study found that the length of the primary root was shortened and the number of lateral roots did increase in IAA-treated Gl3 apple seedlings (Supplemental Fig. S12). Generally, an environment with low concentrations of nitrate promotes the transport of IAA by AtNRT1.1, which inhibits the growth of lateral roots[14]. However, in the research of MdARF18 transgenic Arabidopsis, it was found that the lateral roots of MdARF18-OX increased under low concentrations of nitrate, but there was no significant change in the mutant arf18 (Fig. 3). Therefore, it was hypothesized that MdARF18 might repress the expression of the MdNRT1.1 gene or other related genes that can regulate root plasticity, thereby affecting nitrate uptake in plants.

    In rice, several researchers have demonstrated that OsARF18 significantly regulates nitrogen utilization. Loss of function of the Rice Salt Tolerant 1 (RST1) gene (encoding OsARF18) removes its ability to transcriptionally repress OsAS1, accelerating the assimilation of NH4+ to Asn and thereby increasing nitrogen utilization[28]. During soil incubation of MdARF18-OX Arabidopsis, it was found that leaving aside the effect of differences in nitrate concentration, the arf18 mutant grew significantly better than MdARF18-OX and had higher levels of nitrate and NR activity in arf18 than in MdARF18-OX. This demonstrates that MdARF18 may act as a repressor of nitrate uptake and assimilation, thereby inhibiting normal plant development (Fig. 4). Interestingly, an adequate nitrogen environment promotes plant growth, but MdARF18-OX Arabidopsis growth and all physiological indexes were poorer under high nitrate concentration than MdARF18-OX at other concentrations. We hypothesize that MdARF18 may be activated more intensively at high nitrate concentrations, or that MdARF18 suppresses the expression levels of genes for nitrate uptake or assimilation (genes that may play a stronger role at high nitrate concentrations), thereby inhibiting plant growth. In addition, we obtained MdARF18 transgenic calli (Supplemental Fig. S8) and subjected them to high and low concentrations of nitrate, and also found that MdARF18 inhibited the growth of individuals at both concentrations (Supplemental Fig. S9). This further confirms that MdARF18 inhibits nitrate uptake in individuals.

    ARF family transcription factors play a key role in transmitting auxin signals to alter plant growth and development, e.g. osarf1 and osarf24 mutants have reduced levels of OsNRT1.1B, OsNRT2.3a and OsNIA2 transcripts[22]. Therefore, further studies are needed to determine whether MdARF18 activates nitrate uptake through different molecular mechanisms. The result revealed that the transcript levels of AtNRT1.1, AtNIA1, AtNIA2, and AtNIR in MdARF18-OX were consistent with the developmental pattern of impaired plant growth (Fig. 5). Unfortunately, we attempted to explore whether variability in nitrate concentration affects MdARF18 to differ at the protein level, but the two did not appear to differ significantly (Supplemental Fig. S10).

    ARF transcription factors act as trans-activators/repressors of N metabolism-related genes by directly binding to TGTCNN/NNGACA-containing fragments in the promoter regions of downstream target genes[27,50]. The NRT family plays important roles in nitrate uptake, transport, and storage, and NRT1.1 is an important dual-affinity nitrate transporter protein[7,5052], and nitrogen utilization is very important for apple growth[53,54]. We identified binding sites in the promoters of these N-related genes that are compatible with ARF factors, and MdARF18 was found to bind to MdNRT1.1 promoter by yeast one-hybrid technique (Fig. 6a, b). It was also verified by Dual luciferase assays that MdARF18 could act as a transcriptional repressor that inhibited the expression of the downstream gene MdNRT1.1 (Fig. 6c), which inhibited the uptake of nitrate in plants. In addition, the GUS assay was synchronized to verify that transiently expressed pMdNRT1.1::GUS calli with 35S::MdARF18 showed a lighter staining depth and a significant decrease in GUS transcript level and enzyme activity (Fig. 7). This phenomenon was particularly pronounced at high concentrations of nitrate. These results suggest that MdARF18 may directly bind to the MdNRT1.1 promoter and inhibit its expression, thereby suppressing NO3 metabolism and decreasing the efficiency of nitrate uptake more significantly under high nitrate concentrations.

    In conclusion, in this study, we found that MdARF18 responds to nitrate and could directly bind to the TGTCTT site of the MdNRT1.1 promoter to repress its expression. Our findings provide new insights into the molecular mechanisms by which MdARF18 regulates nitrate transport in apple.

    The authors confirm contribution to the paper as follows: study conception and design: Liu GD; data collection: Liu GD, Rui L, Liu RX; analysis and interpretation of results: Liu GD, Li HL, An XH; draft manuscript preparation: Liu GD; supervision: Zhang S, Zhang ZL; funding acquisition: You CX, Wang XF; All authors reviewed the results and approved the final version of the manuscript.

    Data sharing not applicable to this article as no datasets were generated or analyzed during the current study.

    This work was supported by the National Natural Science Foundation of China (32272683), the Shandong Province Key R&D Program of China (2022TZXD008-02), the China Agriculture Research System of MOF and MARA (CARS-27), the National Key Research and Development Program of China (2022YFD1201700), and the National Natural Science Foundation of China (NSFC) (32172538).

  • The authors declare that they have no conflict of interest.

  • [1]

    Thirukumaran R, Anu Priya VK, Krishnamoorthy S, Ramakrishnan P, Moses JA, et al. 2022. Resource recovery from fish waste: Prospects and the usage of intensified extraction technologies. Chemosphere 299:134361

    doi: 10.1016/j.chemosphere.2022.134361

    CrossRef   Google Scholar

    [2]

    Boronat Ò, Sintes P, Celis F, Díez M, Ortiz J, et al. 2023. Development of added-value culinary ingredients from fish waste: Fish bones and fish scales. International Journal of Gastronomy and Food Science 31:100657

    doi: 10.1016/j.ijgfs.2022.100657

    CrossRef   Google Scholar

    [3]

    Qin D, Bi S, You X, Wang M, Cong X, et al. 2022. Development and application of fish scale wastes as versatile natural biomaterials. Chemical Engineering Journal 428:131102

    doi: 10.1016/j.cej.2021.131102

    CrossRef   Google Scholar

    [4]

    Ahmad NI, Wan Mahiyuddin WR, Tengku Mohamad TR, Ling CY, Daud SF, et al. 2016. Fish consumption pattern among adults of different ethnics in Peninsular Malaysia. Food & Nutrition Research 60:32697

    doi: 10.3402/fnr.v60.32697

    CrossRef   Google Scholar

    [5]

    Ferraro V, Carvalho AP, Piccirillo C, Santos MM, Castro PML, et al. 2013. Extraction of high added value biological compounds from sardine, sardine-type fish and mackerel canning residues—A review. Materials Science and Engineering: C 33:3111−20

    doi: 10.1016/j.msec.2013.04.003

    CrossRef   Google Scholar

    [6]

    Sae-Leaw T, Benjakul S. 2018. Lipase from liver of seabass (Lates calcarifer): Characteristics and the use for defatting of fish skin. Food Chemistry 240:9−15

    doi: 10.1016/j.foodchem.2017.07.089

    CrossRef   Google Scholar

    [7]

    Rajabimashhadi Z, Gallo N, Salvatore L, Lionetto F. 2023. Collagen derived from fish industry waste: progresses and challenges. Polymers 15:544

    doi: 10.3390/polym15030544

    CrossRef   Google Scholar

    [8]

    Noorzai S, Verbeek CJR, Lay MC, Swan J. 2020. Collagen extraction from various waste bovine hide sources. Waste and Biomass Valorization 11:5687−98

    doi: 10.1007/s12649-019-00843-2

    CrossRef   Google Scholar

    [9]

    Carpio KCR, Bezerra RS, Cahú TB, Monte FTDD, Neri RCA, et al. 2023. Extraction and characterization of collagen from the skin of Amazonian freshwater fish pirarucu. Brazilian Journal of Medical and Biological Research 56:e12564

    doi: 10.1590/1414-431x2023e12564

    CrossRef   Google Scholar

    [10]

    Oslan SNH, Shapawi R, Mokhtar RAM, Noordin WNM, Huda N. 2022. Characterization of acid-and pepsin-soluble collagen extracted from the skin of purple-spotted bigeye snapper. Gels 8:665

    doi: 10.3390/gels8100665

    CrossRef   Google Scholar

    [11]

    Sousa RO, Alves AL, Carvalho DN, Martins E, Oliveira C, et al. 2020. Acid and enzymatic extraction of collagen from Atlantic cod (Gadus Morhua) swim bladders envisaging health-related applications. Journal of Biomaterials Science, Polymer Edition 31:20−37

    doi: 10.1080/09205063.2019.1669313

    CrossRef   Google Scholar

    [12]

    Ge B, Hou C, Bao B, Pan Z, de Val JEMS, et al. 2022. Comparison of physicochemical and structural properties of acid-soluble and pepsin-soluble collagens from blacktip reef shark skin. Marine Drugs 20:376

    doi: 10.3390/md20060376

    CrossRef   Google Scholar

    [13]

    Vate NK, Undeland I, Abdollahi M. 2022. Resource efficient collagen extraction from common starfish with the aid of high shear mechanical homogenization and ultrasound. Food Chemistry 393:133426

    doi: 10.1016/j.foodchem.2022.133426

    CrossRef   Google Scholar

    [14]

    Elbialy ZI, Atiba A, Abdelnaby A, Al-Hawary II, Elsheshtawy A, et al. 2020. Collagen extract obtained from Nile tilapia (Oreochromis niloticus L.) skin accelerates wound healing in rat model via up regulating VEGF, bFGF, and α-SMA genes expression. BMC Veterinary Research 16:352

    doi: 10.1186/s12917-020-02566-2

    CrossRef   Google Scholar

    [15]

    Bisht M, Martins M, Dias ACRV, Ventura SPM, Coutinho JAP. 2021. Uncovering the potential of aqueous solutions of deep eutectic solvents on the extraction and purification of collagen type I from Atlantic codfish (Gadus morhua). Green Chemistry 23:8940−48

    doi: 10.1039/D1GC01432C

    CrossRef   Google Scholar

    [16]

    El Blidi O, El Omari N, Balahbib A, Ghchime R, El Menyiy N, et al. 2021. Extraction methods, characterization and biomedical applications of collagen: A review. Biointerface Research in Applied Chemistry 11:13587−613

    doi: 10.33263/briac115.1358713613

    CrossRef   Google Scholar

    [17]

    Shi D, Zhou F, Mu W, Ling C, Mu T, et al. 2022. Deep insights into the viscosity of deep eutectic solvents by an XGBoost-based model plus SHapley Additive exPlanation. Physical Chemistry Chemical Physics 24:26029−36

    doi: 10.1039/D2CP03423A

    CrossRef   Google Scholar

    [18]

    Dabhane H, Ghotekar S, Tambade P, Pansambal S, Ananda Murthy HC, et al. 2021. A review on environmentally benevolent synthesis of CdS nanoparticle and their applications. Environmental Chemistry and Ecotoxicology 3:209−19

    doi: 10.1016/j.enceco.2021.06.002

    CrossRef   Google Scholar

    [19]

    Hong YH, Kao C, Chang CC, Chang FK, Song TY, et al. 2023. Anti-Inflammatory and T-Cell Immunomodulatory Effects of Banana Peel Extracts and Selected Bioactive Components in LPS-Challenged In Vitro and In Vivo Models. Agriculture 13:451

    doi: 10.3390/agriculture13020451

    CrossRef   Google Scholar

    [20]

    More PR, Jambrak AR, Arya SS. 2022. Green, environment-friendly and sustainable techniques for extraction of food bioactive compounds and waste valorization. Trends in Food Science & Technology 128:296−315

    doi: 10.1016/j.jpgs.2022.08.016

    CrossRef   Google Scholar

    [21]

    Ettadili FE, Aghris S, Laghrib F, Farahi A, Saqrane S, et al. 2022. Recent advances in the nanoparticles synthesis using plant extract: Applications and future recommendations. Journal of Molecular Structure 1248:131538

    doi: 10.1016/j.molstruc.2021.131538

    CrossRef   Google Scholar

    [22]

    Liu H, Huang K. 2016. Structural characteristics of extracted collagen from tilapia (Oreochromis mossambicus) bone: effects of ethylenediaminetetraacetic acid solution and hydrochloric acid treatment. International Journal of Food Properties 19:63−75

    doi: 10.1080/10942912.2014.951939

    CrossRef   Google Scholar

    [23]

    Priyanka K, Mohamed Adil A, Begum AM. 2020. Extraction of acid soluble collagen from Coryphaenahippurus (Mahimahi) and its application in tissue engineering. Annals of the Romanian Society for Cell Biology 197−212

    Google Scholar

    [24]

    Horwitz W, Latimer GW. 2000. Official methods of analysis of AOAC International. Gaithersburg: AOAC international.

    [25]

    Rastegari H, Ghaziaskar HS. 2015. From glycerol as the by-product of biodiesel production to value-added monoacetin by continuous and selective esterification in acetic acid. Journal of Industrial and Engineering Chemistry 21:856−61

    doi: 10.1016/j.jiec.2014.04.023

    CrossRef   Google Scholar

    [26]

    Kamal MM, Akhtaruzzaman M, Sharmin T, Rahman M, Mondal SC. 2023. Optimization of extraction parameters for pectin from guava pomace using response surface methodology. Journal of Agriculture and Food Research 11:100530

    doi: 10.1016/j.jafr.2023.100530

    CrossRef   Google Scholar

    [27]

    Silva JC, Barros AA, Aroso IM, Fassini D, Silva TH, et al. 2016. Extraction of collagen/gelatin from the marine demosponge Chondrosia reniformis (Nardo, 1847) using water acidified with carbon dioxide – process optimization. Industrial & Engineering Chemistry Research 55:6922−30

    doi: 10.1021/acs.iecr.6b00523

    CrossRef   Google Scholar

    [28]

    Jafari H, Lista A, Siekapen MM, Ghaffari-Bohlouli P, Nie L, et al. 2020. Fish collagen: Extraction, characterization, and applications for biomaterials engineering. Polymers 12:2230

    doi: 10.3390/polym12102230

    CrossRef   Google Scholar

    [29]

    Yemisken E, Jiménez-Rosado M, Perez-Puyana V, Sancar S, Bektaş S, et al. 2023. Alternative sources of marine bioactive compounds from the Black Sea: Isolation and characterization of fish skin collagen from Neogobius melanostomus (Pallas 1814) (Perciformes: Gobiidae). Regional Studies in Marine Science 60:102887

    doi: 10.1016/j.rsma.2023.102887

    CrossRef   Google Scholar

    [30]

    Rigby BJ. 1968. Amino-acid composition and thermal stability of the skin collagen of the Antarctic ice-fish. Nature 219:166−67

    doi: 10.1038/219166a0

    CrossRef   Google Scholar

    [31]

    Veis A, Cohen J. 1955. The degradation of collagen. II. The solubilization process in the acid pH range. Journal of the American Chemical Society 77:2364−68

    doi: 10.1021/ja01614a003

    CrossRef   Google Scholar

    [32]

    Lussi A. 2006. Dental erosion: from diagnosis to therapy. Basel, Switzerland: Karger Medical and Scientific Publishers

    [33]

    Badea E, Della Gatta G, Budrugeac P. 2011. Characterisation and evaluation of the environmental impact on historical parchments by differential scanning calorimetry. Journal of Thermal Analysis and Calorimetry 104:495−506

    doi: 10.1007/s10973-011-1495-8

    CrossRef   Google Scholar

    [34]

    Qiu J, Vuist JE, Boom RM, Schutyser MA. 2018. Formation and degradation kinetics of organic acids during heating and drying of concentrated tomato juice. LWT 87:112−21

    doi: 10.1016/j.lwt.2017.08.081

    CrossRef   Google Scholar

    [35]

    Wang HH. 2007. Kinetic analysis of dehydration of a bituminous coal using the TGA technique. Energy & Fuels 21:3070−75

    doi: 10.1021/ef070170y

    CrossRef   Google Scholar

    [36]

    Lohrasbi S, Mirzaei E, Karimizade A, Takallu S, Rezaei A. 2020. Collagen/cellulose nanofiber hydrogel scaffold: physical, mechanical and cell biocompatibility properties. Cellulose 27:927−40

    doi: 10.1007/s10570-019-02841-y

    CrossRef   Google Scholar

    [37]

    Sutherland TD, Peng YY, Trueman HE, Weisman S, Okada S, et al. 2013. A new class of animal collagen masquerading as an insect silk. Scientific Reports 3:2864

    doi: 10.1038/srep02864

    CrossRef   Google Scholar

    [38]

    Zorica B, Anđelić I, Čikeš Keč V. 2019. Sardine (Sardina pilchardus) spawning in the light of fat content analysis. Scientia Marina 83:207−13

    doi: 10.3989/scimar.04898.07A

    CrossRef   Google Scholar

    [39]

    Yusrina A, Rochima E, Handaka AA, Rostini I. 2021. Fishbone flour (definition analysis of quality characteristics, manufacture): A review. Asian Journal of Fisheries and Aquatic Research 13:18−24

    doi: 10.9734/ajfar/2021/v13i430271

    CrossRef   Google Scholar

    [40]

    Nemati M, Kamilah H, Huda N, Ariffin F. 2016. In vitro calcium availability in bakery products fortified with tuna bone powder as a natural calcium source. International Journal of Food Sciences and Nutrition 67:535−40

    doi: 10.1080/09637486.2016.1179269

    CrossRef   Google Scholar

    [41]

    Ahuja I, Dauksas E, Remme JF, Richardsen R, Løes AK. 2020. Fish and fish waste-based fertilizers in organic farming–With status in Norway: A review. Waste Management 115:95−112

    doi: 10.1016/j.wasman.2020.07.025

    CrossRef   Google Scholar

    [42]

    Anwar S, Javid S, Syed QA, Hussain MI, Arshad M, et al. 2024. Screening and quantification of non-thermally extracted antioxidants and phytochemicals from banana peels via LC-ESI-QTOF-MS/MS and their functionality in spoonable plain-yogurt. Journal of Food Measurement and Characterization 18:1133−43

    doi: 10.1007/s11694-023-02215-w

    CrossRef   Google Scholar

    [43]

    Shori AB, Yong YS, Baba AS. 2022. Effects of medicinal plants extract enriched cheese with fish collagen on proteolysis and in vitro angiotensin-I converting enzyme inhibitory activity. LWT 159:113218

    doi: 10.1016/j.lwt.2022.113218

    CrossRef   Google Scholar

    [44]

    Pal GK, Suresh PV. 2016. Sustainable valorisation of seafood by-products: Recovery of collagen and development of collagen-based novel functional food ingredients. Innovative Food Science & Emerging Technologies 37:201−15

    doi: 10.1016/j.ifset.2016.03.015

    CrossRef   Google Scholar

    [45]

    Shori AB, Yong YS, Baba AS. 2021. Effects of herbal yogurt with fish collagen on bioactive peptides with angiotensin-I converting enzyme inhibitory activity. Food Science and Technology 41:902−7

    doi: 10.1590/fst.24020

    CrossRef   Google Scholar

    [46]

    Shori AB, Ming KS, Baba AS. 2021. The effects of Lycium barbarum water extract and fish collagen on milk proteolysis and in vitro angiotensin I-converting enzyme inhibitory activity of yogurt. Biotechnology and Applied Biochemistry 68:221−29

    doi: 10.1002/bab.1914

    CrossRef   Google Scholar

    [47]

    Shori AB, Tin YP, Baba AS. 2022. Codonopsis pilosula and fish collagen yogurt: proteolytic potential angiotensin-I converting enzyme (ACE) inhibitory activity and sensory properties. LWT 165:113729

    doi: 10.1016/j.lwt.2022.113729

    CrossRef   Google Scholar

  • Cite this article

    Rastegari H, Nor Adzmi NZ, Nadi F, Mohtar NF, Abdul Rahim AI, et al. 2024. Water extract of banana peel as a green solvent for extraction of collagen from sardine bone. Food Materials Research 4: e023 doi: 10.48130/fmr-0024-0015
    Rastegari H, Nor Adzmi NZ, Nadi F, Mohtar NF, Abdul Rahim AI, et al. 2024. Water extract of banana peel as a green solvent for extraction of collagen from sardine bone. Food Materials Research 4: e023 doi: 10.48130/fmr-0024-0015

Figures(7)  /  Tables(5)

Article Metrics

Article views(2615) PDF downloads(215)

ARTICLE   Open Access    

Water extract of banana peel as a green solvent for extraction of collagen from sardine bone

Food Materials Research  4 Article number: e023  (2024)  |  Cite this article

Abstract: Common collagen extraction methods are outdated and unsustainable. This study introduces a more sustainable method using water extract from banana peel to extract collagen from sardine bone, a prevalent marine fish in Malaysia. Banana peel was chosen as the feedstock for solvent preparation due to its abundance and agricultural significance in Malaysia. This study examined how extraction parameters including temperature (27−43 °C), sardine bone-to-solvent ratio (1:15−1:28), and extraction time (8−88 h) affect the collagen extraction yield. FT-IR, TGA, and proximate analysis were used to characterize the collagen extracted, while the water extracts were analyzed using UV-Vis and GC-MS. Under optimum conditions of 40 °C, a sardine bone-to-solvent ratio of 1:24, and an extraction time of 74 h, yielded 9.82% collagen. When citric acid was used as the common solvent, the collagen extracted yield was 4.06%. Further investigation of water extracts from other fruit waste sources, including mango peel, coconut husk, and pineapple pomace, under optimum conditions, obtained an extraction yield of 11.79%, 2.10%, and 13.58%, respectively. This study demonstrated the use of fruit waste extract as an environmentally sustainable method for extracting collagen from marine fish, highlighting an efficient approach to waste valorization.

    • The adoption of the Sustainable Development Goals (SDGs) in 2015 has emphasized the importance of sustainable natural resource management. Within this context, the fishery industry plays a critical role in ensuring food security and nutrition, as well as providing a valuable source of raw materials[1]. In 2018, this sector achieved a volume of 178.5 million tons, experiencing a Compound Annual Growth Rate (CAGR) of 4.8% between 2022 and 2027[2]. However, this growing trend in the consumption of aquatic food has led to a notable increase in waste generation, primarily due to the perishable nature of these foods and the existence of inedible parts such as bone and skin. Despite being waste, these leftovers contain valuable compounds, with collagen being a particularly noteworthy example, known for its interesting properties and diverse industrial applications[3]. Among the commonly consumed marine fish in Malaysia are sardines[4], which contain up to 50% collagen (dry weight base) in the bones and scales[5]. Hence, sardine waste could serve as a viable alternative to mammalian collagen and its derivatives in Malaysia.

      Fish collagen consists of polypeptide chains featuring repeating triplets of glycine along with the amino acids proline and hydroxyproline. Its unique properties including biocompatibility, negligible antigenicity, high biosafety, and cost-effectiveness, make it attractive for various industries such as medical, cosmetic, nutraceutical, food, and pharmaceutical[6]. It could be utilized in different forms such as injectable solutions, thin substrates, porous sponges, nanofibrous matrices, and micro- and nano-spheres, showcasing its versatility and significance in these sectors[7]. However, the extraction process could markedly influence collagen properties such as molecular weight, solubility, viscosity, and thermal stability[8].

      Recently, collagen has been extracted from several fish species, such as Amazonian freshwater fish pirarucu[9], purple-spotted bigeye snapper[10], Atlantic cod[11], blacktip reef shark skin[12], starfish[13], Nile tilapia[14]. Current extraction methods often involve acidic treatment or enzymatic hydrolysis which could be complex and operate under harsh conditions, impacting collagen quality[15]. In addition, these methods result in an environmentally harmful waste stream that necessitates additional treatment[16]. Deep eutectic solvents and eutectic mixtures have emerged as alternatives, offering milder conditions and higher yield and quality of the extracted collagen[15]. However, one of the most important challenges faced with the application of deep eutectic solvents is their high viscosities, which can affect mass transfer rates and make handling and processing more challenging[17].

      To address this issue, exploring alternative solvents derived from natural resources that are less harmful to the environment is a viable approach. Plant extracts, particularly those rich in organic acids, offer a promising solution[18]. Bananas rank as one of the most extensively consumed and traded crops worldwide. Its production volume increased from 69 million tons in 2000–2002 to 119.8 million tons in 2020. However, the peel, which accounts for a substantial portion of the fruit’s weight (35%–40%), generates over 41.9 million tons of waste annually, presenting significant environmental challenges[19]. Enhancing the recycling and reuse of banana peel (BP) could provide an environmentally friendly waste management solution while adding value to the peel. BP contains a wealth of dietary fiber, pectin, and more than 40 polyphenol antioxidants, such as ferulic acid and rutin, known for their strong antioxidant and antimicrobial characteristics[20].

      The use of plant extracts containing reducing agents in nanoparticle synthesis has attracted considerable attention due to their eco-friendly nature and potential applications. These natural extracts, such as those from green tea, neem, and aloe vera, contain bioactive compounds that function as reducing agents in the synthesis process. By utilizing these extracts, researchers have been able to produce nanoparticles with unique properties suitable for a wide range of applications, especially in food and environment applications[21]. However, to the best of our knowledge, there are no reports in the literature on the use of plant extracts as solvents for the extraction of collagen. Hence, the use of BP water extracts as solvents for collagen extraction from sardine bone presents a sustainable approach, aligning with the principles of green chemistry. This study aims to investigate the possibility of collagen extraction from sardine bone using BP water extract and maximize the collagen yield. The extracted collagen will be characterized by its physicochemical properties. Overall, this research contributes to the growing body of knowledge on sustainable waste management and green chemistry practices, highlighting the potential of utilizing agricultural and fish processing waste to produce valuable products.

    • Sardine processing waste including bones obtained from a sardine processing company (Maperow Sdn. Bhd.) located in Kuala Terengganu, Terengganu, Malaysia. Green banana (Musa) peels, pineapple (Morris) pomace, mango (Chok Anan) peel, and coconut (Cocos Nucifera) husk were collected from local markets in Kuala Nerus, Terengganu, Malaysia between June, and July 2023. Citric acid monohydrate (≥ 99.0%), sodium hydroxide (≥ 98%), sodium chloride (99.0%−100.5%), and methanol (≥ 99, 9%) were purchased from Sigma-Aldrich, Germany.

    • This study investigated the feasibility of extracting collagen from sardine bones using a water extract derived from BP. Additionally, it thought to evaluate the potential of water extracts from other fruit waste sources, including mango peel (MP), pineapple pomace (PP), and coconut husk (CH), for collagen extraction under optimum conditions. This research aimed to contribute to sustainable waste management practices by exploring the potential application of biomass waste extracts in collagen extraction processes.

    • Bananas, mangoes, pineapples, and coconuts were procured from local markets in Kuala Nerus, Terengganu (Malaysia), during June and July 2023. The fruits were then washed with tap water, and the desired parts of interest; BP, MP, PP, and CH; were carefully separated. Subsequently, the samples were dried in an air-circulating oven at 60 °C for 3 d until they reached a constant weight. The dried materials were then ground into a powder using a mortar and sieved to collect the particles with a mesh size of 120 μm.

      For the preparation of water extracts, 50 g of each powdered sample was placed in a beaker and extracted with 500 mL of distilled water by heating the mixture at 60 °C for 30 min. After cooling, the mixture was filtered to obtain a brownish filtrate (Fig. 1), referred to as the water extract in this study. These extracts were then stored at 10 °C in a refrigerator for further analysis.
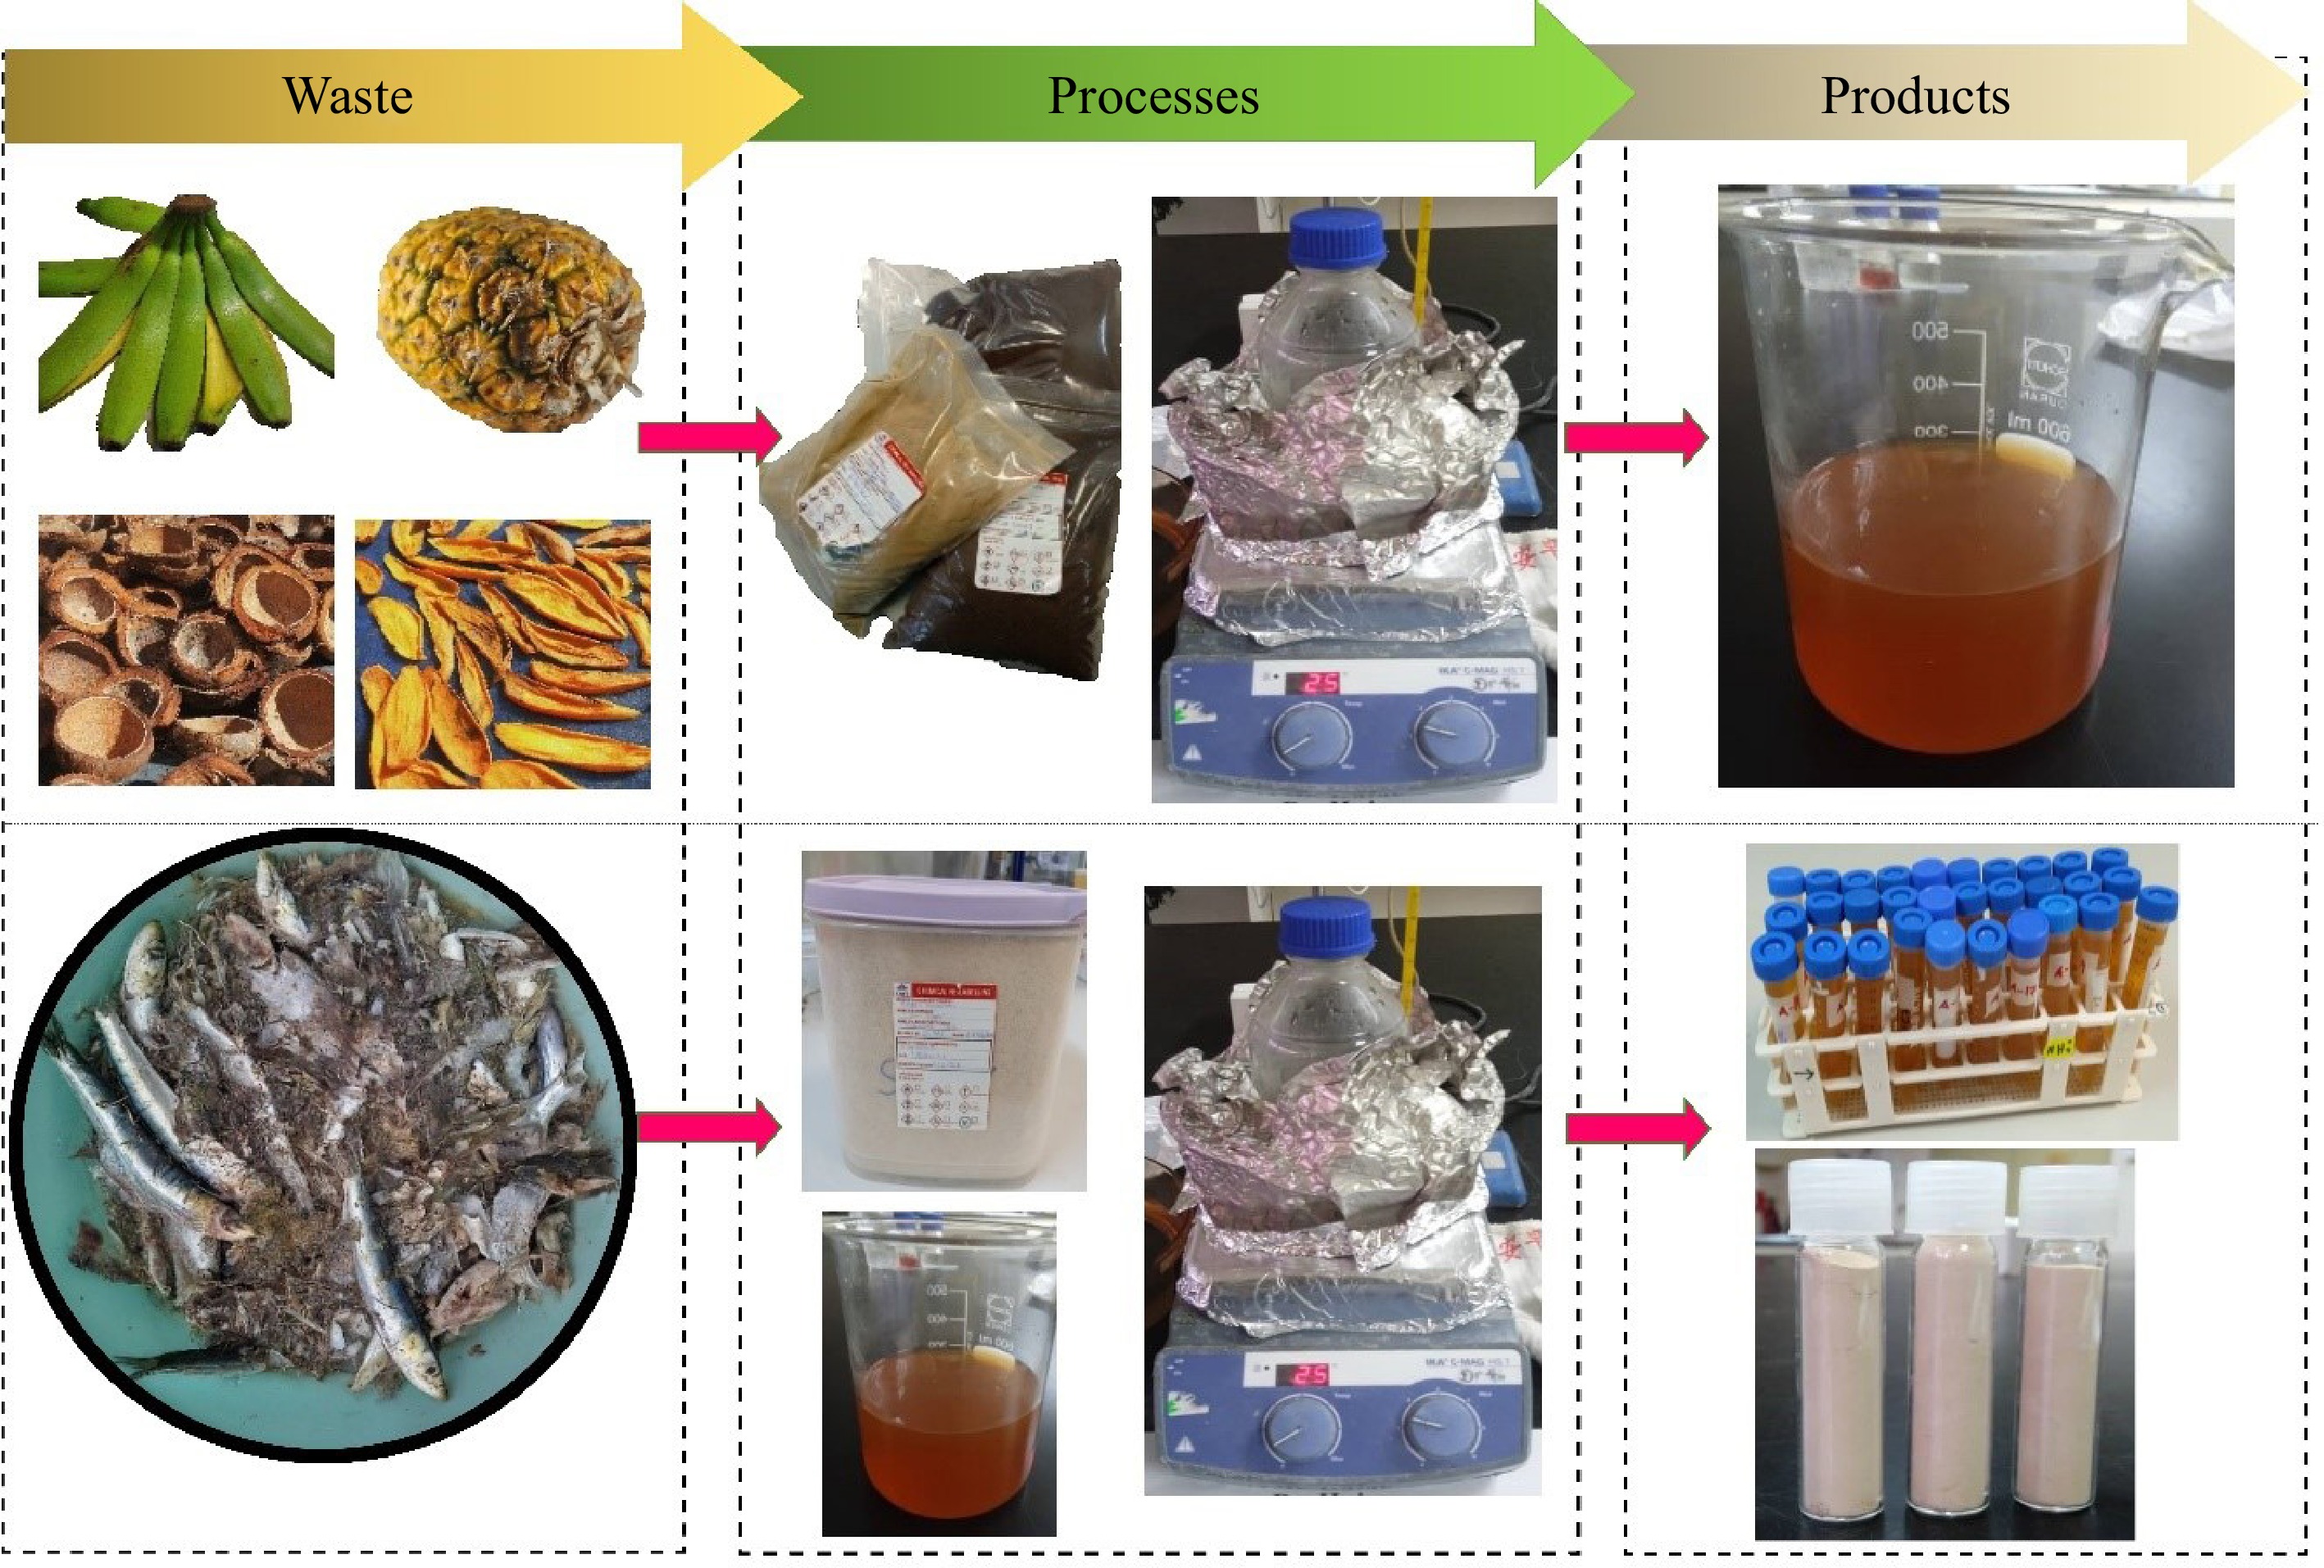
      Figure 1. 

      The processes involved in preparation of water extracts from fruit waste (top), and extraction of collagen from sardine bone using the water extracts (bottom).

    • Sardine processing waste, primarily bones, was collected from Maperow Sdn. Bhd., in August 2023, and transferred in insulated cooler boxes to AKUATROP research labs. Then they were thoroughly washed with tap water to remove any remaining flesh and impurities. Subsequently, they were dried in an air-circulating oven at 40 °C until they were fully dried and reached a constant weight. To increase the extraction efficiency, the dried bones were pulverized into a powder, sieved to collect particles with a mesh size of 120 μm, and stored in a chiller at 10 °C before further use.

    • This study investigated the influence of process parameters on collagen extraction from sardine bones using a water extract from BP. Central Composite Design (CCD) was employed, incorporating three independent variables; temperature (T), sardine bone to water extract ratio (R), and extraction time (time), each at three coded levels (−1, 0, 1). The impact of these variables on the collagen extraction yield was studied over the range of 27−43 °C for T, 1:15−1:28 for R, and 8−88 h for time, respectively. These ranges were selected based on preliminary experiments. The experimental trials were conducted according to a design matrix (Table 1), and upon completion, the collagen extraction yield was analyzed using Response Surface Methodology (RSM) with a quadratic polynomial equation as shown in Eqn (1).

      Table 1.  Collagen extraction experimental yield from sardine bone using water extract from BP according to a three-level-three factors CCD experimental matrix.

      Trial no. Variables Yield (%)
      T (°C) R (g mL−1) time (h)
      1 35 1:20 48 7.2
      2 30 1:25 24 3.3
      3 40 1:15 24 3.5
      4 30 1:15 24 2.0
      5 35 1:20 48 7.9
      6 35 1:20 8 1.3
      7 40 1:25 72 9.1
      8 40 1:15 72 5.5
      9 27 1:20 48 3.9
      10 30 1:15 72 2.6
      11 35 1:12 48 1.6
      12 35 1:20 88 6.5
      13 35 1:28 48 5.6
      14 35 1:20 48 7.6
      15 35 1:20 48 7.3
      16 40 1:25 24 4.2
      17 43 1:20 48 7.7
      18 30 1:25 72 8.1
      19 35 1:20 48 7.4
      20 35 1:20 48 7.2
      Y=b0+ni=1biXi+ni=1biiX2i+ni=1nj>1bijXiXj (1)

      where, the intercept, linear, quadratic, and interaction coefficients are denoted by b0, bi, bii, bij, respectively, with Y representing the response. The number of variables studied and optimized in the experiments are represented by n. The coded independent variables are denoted with Xi and Xj.

      The statistical analysis of all experimental data was performed using Minitab software, version16. The quality of the developed model was assessed using the correlation value (R2), whereas its statistical significance was evaluated through analysis of variance (ANOVA).

    • Collagen was extracted using a modified version of the method described by Liu & Huang[22]. Briefly, in each trial, varying amounts of sardine bone powder were added to 350 mL of the water extract derived from BP and experiments were carried out under the conditions detailed in Table 1. Each experiment was performed three times. After extraction, the remaining fish bones were separated by centrifugation at 8,000× g for 15 min. The supernatant was then salted out by adding NaCl to a final concentration of 0.9 mol L−1, and the collagen was separated by centrifugation at 10,000× g for 20 min at 4 °C. It is crucial to emphasize that the water extract from BP was chosen as the solvent for the process optimization due to more availability of BP in Kula Nerus and further investigations using other water extracts were conducted under the optimal conditions. Additionally, a comparative experiment was performed using citric acid as a conventional solvent, serving as the reference study. Equation (2) was used to calculate the collagen extraction yield.

      Yield(%)=Weightofcollagen(g)WeightofSardinebonepowder(g)×100% (2)
    • The presence of collagen in the extracted samples was assessed using FT-IR analysis. Samples were analyzed by an FT-IR spectrophotometer (IRTracer-100, Shimadzu, Japan) equipped with an attenuated total reflectance cell (ATR) featuring a diamond crystal. The spectra were recorded over the range of 4,000−400 cm−1, with 64 scans accumulated, and a resolution of 16 cm−1.

    • The thermal stability of collagen is strongly influenced by its hydroxyproline content and the physiological temperature of fish[3]. To assess the thermal stability of the sample extracted under optimum conditions, Thermogravimetric Analysis (TGA) was employed (622 Star System, Mettler Toledo, USA). The sample was tightly sealed in an aluminum crucible before being subjected to TGA under a nitrogen atmosphere. TGA was performed at a heating rate of 10 °C min−1, with the temperature ranging from 0−250 °C to analyze the denaturation process. The denaturation energy was calculated by integrating the curve obtained from the experimental data[23].

    • The proximate composition of the sample extracted under optimum conditions was determined following the AOAC 2000 recommended procedures[24]. Moisture content was determined by placing the sample into an aluminum dish and by drying it in a forced-air convection oven at 105 °C overnight. Ash content was measured by incinerating the sample in a muffle furnace at 600 °C. Kjeldahl method was used to assess the protein content of the samples[24]. This method involved sample digestion, followed by distillation, and titration. The lipid content was determined by extracting the samples using a Soxhlet apparatus and petroleum ether as solvent. Crude fiber was determined by digesting the samples with sulfuric acid and sodium hydroxide. The energy content of the samples was determined using bomb calorimetry, where the measured heat of combustion directly reflects the material's energy content[24].

    • To identify the chemical composition of water extracts, UV-visible spectra of water extracts derived from BP, CH, MP, and PP were analyzed using a spectrophotometer (UV-1800, Shimadzu, Japan). All the samples were directly transferred to the cuvette without additional preparation. The recorded spectra covered the wavelength range of 400−800 nm.

    • The chemical profile of water extracts was analyzed using GC-MS machine (GCMS-QP 2010 Ultra, Shimadzu, Japan). The analysis employed a ZB-5MS column (20 m × 0.18 mm, film thickness 0.18 μm, Shimadzu). The injector temperature was set at 250 °C, and a split injection mode was used with a ratio of 30:1. The oven temperature started at 100 °C and was held for 2 min before ramping up to 280 °C at a rate of 10 °C min−1, where it was held for an additional 15 min. The carrier gas was helium at a flow rate of 1 mL min−1. Component identification was achieved by comparing the mass spectra with the NIST MS 14.0 database.

    • Table 2 summarizes the regression model for the collagen extraction yield. Using the experimental data presented in Table 1, a quadratic model equation was developed to describe the relationship between the input variables and response. This equation includes linear, interactive, and quadratic terms, aiming to provide a comprehensive understanding of the correlation. In this context, T stands for extraction temperature, R represents the sardine bone-to-water extract ratio, and time indicates the extraction time.

      Table 2.  Estimated regression coefficients of the model, T-value, and p-value for the collagen extraction yield using the water extract from BP.

      Term Coefficient T-value p-value
      Constant 7.424 41.50 0.000
      T 0.935 7.88 0.000
      R 1.320 11.12 0.000
      time 1.555 13.10 0.000
      T × T −0.465 −4.02 0.002
      R × R −1.246 −10.78 0.000
      time × time −1.145 −9.91 0.000
      T × R −0.314 −2.02 0.071
      T × time 0.176 1.14 0.282
      R × time 0.891 5.75 0.000

      Table 2 shows the T- and p-values for the fitted second-order polynomial model. These values were used to assess the significance of each parameter in the model. The null hypothesis for this test assumes that a parameter's coefficient is equal to zero. If the T-value exceeds the critical T-value, the null hypothesis is rejected. The p-value indicates the probability of a parameter coefficient being zero, and a p-value exceeding 0.05 suggests the parameter can be excluded from the model as it lacks significant effect at a 95% confidence level[25]. Hence, in this study, only two interactive parameters, T × R and T × time, were found to be not significant in collagen extraction.

      On the other hand, the model's validity was confirmed by ANOVA, revealing a p-value of 0.000, which indicates that the regression is significant at the confidence level of 95% (p < 0.05)[25]. Both the F-value and the p-value of the lack-of-fit indicate that there is no lack of fit at the confidence level of 95%, as the calculated F-value is less than the critical F-value obtained from the F-distribution table.

      The p-value for the lack of fit is another statistical measure used to assess the adequacy of a model in fitting the data. It tests the hypothesis that the model fits the data well, indicating no significant lack of fit. If the p-value is lower than the chosen significance level (e.g., 0.05), it suggests that the model does not adequately explain the data, and there is a significant lack of fit[26]. For this model, the reported p-value is 0.062, which is higher than 0.05.

      In linear regressions, the correlation coefficient (R2) assesses the overall goodness of fit of the model, quantifying how well the model explains the variation in the dependent variable using the independent variables[26]. In this case, it's value of 0.9835 indicates the independent variables account for 98.35% of the variation in the collagen extraction (Fig. 2).
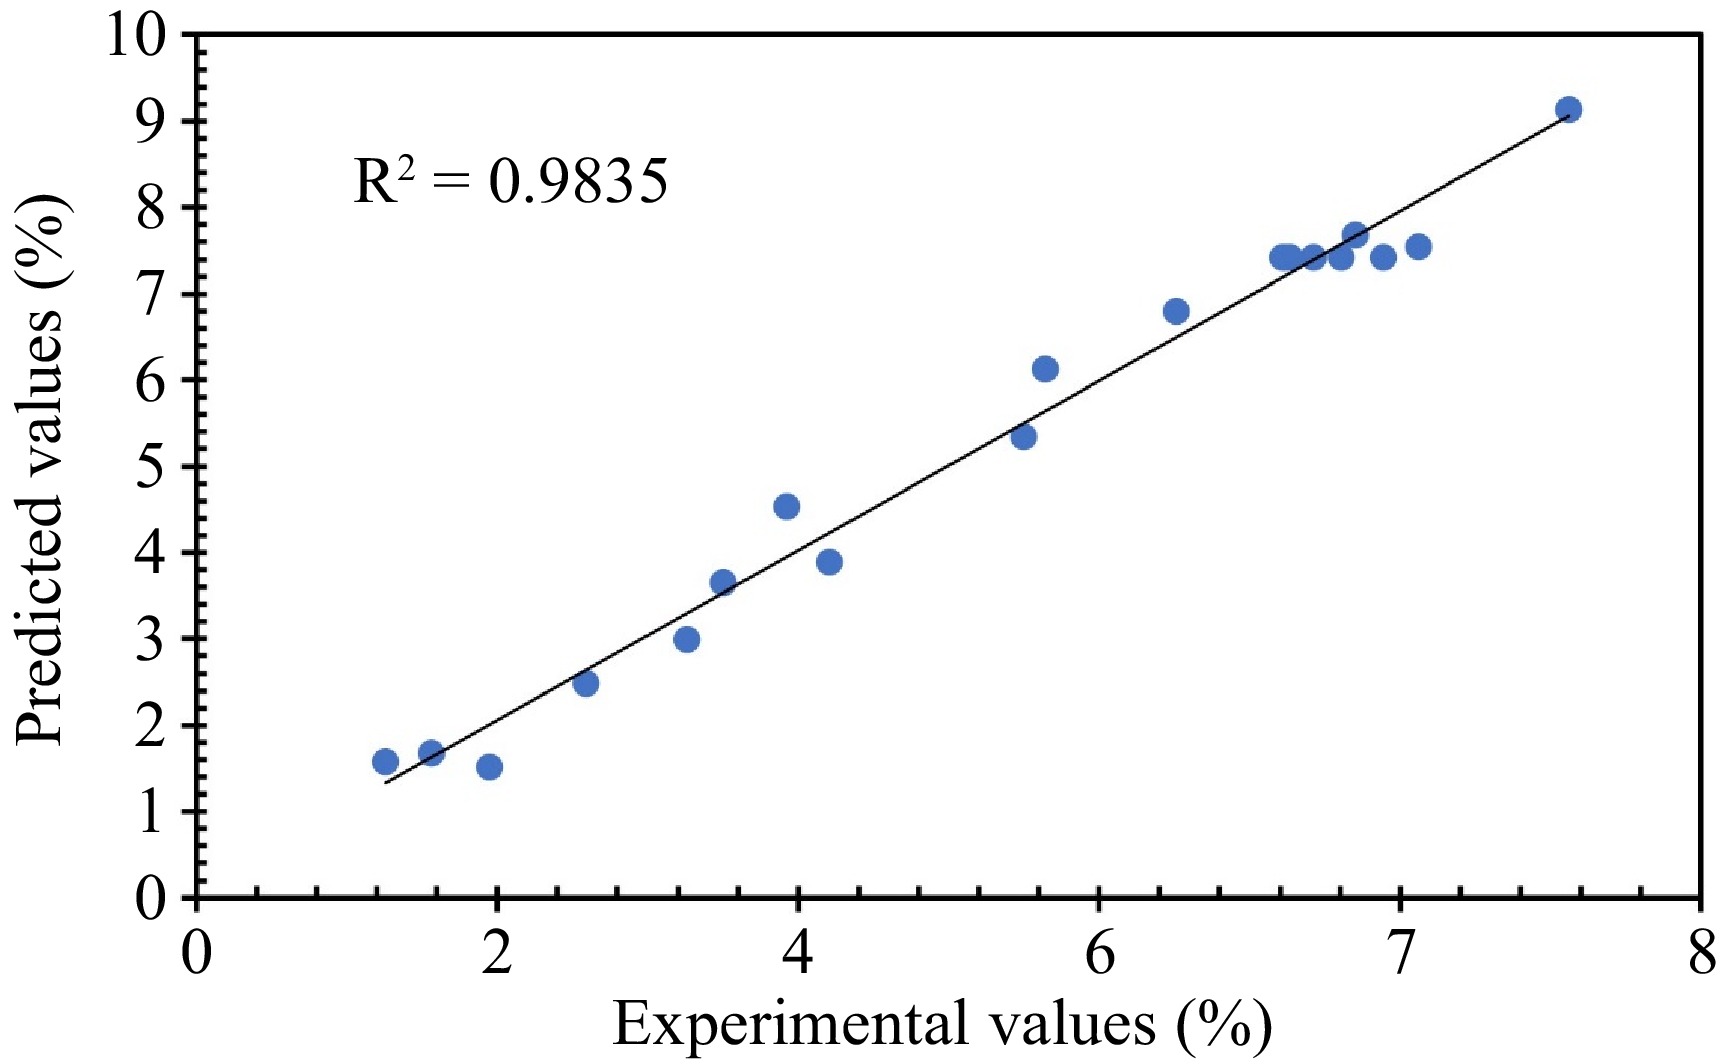
      Figure 2. 

      The plot of the predicted values, calculated by fitting the models, vs experimental values for collagen extraction yield using the water extract from BP.

    • The coefficients presented in Table 2 provide insights into the variable's impact on the collagen extraction yield. Notably, extraction time emerges as the most influential variable with a positive regression coefficient of 1.555, indicating that longer extraction times enhanced collagen extraction yield, consistent with findings in existing literature[27]. Figure 3 illustrates surface plots for collagen extraction using the water extract from BP. Notably, an extraction time of 8 h resulted in a low yield of 1.3%, underscoring the need for adequate extraction duration. For a moderate extraction time of 24 h, yields varied widely depending on other extraction conditions. The highest yield 9.1%, was obtained after 72 h, demonstrating that prolonged extraction time improved yield. However, extending extraction times beyond 72 to 88 h led to a gradual decrease in yield due to collagen degradation[28].
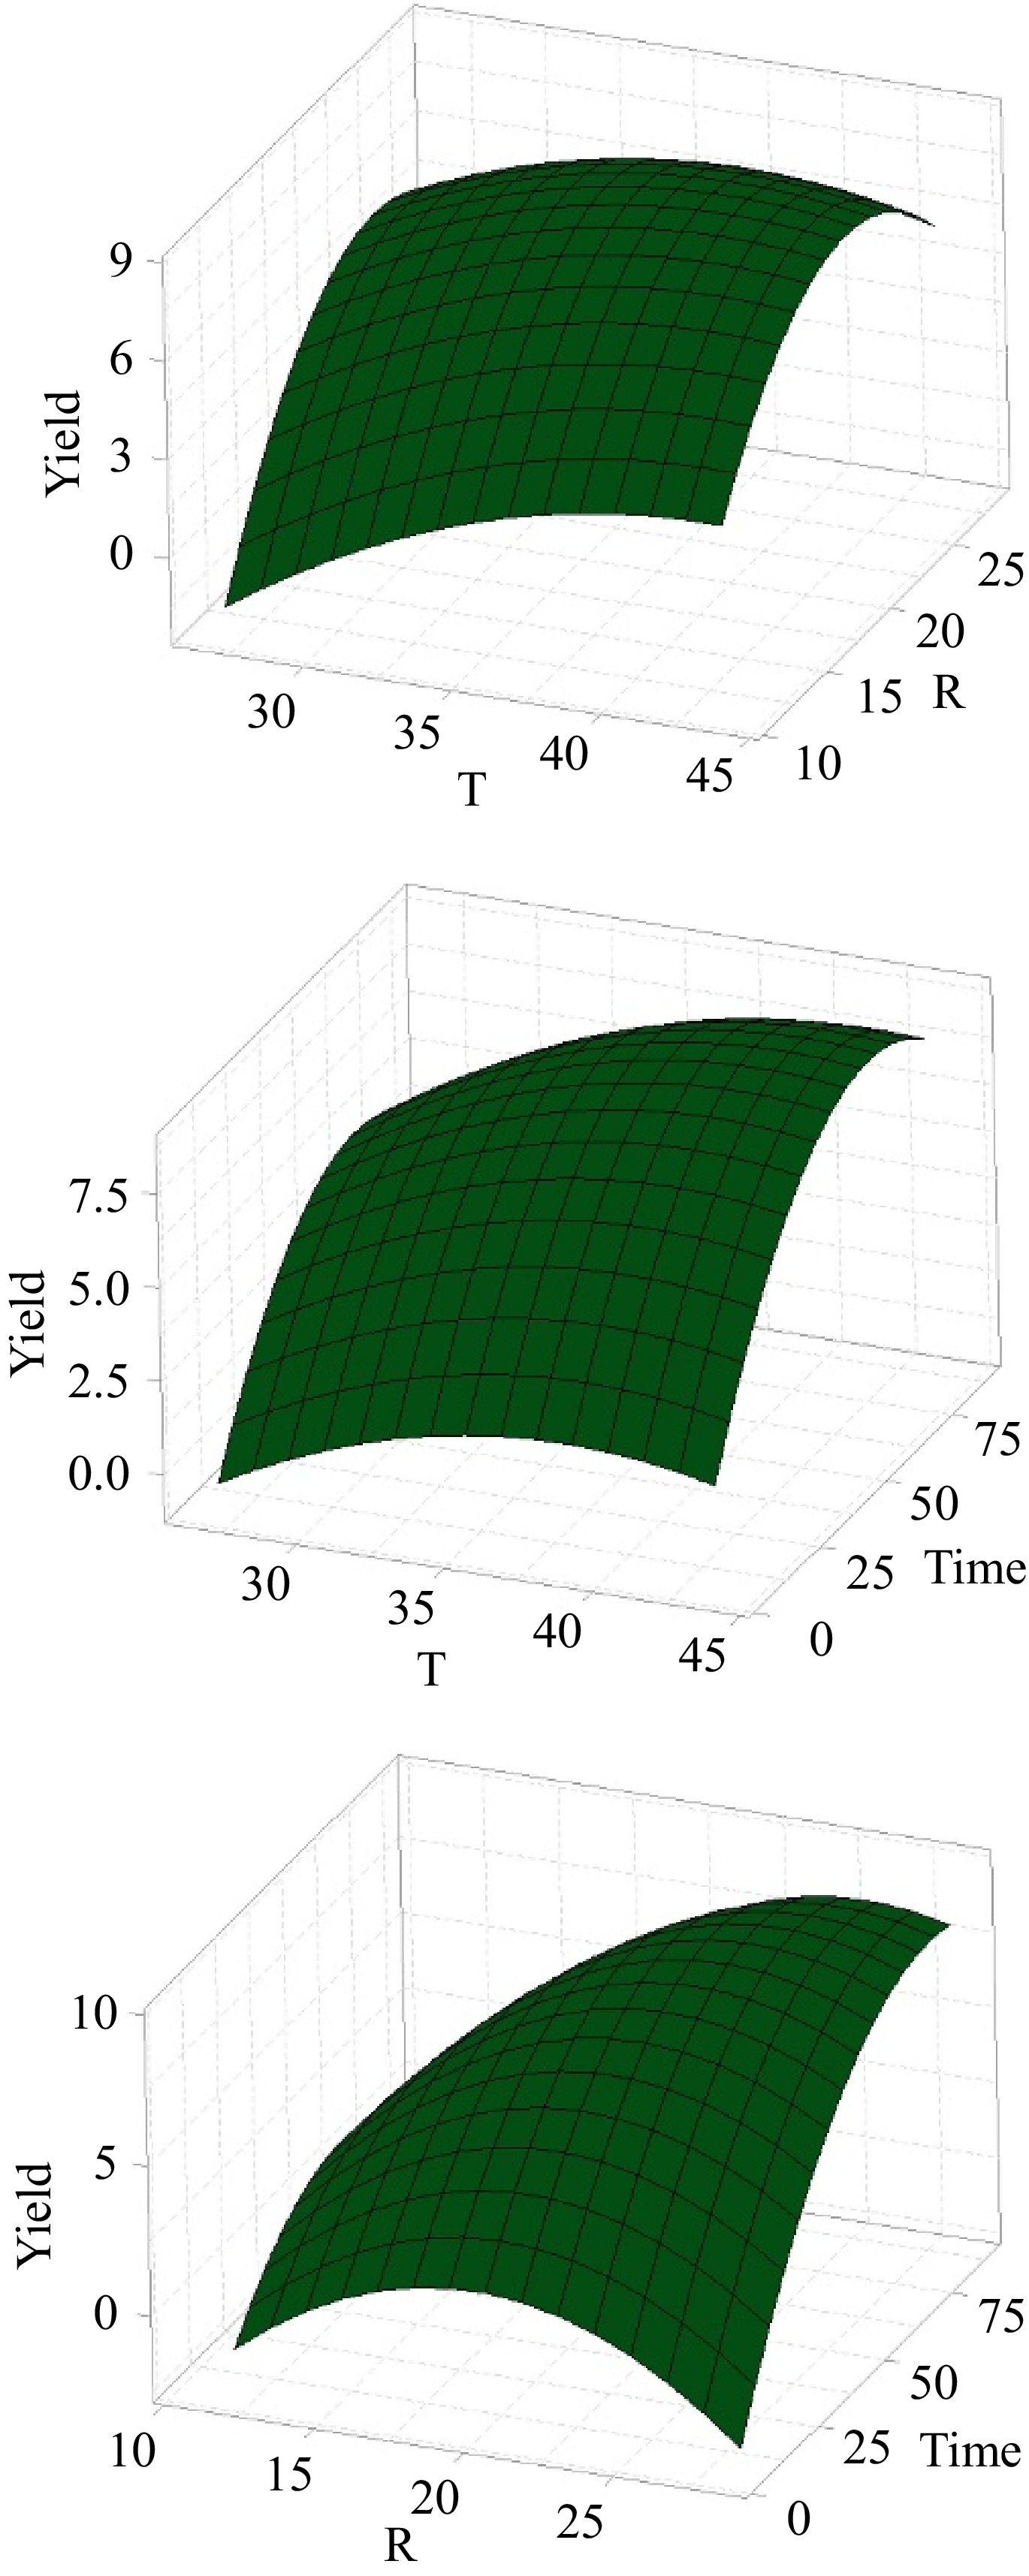
      Figure 3. 

      Surface plots for the collagen extraction from sardine bone in water extract of BP.

      The second most influential variable is the sardine bone-to-solvent ratio, with a positive coefficient of 1.320 (Table 2). This study examined ratios ranging from 1:12 to 1:28 (Table 1). Increasing the ratio from 1:12 to 1:20 boosted yield, but further increasing to 1:28 led to a decrease in yield. A higher sardine bone-to-solvent ratio of 1:25 resulted in higher yields than a ratio of 15, regardless of temperature. For instance, at 40, increasing the ratio from 1:15 to 1:25 improved the yield from 5.5% to 9.1%. Similarly, at 30, the yield increased from 2.6% to 8.1% with the same ratio change. These trends suggest that the sardine bone-to-solvent ratio influences collagen extraction yield in several ways. Within the 1:12−1:20 range, there are enough solvent molecules for sardine bone in the extraction medium. Increasing the ratio within this range can enhance the contact surface area between the sardine bone and the solvent molecules as well as improvement of the solvent molecules diffusion rate into the sardine bone matrix, thereby facilitating collagen extraction. Moreover, a higher ratio can ensure that all parts of the sardine bone are in direct contact with the extracting solvent, maximizing collagen extraction[28].

      Temperature, the least influential variable, has a positive coefficient of 0.935 (Table 2). This study examined temperatures ranging from 27 to 43 °C. Collagen extraction yield increased as the temperature rose within the range of 27−40 °C. The yields are generally higher around 35 to 40 °C. At 40 °C, yields were consistently higher than 30 °C. Higher temperatures accelerate the reaction rate, solubility, and diffusion rates, leading to increased collagen extraction yield. Specifically, at 40 °C with a ratio of 1:25, and 72 h, the yield was 9.1%, while it dropped to 5.5% for a ratio of 1:15 under the same conditions. At 43 °C, the yield was 7.7%, suggesting that temperatures slightly above 40 °C can still maintain high yields, but extremely high temperatures may not be necessary. The yield at 43 °C with a ratio of 1:20 after 48 h was 7.7%. These results are due to collagen degradation at temperatures higher than 40 °C[29,30]. At 27 °C, the yield dropped to 3.9%, indicating reduced extraction efficiency at lower temperatures.

    • The response optimizer tool in Minitab software predicted the optimum values of the selected variables. These values include a temperature of 40 °C, a sardine bone-to-solvent ratio of 24, and an extraction time of 74 h, which were determined to achieve a maximum collagen extraction yield of 9.21%. Then the optimum response variables were tested to validate the model predictions, resulting in a collagen extraction yield of 9.82%, which closely aligns with the model prediction. This result indicates that the model is reliable and can effectively predict the optimal conditions for maximizing collagen extraction yield.

    • The results presented in Table 3 underscore the significant impact of solvent pH on collagen extraction yield. Collagen exhibits higher solubility under acidic conditions[31]. Therefore, solvents with lower pH values, like PP (pH 4.46) and MP (pH 4.80), are expected to be more effective in extracting collagen. The highest extraction yield (13.58%) is achieved with PP, due to its lowest pH compared to other solvents. Conversely, CH, with the highest pH (6.85), yielded the lowest (2.10). Citric acid and BP, with a pH value of 5.87, also resulted in lower extraction yields. This trend can be attributed to the decreasing solubility of collagen as pH rises, leading to diminished extraction efficiencies.

      Table 3.  Collagen extraction yield for different solvents under optimum conditions, including temperature of 40 °C, sardine fish bone to solvent ratio of 24, after 74 h of extraction.

      Biomass source for water extract Solvent pH Collagen yield (%)
      BP 5.87 9.82
      CH 6.85 2.10
      PP 4.46 13.58
      MP 4.80 11.79
      Citric acid 5.87 4.06

      Another important parameter is solvent purity. As described in the solvent preparation section, water extracts were obtained by boiling biomass powder in water. Consequently, these extracts are not pure and likely contain various chemicals extracted simultaneously from the waste feedstock. The chemical composition of these water extracts, established through GC-MS analysis are listed in Table 4.

      Table 4.  GC-MS profile of solvents extracted from biomass including BP, CH, PP, and MP.

      Retention time Name Molecular formula Molecular
      weight (g mol−1)
      BP
      3.136 Oxalic acid C2H2O4 90.036
      6.331 Malic acid C4H6O5 134.088
      8.102 Citric acid C6H8O7 192.124
      9.634 2,4-di-tert-butylphenol C14H22O 220.33
      14.638 Methyl palmitate C17H34O2 270.46
      CH
      3.892 p-Coumaric acid C9H8O3 164.154
      8.102 Syringic acid C9H10O5 198.17
      16.551 Epicatechin C15H14O6 290.27
      PP
      6.331 Malic acid C4H6O5 134.088
      8.102 Citric acid C6H8O7 192.124
      8.587 Ferulic acid C10H10O4 194.18
      MP
      4.743 Succinic acid C4H6O4 118.088
      6.331 Malic acid C4H6O5 134.088
      8.102 Citric acid C6H8O7 192.124
      10.660 3-Deoxy-d-mannoic lactone C6H10O4 146.14
      10.985 3-Deoxy-d-mannoic acid C6H12O5 162.14
      20.551 Mangiferin C19H18O11 422.38

      The GC-MS analysis reveals that BP, PP, and MP contain malic acid and citric acid, whereas these acids are absent in the water extract of CH. In contrast, the CH water extract contains p-coumaric acid and syringic acid, which are weaker acids compared to malic acid and citric acid. These results confirm variations in pH among the water extracts.

      To investigate the impact of the chemical composition of the water extracts on the extraction yield, the hierarchical structure of fish bone is illustrated in Fig. 4. This extraction process likely involves the dissolution of mineral components, facilitating the extraction of collagen from the bone matrix. Collagen is embedded in minerals within the structure of fish bone. Releasing these minerals as soluble salts could liberate the embedded collagen from the fishbone matrix[32], leading to an increase in the collagen extraction yield. Among the different acids present in the water extracts, citric acid, and malic acid can form chelates with minerals in the fishbone.
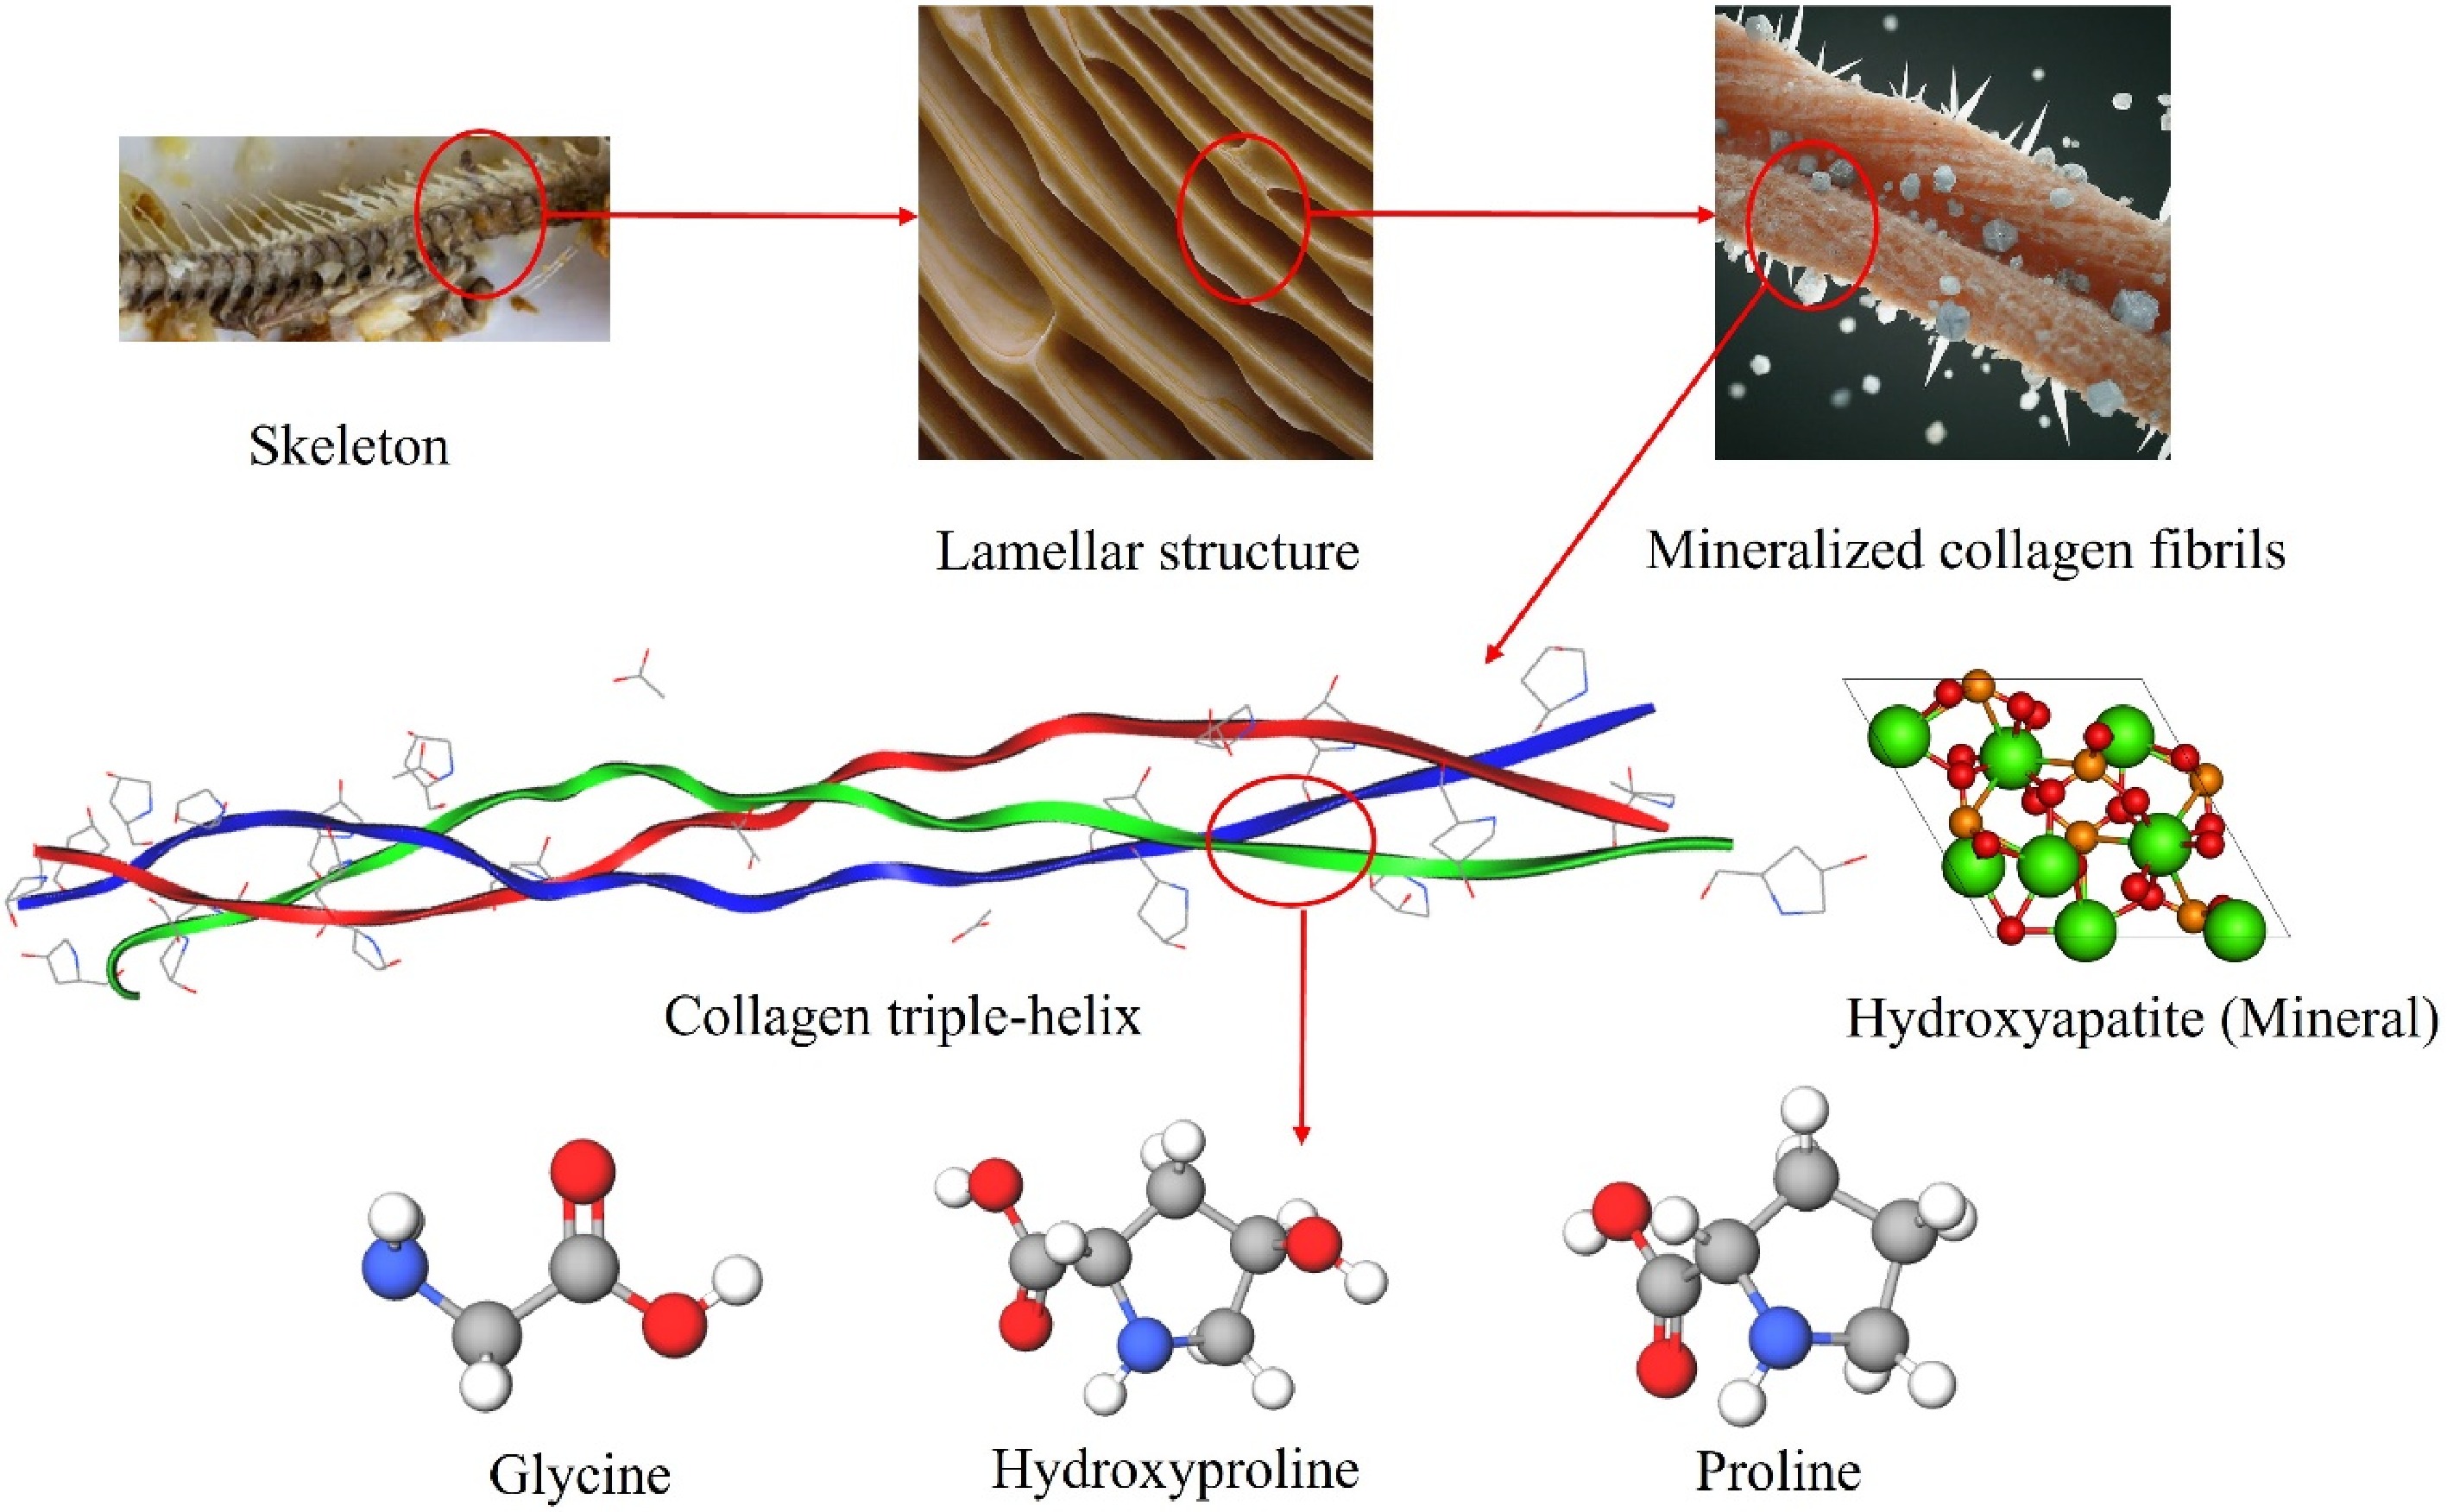
      Figure 4. 

      Hierarchical structure of fish bone and amino acids found in collagen structure[33].

    • The FT-IR spectra of collagen extracted using citric acid and BP extract are compared in Fig. 5. These spectra show similarity, with a broad band in the range of 3,250−3,650 cm−1, corresponding to hydrogen bonds in the collagen structure. Peaks at 2,962.66 and 2,931.80 cm−1 are attributed to -C-H (CH3) and -C-H (CH2) stretching, respectively. The peak at 16,443.35 cm−1 is associated with amid I, while the one at 1,530 cm−1 is attributed to amid II[15]. These peaks confirm the presence of collagen in the extracted samples. Notably, the spectra exhibit two sharp peaks at 2,360.87 and 2,337.72 cm−1. Before analysis, the samples were subjected to heat treatment for 6 h at 60 °C to remove water. This heat treatment step could lead to the decomposition of organic chemicals from the water extracts, releasing CO2, which could then be absorbed on the surface of the sample[34]. Therefore, the presence of CO2 is observed in the spectra.
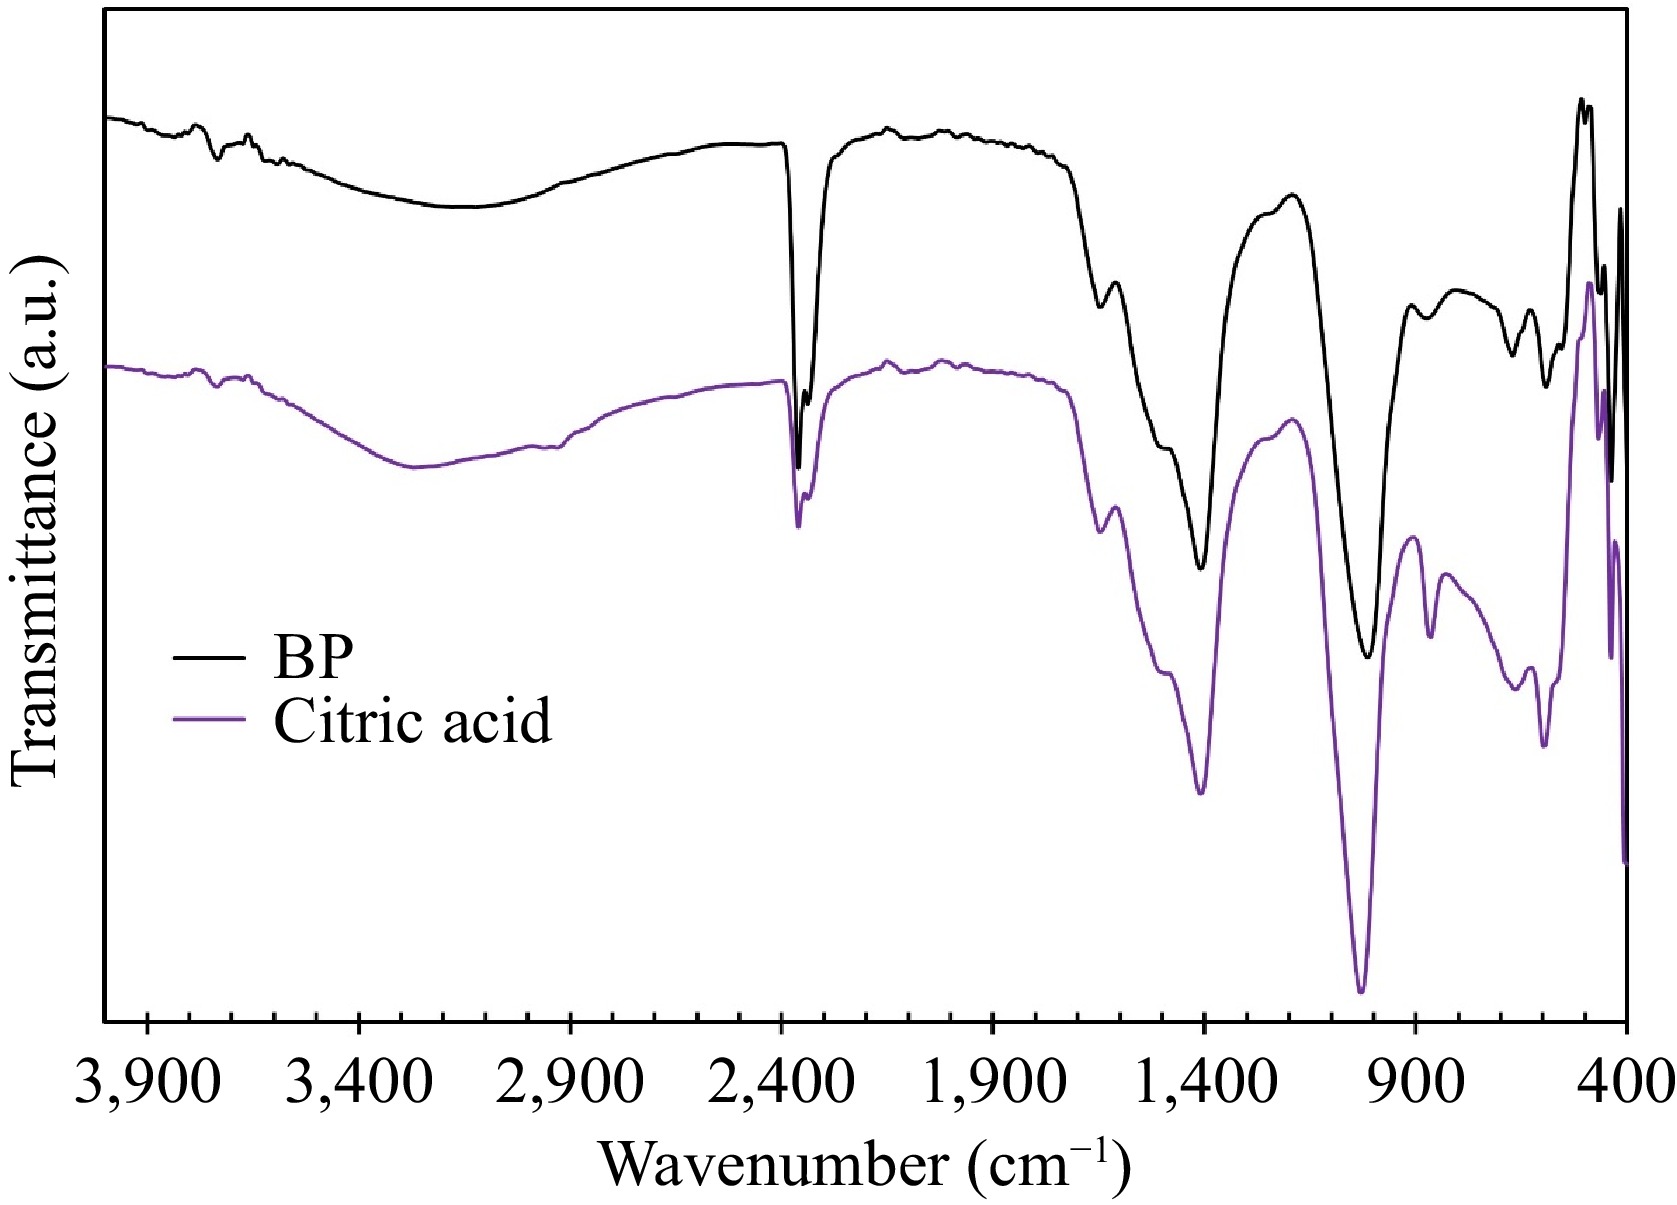
      Figure 5. 

      FT-IR spectra of the collagen samples extracted in citric acid and BP.

    • To evaluate the thermal stability of the samples obtained under optimal conditions, TGA was employed, and the results are presented in Fig. 6. Two mass losses are seen upon heating the sample. The first mass loss is observed at 75.33 °C, accounting for 7.15% of the total mass. This low-temperature mass loss is due to the evaporation of water[35]. Another mass loss is observed at 282.17 °C, accounting for 11.14% of the total mass. During this stage, organic compounds within the sample undergo decomposition or combustion, leading to the release of gases such as CO2, NH3, and H2S. this process is often associated with the degradation of proteins present in the collagen samples[36].
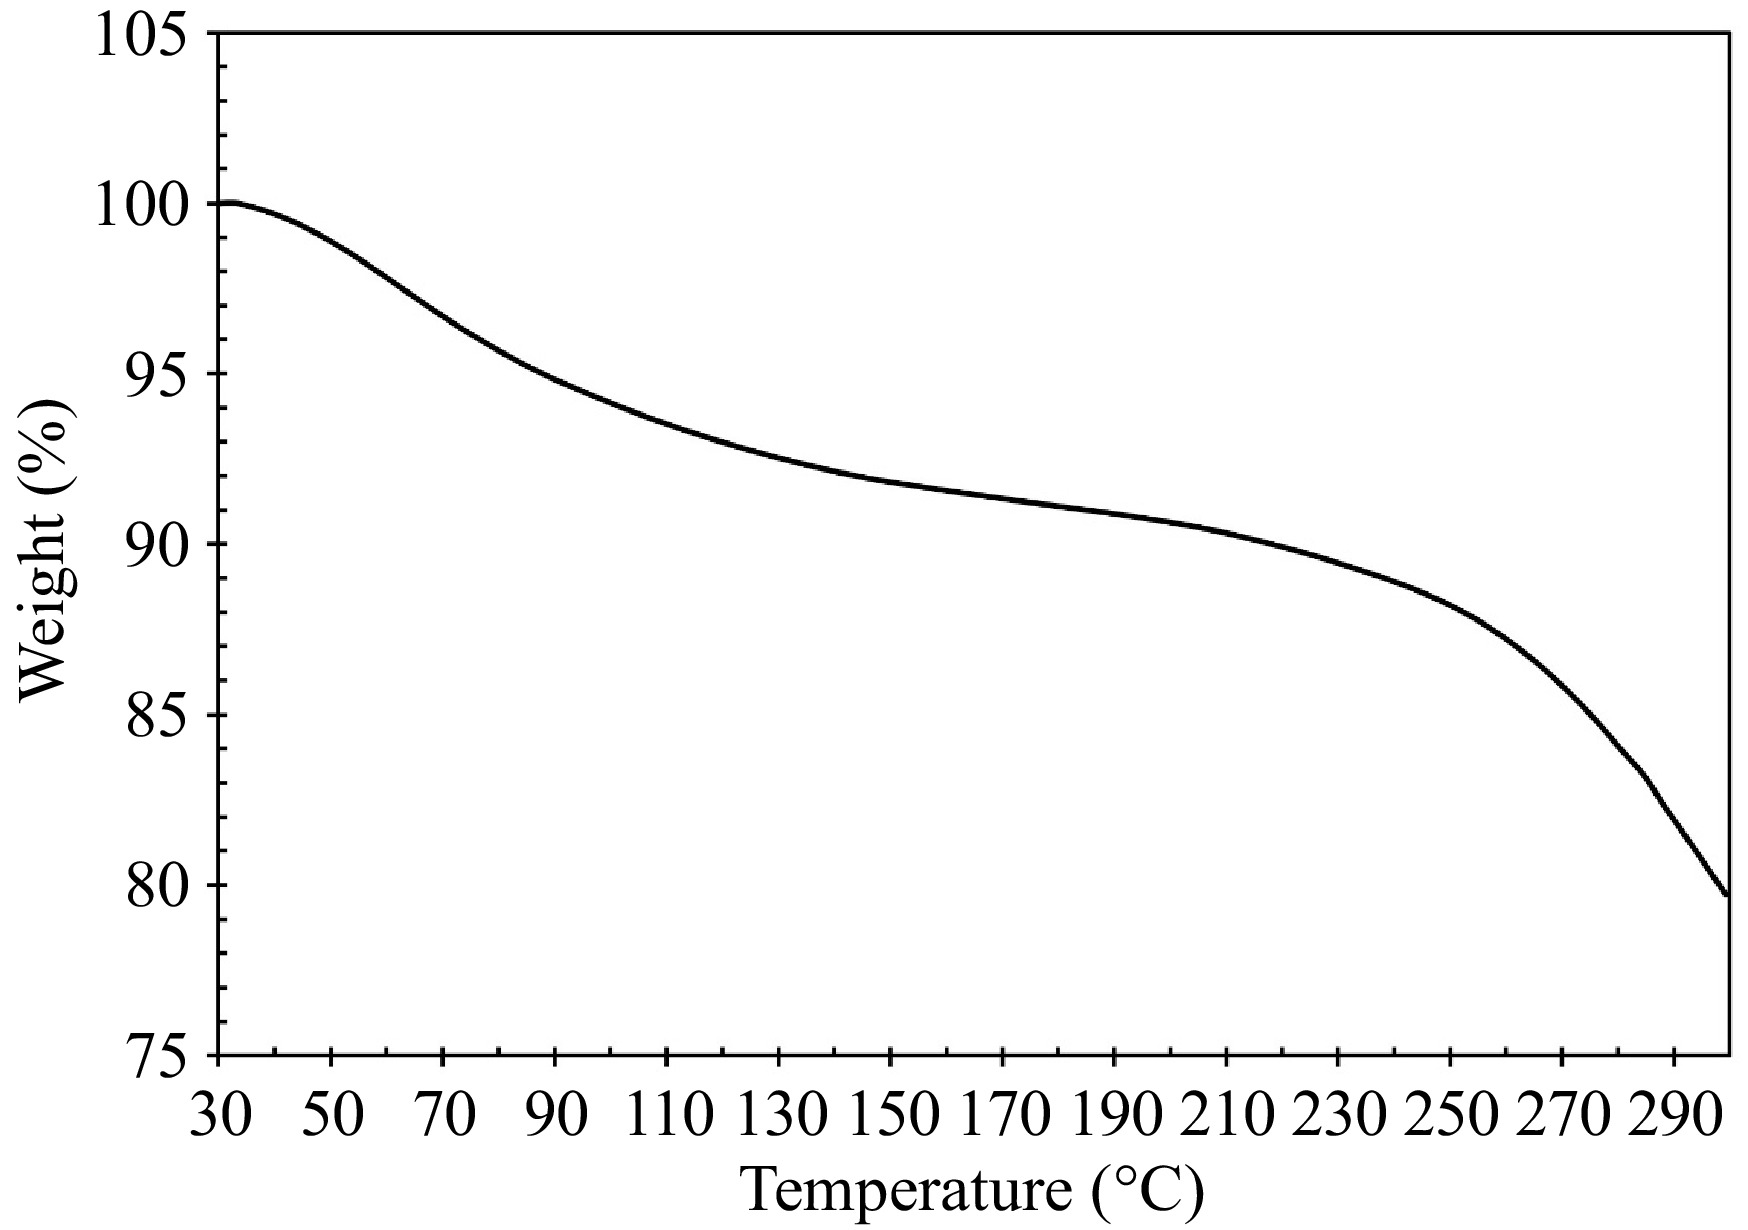
      Figure 6. 

      TGA curve for collagen analysis.

      The denaturation temperature of collagen type I is intricately linked to its hydroxyproline content, higher hydroxyproline levels correspond to increased thermal stability of collagen type I[37]. Additionally, the thermal stability is influenced by the physiological temperature of the fish species[30]. Collagen from tropical and subtropical fish tend to exhibit higher thermal stability, with freshwater fish collagen generally being more stable than that from marine species[3].

    • Table 5 presents the proximate analysis of both the sardine bone and the collagen extracted under optimal conditions. The sardine bone has a high ash content of 51.04%, while the extracted collagen has a content of 12.76%. The fishbone mainly consists of calcium, phosphorus, and other minerals essential for bone structure and strength [2]. The ash found in the extracted collagen is due to the presence of minerals dissolved in the water extract during the collagen extraction process. Both the sardine bone and the extracted collagen have the same moisture content of 8.0%, attributed to humidity absorption[2].

      Table 5.  Proximate analysis of sardine fish bone and extracted collagen at optimum conditions; temperature of 40 °C, fishbone to solvent ratio of 24, and extraction time of 74 h.

      Sardine fish bone Collagen sample
      Total ash (%) 51.04 12.76
      Moisture (%) 8.0 8.0
      Protein (%) 22.3 73.3
      Total fat (%) 0.9 0.1
      Carbohydrate (%) 5 5
      Crude fiber (%) < 0.1 < 0.1
      Energy kcal 100 g−1 117 316

      The protein content of the extracted collagen is 73.3%, much higher compared to the sardine bone, 22.3%. This indicates that the extraction process is highly effective in isolating collagen from the fishbone. Both the sardine fish bone and the extracted collagen sample have low fat content (< 1%). Sardines, similar to the fish used in this study, exhibit a fat content ranging from 2.64% to 25.52% due to variations in catch season, location[38], sampling time, and through washing of sardine bones during preparation.

      Both the sardine bone and the collagen sample have the same carbohydrate content, 5.0%. Fish bones contain a small amount of carbohydrates, primarily in the form of complex sugars, which provide structure and flexibility to the bones[2]. The other source of carbohydrate detected in the collagen sample could come from those absorbed from the water extract. Both the sardine bone and the collagen sample have very low crude fiber content, less than 0.1%. The collagen sample has an energy content of 3.16 kcal g−1, higher than the one for sardine bone's 1.17 kcal g−1. This higher energy content can be attributed to the collagen sample's higher protein content, as protein provides more energy per gram compared to other macronutrients[39]. Overall, the proximate analysis results indicate that the collagen extraction process is highly effective in isolating collagen from sardine bone, resulting in a collagen sample with significantly higher protein content and energy value compared to the original fish bone.

    • UV-Vis spectra of water extracts from various feedstocks, including BP, CH, PP, MP, and, citric acid as a reference, are presented in Fig. 7. The spectra were recorded in the range of 400−800 nm due to the instability of the light source of the spectrophotometry machine at wavelengths lower than 400 nm. Standing out among the spectra is CH, due to its significantly different composition, as detailed in Table 3.
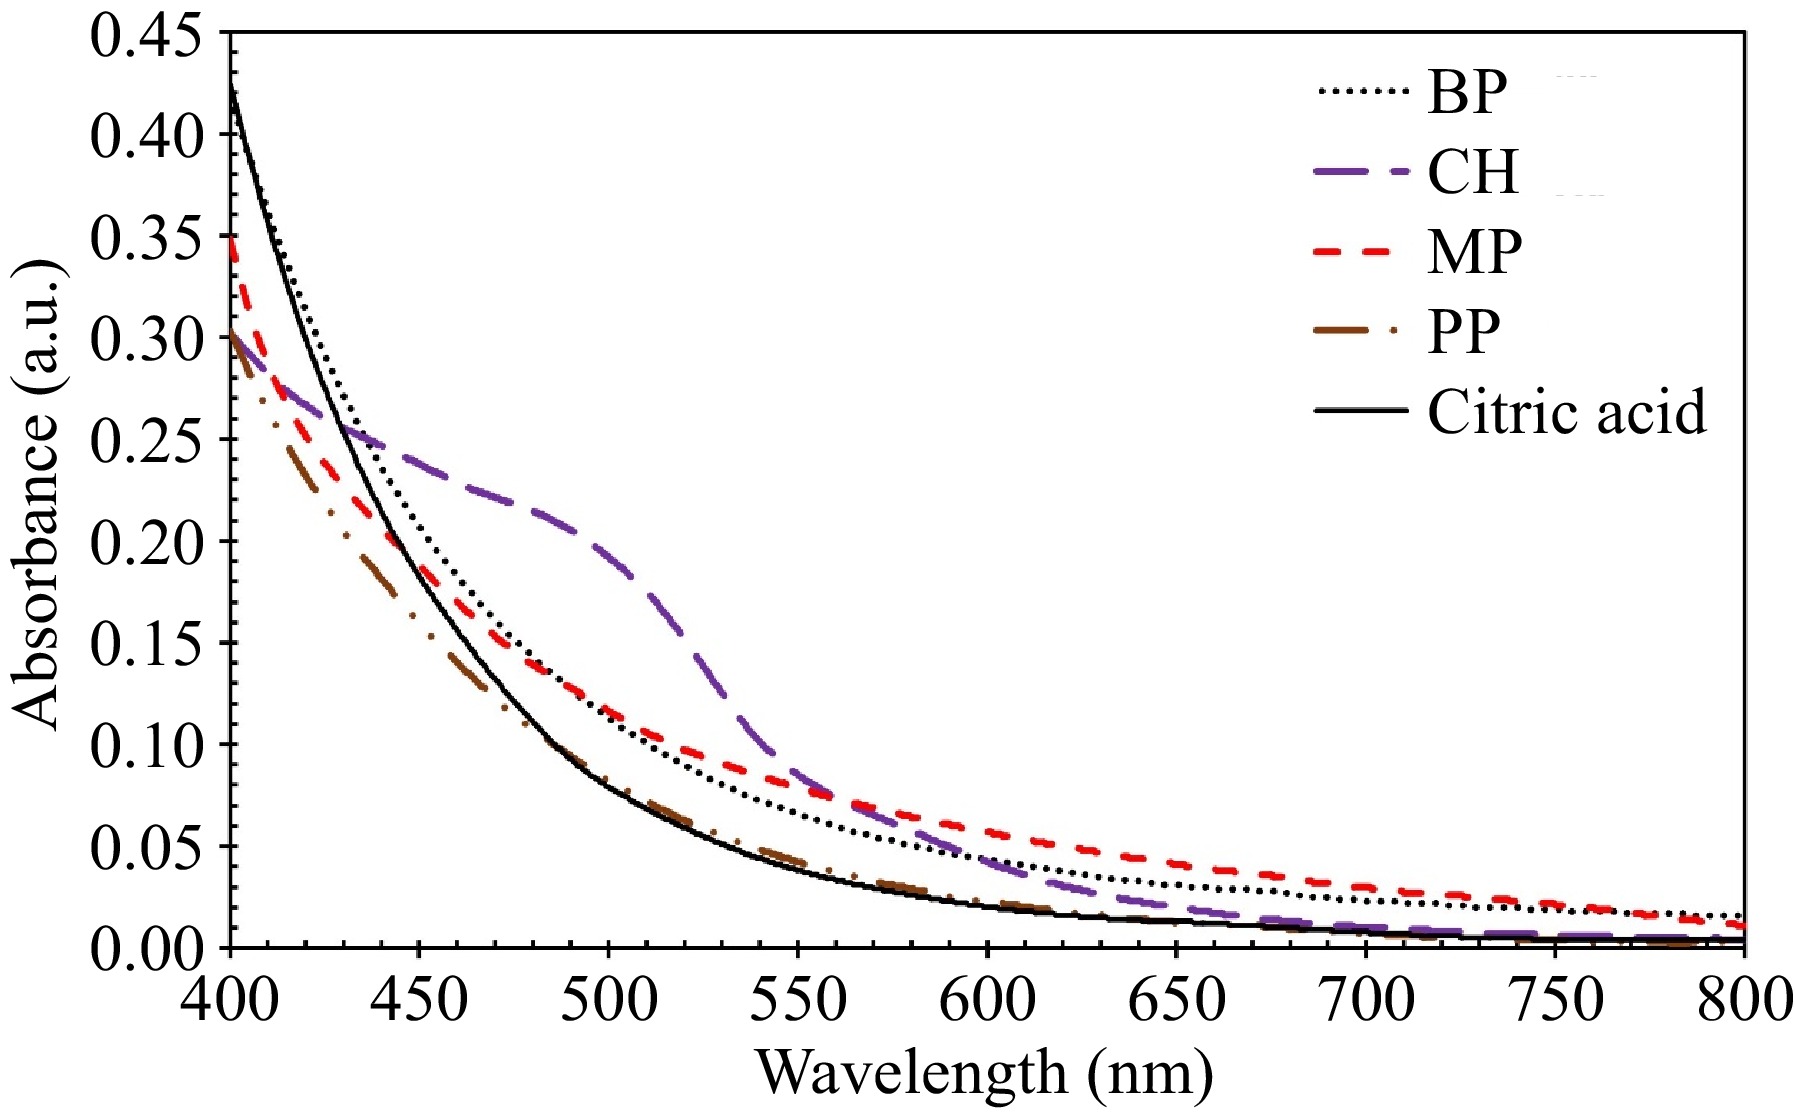
      Figure 7. 

      UV-Vis spectra of water extracts from different types of biomass waste including BP, CH, PP, and MP, along with citric acid as a reference.

    • This study explores the potential of collagen extraction from sardine bones with water extracts from various biomass waste sources (BP, CH, PP, and MP). This method has the potential to significantly reduce waste and promote environmental sustainability. These extracts can act as environmentally friendly acidic alternatives in processing biomass. They could effectively replace traditional acids, like acetic, and citric acid, commonly used in chemical processes. By using these extracts, the process of converting biomass into valuable products becomes more sustainable and aligns better with overall goals for sustainable development.

    • Sardine bone powder, with its rich chemical composition as shown in Table 4, serves as a valuable source of protein and minerals. It can be incorporated as a fortifying agent in staple foods such as bread rolls and cookies, offering a natural source of calcium[40]. Moreover, the powder holds the potential for producing fertilizers suitable for certified organic farming, providing essential nutrients for optimal plant growth[41].

      Water extracts from fruit waste, such as BP, CH, PP, and MP are rich in polyphenols, which exhibit remarkable antioxidant and antimicrobial properties. These bioactive compounds hold immense promise for utilization across various industries, including food, pharmaceuticals, and medicine, due to their potent antioxidant and antimicrobial capabilities[42].

      Proteins are indispensable macronutrients vital for providing energy and supporting tissue repair, muscle development, and overall health[43]. Collagen powder, boasting a high protein content of 73%, emerges as a versatile ingredient applicable across diverse industries, particularly in food. It can serve as a potent protein supplement, enriching products like protein bars, and beverages[44]. With an energy content of 3.16 kcal g−1, collagen offers a substantial source of dietary energy, further enhancing its nutritional value due to its impressive protein concentration. Fish collagen offers several health benefits, e.g. skin, joint, bone, heart, muscle growth and repair[43]. On the other hand, herbal plants such as llicium verum have well-known beneficial effects, such as lowering blood glucose and serum lipids, and anti-aging properties[43]. Combining fish collagen with herbal yogurt has been found to produce bioactive peptides with angiotensin-I converting enzyme (ACE) inhibitory activity. When fish collagen was added to yogurt containing Illicium verum (IV), Psidium guajava (PG), or Curcuma longa (CL), the pH decreased and the amount of OPA peptide increased during storage[45]. Similarly, yogurt containing Lycium barbarum with or without fish collagen showed an increased OPA peptide amount and improved whey protein degradation[46]. Codonopsis pilosula (CP) yogurt with fish collagen exhibited higher ACE inhibitory activity and better sensory evaluation[47]. In plant-based cheeses, the addition of fish collagen increased peptide content and ACE inhibitory activity in cheeses made with IV, PG, or CL[43]. Overall, the incorporation of fish collagen in herbal yogurt and cheese can lead to the production of bioactive peptides with ACE inhibitory activity.

    • The present findings demonstrate that acidic water extracts from various biomass wastes (BP, CH, PP, and MP) can effectively extract collagen from sardine bones. However, the type of biomass waste extract used significantly affects the efficiency of the extraction process. Among them, PP with the lowest pH (4.46) demonstrated the highest effectiveness, yielding 13.58% collagen. Analysis of the collagen samples extracted under optimum conditions—40 °C, sardine bone-to-solvent ratio of 1:24, and an extraction time of 74 h—revealed a high protein content in the extracted powder. This makes the product suitable for numerous applications, particularly in the food industry. Furthermore, the water extracts were found to be rich in polyphenols, exhibiting remarkable antioxidant, and antimicrobial properties, making them suitable for various applications, especially in the food industry. Therefore, future research should focus on optimizing the water extract preparation and collagen extraction conditions to obtain collagen powder, water extract, and collagen-enriched water extracts with specific properties. Exploring the potential applications of these products in different industries is also recommended.

    • The authors confirm contribution to the paper as follows: study conception and design, draft manuscript preparation, supervision: Rastegari H; data collection: Rastegari H, Nor Adzmi NZ; analysis and interpretation of results: Rastegari H, Nor Adzmi NZ; co-supervision: Mohtar NF, Kasan NA; manuscript editing: Nadi F; sardine processing waste supplying: Muda MR (Maperow Sdn Bhd representor); communication with Maperow Sdn Bhd: Abdul Rahim AI; lab arrangements: Kamaruzzan AS, Draman ASH. All authors reviewed the results and approved the final version of the manuscript.

    • The data generated during and/or analyzed during the current study are available from the corresponding author on reasonable request.

      • This research was supported by the Research Management Office (RMO) at Universiti Malaysia Terengganu, through Talent and Publication Enhancement-Research grant (TAPE-RG, Vot. No. 55497) and partial fund by the Ministry of Higher Education, Malaysia through the Fundamental Research Grant Scheme (FRGS) FRGS/1/2020/STG01/UMT/02/4 (Vot. No. 59631). The authors would like to thank Maperow Sdn Bhd for providing the sardine processing waste.

      • The authors declare that they have no conflict of interest.

      • Copyright: © 2024 by the author(s). Published by Maximum Academic Press on behalf of Nanjing Agricultural University. This article is an open access article distributed under Creative Commons Attribution License (CC BY 4.0), visit https://creativecommons.org/licenses/by/4.0/.
    Figure (7)  Table (5) References (47)
  • About this article
    Cite this article
    Rastegari H, Nor Adzmi NZ, Nadi F, Mohtar NF, Abdul Rahim AI, et al. 2024. Water extract of banana peel as a green solvent for extraction of collagen from sardine bone. Food Materials Research 4: e023 doi: 10.48130/fmr-0024-0015
    Rastegari H, Nor Adzmi NZ, Nadi F, Mohtar NF, Abdul Rahim AI, et al. 2024. Water extract of banana peel as a green solvent for extraction of collagen from sardine bone. Food Materials Research 4: e023 doi: 10.48130/fmr-0024-0015

Catalog

  • About this article

/

DownLoad:  Full-Size Img  PowerPoint
Return
Return