-
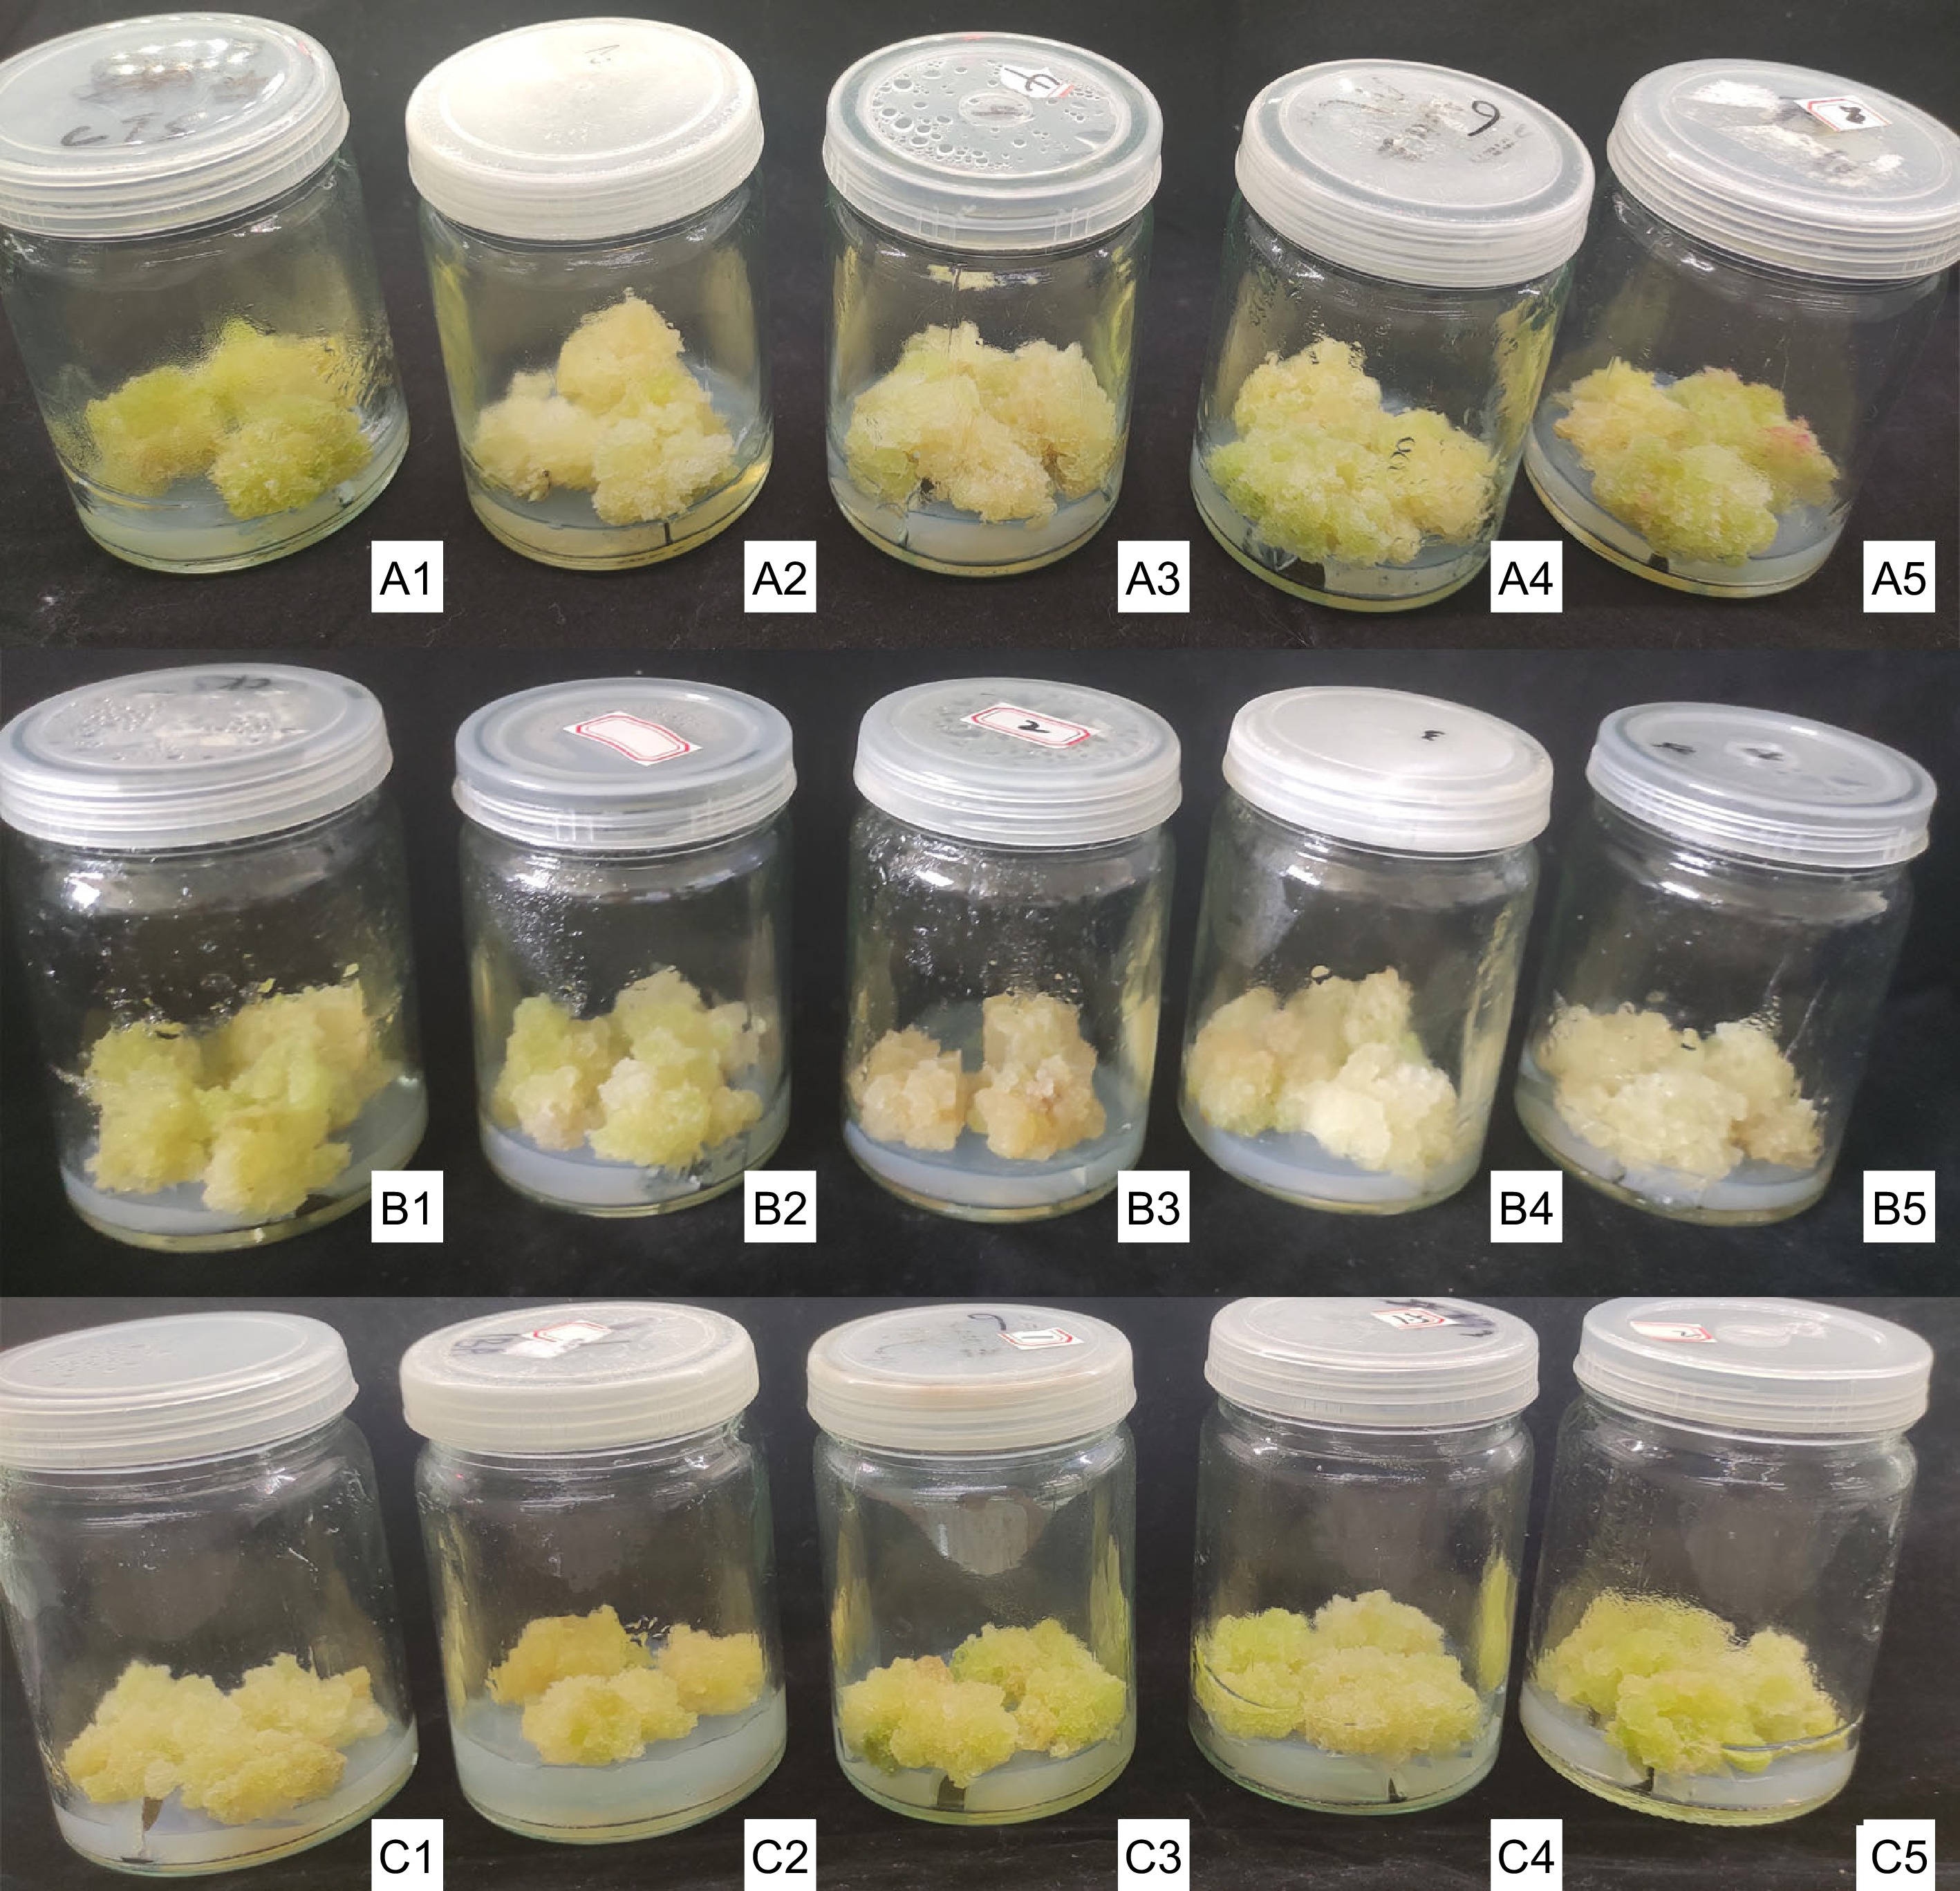
Figure 1.
Effect of amaranth callus growth treated with aromatic amino acids. A1-A5 represents the amaranth callus with 0, 2, 4, 6, 8 mg/L tyrosine for 35 d; B1-B5 represents the amaranth callus with 0, 1, 2, 3, 4 mg/L phenylalanine for 35 d; C1-C5 represents the amaranth callus with 0, 0.5, 1.0, 1.5, 2.0 mg/L tryptophan for 35 d.
-
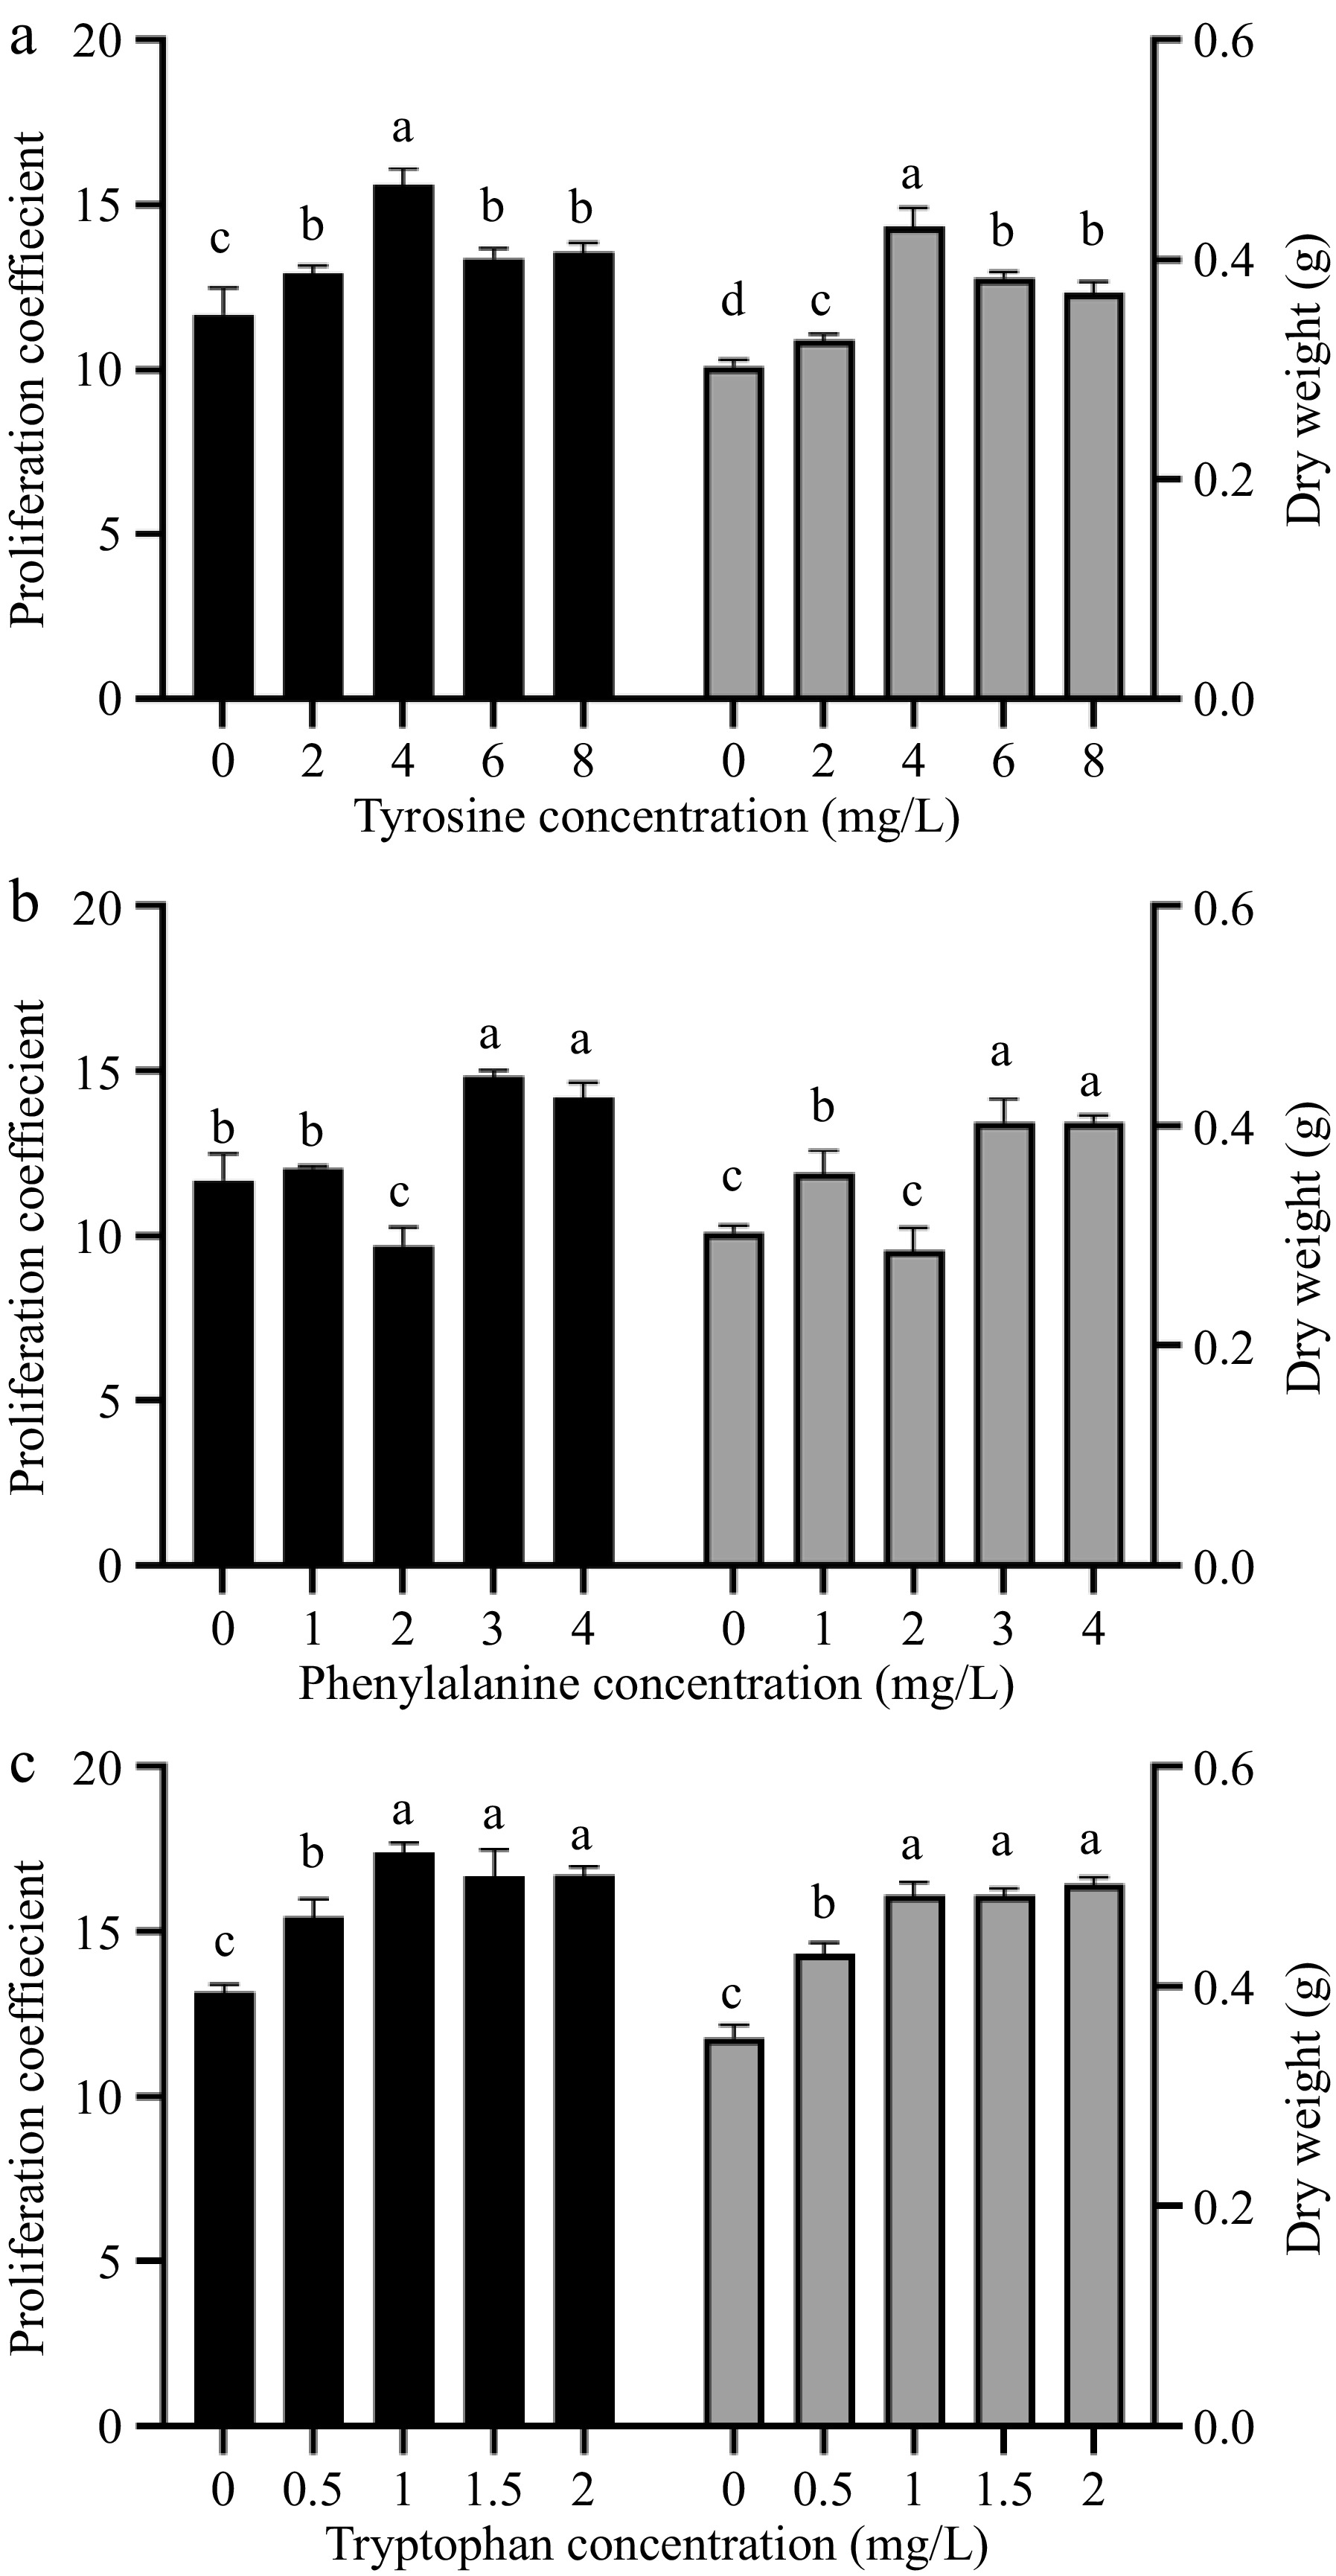
Figure 2.
The effect of different concentrations of aromatic amino acids on amaranth callus proliferation and dry weight. Treatment of (a) tyrosine, (b) phenylalanine, and (c) tryptophan.
-
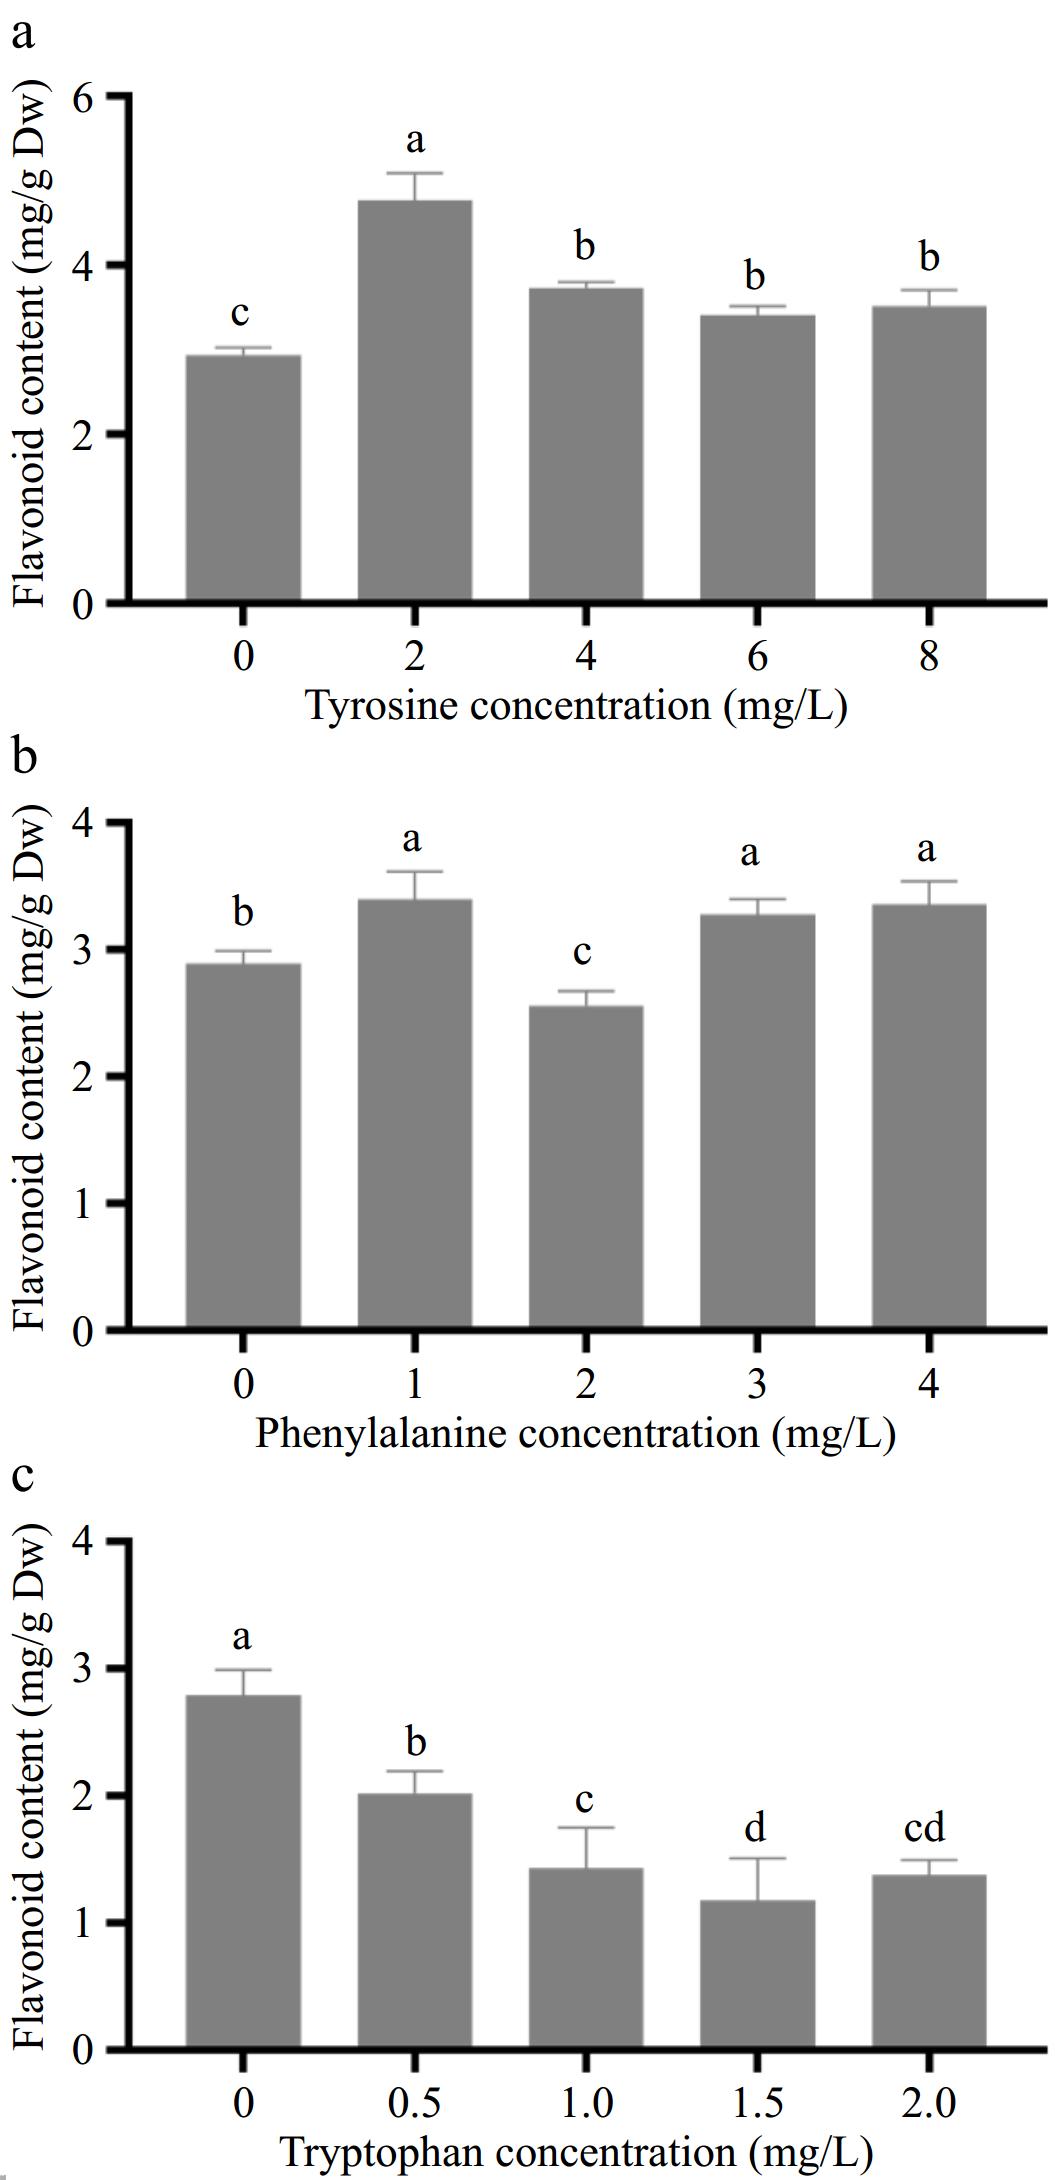
Figure 3.
Effects of different concentrations of aromatic amino acids on flavonoid content in amaranth callus. (a) Tyrosine, (b) phenylalanine and, (c) tryptophan.
-
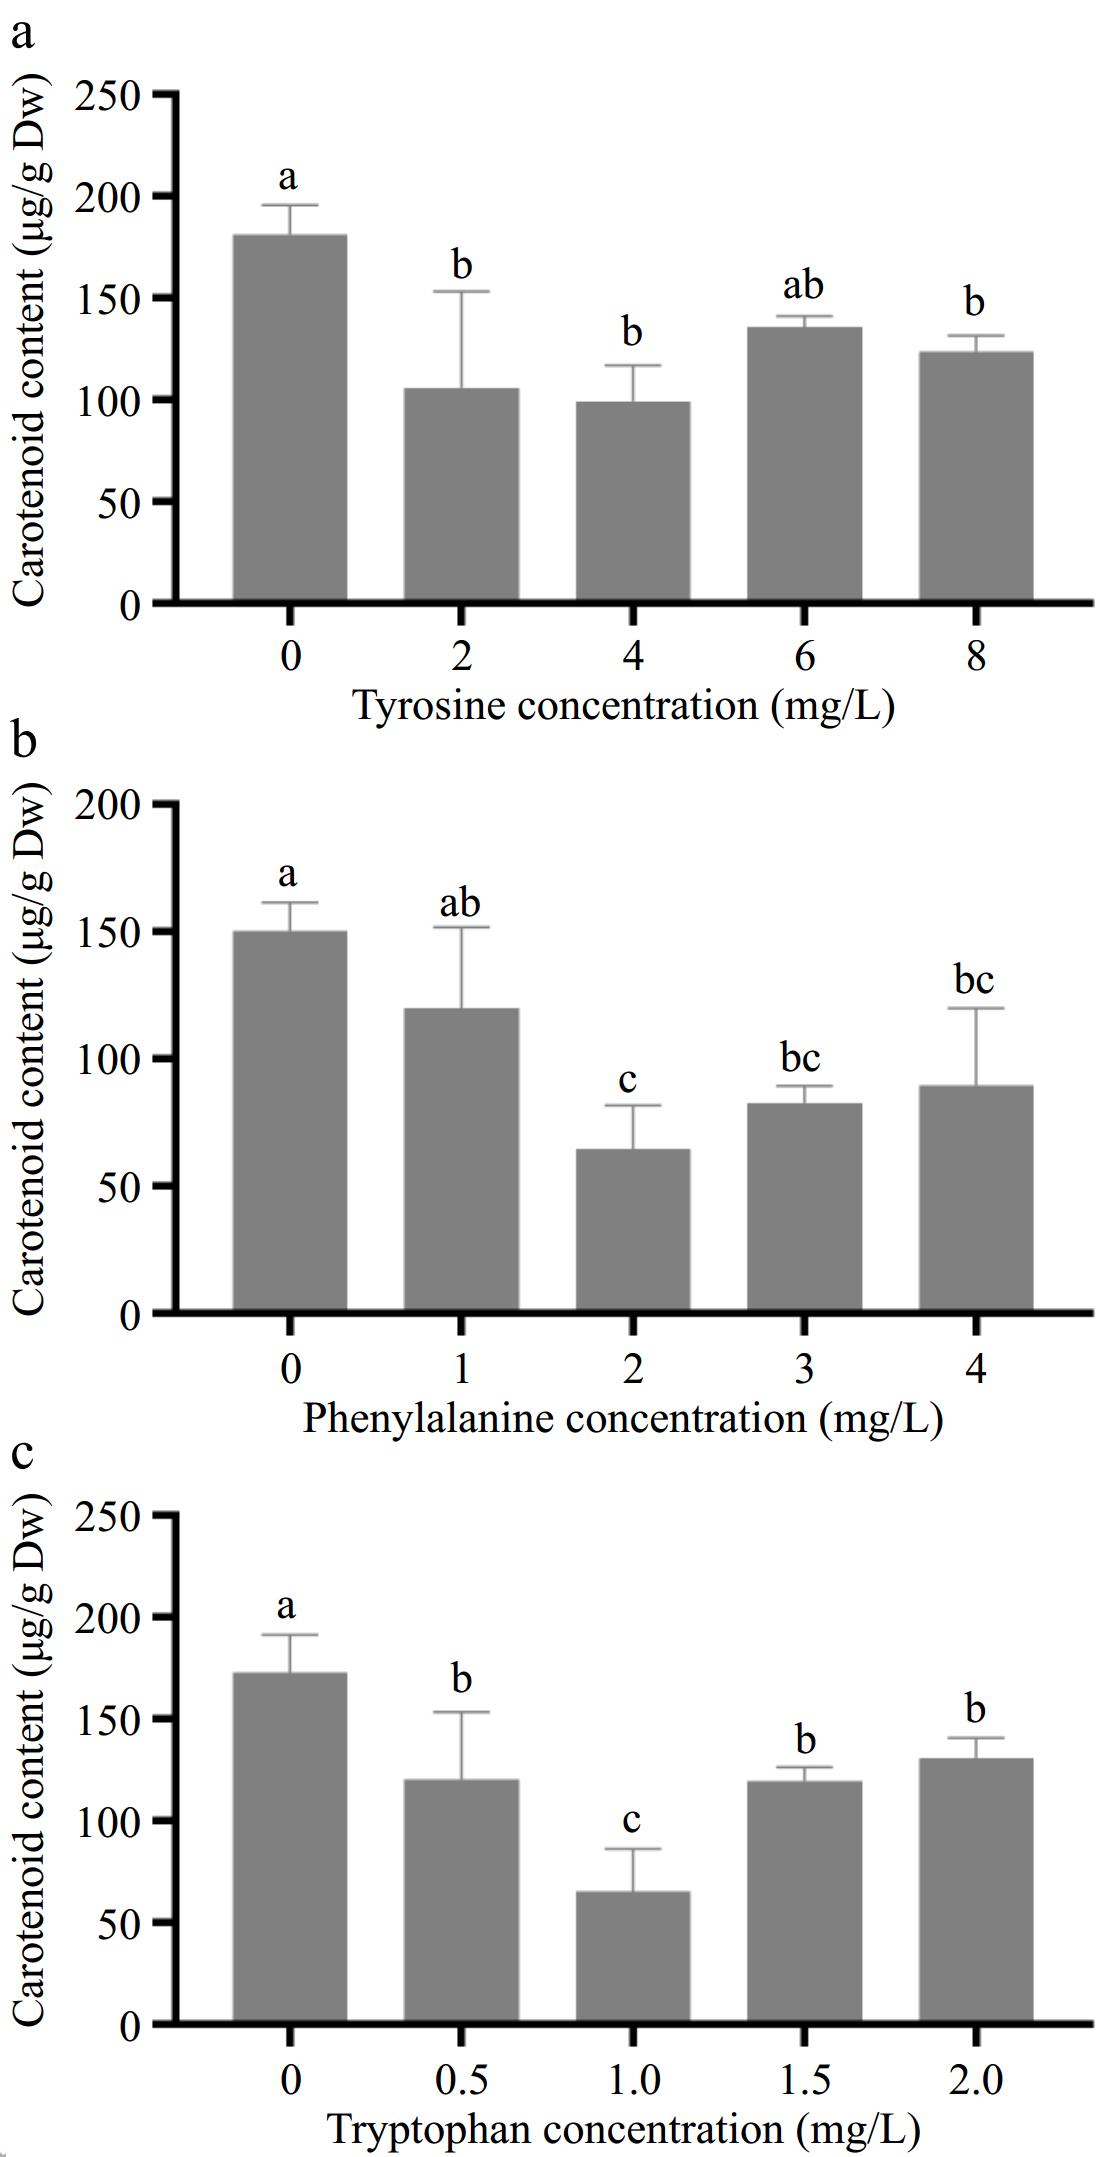
Figure 4.
Effects of different concentrations of aromatic amino acids on carotenoid content in amaranth callus.
-
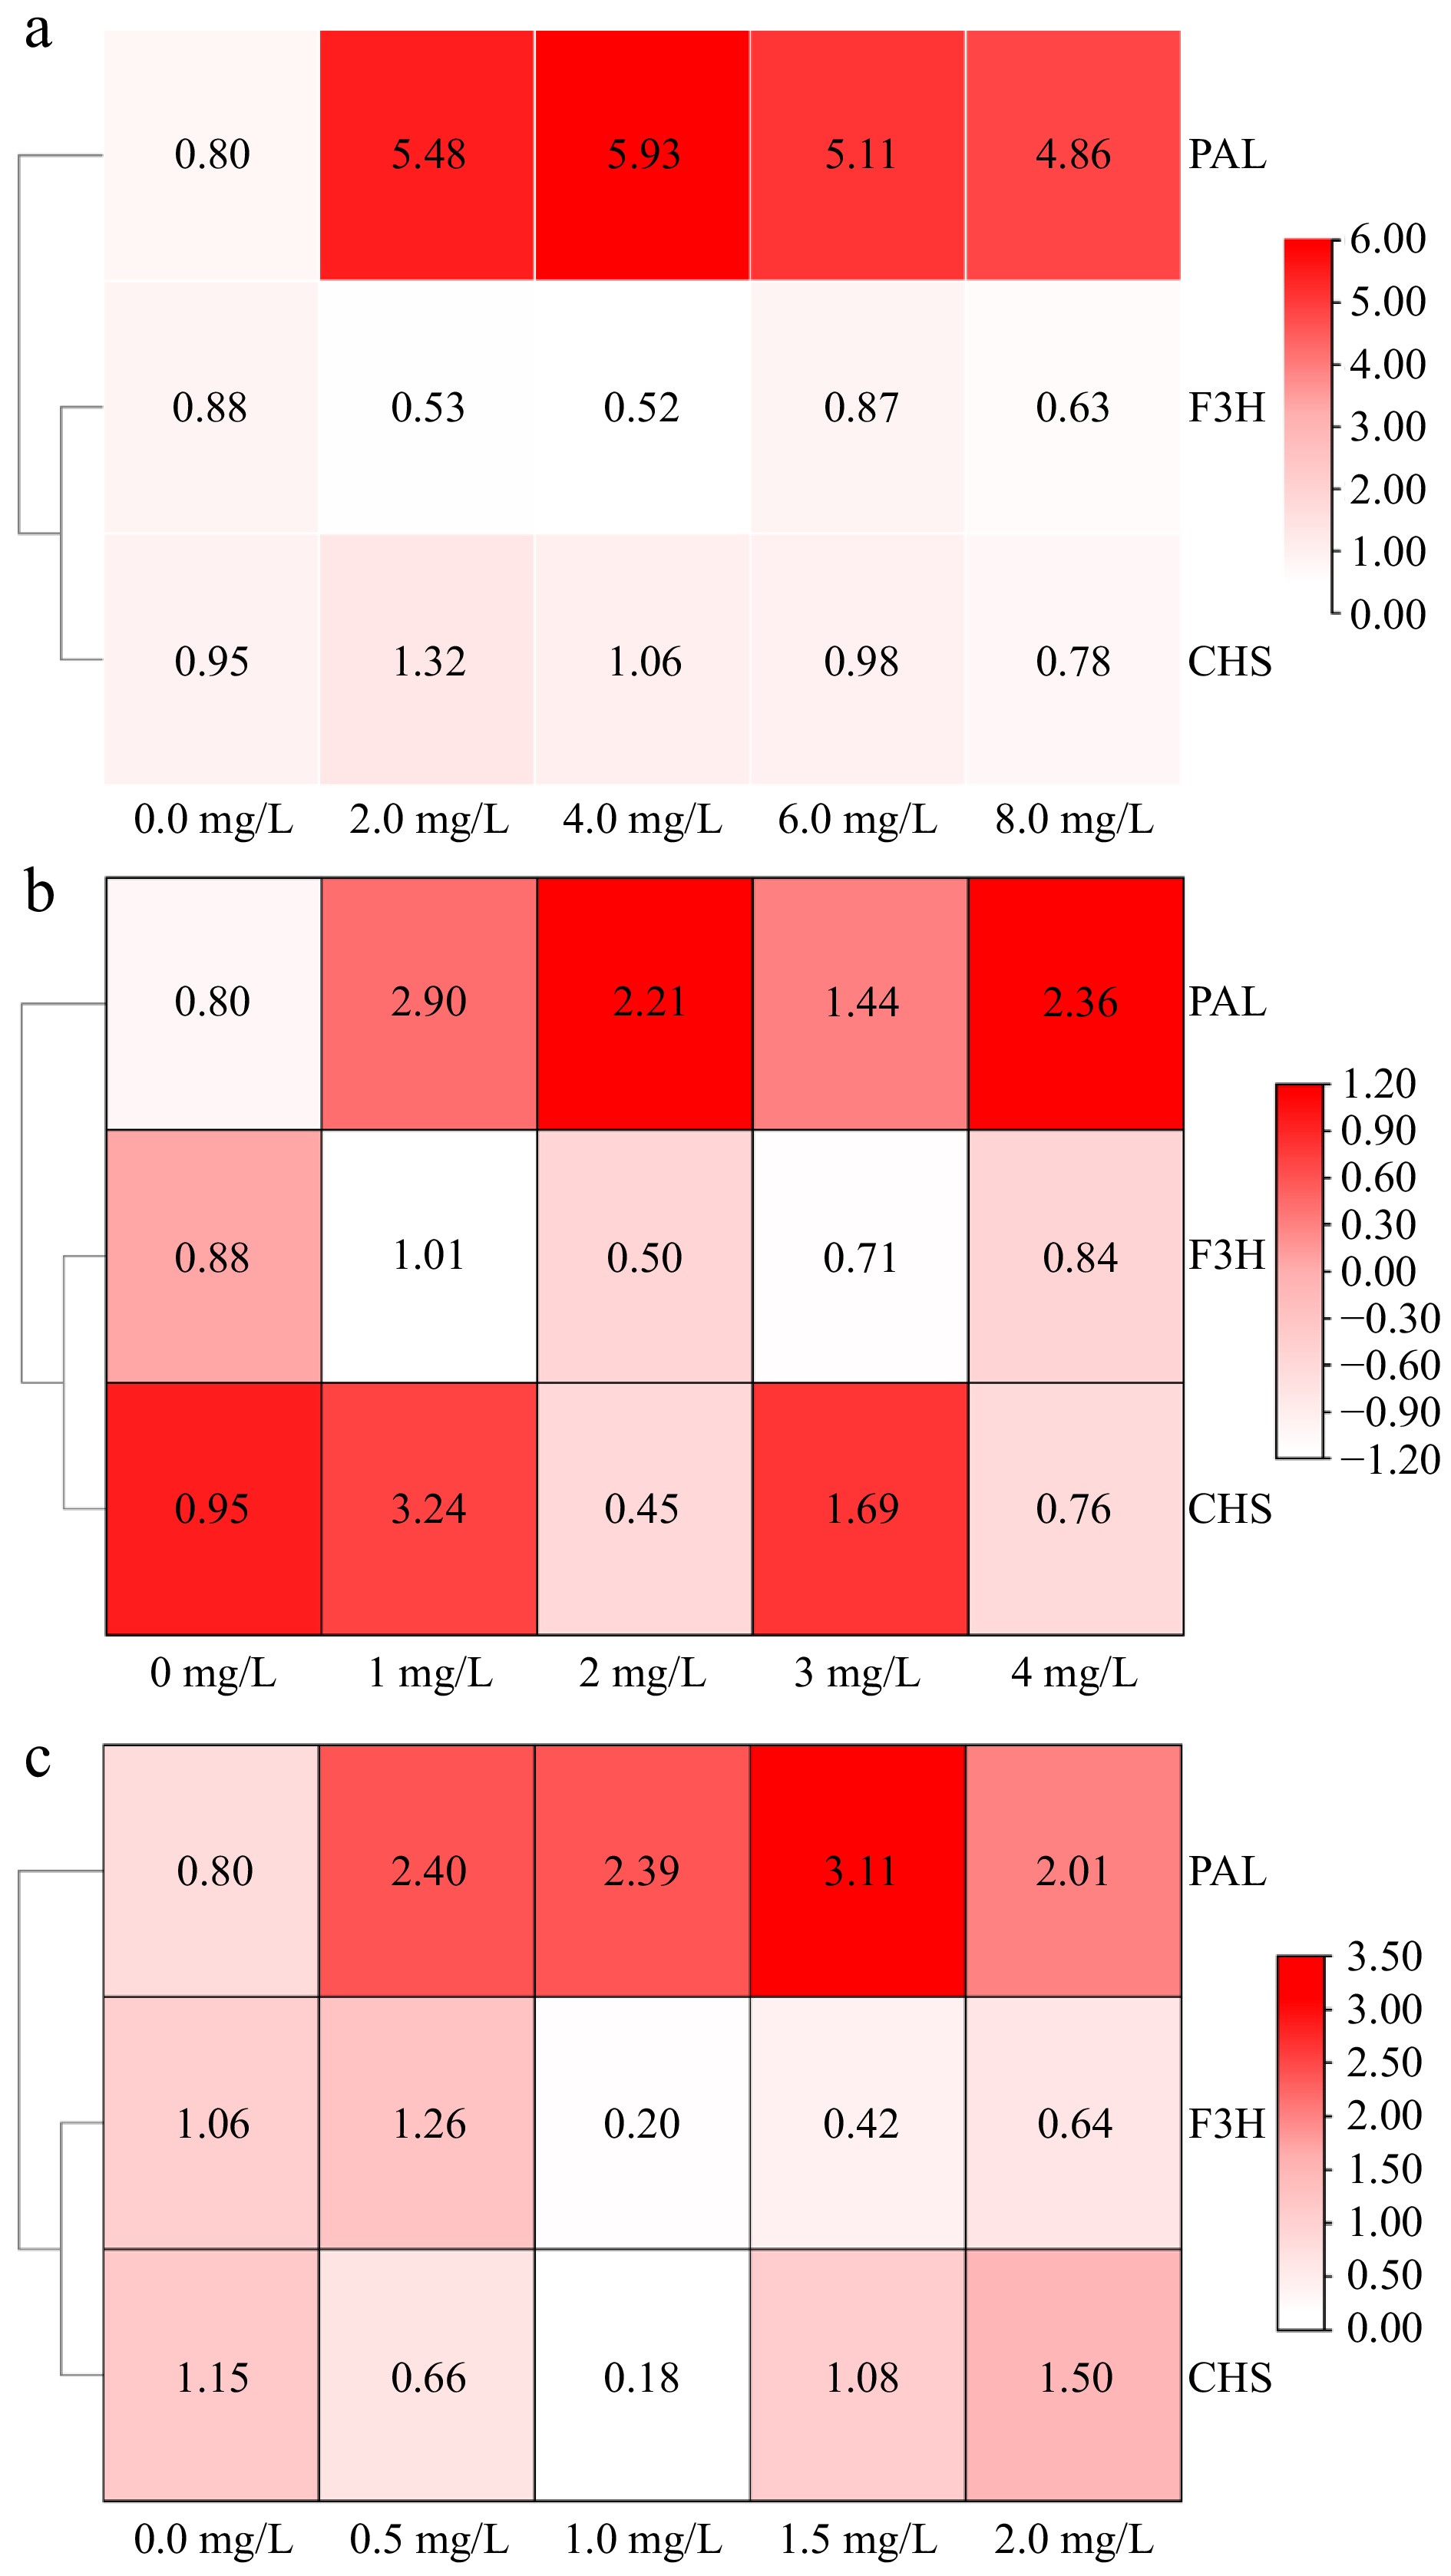
Figure 5.
The effect of aromatic amino acids on the expression of flavonoids metabolism related genes in amaranth callus. (a) Tyrosine, (b) phenylalanine, and (c) tryptophan.
-
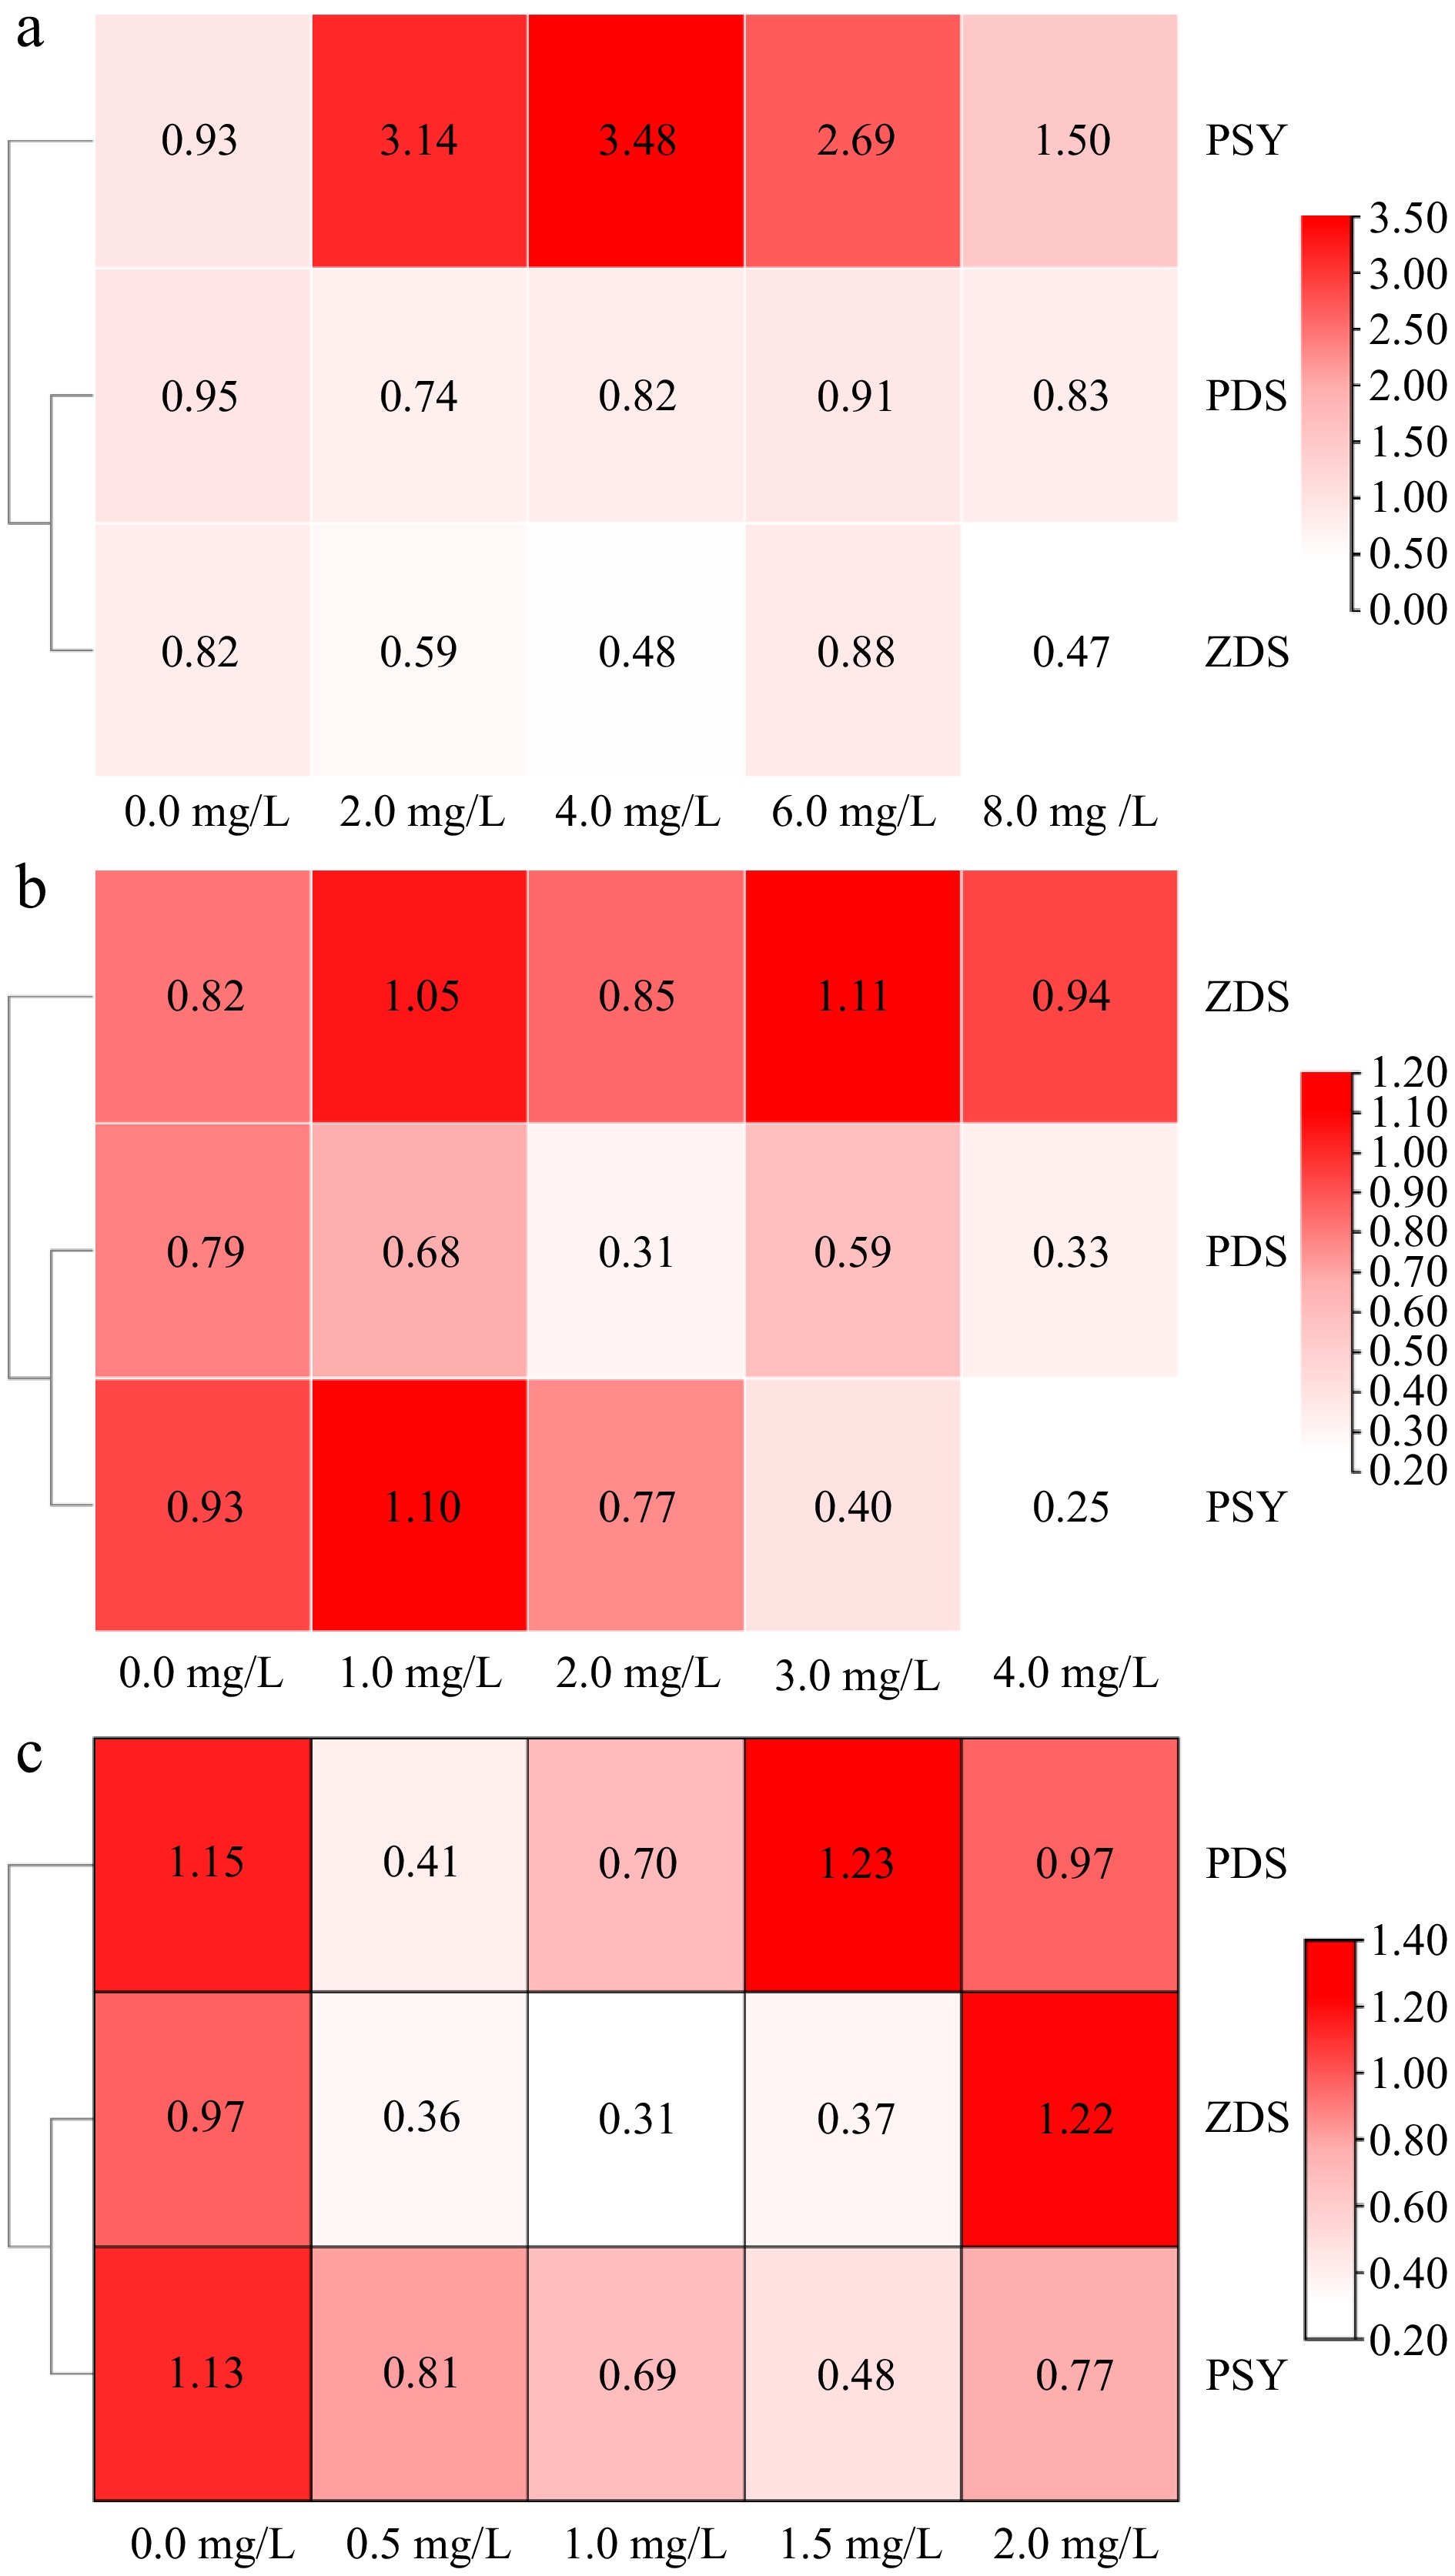
Figure 6.
The effect of aromatic amino acids on the expression of carotenoid metabolism related genes in amaranth callus. (a) Tyrosine, (b) phenylalanine, and (c) tryptophan.
-
Aromatic
amino acidsPAL F3H CHS Tyrosine Pearson correlation 0.615* −0.659** 0.694** Significance (two-tailed) 0.015 0.007 0.004 Phenylalanine Pearson correlation −0.183 0.669** 0.258 Significance (two-tailed) 0.513 0.006 0.353 Tryptophan Pearson correlation −0.858 0.753 0.076 Significance (two-tailed) 0.063 0.142 0.90 * indicates significant correlation at the p < 0.05 level, ** indicates extremely significant correlation at the p < 0.01 level. Table 1.
Correlation analysis of flavonoid content and flavonoid-related genes.
-
Aromatic
amino acidsPDS ZDS PSY Tyrosine Pearson correlation −0.348 −0.356 0.638* Significance (two-tailed) 0.204 0.192 0.011 Phenylalanine Pearson correlation 0.694** −0.025 0.442 Significance (two-tailed) 0.004 0.93 0.099 Tryptophan Pearson correlation 0.342 0.591* 0.57* Significance (two-tailed) 0.212 0.02 0.026 * indicates p < 0.05, ** indicates p < 0.01. Table 2.
Correlation analysis of carotenoids content and carotenoids-related genes.
Figures
(6)
Tables
(2)