-
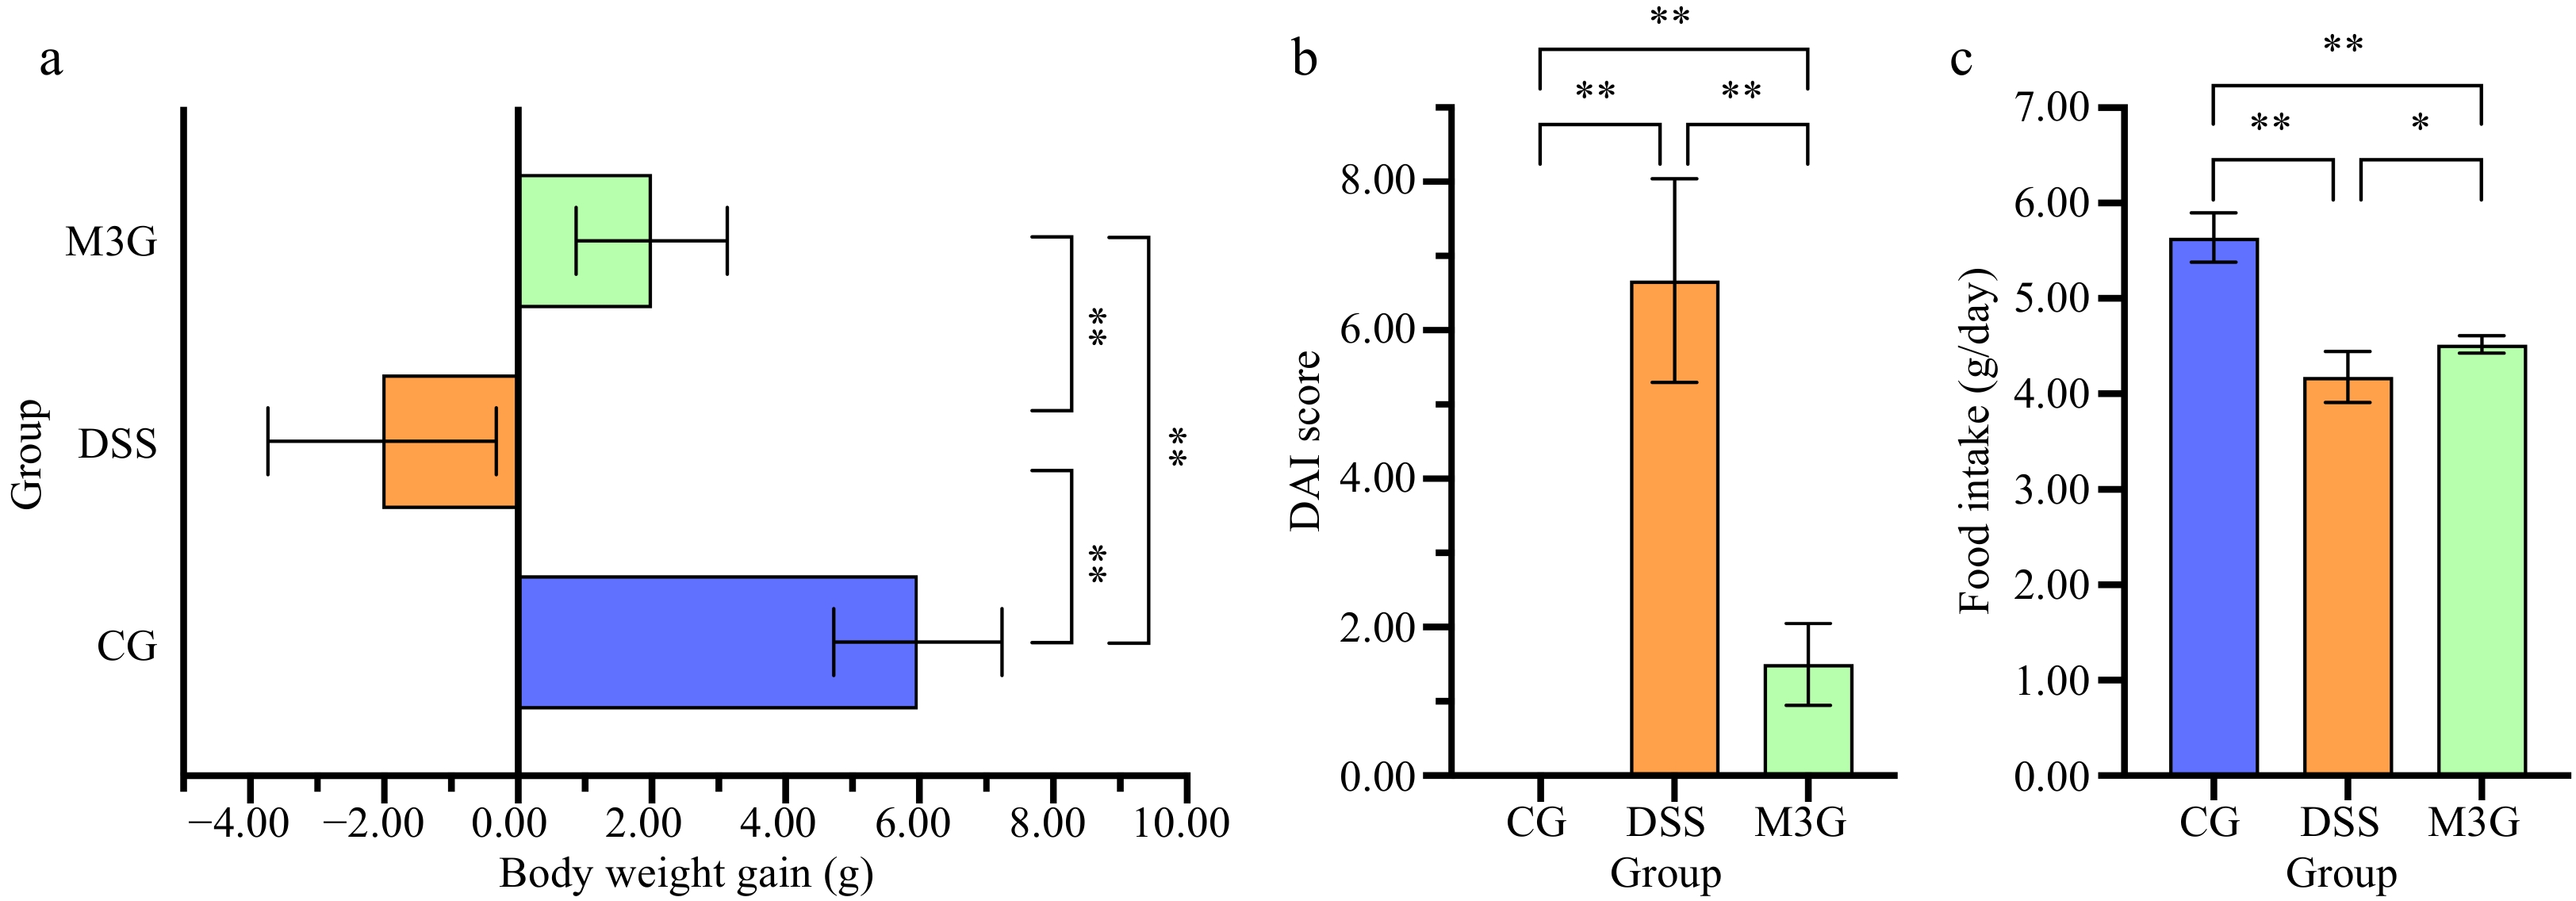
Figure 1.
Effect of M3G on body weight gain, DAI score, and food intake in mice. (a) Body weight gain. (b) DAI score (Fecal consistency: 0 = normal, 1 = semi-formed, 2 = soft stool, 3 = diarrhea or watery stool; bloody stool: 0 = occult blood negative, 1 = occult blood positive, 2 = visible bloody stool, 3 = massive hemorrhage; weight loss: 0 = 0%, 1 = 1%−5 %, 2 = 6%−10% ; 3 = 11%−15% reduction). (c) Food intake. Results are expressed as the mean ± SD (n = 6). * p < 0.05 and ** p < 0.01 indicate significant differences between two groups.
-
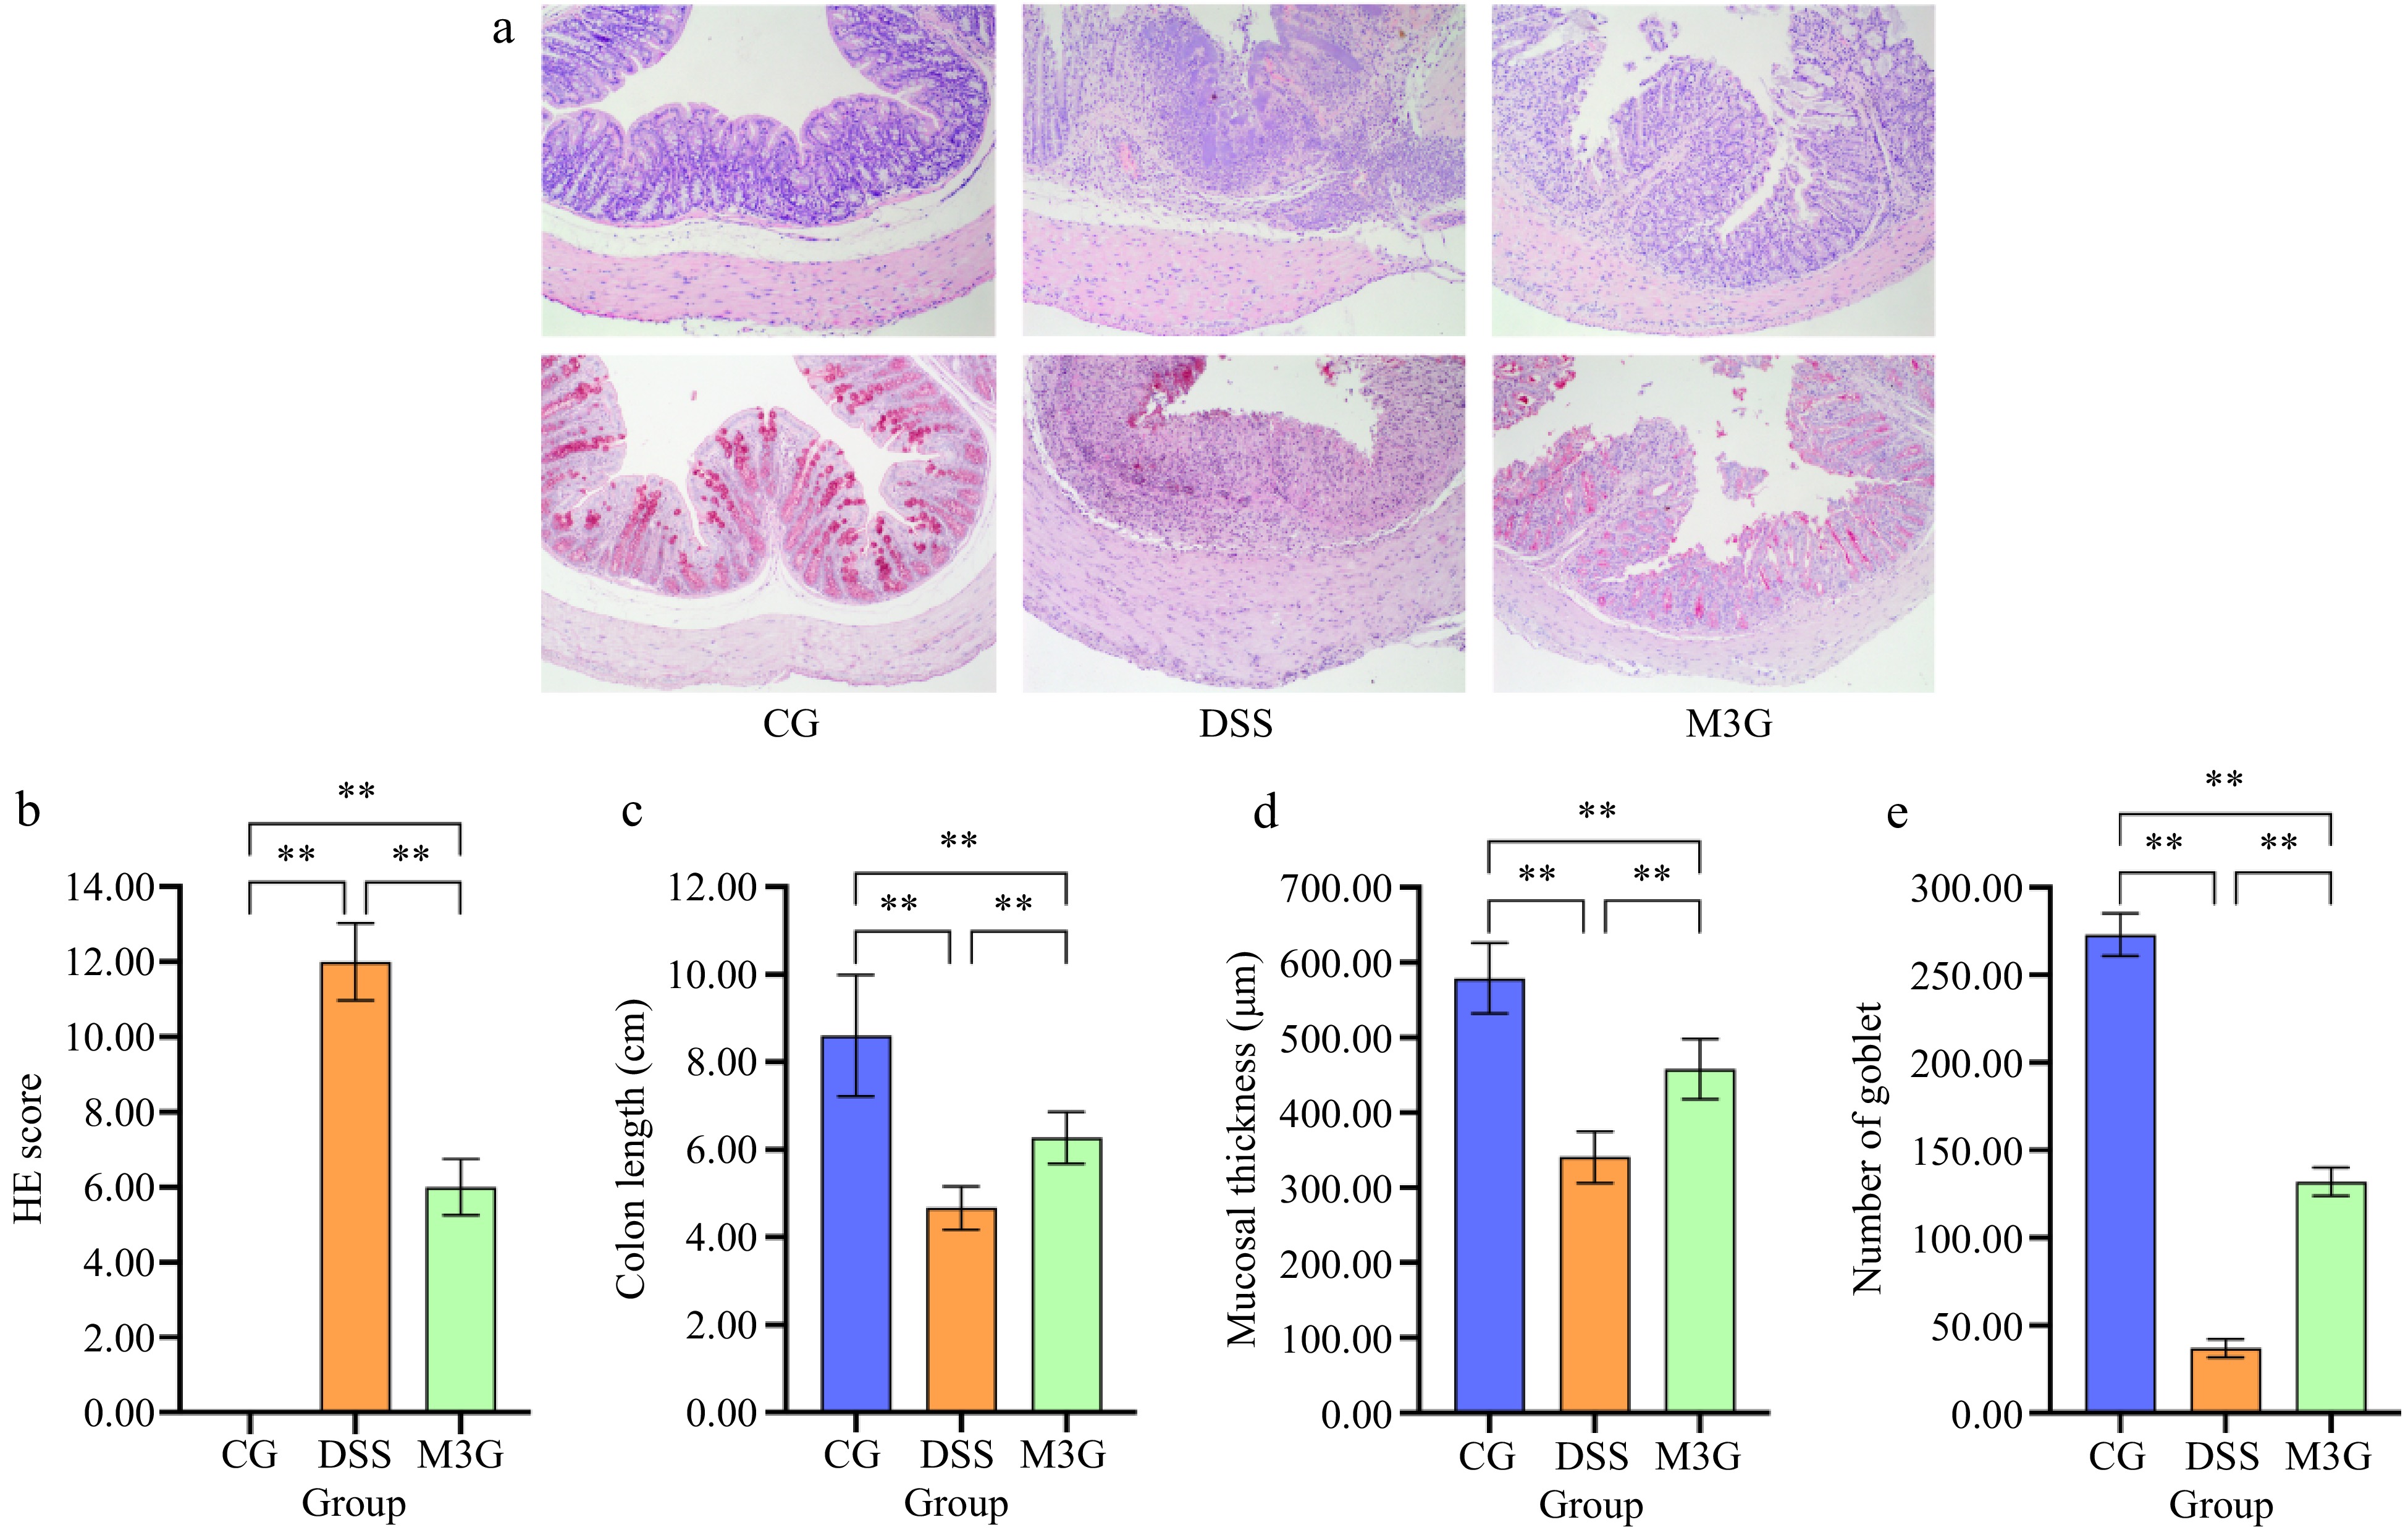
Figure 2.
Effect of M3G on the pathological morphology of colon tissue. (a) HE staining of colon tissue. Original magnifications: 100×. (b) PAS staining of colon tissue. Original magnifications: 100×. (c) The damage score of colon tissue. (1) Epithelial cell damage: 0 = normal morphology; 1 = regional destruction of the epithelial surface; 2 = diffuse epithelial destruction and/or mucosal ulcers involving submucosa; 3 = severe epithelial damage. (2) Inflammatory cell infiltration: 0 = no infiltration or less than 5 cells; 1 = mild infiltration of the inherent layer; 2 = moderate infiltration of the muscular mucosa; 3 = high infiltration of the muscular mucosa; 4 = severe infiltration involving submucosa. (3) Separation of muscle layer and mucosal muscle layer: 0 = normal; 1 = moderate; 2 = severe. (4) Goblet cell depletion: 0 = no depletion; 1 = presence of disordered goblet cells; 2 = 1 to 3 regions without goblet cells; 3 = more than 3 regions without goblet cells; 4 = complete depletion of goblet cells. (d) The colon length. (e) The mucosal thickness of colon tissue. (f) Number of goblet cells in colon tissue. Results are expressed as the mean ± SD (n = 6). * p < 0.05 and ** p < 0.01 indicate significant differences between two groups.
-
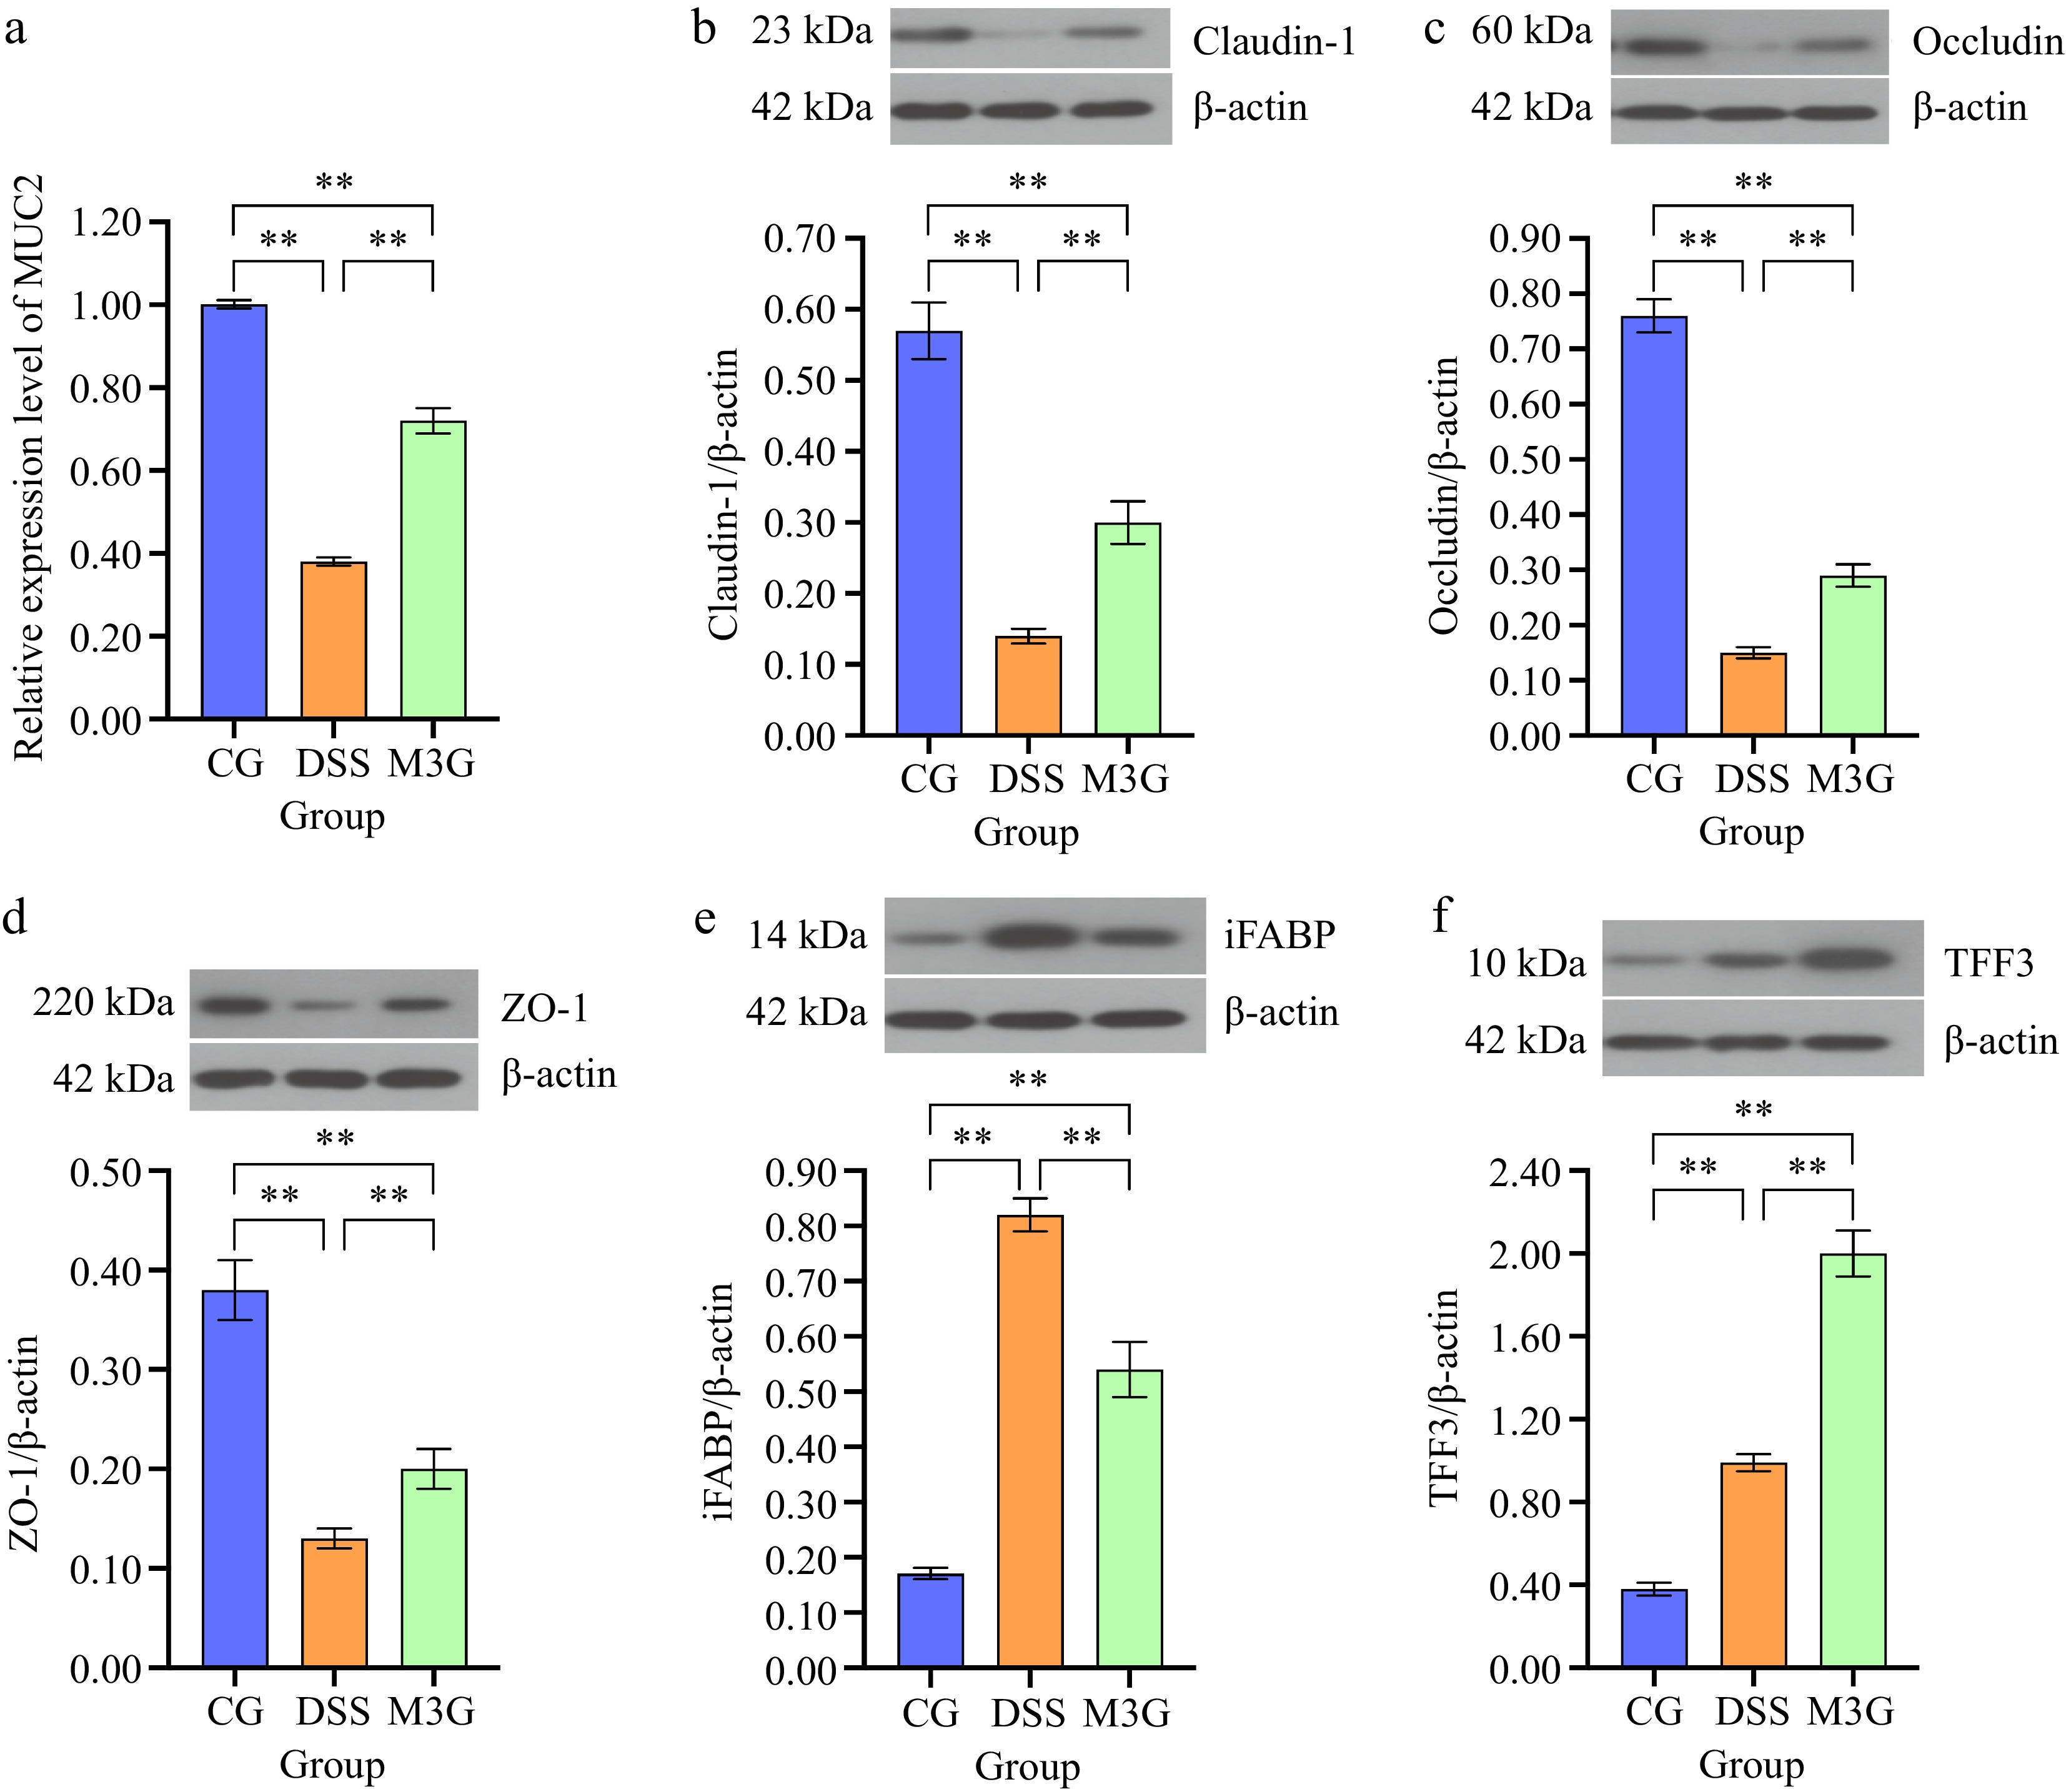
Figure 3.
Effects of M3G on the colonic epithelial barrier disruption. (a) The mRNA expression level of MUC2. (b) The protein expression level of claudin-1. (c) The protein expression level of occludin. (d) The protein expression level of ZO-1. (e) The protein expression level of iFABP. (f) The protein expression level of TFF3. Results are expressed as the mean ± SD (n = 6). * p < 0.05 and ** p < 0.01 indicate significant differences between two groups.
-
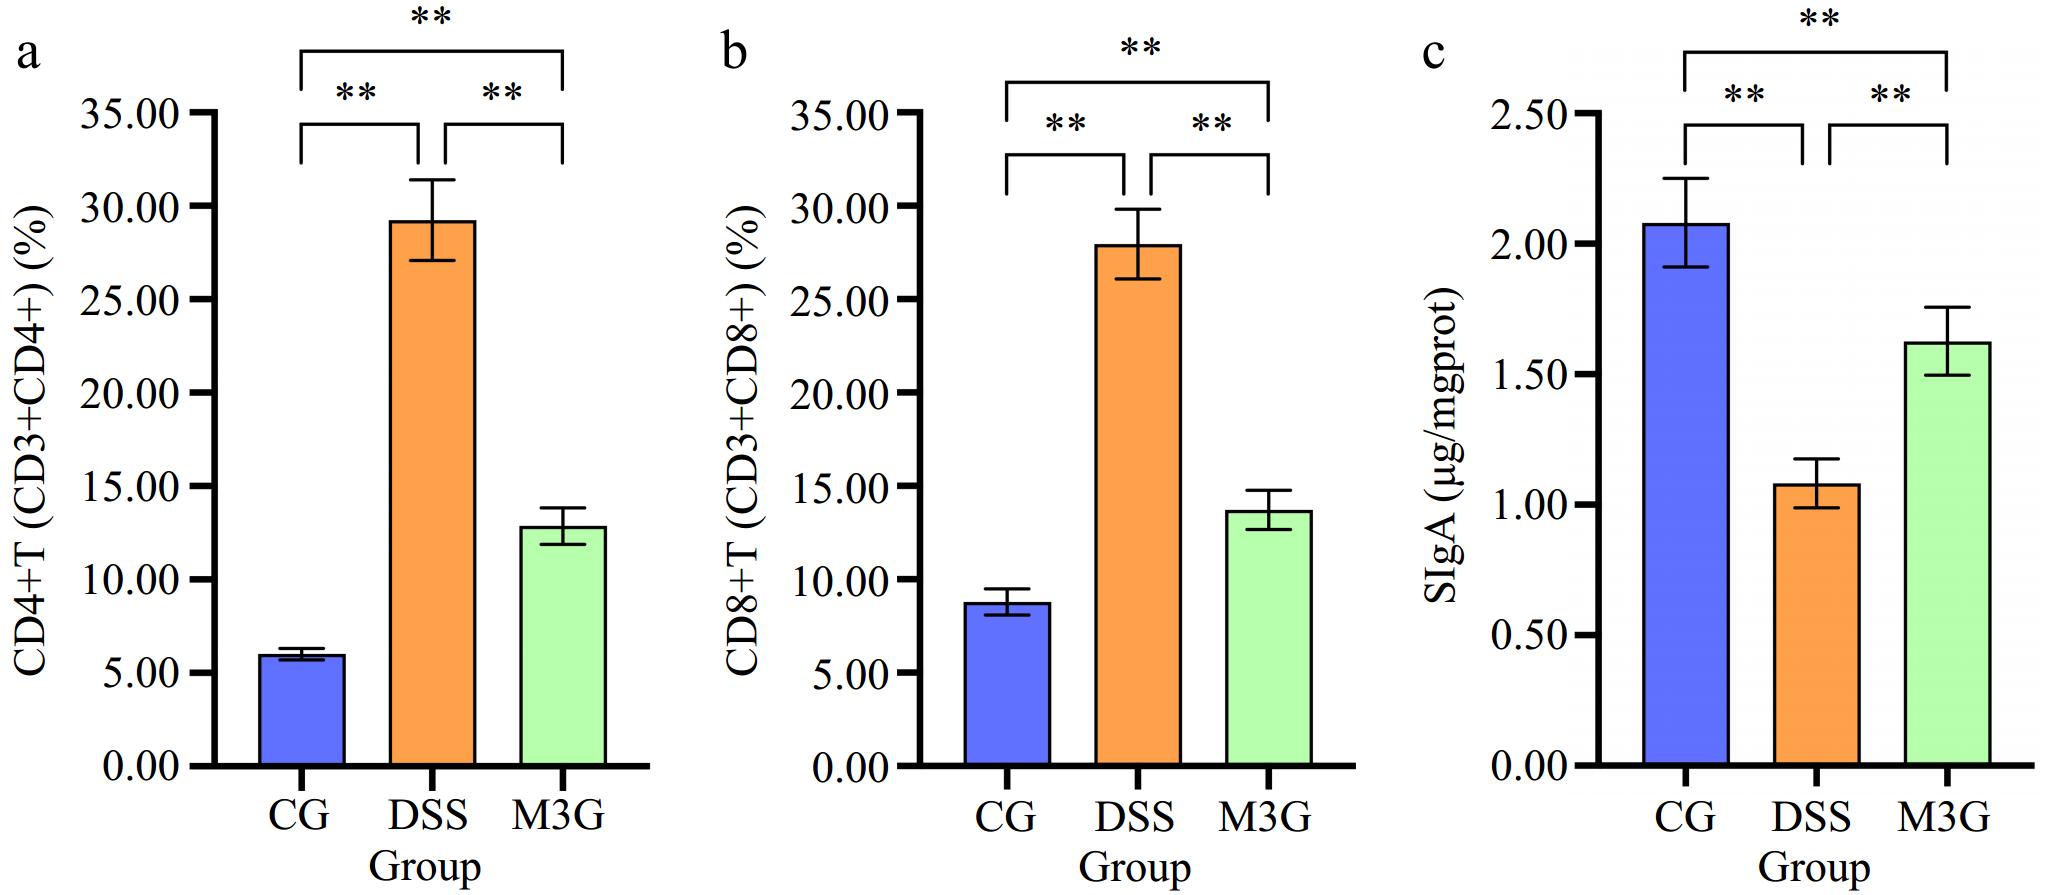
Figure 4.
Effect of M3G on the colonic immune barrier function. (a) The percentage of CD4+T (CD3+CD4+) cells in the colon tissue. (b) The percentage of CD8+T (CD3+CD8+) cells in the colon tissue. (c) The level of SIgA in the colonic mucosal tissue. Results are expressed as the mean ± SD (n = 6). * p < 0.05 and ** p < 0.01 indicate significant differences between two groups.
-
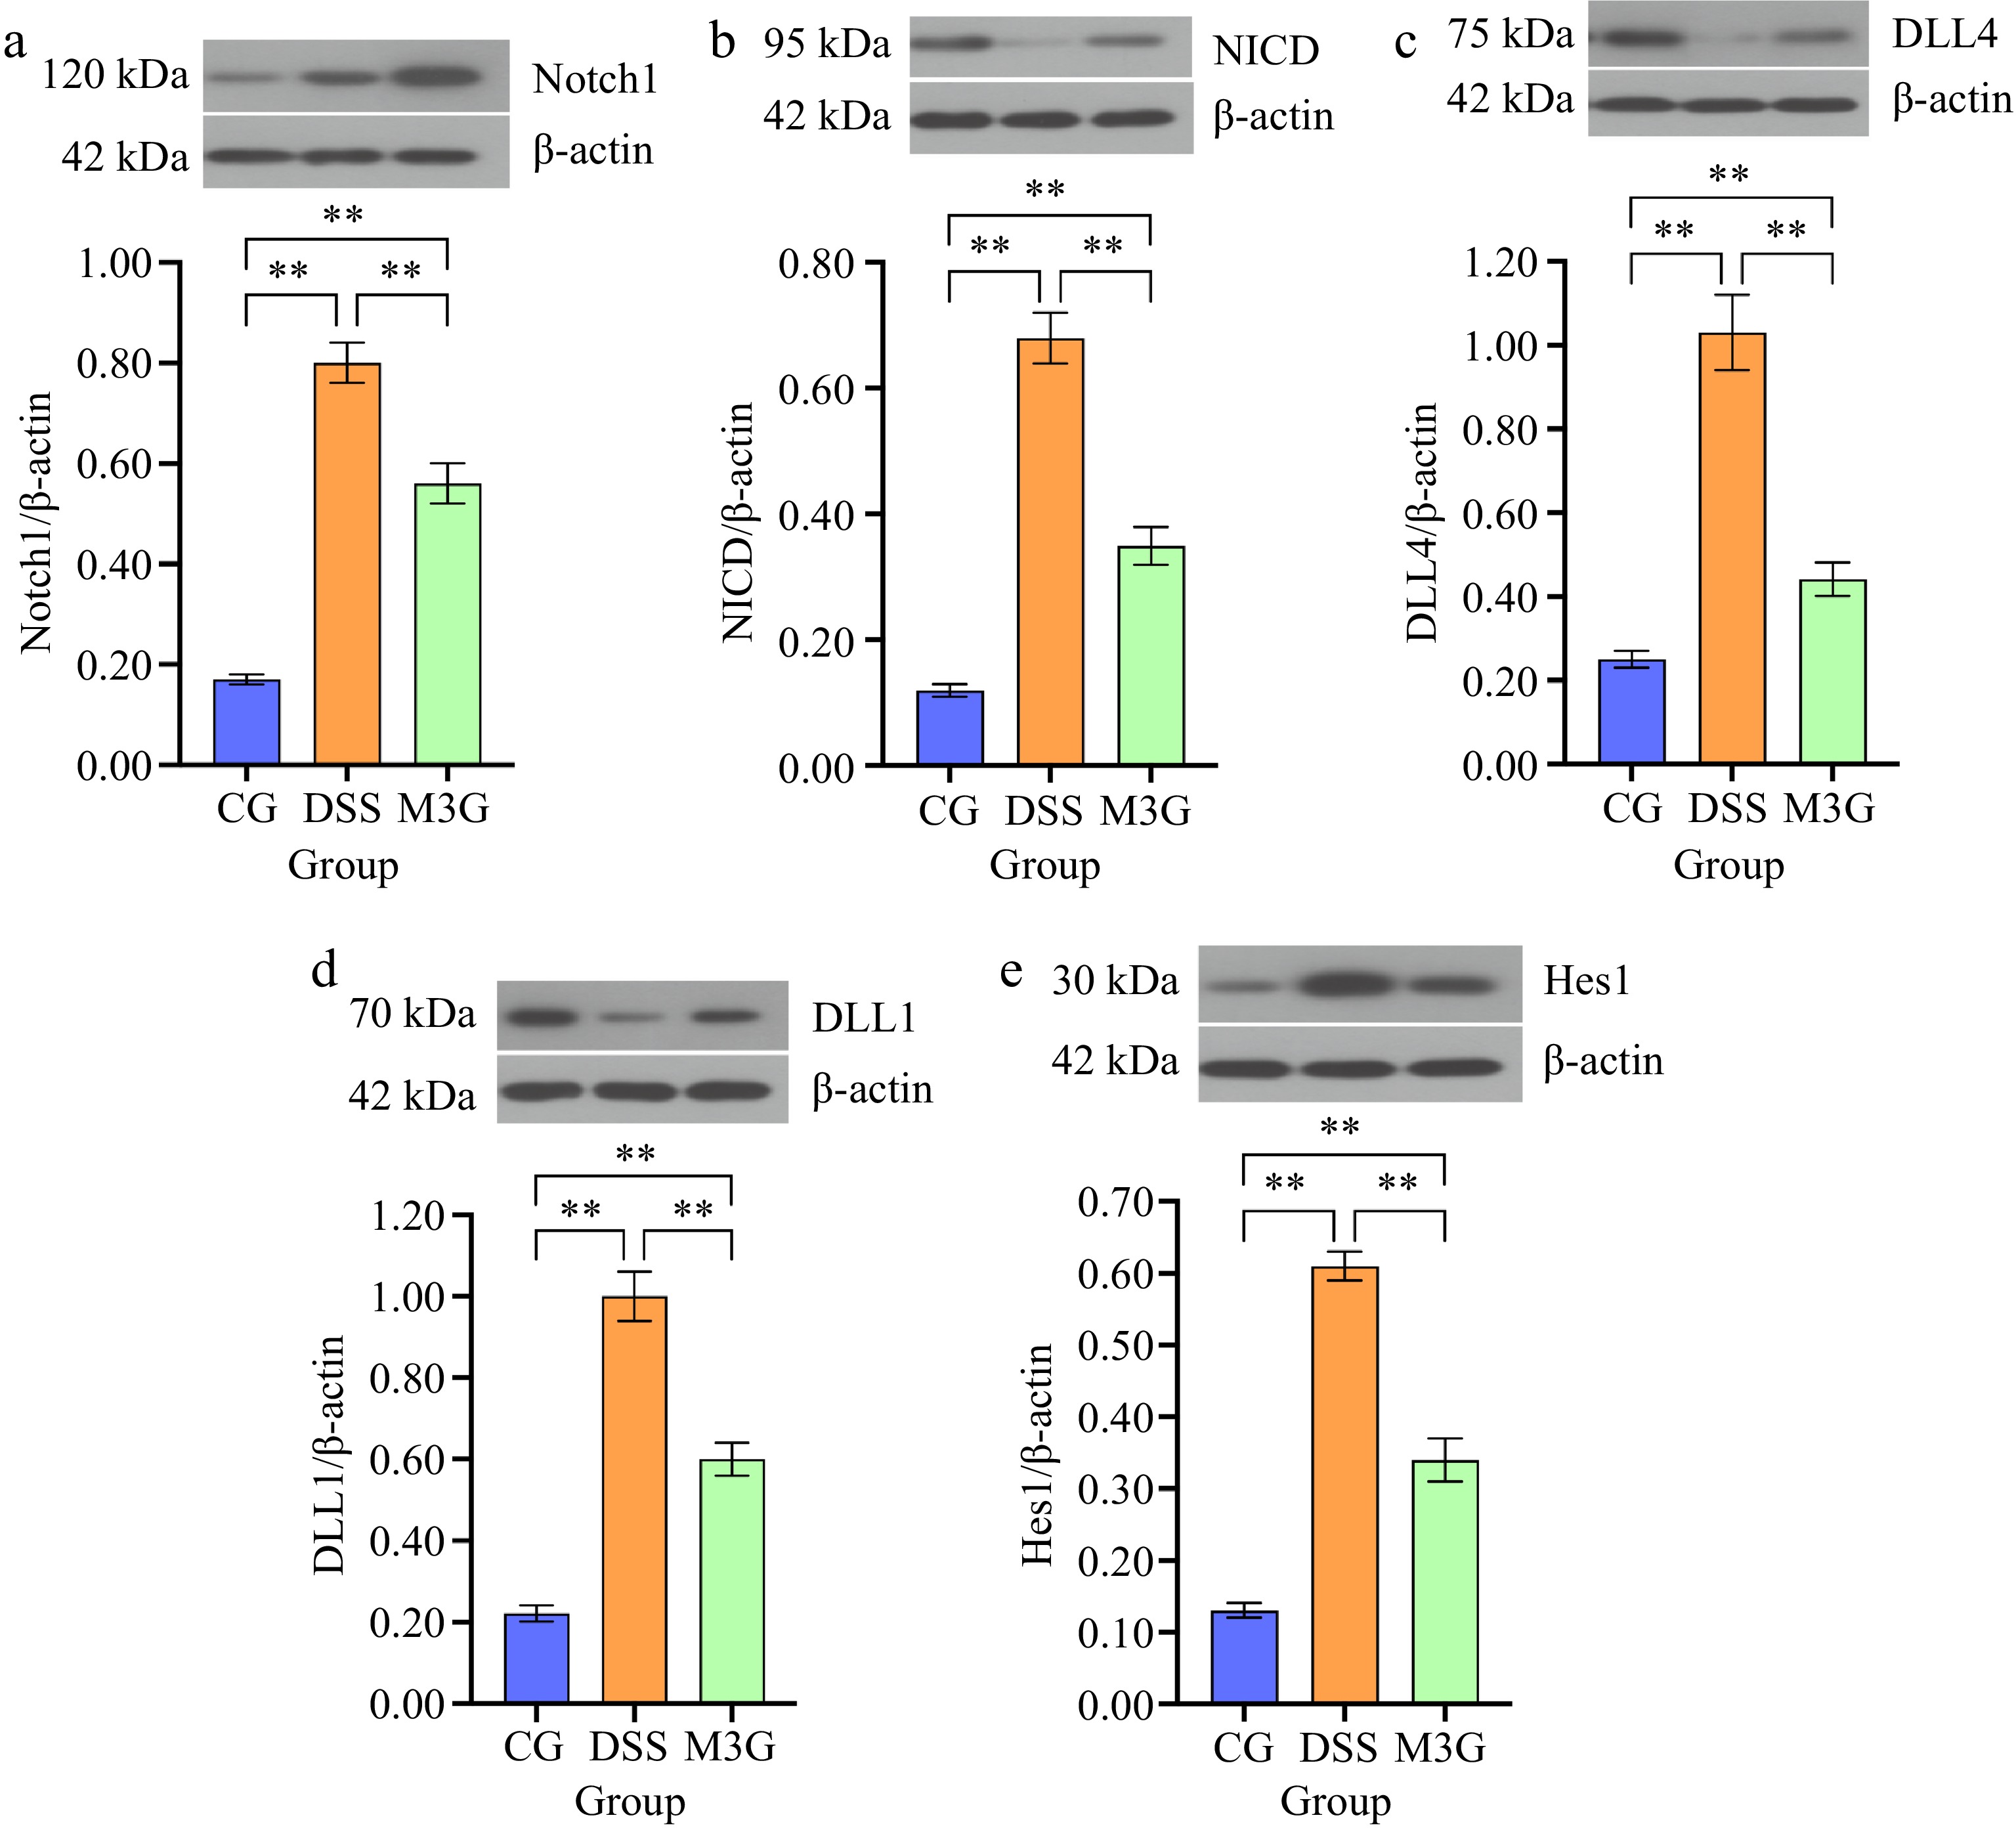
Figure 5.
Effects of M3G on the protein expression levels of Notch1, NICD, DLL4, DLL1, and Hes1 in the colon tissue. (a) The protein expression level of Notch1. (b) The protein expression level of NICD. (c) The protein expression level of DLL4. (d) The protein expression level of DLL1. (e) The protein expression level of Hes1. Results are expressed as the mean ± SD (n = 6). * p < 0.05 and ** p < 0.01 indicate significant differences between two groups.
-
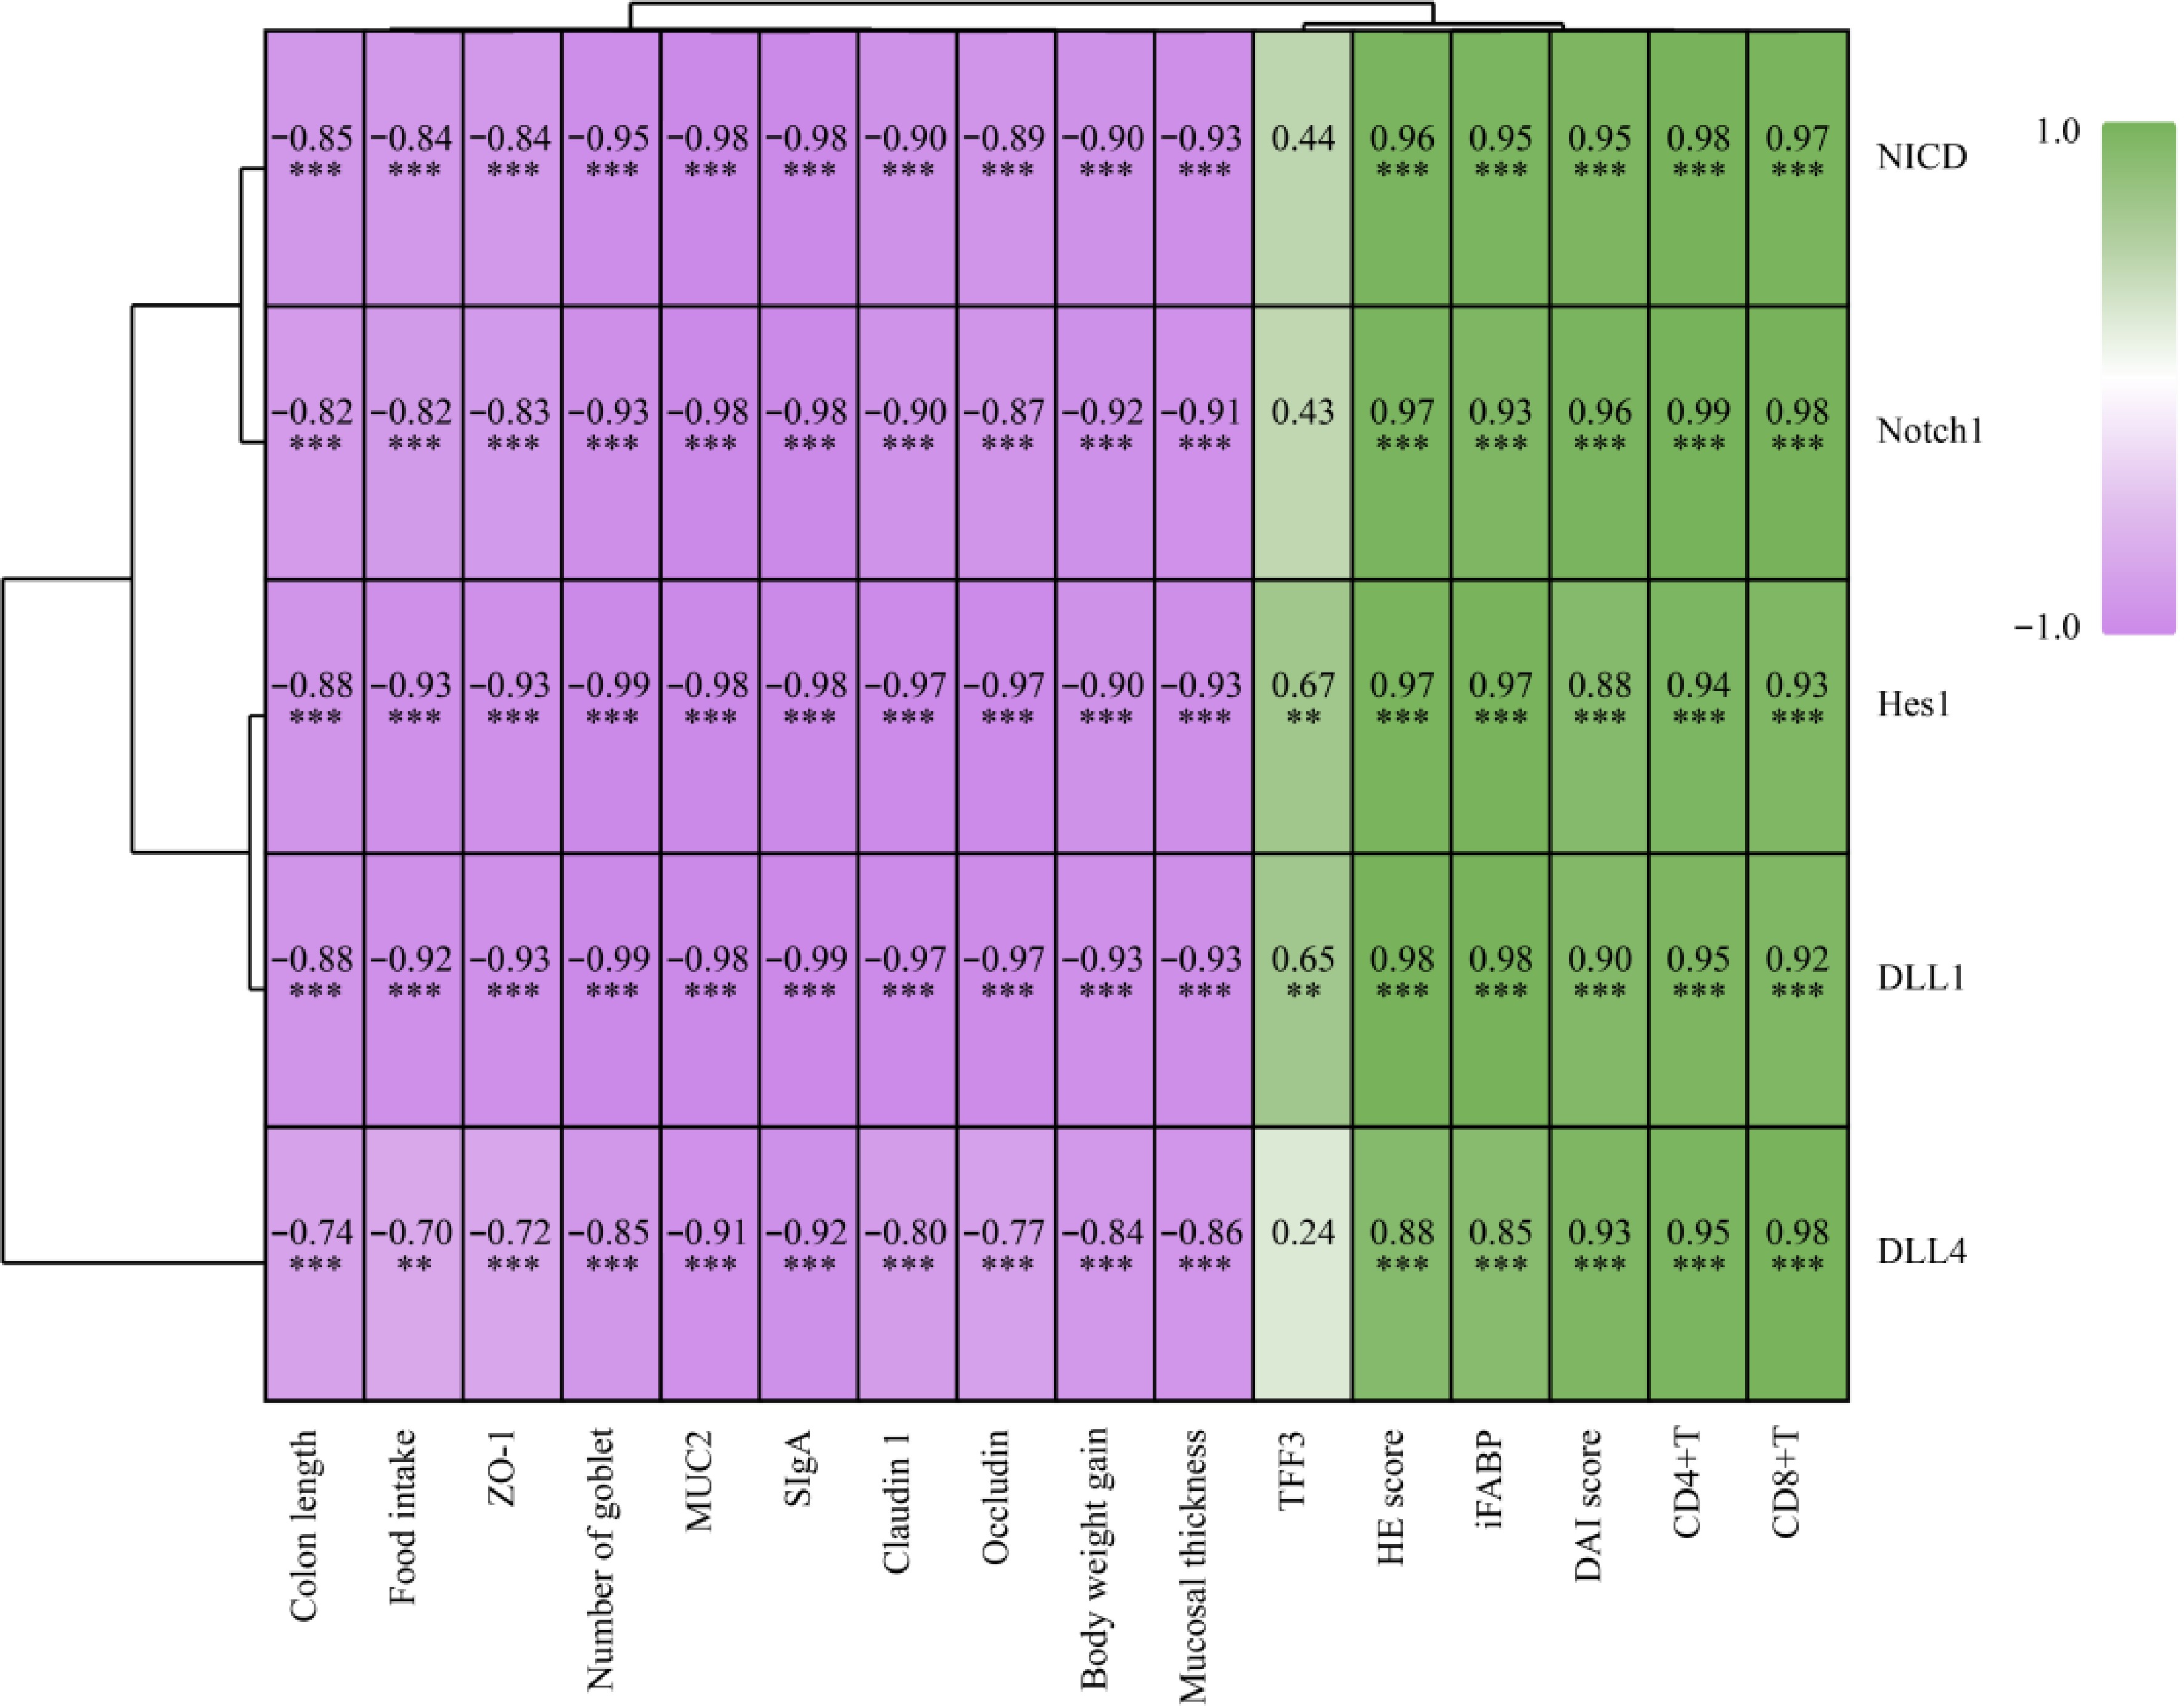
Figure 6.
Heatmap of the Spearman r correlations between biomarkers and the Notch signaling pathway. * p < 0.05 and ** p < 0.01 indicate significant differences between two groups.
-
Gene Prime Sequence (5'-3') Size (bp) MUC2 Forward TGTGCCTGGCTCTAATA 17 Reverse AGGTGGGTTCTTCTTCA 17 β-actin Forward CTGTGCCCATCTACGAGGGCTAT 23 Reverse TTTGATGTCACGCACGATTTCC 22 Table 1.
The primer sequences used in the RT-PCR analysis.
-
Primary antibody Dilution ratio Manufacturer Claudin-1 1:500 Wanlei Bio Co., Ltd. Occludin 1:500 Wanlei Bio Co., Ltd. ZO-1 1:500 Wanlei Bio Co., Ltd. iFABP 1:1000 ABclonal Technology Co., Ltd. DLL1 1:500 Wanlei Bio Co., Ltd. DLL4 1:1000 ABclonal Technology Co., Ltd. Notch1 1:500 Wanlei Bio Co., Ltd. NICD 1:1000 Affinity Biosciences Co., Ltd. Hes1 1:1000 ABclonal Technology Co., Ltd. TFF3 1:1000 Affinity Biosciences Co., Ltd. β-actin 1:1000 Wanlei Bio Co., Ltd. Table 2.
Details of the primary antibodies used in the experiment.
Figures
(6)
Tables
(2)