-
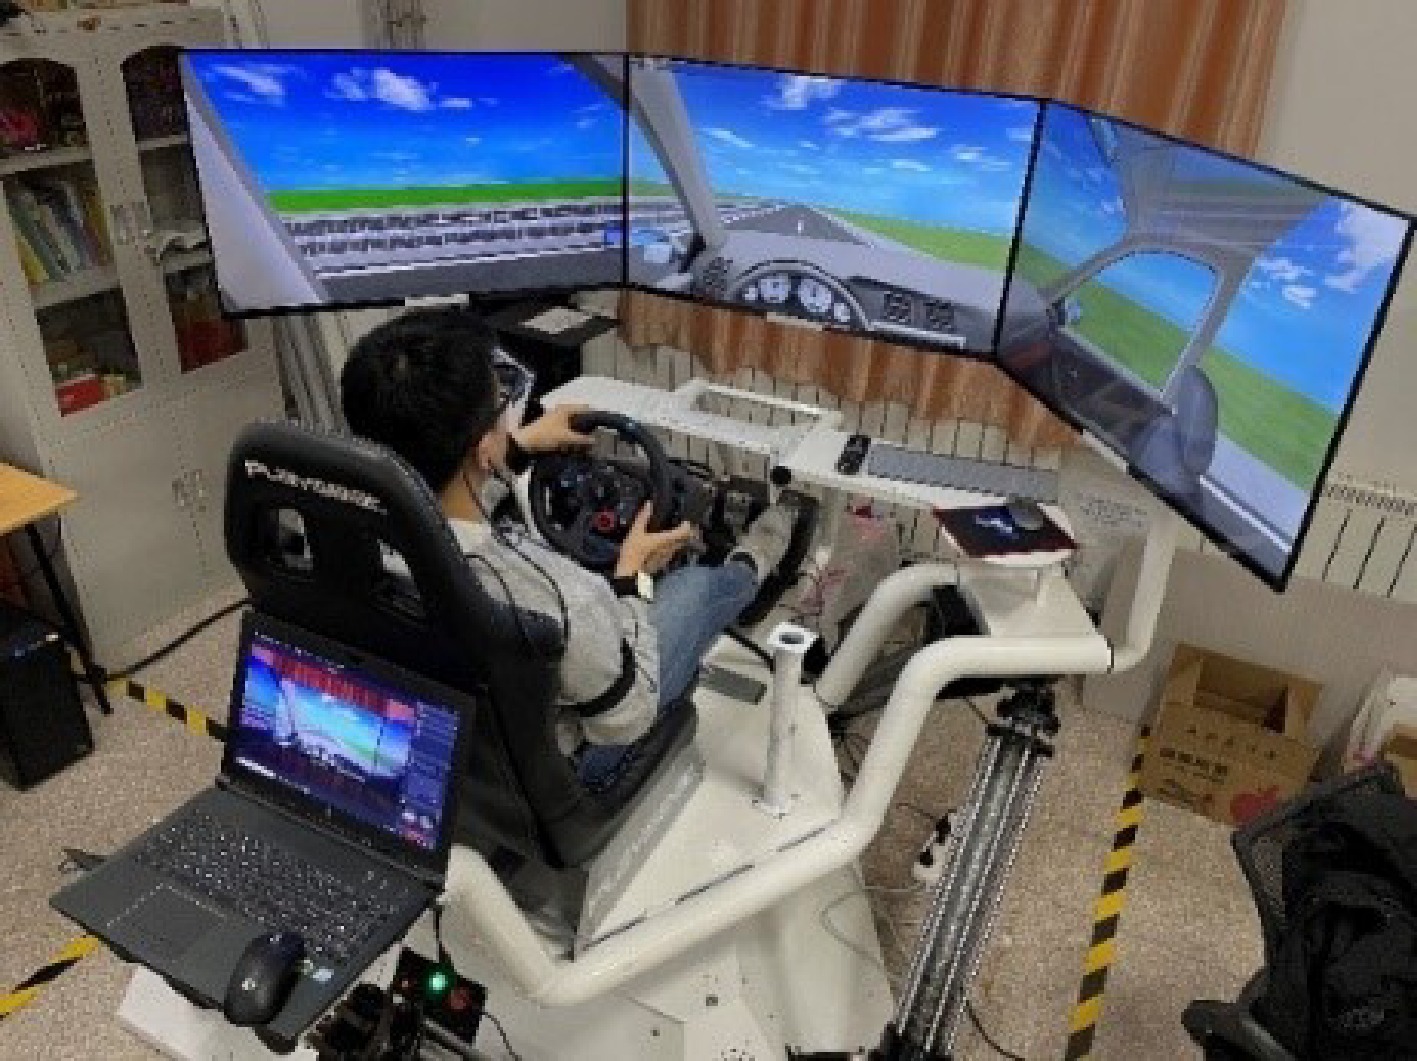
Figure 1.
Virtual driving experimental environment.
-
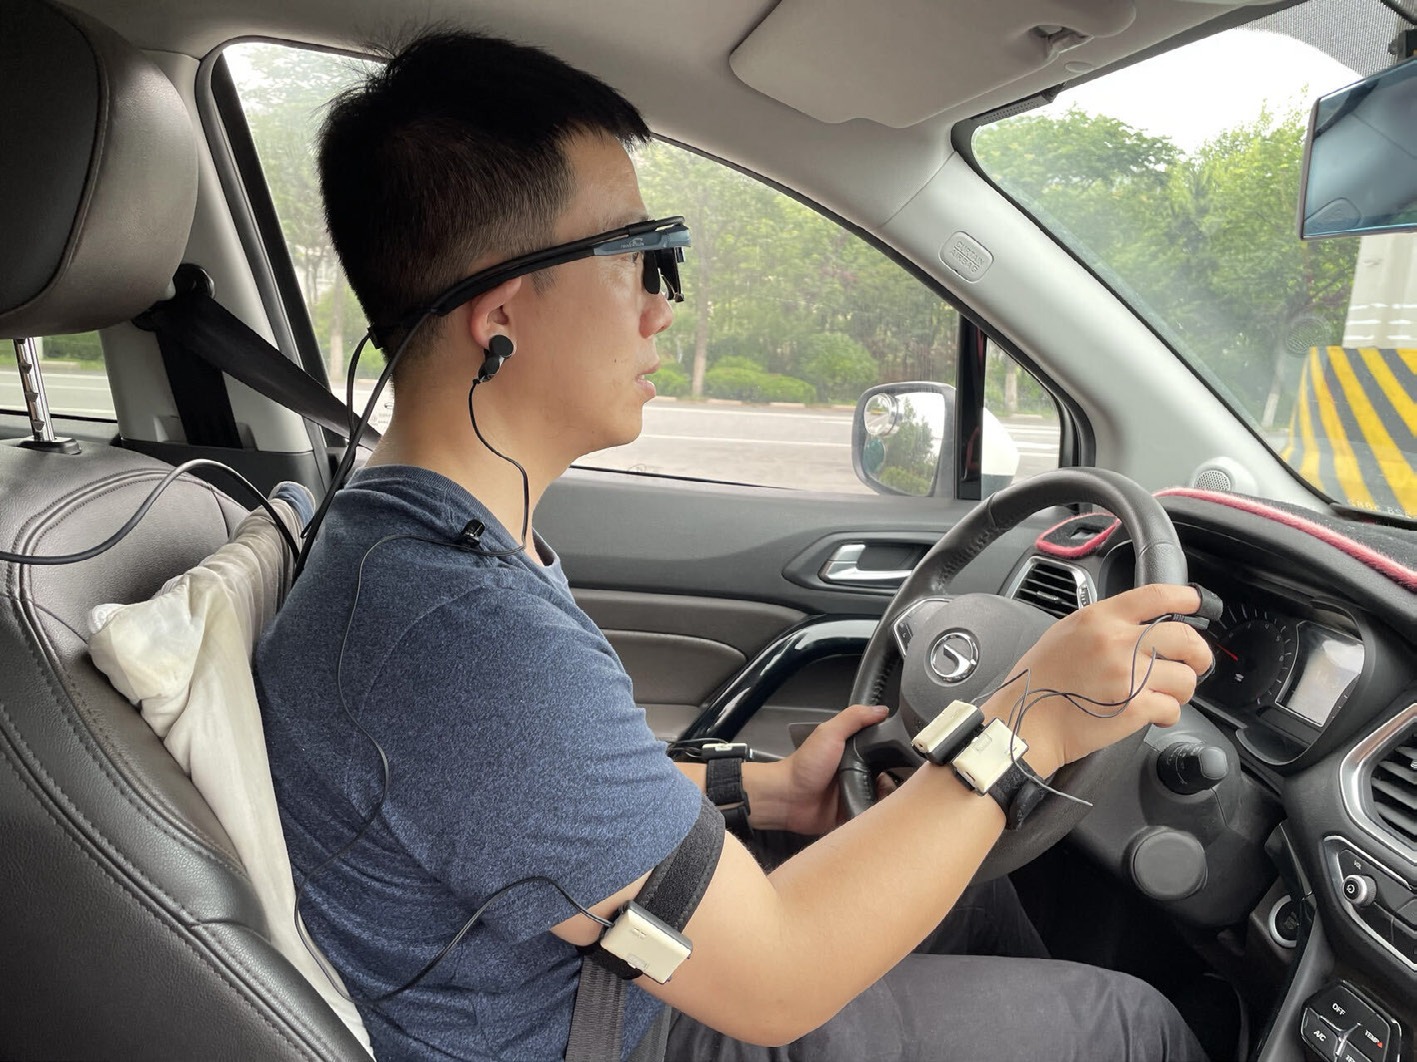
Figure 2.
Vehicle driving experimental environment.
-
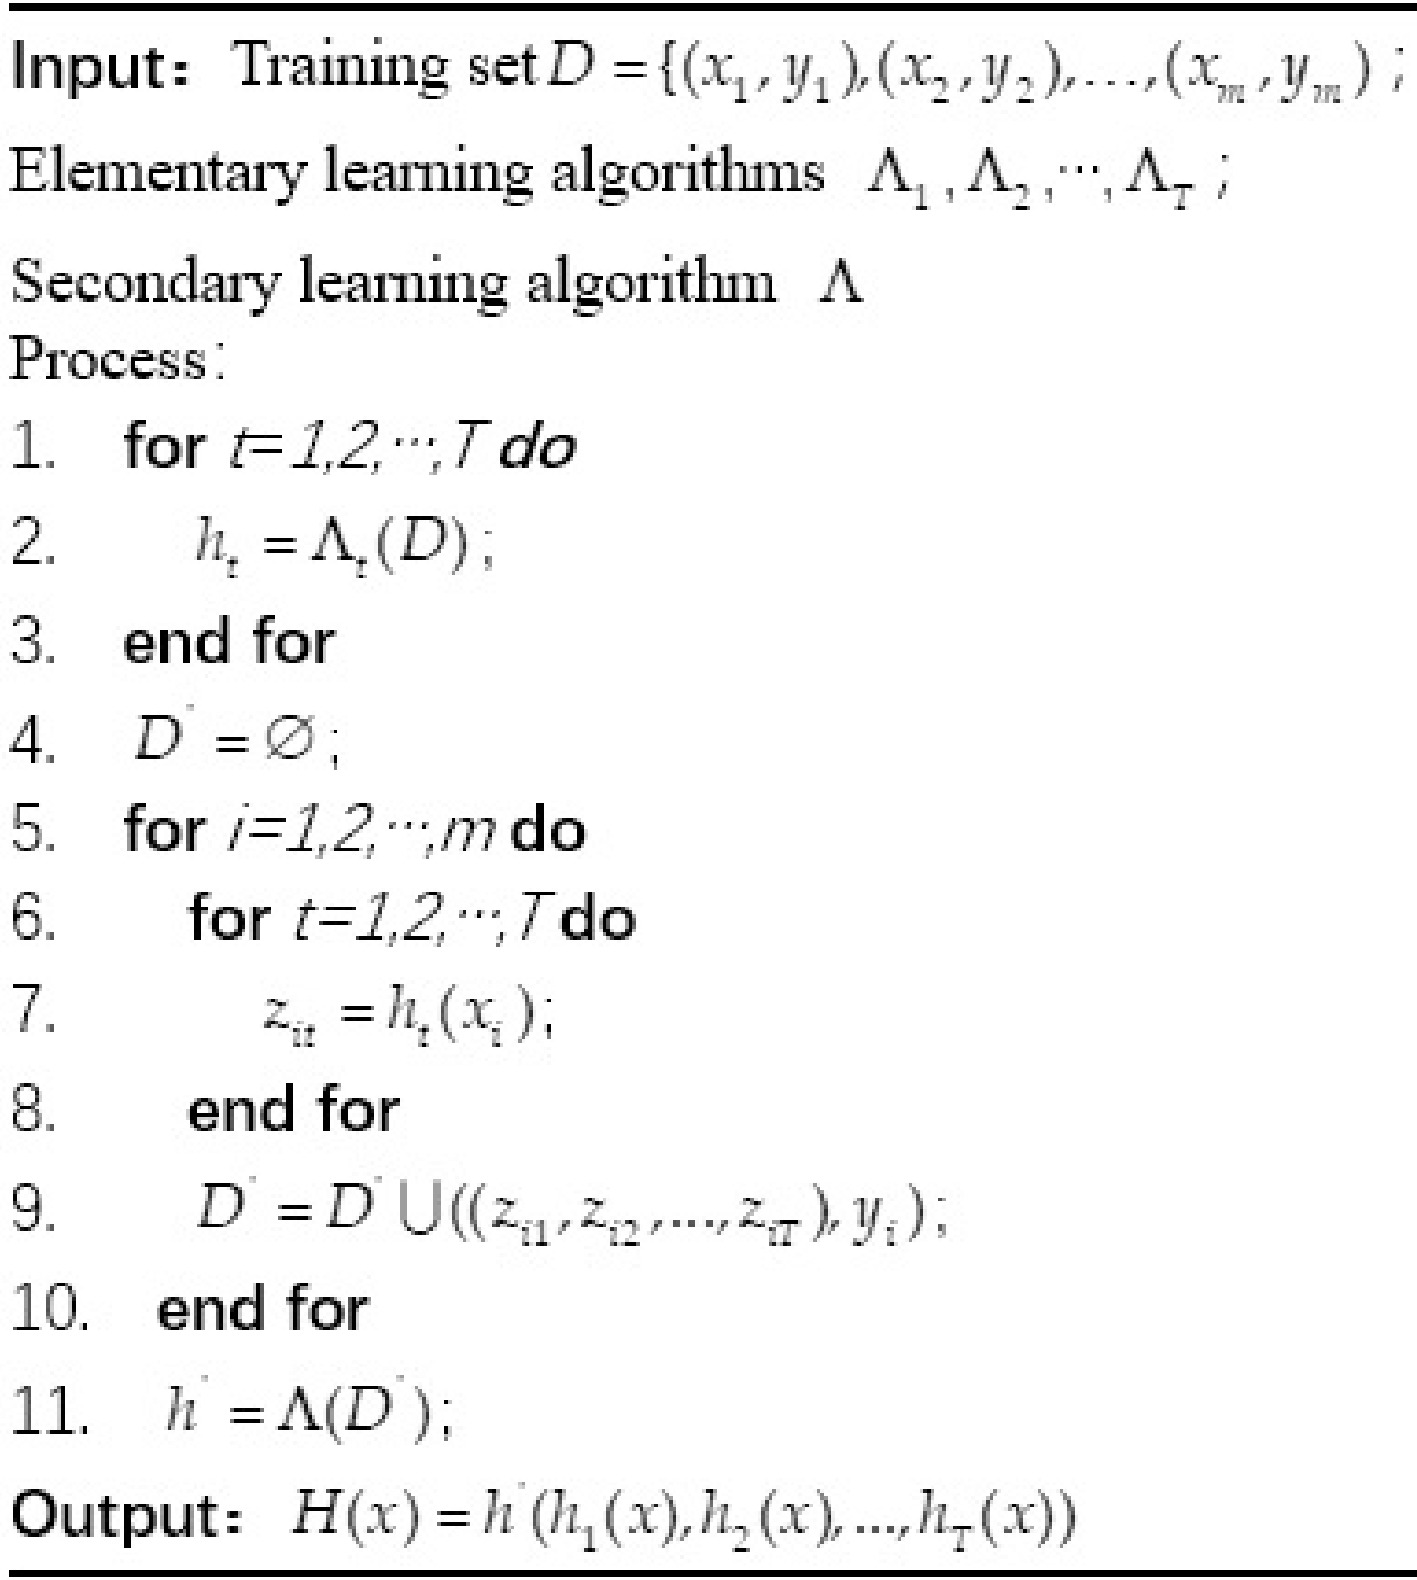
Figure 3.
Principle of ensemble learning algorithm.
-
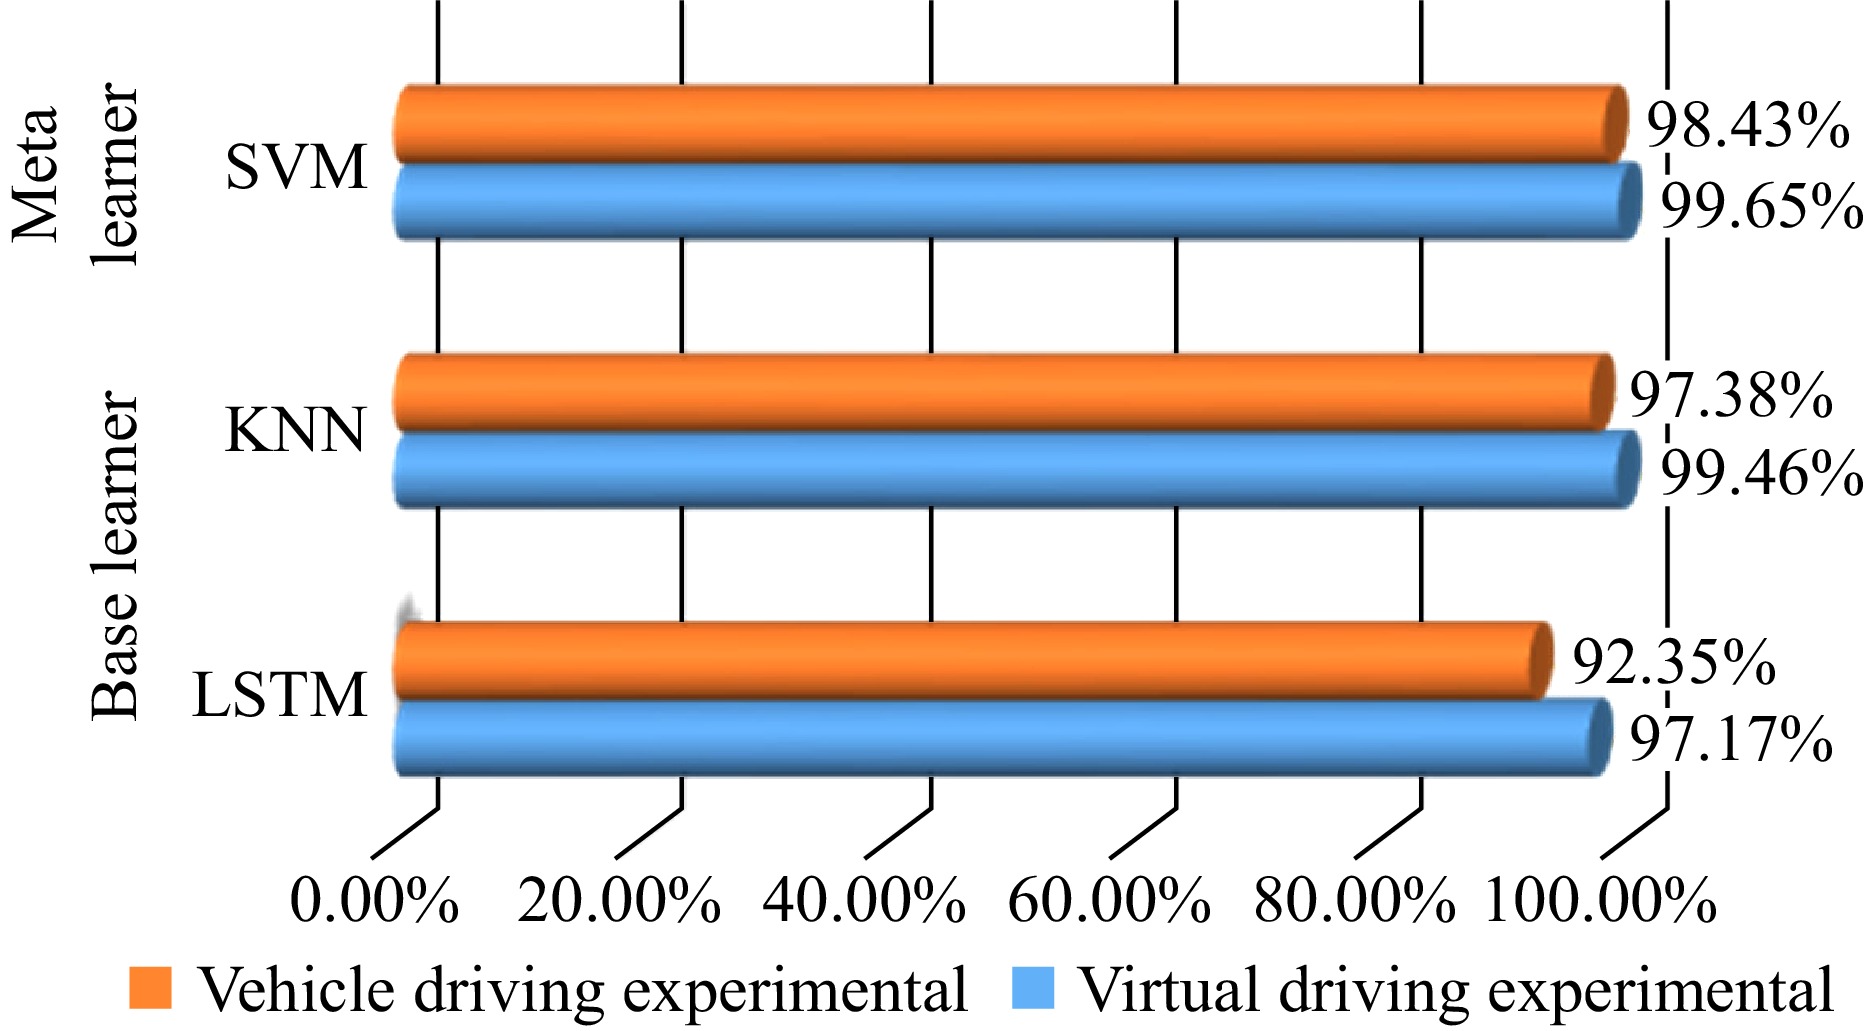
Figure 4.
Classification results of base learners and meta learners.
-
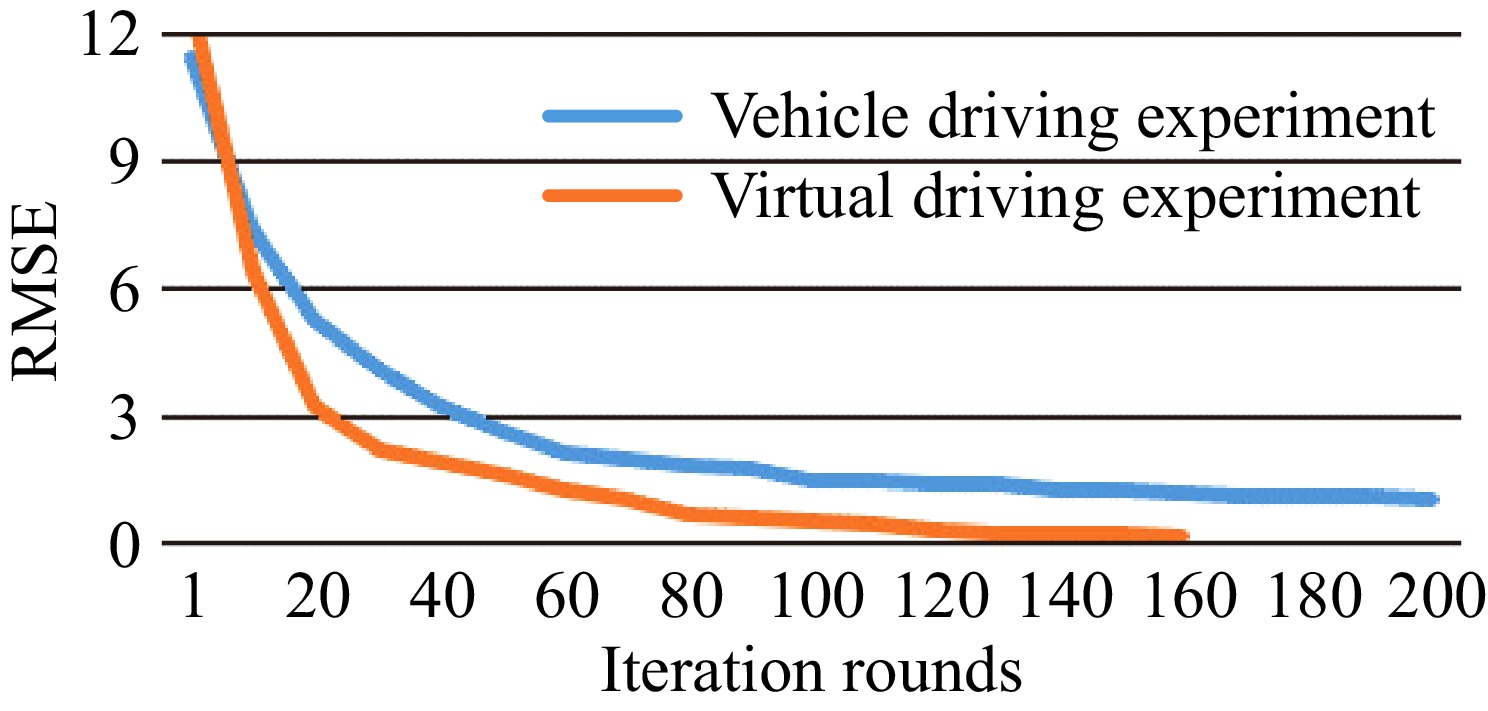
Figure 5.
RMSE results of vehicle and virtual driving experiment.
-
Range No. of participants Age (year) 25−35 26 36−45 18 46−55 6 Driving experience (year) 1−5 11 5−10 18 10−22 21 Table 1.
Basic information of experimental participants.
-
Type Name Explanation Pupil information Pupil Diameter Left (mm) Left eye pupil diameter Pupil Diameter Right (mm) Right eye pupil diameter IPD (mm) Interpupillary distance Gaze Point X (px) Original fixation x-coordinate in pixels Gaze Point Y (px) Original fixation y-coordinate in pixels Gaze Point Right X (px) X-coordinate of the original gaze point of the right eye Gaze Point Right Y (px) Y-coordinate of the original gaze point of the right eye Gaze Point Left X (px) X-coordinate of the original gaze point of the left eye Gaze Point Left Y (px) Y-coordinate of the original gaze point of the left eye Fixation Point X (px) The x-coordinate of the gaze point in pixels Fixation Point Y (px) The y-coordinate of the gaze point in pixels Fixation Duration (ms) Gaze duration Saccade information Saccade Single Velocity (px/ms) Average saccade velocity per frame Saccade Velocity Peak (px/ms) Velocity peaks during saccades Blink information Blink Index Blink Index Blink Duration (ms) Duration of blink Blink Eye Blink label: 0 for double wink; 1 for left wink; 2 for right wink Table 2.
Eye tracker acquisition parameters and their meanings.
-
Name N Minimum value Maximum value Average value Standard deviation Variance Saccade Velocity Average (px/ms) 68292 0.500 1.306 0.712 0.168 0.028 Pupil Diameter Left (mm) 68292 3.041 4.275 3.751 0.211 0.045 Pupil Diameter Right (mm) 68292 −1.534 4.232 3.677 0.413 0.170 IPD (mm) 68292 66.345 67.618 67.004 0.161 0.026 Gaze Point X (px) 68292 330.646 842.180 632.310 62.291 3880.145 Gaze Point Y (px) 68292 176.772 380.967 295.534 26.781 717.240 Gaze Point Left X (px) 68292 362.979 866.104 636.314 64.265 4129.937 Gaze Point Left Y (px) 68292 180.498 633.565 390.844 80.357 6457.305 Gaze Point Right X (px) 68292 298.318 829.718 627.969 66.181 4379.910 Gaze Point Right Y (px) 68292 −157.189 512.873 204.823 106.666 11377.556 Gaze Origin Left X (mm) 68292 −5.497 −4.155 −4.778 0.175 0.031 Gaze Origin Left Y (mm) 68292 −7.894 −5.095 −5.804 0.361 0.130 Gaze Origin Left Z (mm) 68292 −35.869 −33.335 −34.054 0.283 0.080 Gaze Origin Right X (mm) 68292 4.728 5.333 5.104 0.119 0.014 Gaze Origin Right Y (mm) 68292 −4.630 −2.530 −3.332 0.301 0.091 Gaze Origin Right Z (mm) 68292 −32.927 −31.464 −32.051 0.293 0.086 Fixation Duration (ms) 68292 66.000 90966.000 23206.851 22645.982 512840520.244 Fixation Point X (px) 68292 402.268 851.052 625.487 54.279 2946.158 Fixation Point Y (px) 68292 125.196 343.138 299.244 14.902 222.064 N is the sample size. Table 3.
Descriptive statistical analysis of eye movement data in normal driving state.
-
Name N Minimum value Maximum value Average value Standard deviation Variance Saccade Velocity Average (px/ms) 42775 0.00001 0.500 0.174 0.146 0.021 Pupil Diameter Left (mm) 42775 2.791 4.301 3.629 0.231 0.053 Pupil Diameter Right (mm) 42775 −1.307 4.323 3.636 0.277 0.077 IPD (mm) 42775 66.149 67.536 67.017 0.125 0.016 Gaze Point X (px) 42775 320.779 855.683 603.739 56.414 3182.571 Gaze Point Y (px) 42775 160.197 393.530 302.320 20.799 432.589 Gaze Point Left X (px) 42775 355.348 856.234 616.640 59.496 3539.833 Gaze Point Left Y (px) 42775 165.291 655.587 386.817 71.875 5165.952 Gaze Point Right X (px) 42775 236.304 854.082 590.594 57.633 3321.547 Gaze Point Right Y (px) 42775 −186.220 513.097 218.809 84.647 7165.129 Gaze Origin Left X (mm) 42775 −5.450 −4.140 −4.871 0.170 0.029 Gaze Origin Left Y (mm) 42775 −7.917 −4.972 −5.682 0.347 0.120 Gaze Origin Left Z (mm) 42775 −35.888 −33.288 −34.064 0.265 0.070 Gaze Origin Right X (mm) 42775 4.548 5.374 5.127 0.100 0.010 Gaze Origin Right Y (mm) 42775 −4.590 −2.518 −3.304 0.234 0.055 Gaze Origin Right Z (mm) 42775 −32.966 −31.306 −31.926 0.248 0.062 Fixation Duration (ms) 42775 167.000 90966 40057.15 30047.406 902846577 Fixation Point X (px) 42775 402.268 851.052 608.402 39.981 1598.472 Fixation Point Y (px) 42775 59.117 408.848 302.290 12.971 168.255 N is the sample size. Table 4.
Descriptive statistical analysis of eye movement data in road hypnosis.
-
Name Explanation ECG Signal (mV) ECG signal amplitude in millivolts Heart Rate (bpm) Heart rate in beats per minute R-R Interval (ms) Interval between consecutive R-waves SDNN (ms) Standard deviation of NN intervals Table 5.
Bioelectricity characteristic parameters and their meanings.
-
State Minimum value Maximum value Average
valueStandard
deviationVariance Skewness Kurtosis Value Value Value Standard error Value Value Value Standard error Value Standard error Road hypnosis −1827.865 2595.328 −0.017 1.026 332.738 110714.259 2.961 0.008 19.341 0.015 Normal state −1672.206 2353.899 0.092 2.018 310.955 96692.828 3.071 0.016 20.910 0.032 Table 6.
Descriptive statistical analysis of bioelectricity characteristic parameters.
Figures
(5)
Tables
(6)