-
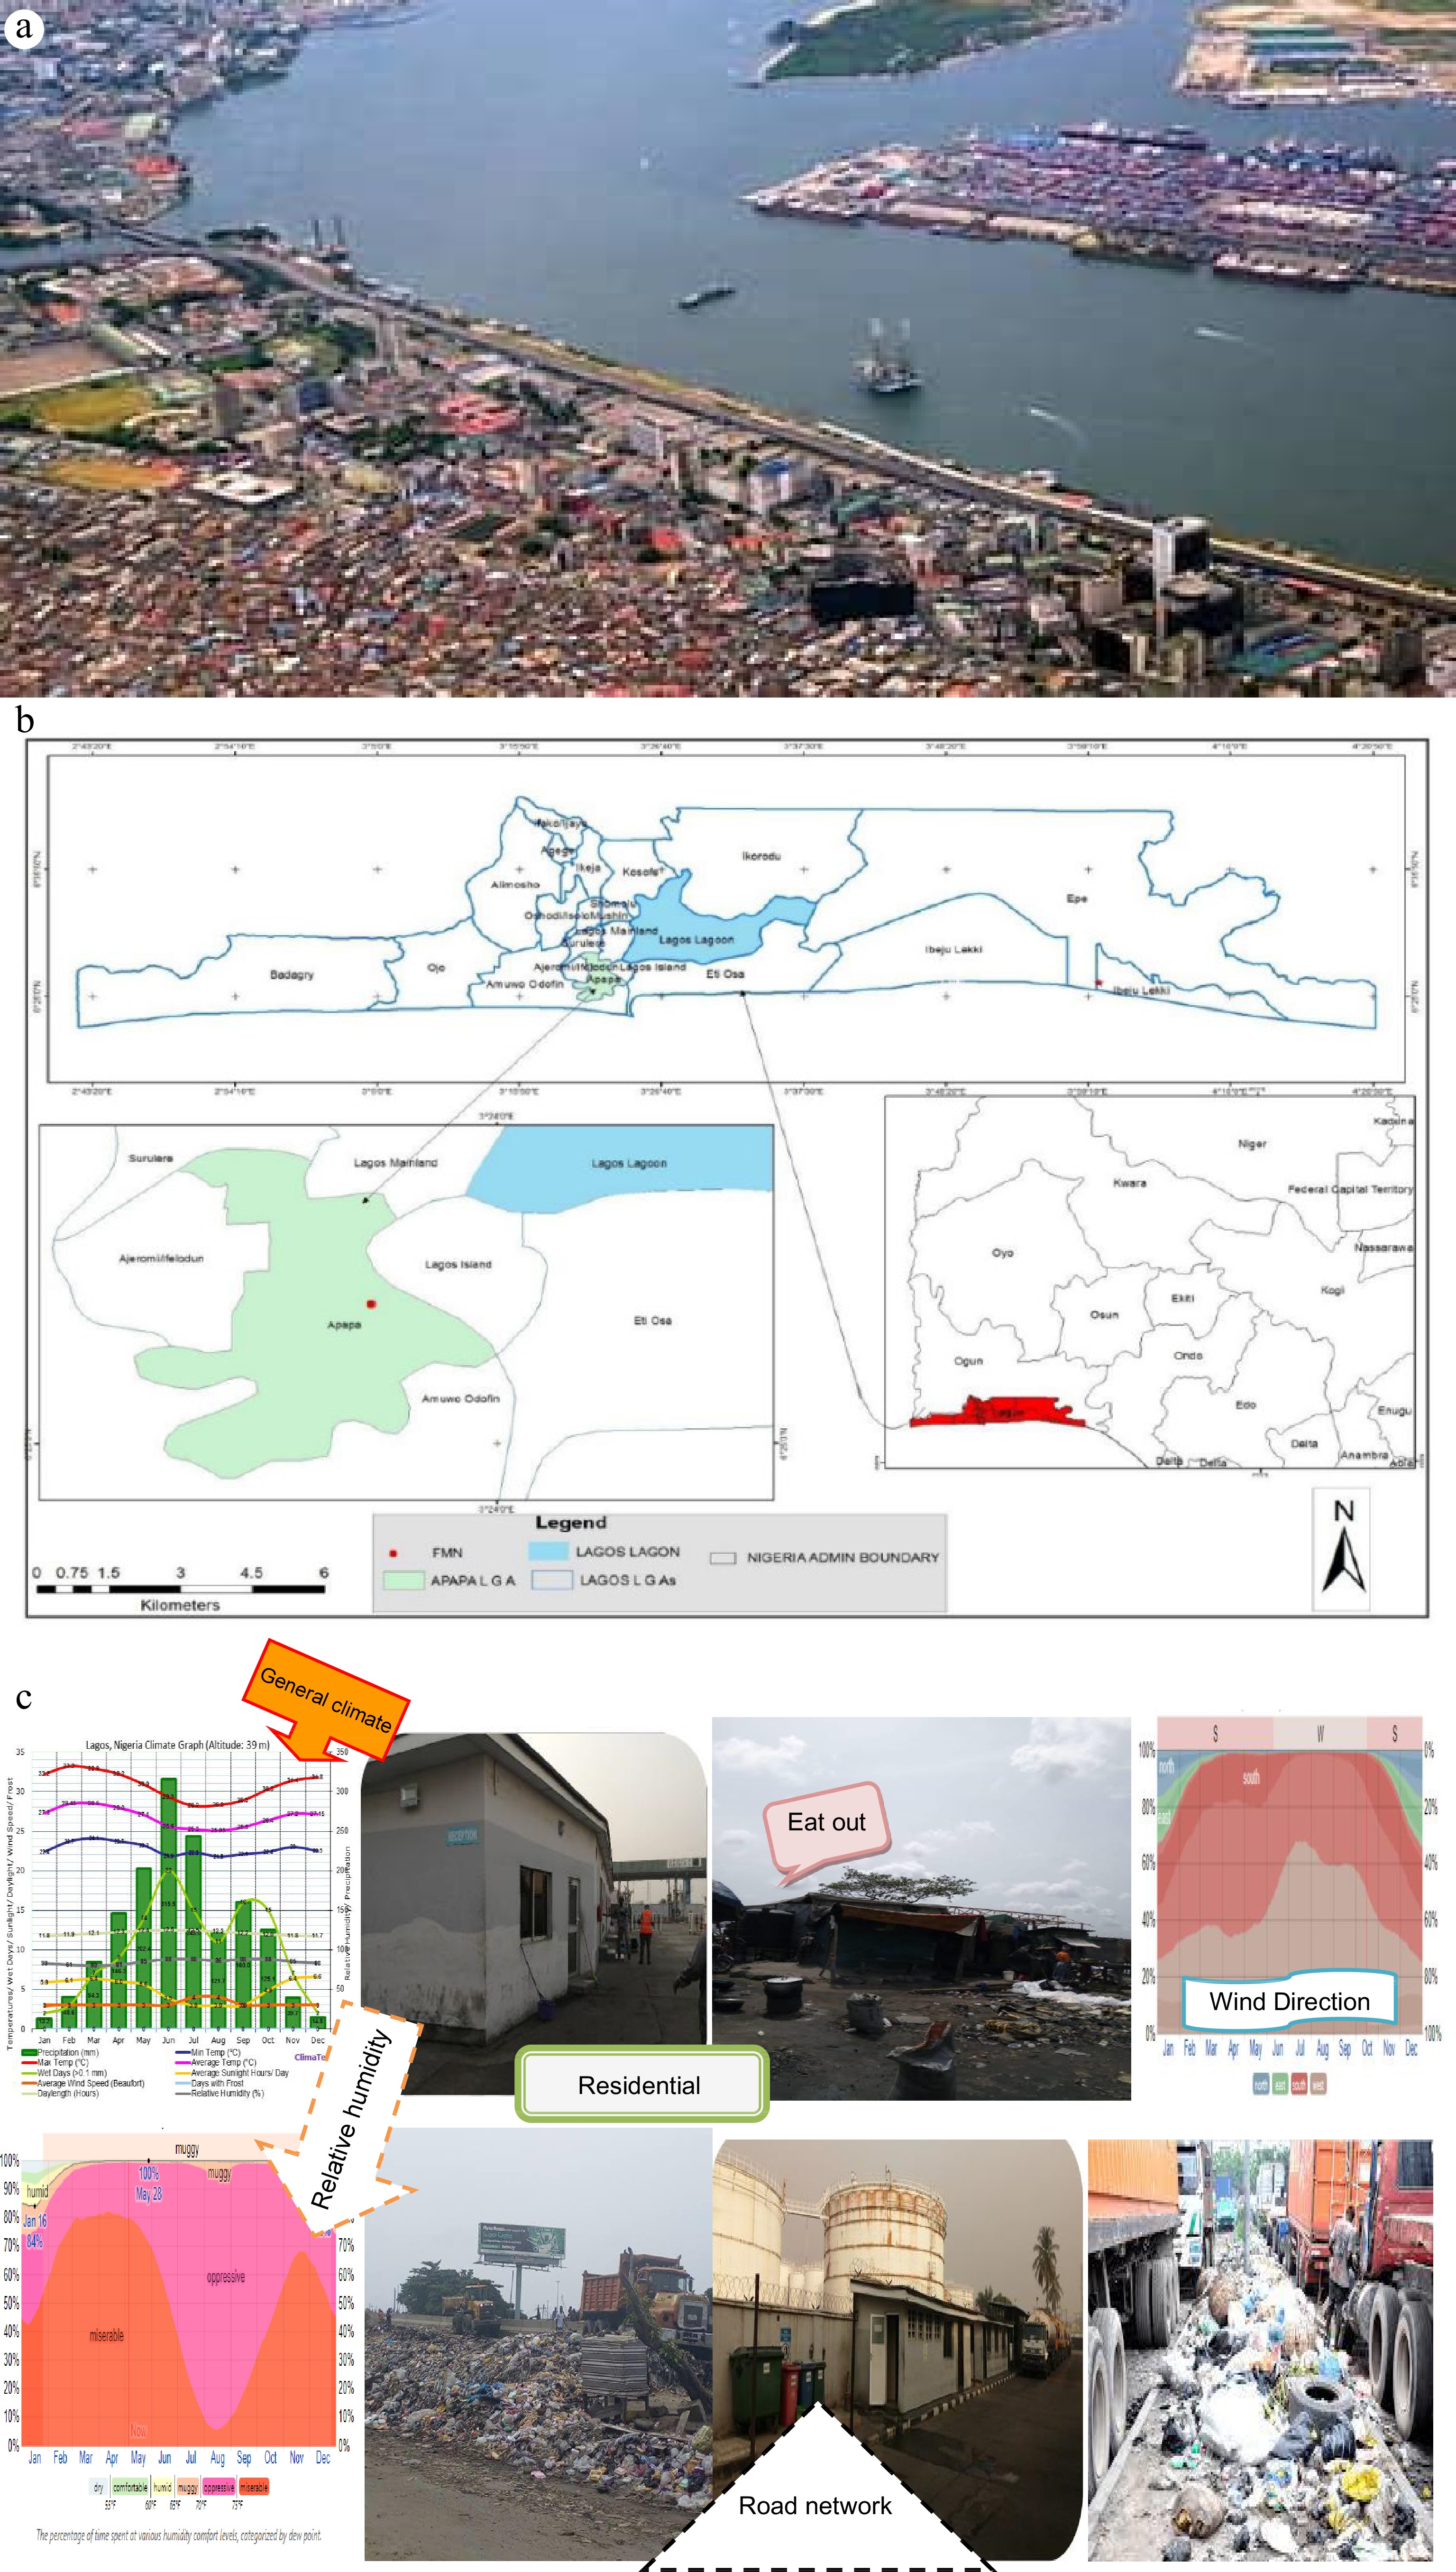
Figure 1.
(a) Apapa port, (b) study region, and (c) climate and activities around its environ.
-
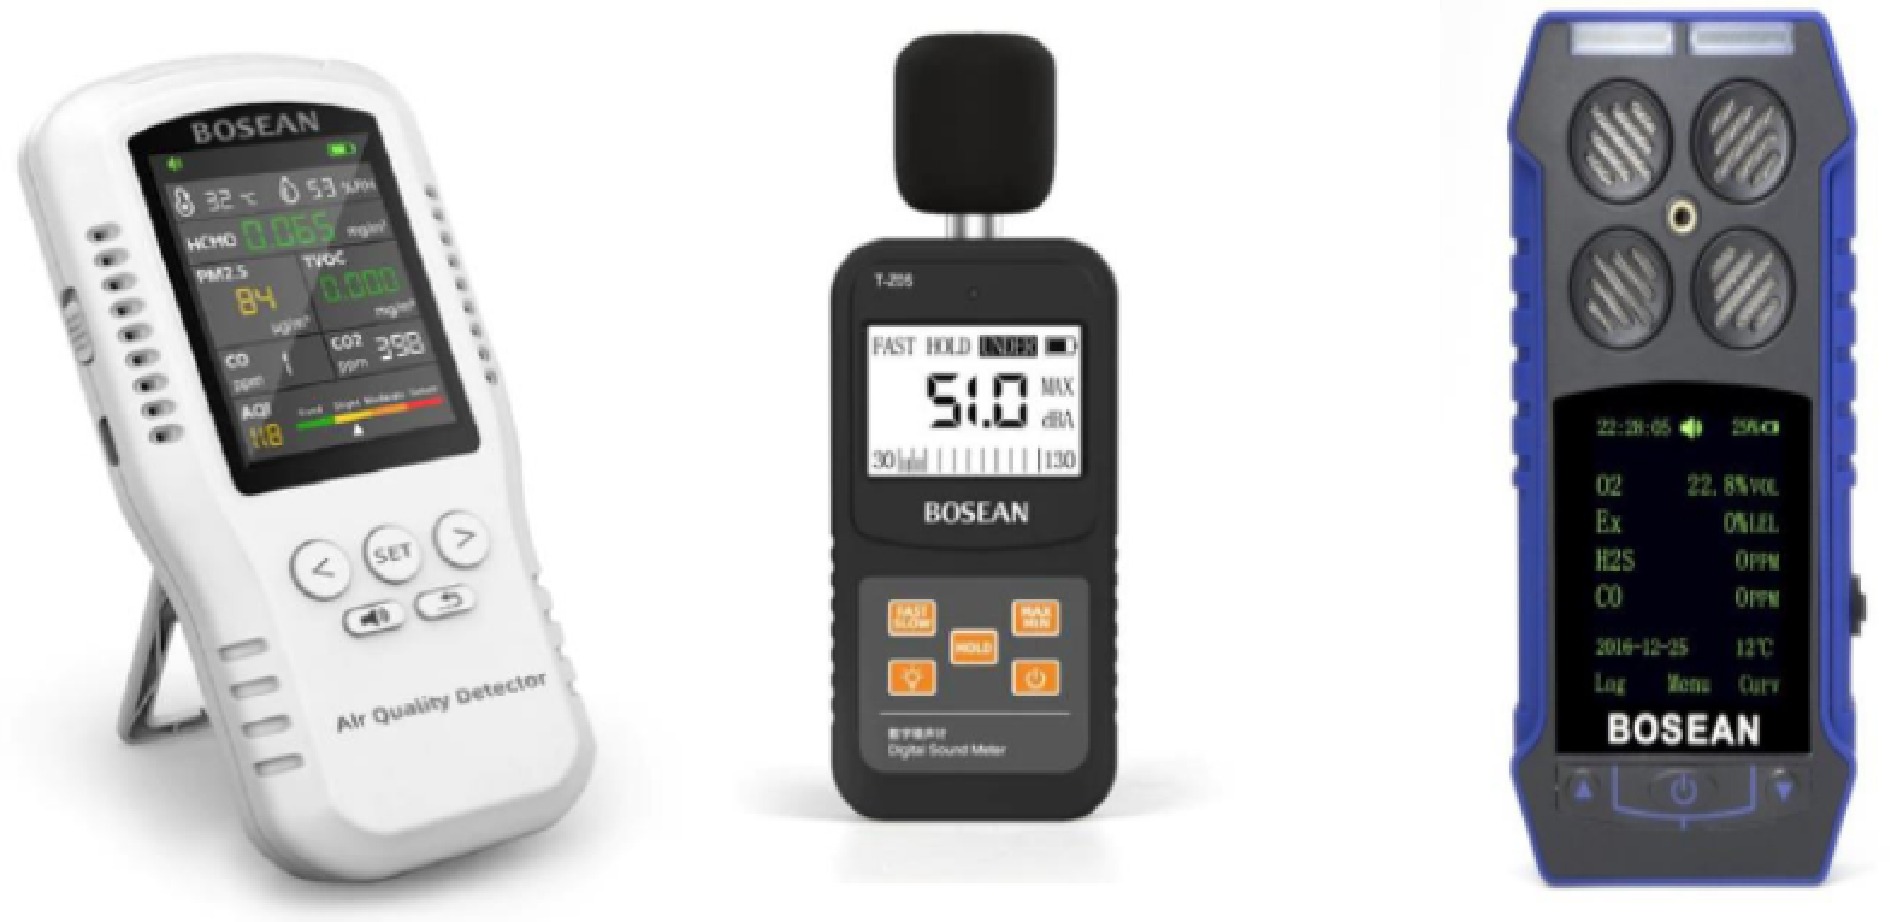
Figure 2.
Airborne particulate (left), noise level monitor counter (middle), and multigas monitor (right).
-
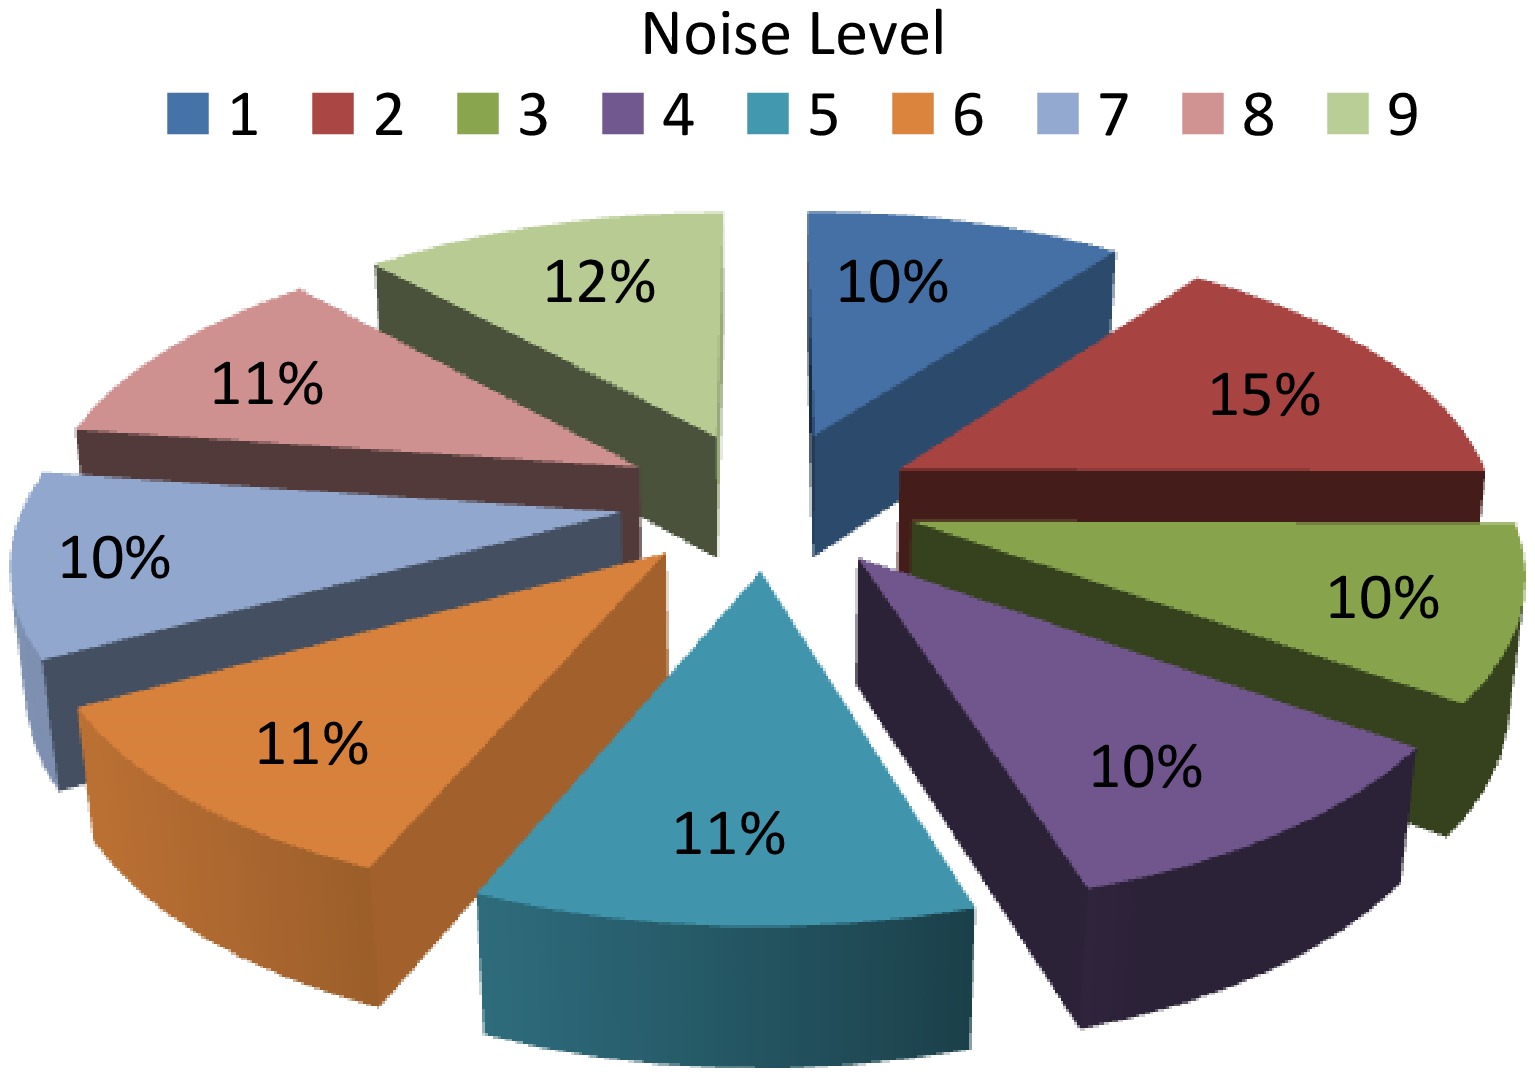
Figure 3.
Outcome of noise level scrutiny.
-
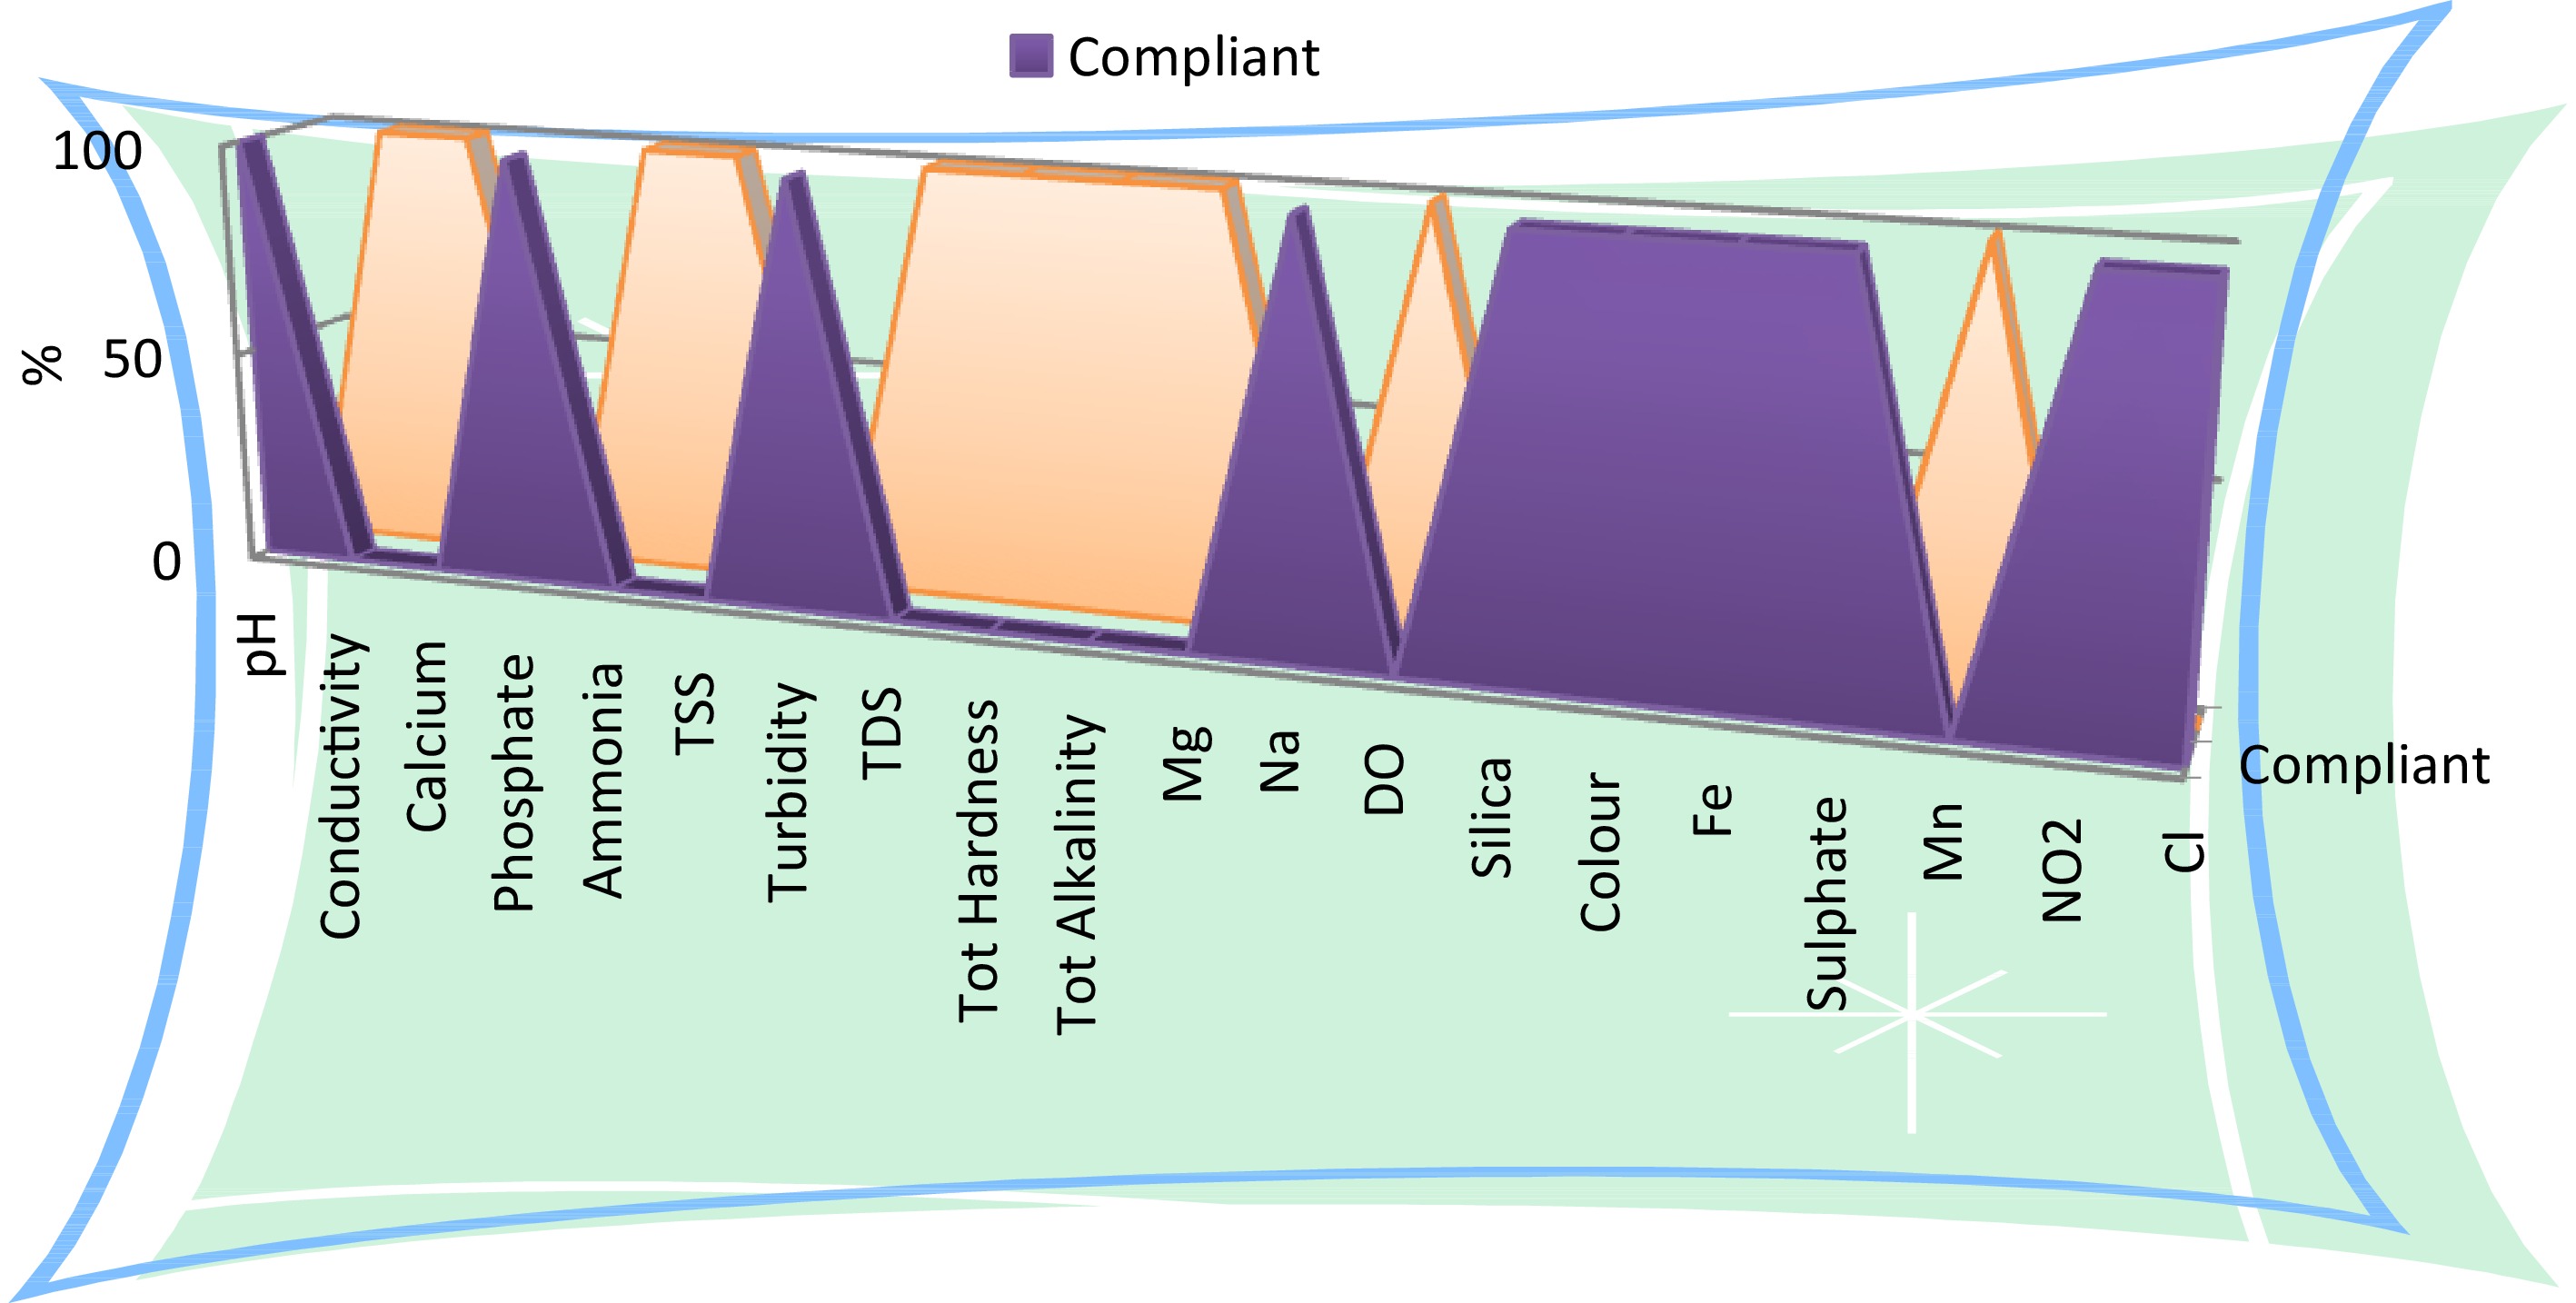
Figure 4.
Compliant and noncompliant levels of water attribute parameters.
-
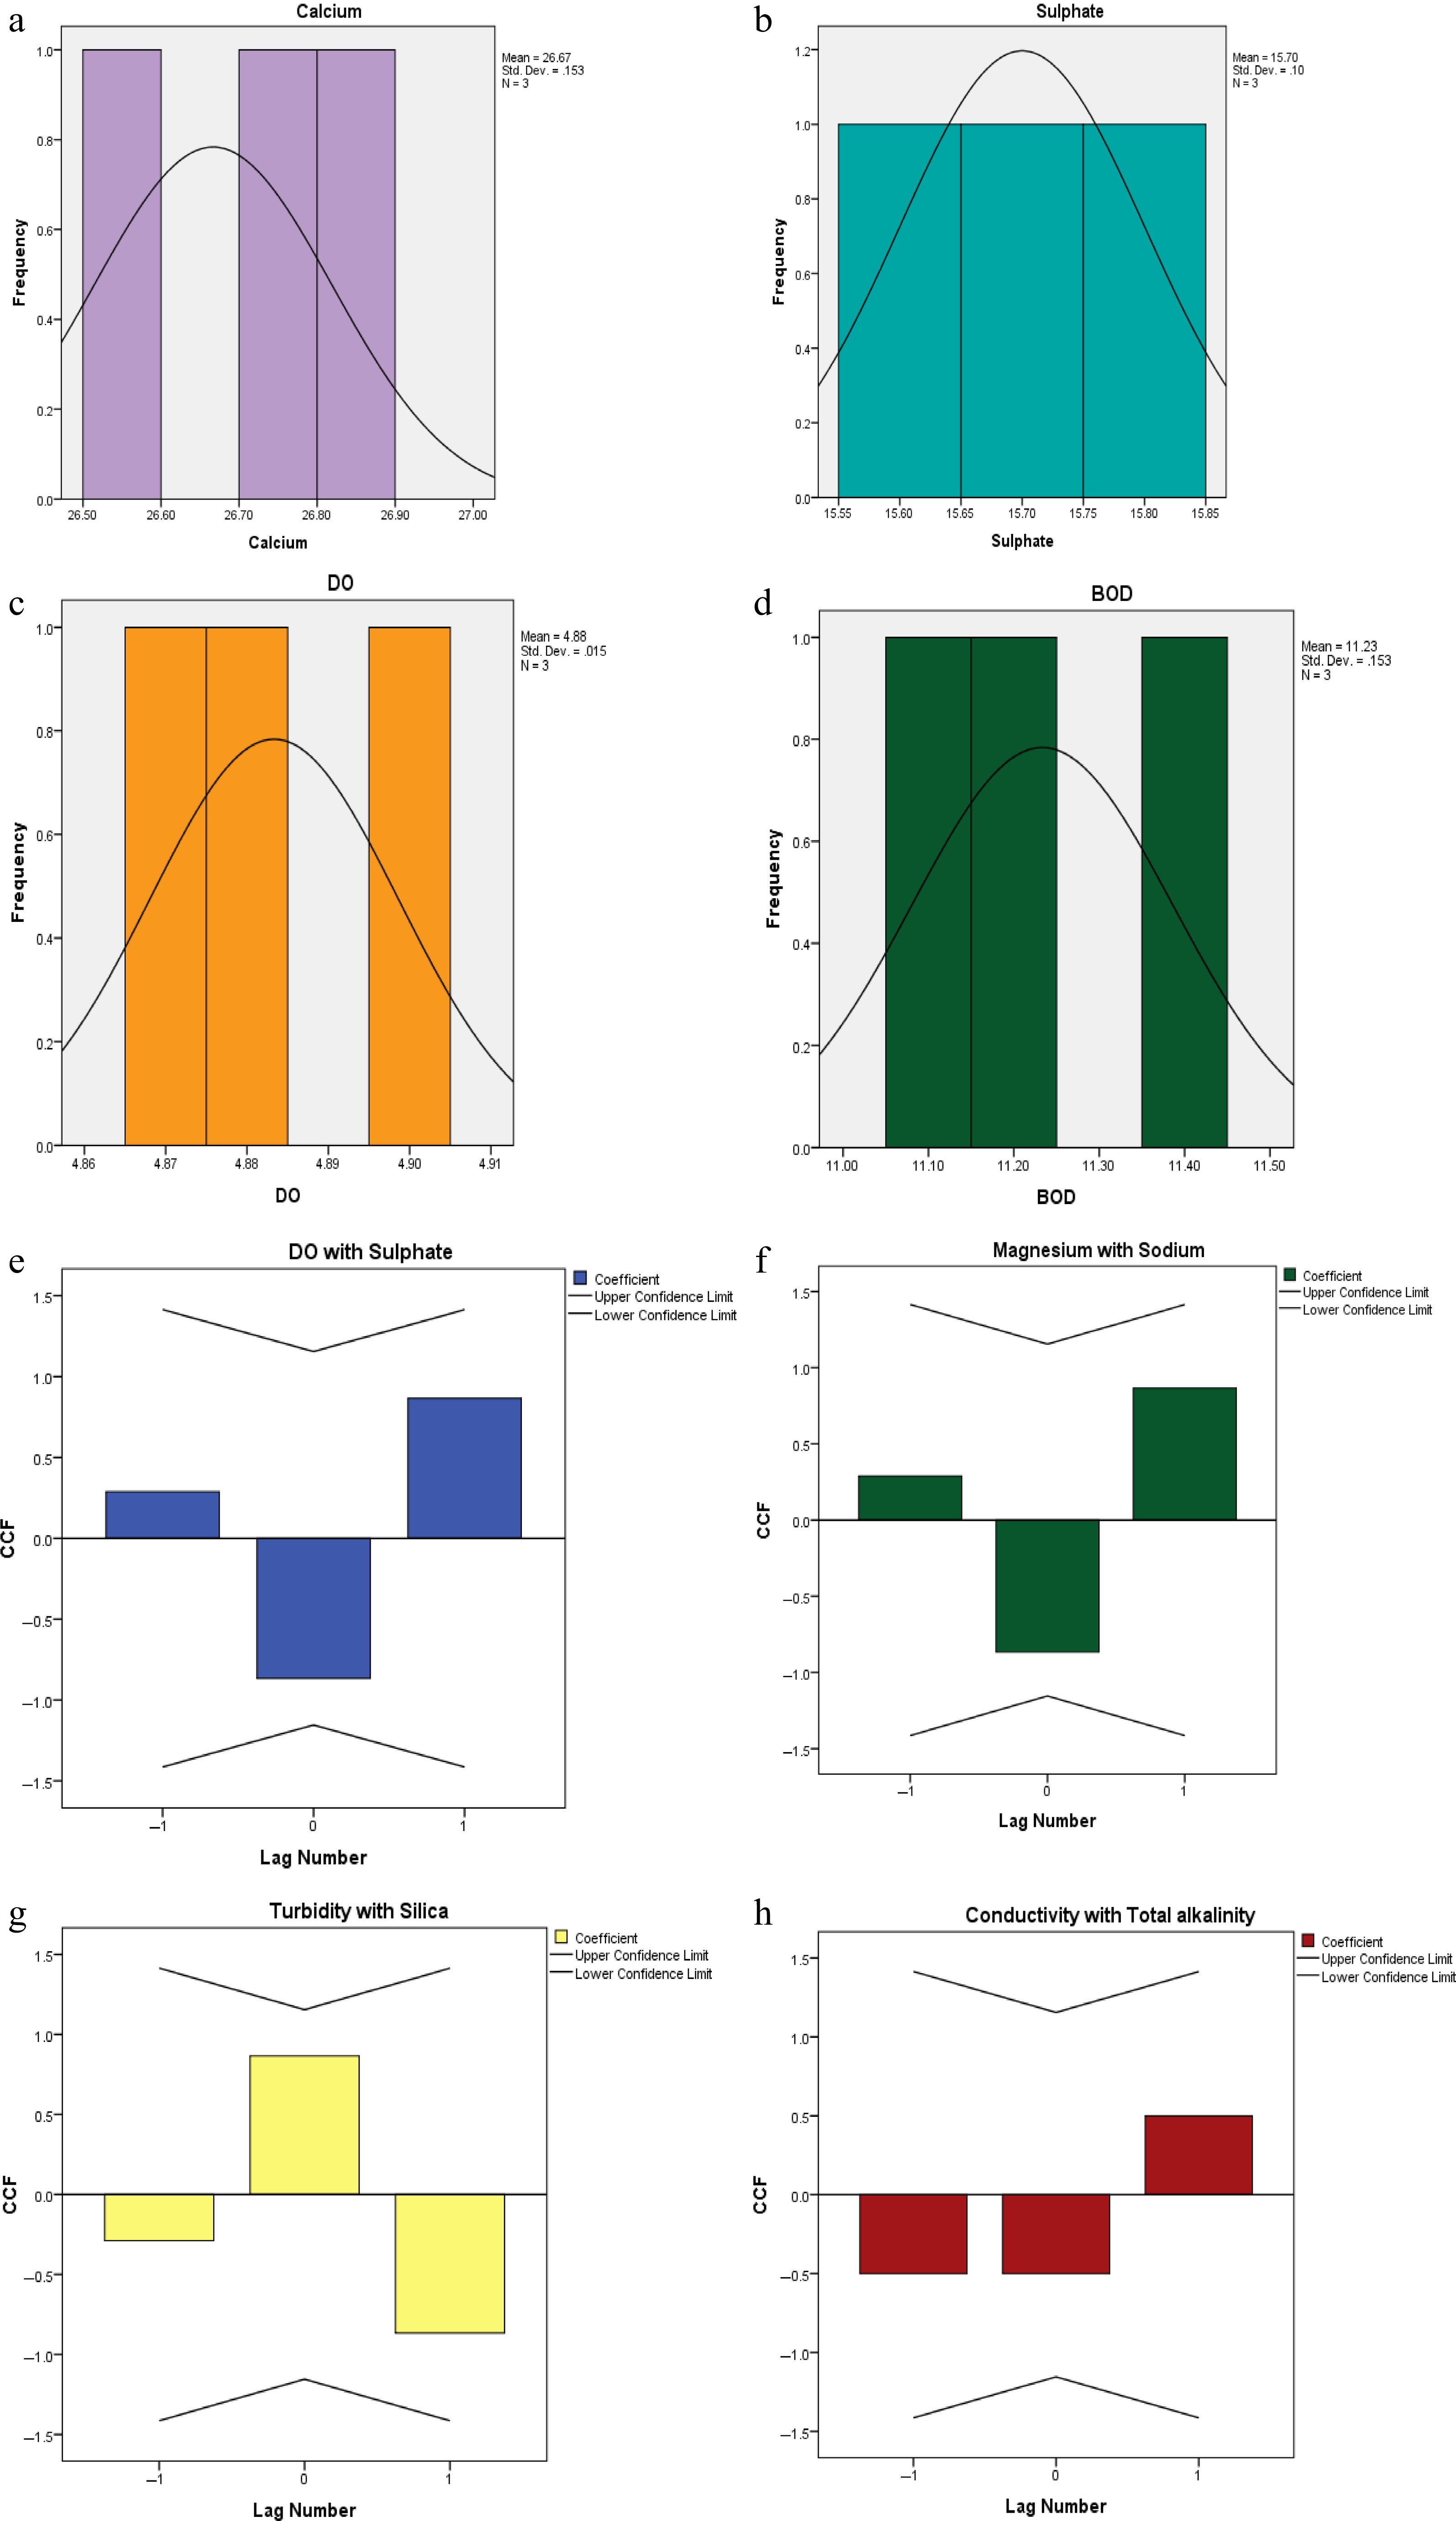
Figure 5.
Water attribute scrutiny outcome for some parameters.
-
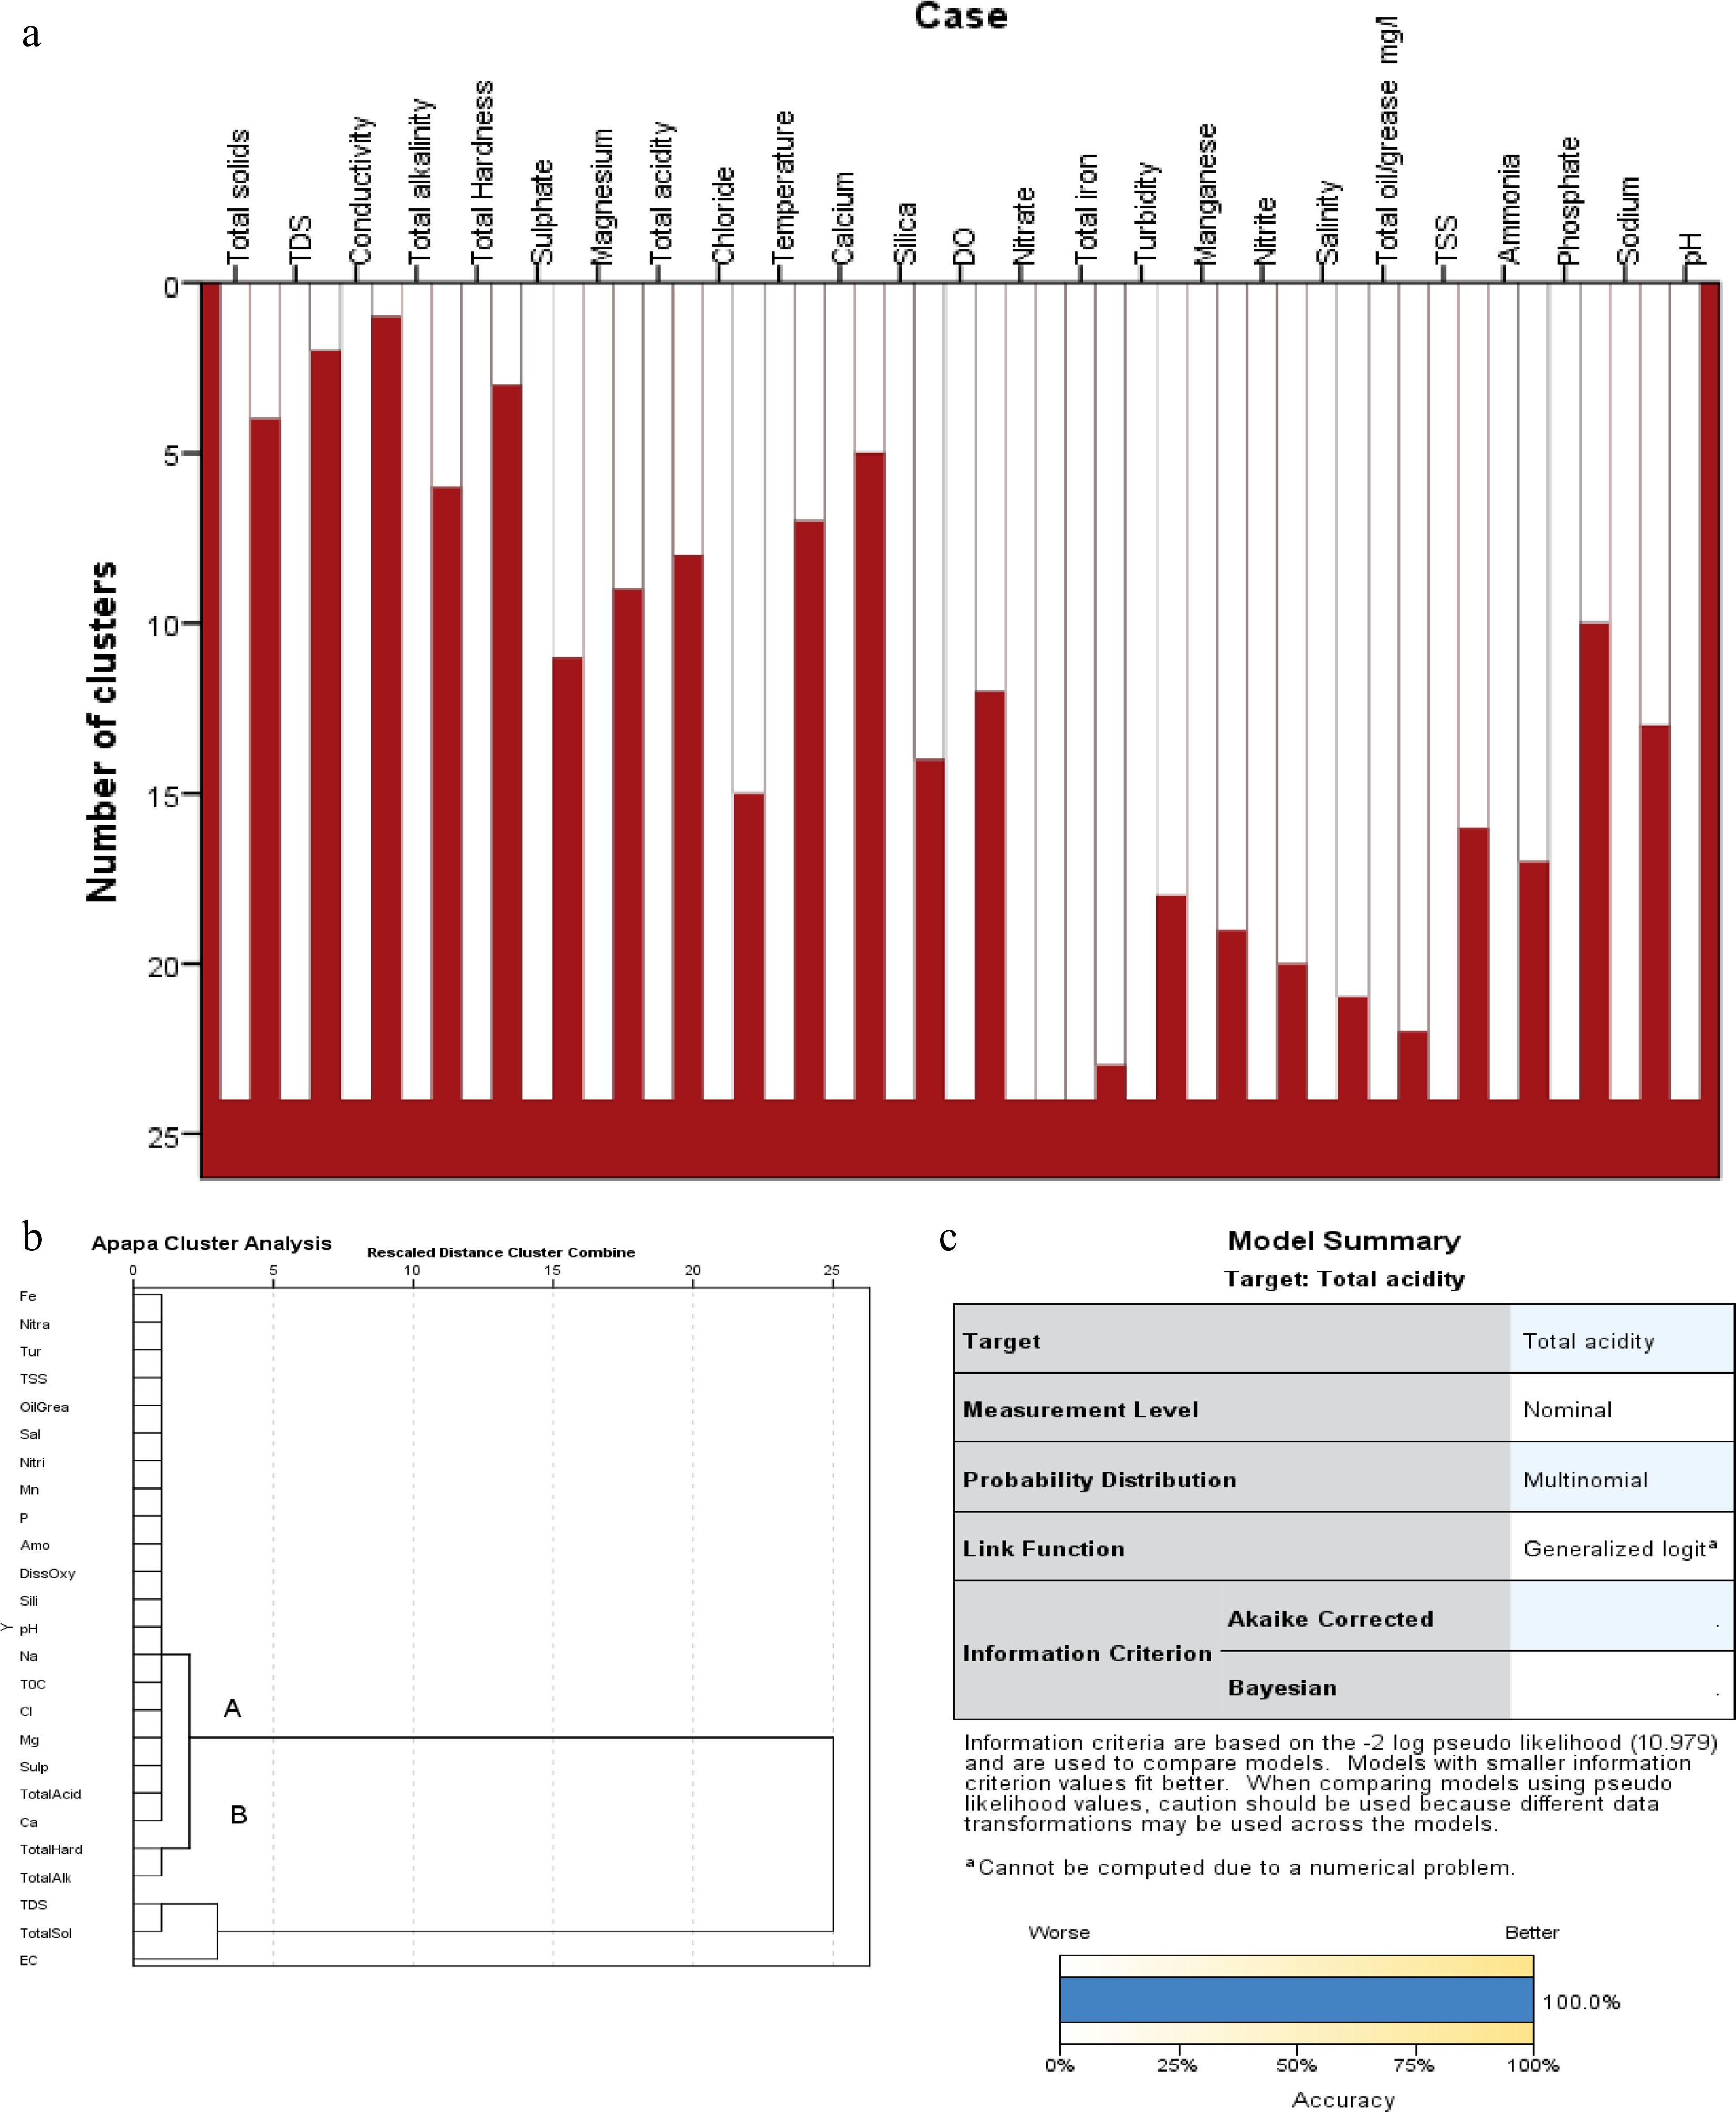
Figure 6.
Cluster investigation outcome of some parameters scrutinized.
-
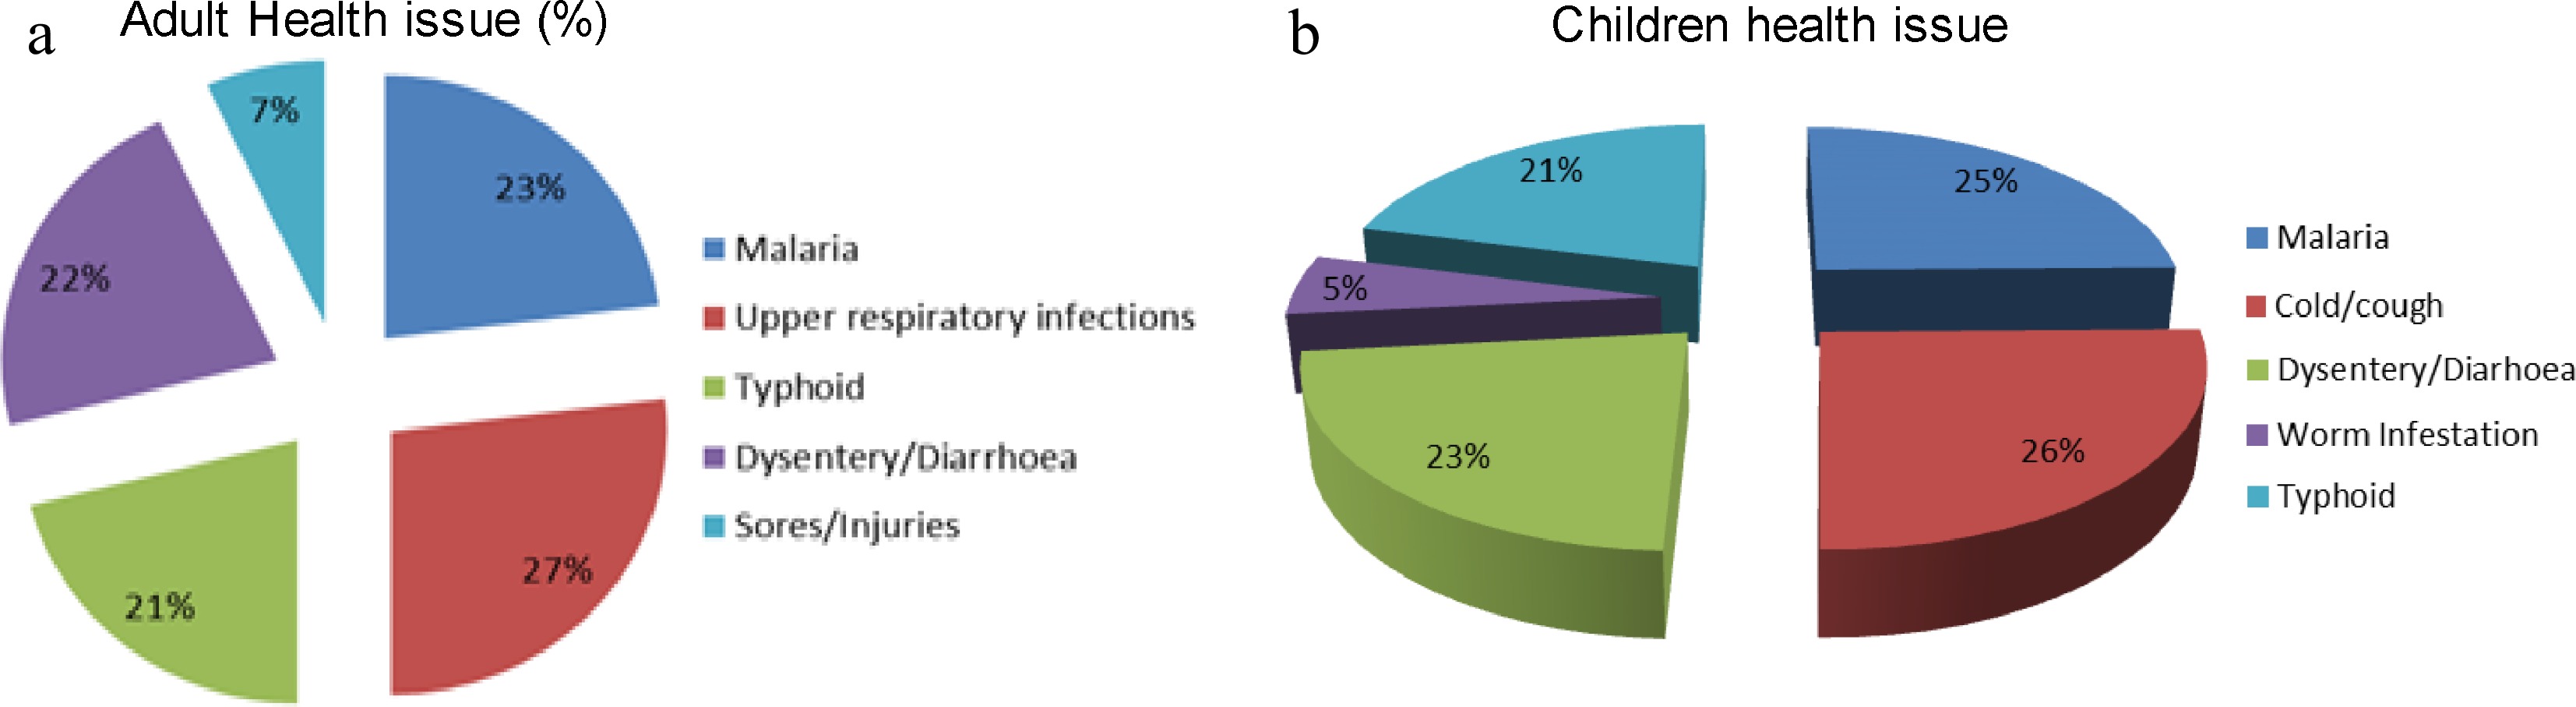
Figure 7.
Common health problems among the (a) adult and (b) children population.
-
Parameters Units Acronyms Techniques and instruments Total suspended particles TSP Temptop PMD 351Handheld air borne aerosoil meter
(HPPC6+) sum efficiency –50.0% @0.30 μm.Temperature, dew point, relative humidity and
wind speedT (°C), DP
RH and WSKestrel 5500 weather meter was utilized for the measurements Heavy metals Manganese, lead, copper, nickel, cadmium, cobalt, zinc Mg, Pb, Cu, Ni, Cd, Co, Zn APHA 3111B, UNICAM 969 AAS Microbiology (cfu/mi) Coliform, E. coli, Staphylococcu,Vibrio, total coliforms,
Aerobic plant count, yeast & mouldAPHA 9215C Anions Nitrate, nitrite mg/L NO 3 −, NO 2 − APHA 4500, UN spectrophotometer Sulphate, phosphate mg/L SO 4, PO 4 3− APHA 4500B, UN spectrophotometer Calcium mg/L Ca APHA 4500A, UN spectrophotometer Physico-chemical Hydrogen ion concentration pH pH meter/ in situ Colour Pt.Co APHA 2120A Dissolved oxygen mg/L APHA 5220A, DO meter Conductivity μs/cm Cond APHA 2510A, multi- parameter Chloride mg/L Cl − APHA 4500 B, titration Total dissolve solids mg/L TDS APHA 2540A, gravimetric Total suspended solids mg/L TSS APHA 2540D Appearance APHA 2110 Acidity mg/L APHA 2310B Ammonial nitrogen mg/L NH3C APHA 4500 Turbidity mg/L Turb APHA 2130B, turbidity meter Bacterial oxygen demand mg/L BOD APHA 5210B, Incubator/winkler Chemical oxygen demand mg/L COD APHA 5220D, K2C-207 reflux Alkalinity mg/L Alk APHA 5220D, K2C-207 reflux Detergent mg/L APHA 5540C Oil and grease mg/L APHA 5520B Table 1.
Measurement techniques with water attributes physiognomies.
-
Parameters Instrument Techniques Above Permissible Limit Health Impact Sulphur IV oxide (SO 2) SO 2 Gas alert test meter Direct reading Causes irritation of the respiratory tract Particulate matter (PM) Gas alert test meter Gravimetric Causes catarrh, cough, lung infections and other respiratory diseases Combustible gas (CHN) Gas alert test meter Direct reading Induces a despondent and depressed state Carbon monoxide (CO) CO test meter Direct reading Lessens the oxygen-carrying blood capability to damage of the central nervous system Oxides of nitrogen (NO X) NOx test meter Direct reading Causes inflammation of the lungs but less toxic Noise Noise meter, Rion sound level
meter NA modelDirect reading Table 2.
Scrutiny techniques and some health impacts of contagions.
-
Site/parameter PM10
(μg/m 3)PM25
(μg/m 3)CO
(ppm)NO 2
(ppm)H 2S
(ppm)CO 2
(ppm)VOC
(ppm)SO 2
(ppm)O 2
(%)Comb
(ppm)HM
(%)Temp
(°C)FMEnv limits 250 NS 0.03 0.313 0.008 425 8.53 0.01 NS NS NS NS 1 (Near gate) 10.9 5.2 < 0.10 < 0.01 < 0.1 417.1 0.014 < 0.01 21.1 < 0.01 62.3 35.1 2 (Generator) 8.1 4.3 < 0.10 < 0.01 < 0.1 398.2 0.013 < 0.01 20.8 < 0.01 61.1 33.9 3 (Sitting room) 5.3 2.1 < 0.10 < 0.01 < 0.1 401.9 0.019 < 0.01 20.9 < 0.01 60.9 29.0 4 (Water pump area) 12.1 6.9 < 0.10 < 0.01 < 0.1 692.8 0.357 < 0.01 21 < 0.01 63.2 34.1 5 (Laboratory zone) 9.2 6.3 < 0.10 < 0.01 < 0.1 460.1 0.162 < 0.01 21.1 < 0.01 67.2 31.9 6 (Tank Farm region) 10.8 7.9 < 0.10 < 0.01 < 0.1 397.9 0.000 < 0.01 21 < 0.01 68.9 32.0 7 (Water treatment) 8.9 4.1 < 0.10 < 0.01 < 0.1 468.2 0.194 < 0.01 21 < 0.01 69.0 31.8 8 (Water separator) 8.2 4 < 0.10 < 0.01 < 0.1 527.8 0.036 < 0.01 20.9 < 0.01 68.4 33.2 9 (Loading zone) 9.3 2 < 0.10 <0.01 < 0.1 575.4 0.194 < 0.01 20.8 < 0.01 61.9 35.3 10 (Jetty region) 7.2 3 < 0.10 < 0.01 < 0.1 397.9 0.056 < 0.01 21.0 < 0.1 65.3 35.0 Within limits (%) 100 0 100 100 70 100 100 − − − − Not within limits (%) 0 100 0 0 30 0 0 − − − − NS, Not Seen; −, NIL. Table 3.
Outcome of ambient air quality at Apapa Lagos.
-
WHO limits 2007 Biern et al. 2015 Receptor Noise level (dBA) Environ Health effect Noise level (dBA) Day
(7.00 am−22.00 pm)Night
(22.00 pm−7.00 am)Built-up, institutional, and education 55 45 Indoors bedroom Speech intelligibility, and moderate annoyance (daytime) 35 Business, shopping, marketable, indoors, outdoors and traffic region 70 70 Sleep fracas (Nocturnal) 30 Outside bedrooms Sleep fracas window open 45 Outdoor, living room Serious annoyance (night time) 55 Moderate annoyance
(day/evening time)50 Table 4.
Guideline limits.
-
Site GPS coordinate Noise level (dBA) Limit remarks 1 (Near gate) N 6°26'23.27649",
E 3°20'1.36792"61.42 Not 2 (Generator) N 6°26'20.63513",
E 3°20ʼ0.899"89.88 Not 3 (Sitting room) N 6°26'19.01821",
E 3°20'1.1585"59.48 Not 4 (Water pump area) N 6°26'18.85029",
E 3°20'1.72881"61.79 Within 5 (Laboratory zone) N 6°26'17.65008",
E 3°20'0.24541"67.12 Within 6 (Tank farm region) N 6°26'18.24981",
E 3°19'57.87729"63.42 Within 7 (Water treatment) N 6°26'16.64496",
E 3°19'57.845"62.79 Within 8 (Water separator) N 6°26'16.93323",
E 3°20'0.22097"66.4 Within 9 (Loading zone) N 6°26'17.69233",
E 3°20'0.54988"70.39 Not World Bank %: Within – 44.4%; % Not within – 55.6%. Table 5.
Outcome of ambient noise in Apapa Lagos during the day time.
-
Variables Unit Sites Limits Compliant status (%) 1 2 3 EGASPIN 2018 FEPA 1991 Compliant Non-within Calcium mg/L 26.7 26.8 26.5 NS NS 100 0 Sulphate mg/L 15.7 15.6 15.8 NS 100 − − Dissolved oxygen mg/L 4.88 4.90 4.87 NS NS − − COD mg/L 48.2 47.9 48.1 NS 40 0 100 BOD mg/L 11.4 11.2 11.1 NS 10 0 100 Ammonia mg/L 0.24 0.23 0.23 NS 0.2 0 100 Total hardness mg/L 66.3 66.1 66.4 NS 200 100 0 Total nitrogen mg/L 0.53 0.54 0.53 NS 10 100 0 Total suspended solida mg/L 0.12 0.14 0.10 30 10 100 0 Total suspended matter mg/L 124.9 124.8 125.1 NS NS − − Conductivity μS/cm 155.9 156.1 156.0 NS 1,000 100 0 Total dissolved solids 78.2 78.0 79.8 < 2,000 500 100 0 Turbidity NTU 22.1 22.3 22.4 10 5 0 100 True colour/ Lovibond Hz 0.17 0.15 0.16 NS 7 100 0 pH 6.7 6.8 6.9 6.5−8.5 6.5−8.5 100 0 Temperature °C 24.8 24.9 25.1 Ambient ± 2 < 40 100 0 Total alkalinity mg/L 51.8 51.9 52.0 NS NS − − Total phosphorus mg/L 0.34 0.32 0.33 NS NS − − Salinity % 0.00 0.01 0.00 NS NS − − Sodium mg/L 5.82 5.84 5.83 NS NS − − Nitrate mg/L <0.01 <0.01 <0.01 NS NS − Hydroxide alkalinity mg/L 0.01 0.02 0.00 NS NS − Carbonate alkalinity mg/L 0.01 0.02 0.00 NS NS − Magnesium mg/L 9.67 9.68 9.69 NS NS − Manganese mg/L 0.52 0.51 0.53 NS 0.05 0 100 Chloride mg/L 14.7 14.8 14.9 NS 250 100 0 Silica (SiO 2) mg/L 1.12 1.13 1.11 NS NS − Acidity mg/L 1.12 1.13 1.11 NS NS − Nitrite mg/L 0.32 0.33 0.31 NS NS − Total iron mg/L 1.14 0.12 1.13 1.0 1.0 0 100 Total oil and grease mg/L 0.03 0.04 0.03 NS 10 100 0 Detergent mg/L ND ND ND NS NS − ND, Not Detected; NS, Not Seen; −, NIL. Table 6.
Outcome of effluent from oil water separator.
-
Variables Unit Sites Limits Compliant status (%) 1 2 3 EGASPIN 2018 FEPA 1991 Compliant Non-within Salmonella in 25 mL Absent Absent Absent NS NS − − Shigella in 25 mL Present Present Present NS NS − − E. coli CFU/mL 7.1 7.0 7.1 NS NS − − Yeast and mould CFU/mL 27.9 28.0 28.1 NS NS − − Staphylococcus CFU/mL 9.2 9.0 9.1 NS NS − − Vibrio CFU/mL 12.0 12.2 12.1 NS NS − − Total coliforms CFU/mL 11.2 11.1 11.0 NS NS − − Aerobic plant count CFU/mL 9 8.9 9.0 NS NS − − Others BTEX mg/L < 0.001 < 0.001 < 0.001 NS NS − − PAH mg/L < 0.001 < 0.001 < 0.001 10 NS 100 0 Odour Objectionable NS NS Appearance Light brown with particles Colourless ND, Not Detected; NS, Not Seen; −, NIL. Table 7.
Outcome of effluent (microbiological and others) from oil water separator.
-
Contagions Health impacts Short term Long term Ethylbenzene Dizziness, eye and throat irritation Blood disorders Benzene Skin blister and irritation, upper respiratory tract Developmental and reproductive disorders n-Hexane Headache, giddiness and nausea Blurred vision, fatigue, extremities and headaches Toluene Sleep difficulty, dizziness, skin and eyes irritation Birth defects Xylenes Nose, gastric and throat irritation, neurological, vomiting and nausea Nervous system disorders Table 8.
Some contagions and effects.
-
Variables Unit Sites Limits Compliant status (%) 1 2 3 FEPA WHO USEPA NIS EU Compliant Non-within pH 7.08 7.09 7.07 6.5−8.5 6.5−8.5 100 0 Conductivity μs/cm 1,694.9 1,695 1,695.1 1,000 − 1,000 1,000 2,500 0 100 Calcium mg/L 109.1 108.9 109.2 75 0 100 Phosphate mg/L 1.01 1.00 1 < 5.0 − − NS − 100 0 Ammonia mg/L 0.48 0.47 0.49 0.05 0 100 TSS mg/L 0.09 0.08 0.10 < 10 − − NS − 100 0 Temperature °C 25.4 25.5 25.3 Ambient 100 0 Turbidity NTU 0.01 0.02 0.01 5 5 5 5 − 100 0 Total acidity mg/L 61.4 61.3 61.4 NS − TDS mg/L 847.2 847.4 847.3 500 − 500 500 − 0 100 Total hardness mg/L 272.4 272.3 273.3 200 80−100 − 150 − 0 100 Total alkalinity mg/L 408.4 408.2 408.3 − − − 200 − 0 100 Total solids mg/L 1,039.9 1,040.2 1,040.3 NS − Magnesium mg/L 39.8 39.7 39.8 20 0 100 Sodium mg/L 10.7 10.8 10.6 200 Chloride mg/L 26.8 26.9 26.7 250 250 250 250 250 DO mg/L 2.07 2.06 2.07 2 Nitrite mg/L 0.13 0.14 0.12 0.2 Manganese mg/L 0.23 0.22 0.21 0.2 Total iron mg/L < 0.01 < 0.01 < 0.01 0.3 Sulphate mg/L 50.2 50.3 50.1 500 250 250 250 250 100 0 Silica mg/L 3.93 3.94 3.92 40 100 0 Salinity % 0.09 0.08 0.07 NS − Nitrate mg/L < 0.01 < 0.01 < 0.01 50 50 50 50 50 100 0 Total oil/grease mg/L 0.08 0.09 0.10 10 100 0 Colour TCU 0.17 0.16 0.18 15 100 0 Appearance Colourless Colourless Odour Objectionable Unobjectionable Taste Objectionable Unobjectionable ND, Not Detected; NS, Not Seen; −, NIL. Table 9.
Outcome of water attributes.
-
Variables Unit Sites Limits Compliant status (%) 1 2 3 FEPA WHO EU USEPA NIS Compliant Non-within Salmonella in 25 mL Absent Absent Absent NS − − − NS − − Shigella in 25 mL Absent Absent Absent − − − − NS − − E. coli CFU/mL 0.00 0.00 0.00 0 − − − 0 100 0 Yeast/mould CFU/mL 7 7.1 7 − − − − 0 100 0 Staphylococcu CFU/mL 0 0 0 NS − − − NS − − Vibrio CFU/mL 0 0 0 NS − − − NS − − Aerobic plate count CFU/mL 26 26.1 26.2 NS − − − 100 100 0 Nigerian Industrial Standards for Drinking Water (NIS 554:2015). NS, Not Seen; −, NIL. Table 10.
Outcome of water attributes (microbiological).
-
Paramenter Initial Final C1 C2 C2 Cl 26.5 26.8 26.75 SO 2 15.8 15.6 15.65 DO 4.87 4.9 4.89 COD 48.1 47.9 48.05 BOD 11.1 11.2 11.3 AMMO 0.23 0.22 0.23 TH 66.4 66.1 66.2 Total Nitr 0.53 0.54 0.54 TSS 0.1 0.14 0.13 TSM 125.1 124.8 124.85 Cond 156 156.1 156 TDS 79.8 78 78.1 Tur 22.4 22.3 22.2 True Color 0.16 0.15 0.16 pH 6.9 6.8 6.75 T (°C) 25.1 24.9 24.85 TA 52 51.9 51.85 TPhos 0.33 0.32 0.33 Mg 9.69 9.68 9.68 Salinity 0 0.01 0.01 Na 5.83 5.84 5.83 HydrAlk 0 0.02 0.02 NO 2 0 0 0 Mn 0.53 0.51 0.52 Cl 14.9 14.8 14.75 SiO 2 1.13 1.11 1.12 CaCO 3 1.11 1.13 1.13 CarAlk 0.02 0 0.01 Table 11.
Cluster scrutiny outcome.
Figures
(7)
Tables
(11)