


-
Emissions of effluents, anions, metals, cations, and particulate pollutants from industrial establishments are one of the key sources of environmental contagion [ 1, 2] . Anions, gaseous emission and other metals such as SO 2, particulate matter (PM), combustible gas (CHN), carbon monoxide (CO), hazardous materials in contagion soils, can be transported by wind, water, and other human activity with their resultant health impacts and effects on the environment [ 3− 5] . Cement and oil factories have been reported to be a main source of various emissions and air pollutants to the environs with numerous reports displaying higher concentrations of contagions around oil and cement factories.
Air quality is an appraiser of the appropriateness of air for breathing by animals, the populace, and plants in terms of potential fitness impacts. Good outdoor air quality is fundamental to human well-being [ 6− 8] . Averagely, A person breathes, on average, about 14,000 litres of air every day, and the presence of contagions in this air can harmfully affect public health. Poor air quality has been ascertained to have somber effects on human fitness and well-being as well as the environment [ 8− 10] . Air pollution is implicated as the major cause of many environmental problems including the ozone layer destruction, acerbic rain, mercury contagion, and global warming. Hygienic air is indispensable for sustaining the insubstantial balance of existence on the globe — not only human populace, but also flora and fauna, water, foliage, shrubbery, and soil [ 11− 13] . Air contamination isn't just an al fresco matter, but enclosed spaces, for instance workplaces, habitats, or schools can also be contaminated via contagions that have been emitted through outdoor and indoor sources. Furthermore, some categories of air contagion may be worse for indoors than outdoors, for instance chemicals discharged from synthetic textiles, cigarettse, fittings, and home-use products [ 14− 16] . Contamination of the environment by particulates, effluents, metals, and other pollutants is of major concern due to their toxicity and risk to the environment and human life. Particulate and emission toxicity seems to be dependent on exposure route, duration, dose, and exposure frequency. For instance, when oil is explored in water sparse zones the water resources become strained. Off-shore oil exploration creates threats to oceanic life whereas oil circulation and haulage will create extreme hazards for the ecosystem in case of seepage or accidents [ 17, 18] . When oil spill-outs occur, or when there is waste matter expulsion, it percolates into the soil and blends with the underground water system. It has been ascertained that contaminated underground water takes many years to recover [ 19− 21] . Nonetheless this underground water moves into brooks, streams, rivulets, and boreholes or wells which are the key sources of local water supplies in the neighborhood whose consequences are the upsurge of water-borne sicknesses [ 5, 22] . This has disturbed the traditional rapport of the inhabitants within the oil-bearing enclaves. There is a discernible trepidation that instead of being the life-giver, these water scenarios have become sources of death, misery, and sickness [ 23− 26] .
-
Apapa, one of the Local Government Area in Lagos State and home to two of Nigeria's busiest seaports that have numerous tank farms and several big companies was chosen, because it is a significant business zone and a huge component of Nigeria's economy. Similarly, although it is a very significant area, the deplorable state of Apapa instigated over time because of the Federal Governments failure in expanding infrastructure development in line with the rising population has been horrendous to port operators, travelers, chauffeurs, and the general public.
Apapa falls within the tropical savannah climate based on the Köppen climate categorization, as there is a momentous precipitation discrepancy between the humid and the arid seasons. The average temperature in January is 27 °C ( Fig. 1a− c). Temperatures in Lagos rarely get colder than 20 °C, and rarely get hotter than 30 °C. Temperature values are high throughout the year over the project environment. The temperature within the study location was between 32 °C and 35 °C. Because the project area has a tropical savannah climate, there are two different rainy seasons. The heavy rain season is between April and July, and the milder rain season occurs from October to November. A very brief dry season occurs in August and September usually called the 'August break' and a long dry spell occurs from December to March. The rainfall between May and July averages over 300 mm, while the average rainfall in August and September is only 75 mm. In January, the average rainfall is only about 35 mm. Relative humidity is normally in excess of 80%, the peak of the wet period is shown in Fig. 1c. The standard yearly relative humidity is 84.7% and mean monthly relative humidity varies from 80.0% in March to 88.1% in June. This is understandable given the geographical location of Lagos and the fact that rain falls almost all year round. The micro-climatic condition of the study area falls within the historical humidity of 66.2%–90.9% peculiar to the Lagos area. The climate is influenced by two key trade winds – the warm, humid Southern-west trade winds during the rainy period and the Northern-east trade wind during the arid and grimy harmattan. The wind speed directions are synchronous to the periodic attitude of the Inter-Tropical Convergence Region. During the wet season, the Southwest winds prevail, and during the dry season, the Northeast winds prevail as they sweep in the arid season. The wet season begins around April and ends around October. August is the coolest and also the windiest with a mean wind speed of 13 km/h. A weather tracker, a sophisticated multi-function environment monitoring instrument, was utilized to measure key environmental conditions such as altitude, temperature, wind speed, relative humidity, barometer pressure, density, and wind chill. It can also measure wet bulb, and heat index.
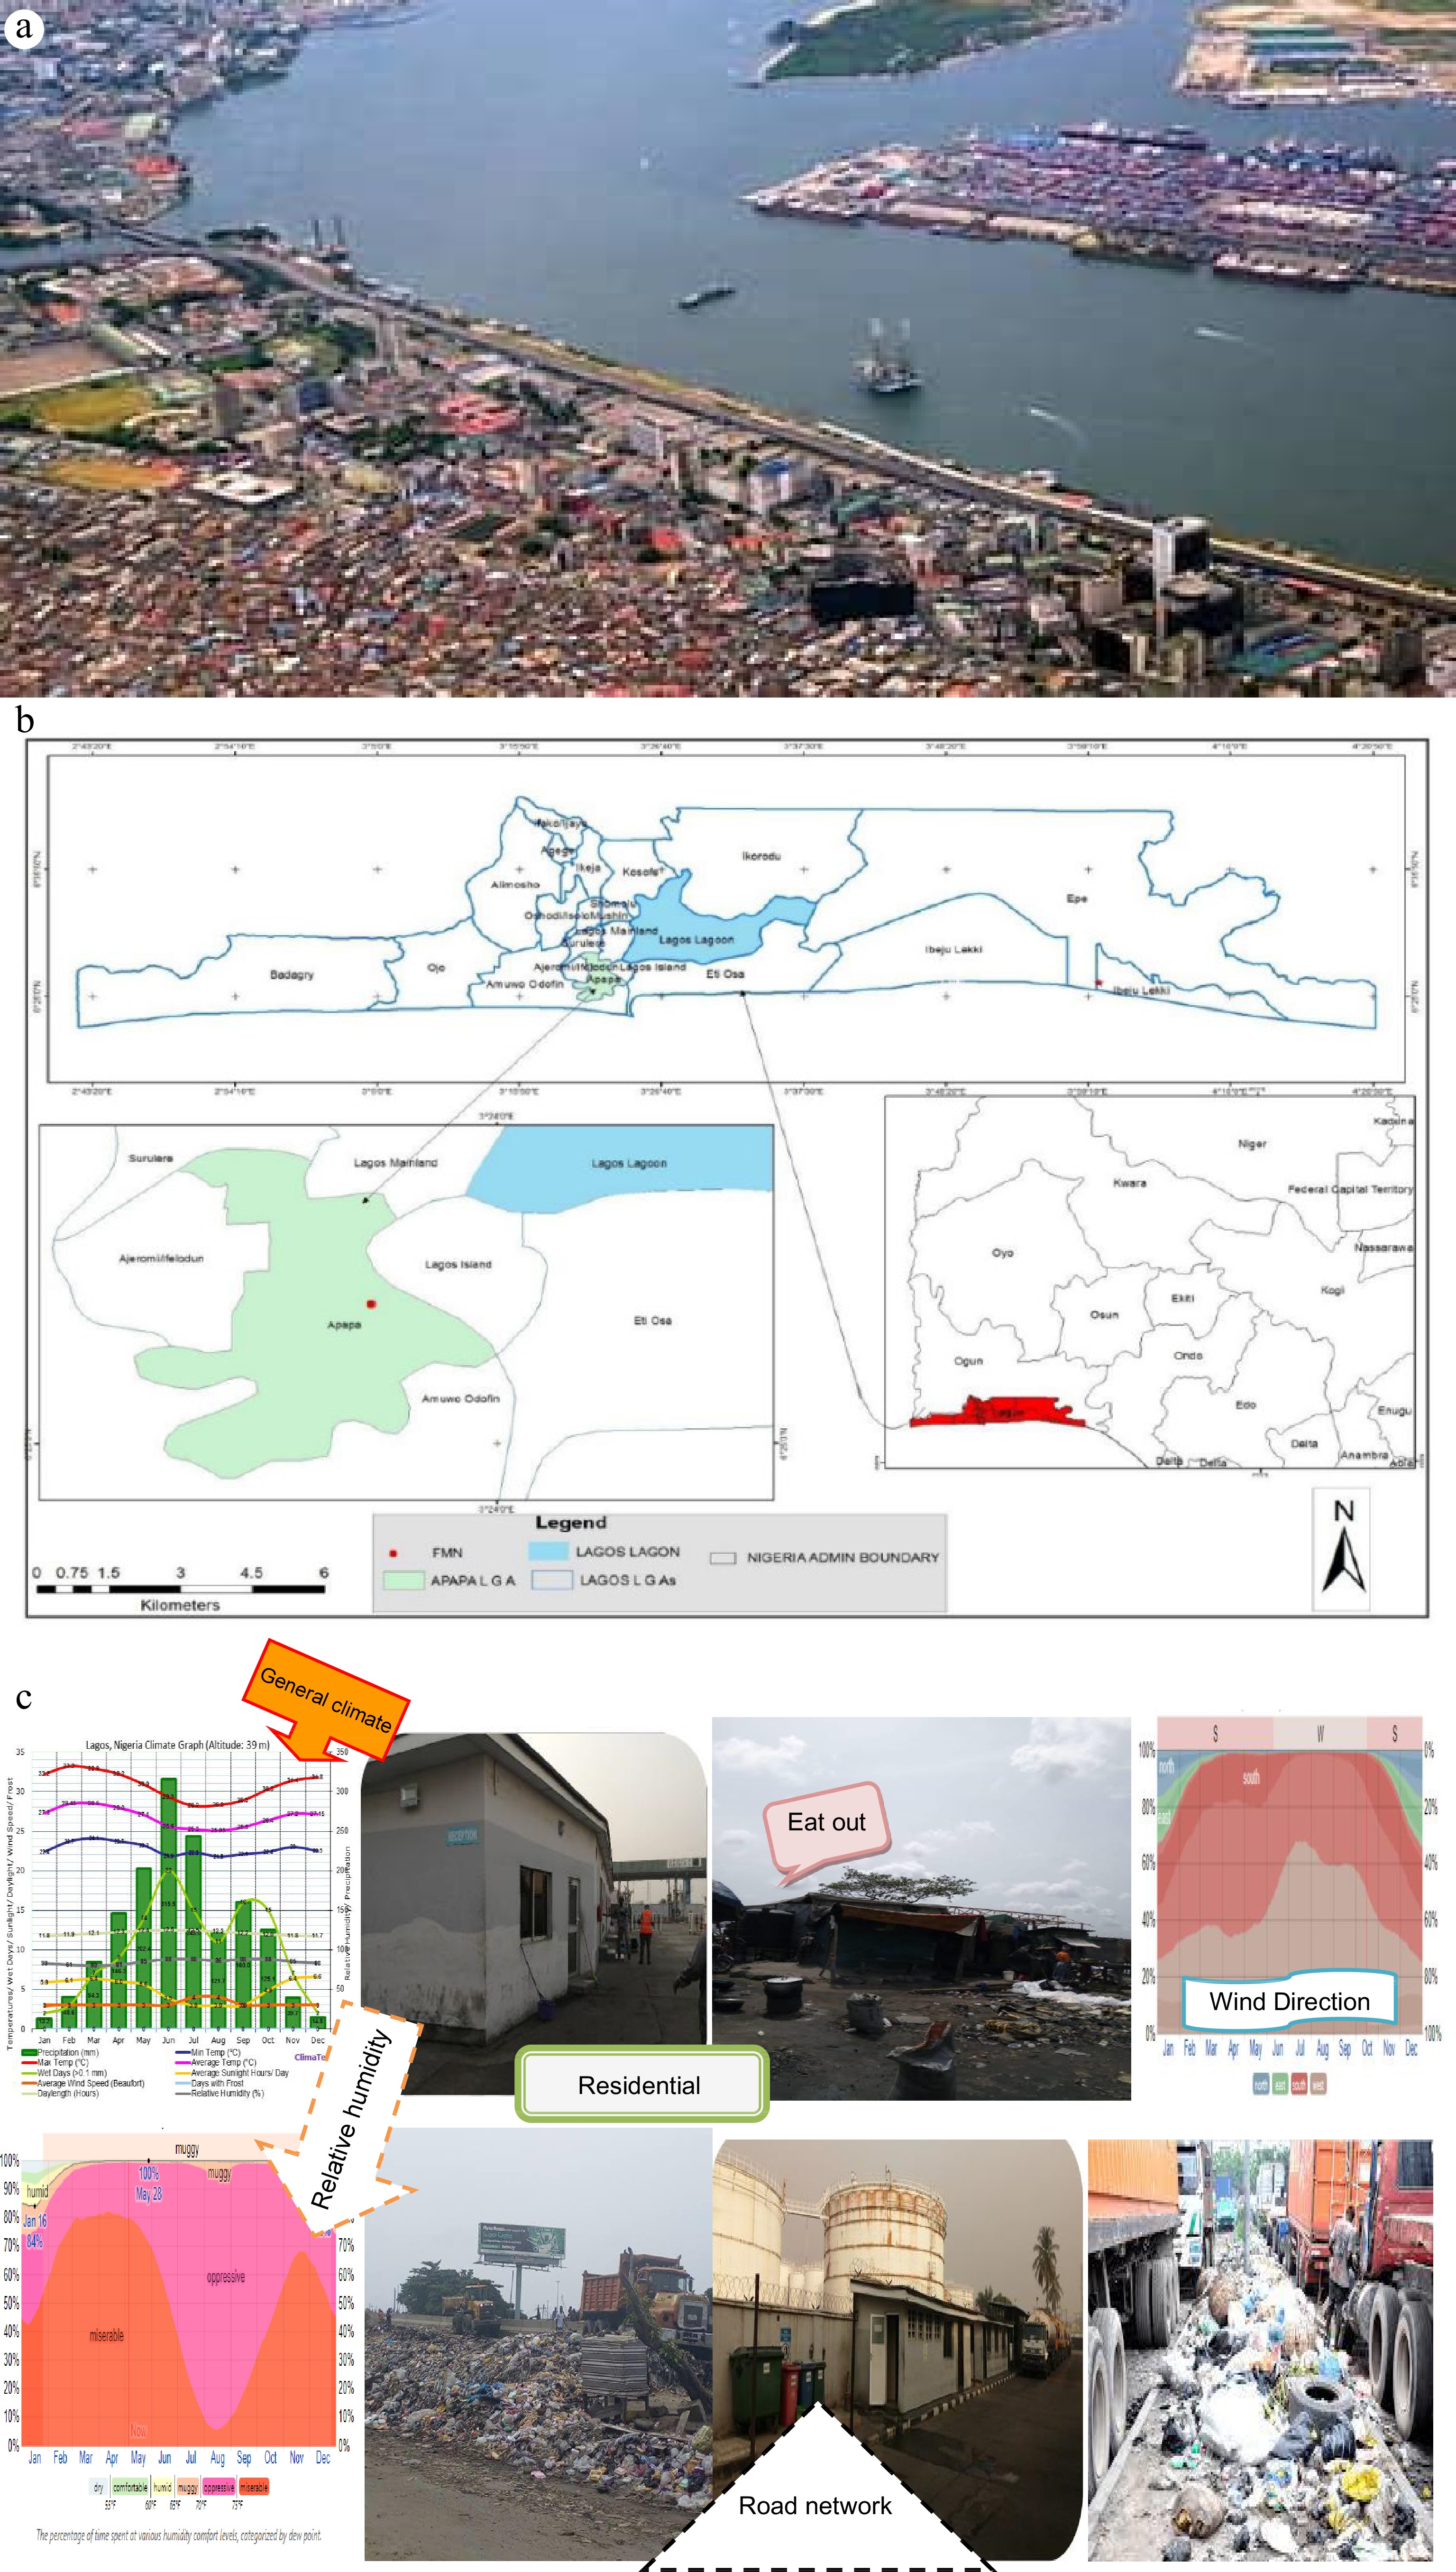
Figure 1.
(a) Apapa port, (b) study region, and (c) climate and activities around its environ.
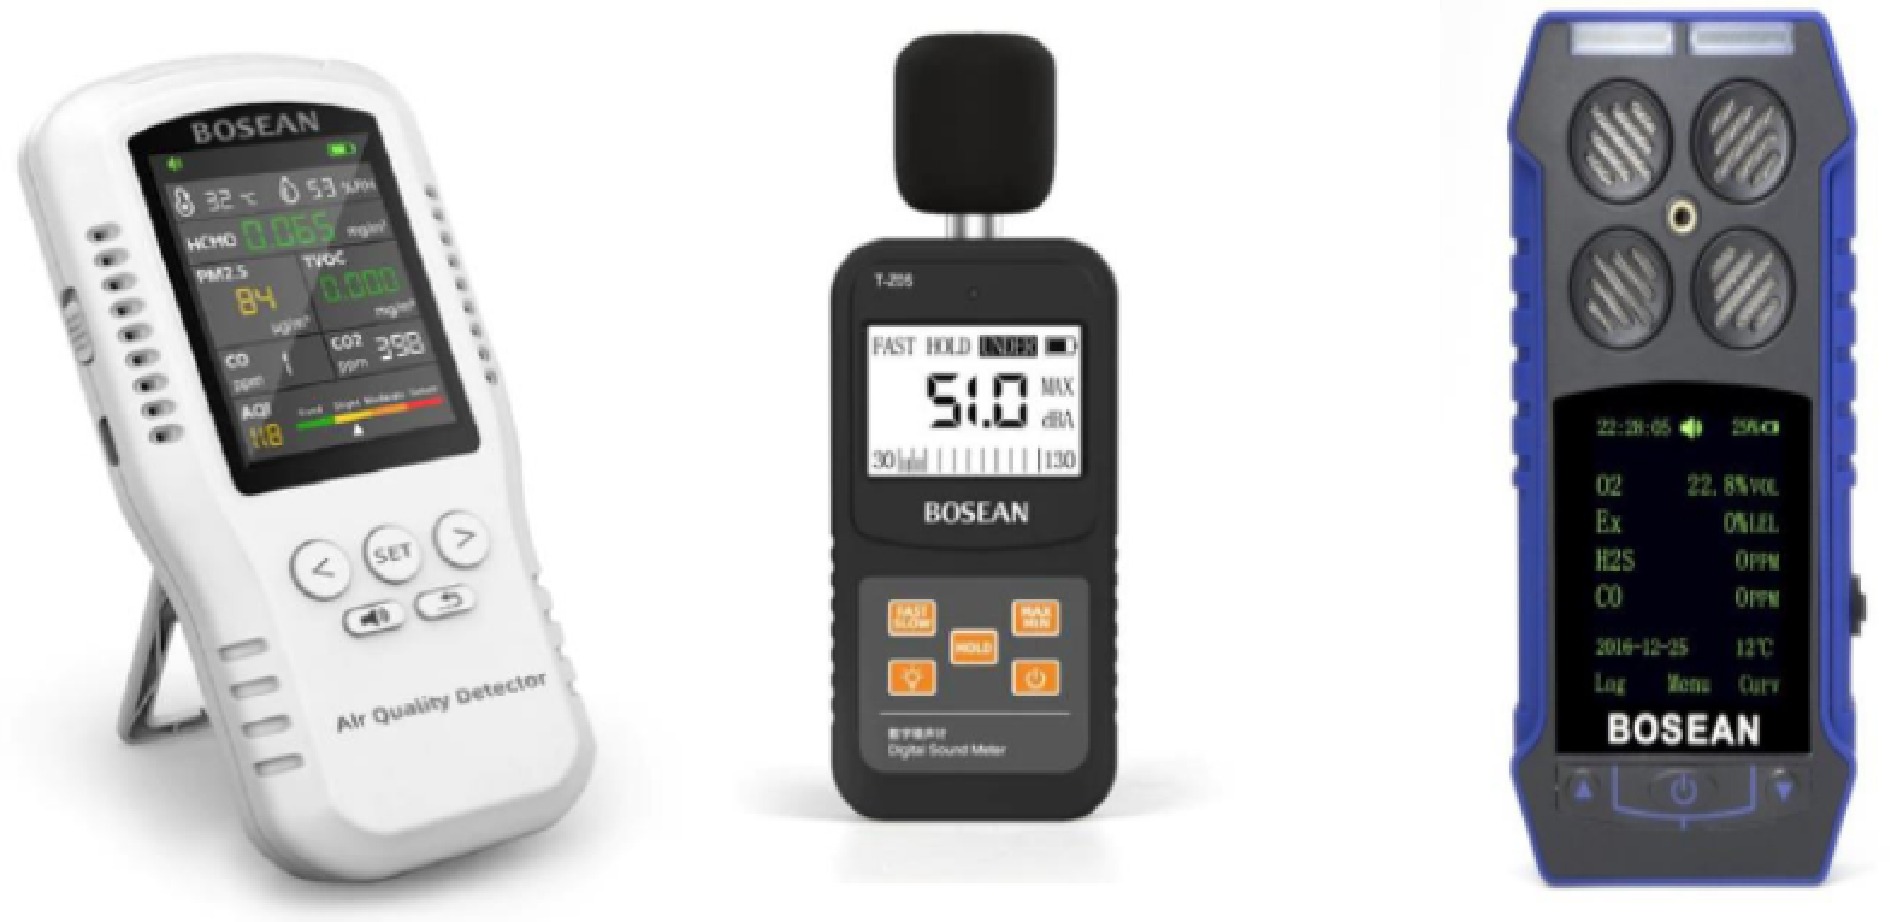
Figure 2.
Airborne particulate (left), noise level monitor counter (middle), and multigas monitor (right).
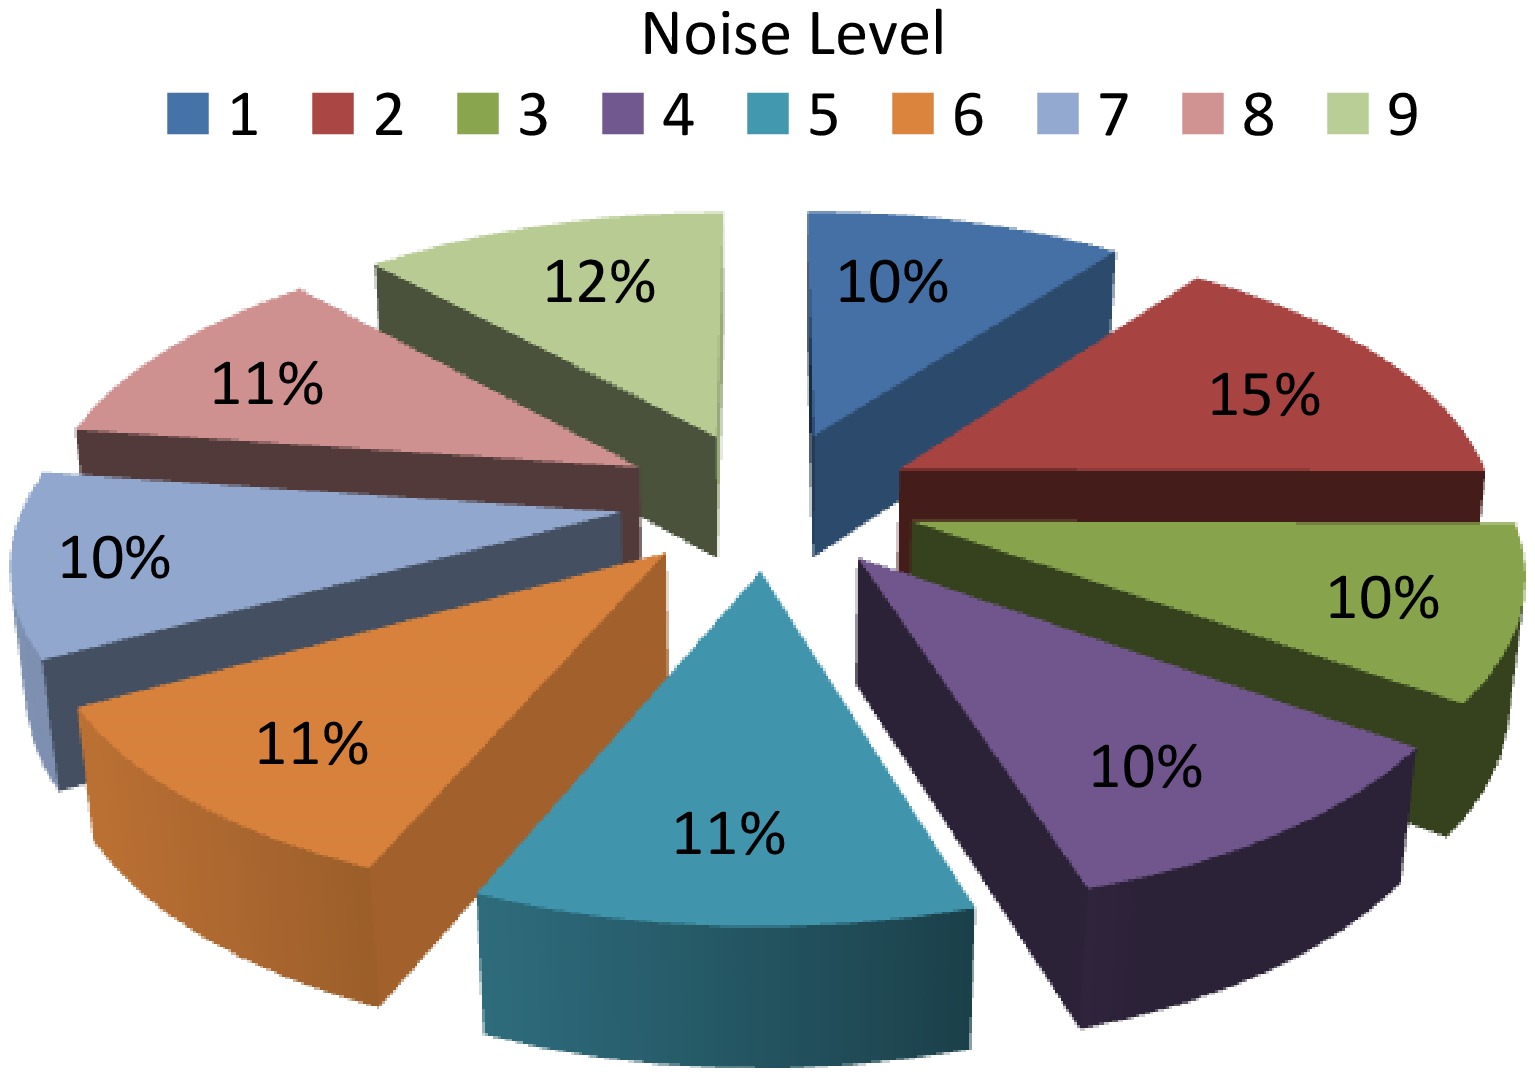
Figure 3.
Outcome of noise level scrutiny.
Techniques
-
A pilot origin categorization and separation were carried out at the company and its environment in Lagos metropolis of Nigeria from July 2021 to October 2022 for gathering data on water attributes as well as composition, generation level, and compliance rate of waste management. Techniques used for measurement with its water attributes physiognomies are presented in Table 1, while most of the techniques and health effects of contagions are highlighted in Table 2.
Table 1. Measurement techniques with water attributes physiognomies.
Parameters Units Acronyms Techniques and instruments Total suspended particles TSP Temptop PMD 351Handheld air borne aerosoil meter
(HPPC6+) sum efficiency –50.0% @0.30 μm.Temperature, dew point, relative humidity and
wind speedT (°C), DP
RH and WSKestrel 5500 weather meter was utilized for the measurements Heavy metals Manganese, lead, copper, nickel, cadmium, cobalt, zinc Mg, Pb, Cu, Ni, Cd, Co, Zn APHA 3111B, UNICAM 969 AAS Microbiology (cfu/mi) Coliform, E. coli, Staphylococcu,Vibrio, total coliforms,
Aerobic plant count, yeast & mouldAPHA 9215C Anions Nitrate, nitrite mg/L NO 3 −, NO 2 − APHA 4500, UN spectrophotometer Sulphate, phosphate mg/L SO 4, PO 4 3− APHA 4500B, UN spectrophotometer Calcium mg/L Ca APHA 4500A, UN spectrophotometer Physico-chemical Hydrogen ion concentration pH pH meter/ in situ Colour Pt.Co APHA 2120A Dissolved oxygen mg/L APHA 5220A, DO meter Conductivity μs/cm Cond APHA 2510A, multi- parameter Chloride mg/L Cl − APHA 4500 B, titration Total dissolve solids mg/L TDS APHA 2540A, gravimetric Total suspended solids mg/L TSS APHA 2540D Appearance APHA 2110 Acidity mg/L APHA 2310B Ammonial nitrogen mg/L NH3C APHA 4500 Turbidity mg/L Turb APHA 2130B, turbidity meter Bacterial oxygen demand mg/L BOD APHA 5210B, Incubator/winkler Chemical oxygen demand mg/L COD APHA 5220D, K2C-207 reflux Alkalinity mg/L Alk APHA 5220D, K2C-207 reflux Detergent mg/L APHA 5540C Oil and grease mg/L APHA 5520B Table 2. Scrutiny techniques and some health impacts of contagions.
Parameters Instrument Techniques Above Permissible Limit Health Impact Sulphur IV oxide (SO 2) SO 2 Gas alert test meter Direct reading Causes irritation of the respiratory tract Particulate matter (PM) Gas alert test meter Gravimetric Causes catarrh, cough, lung infections and other respiratory diseases Combustible gas (CHN) Gas alert test meter Direct reading Induces a despondent and depressed state Carbon monoxide (CO) CO test meter Direct reading Lessens the oxygen-carrying blood capability to damage of the central nervous system Oxides of nitrogen (NO X) NOx test meter Direct reading Causes inflammation of the lungs but less toxic Noise Noise meter, Rion sound level
meter NA modelDirect reading Air emissions
-
Air emissions associated with the operations of the study zones are gaseous emissions and particulate matter. The sampling frequency was quarterly, during the dry and rainy seasons. Measurements were carried out during the day, which is the busiest period and night. The sources of particulate emissions include the general depot operations, loading and offloading activities, and truck movements while sources of gaseous emissions within zones include working losses, fugitive losses, and generator operations, as well as operations of trucks. Therefore, Suspended Particulate Matter (SPM), Volatile Organic Compounds (VOCs), Carbon monoxide (CO), Sulphur dioxide (SO 2), Hydrogen Sulphide (H 2S), Oxides of Nitrogen (NOx), in the ambient environment were measured during the study. The in-situ ambient air quality measurements were carried out in line with the regulatory requirements to ascertain outdoor air conditions of the facility's environment.
Particulate, gaseous emissions, and environmental condition level measurements
-
Airborne particulates were collected from several sampling locations using a Bosean airborne particulate counter. The dust monitor was zeroed and set at the run mode 15 s. This is to directly measure the exact concentration of the airborne particulates in 1 L of air. The concentrations of the airborne particulates were then read off the screen of the monitor. Sampling and measurement for temperature and humidity were carried out using the same Bosean equipment ( Fig. 2). Noise level measurement was carried out using the Bosean noise level monitor capable of measuring wind speed and wind flow, equipped with a back-lit LCD dual display and a variety of choice of readings in kM/hour, knots, or meters/second. These instruments are powered by a battery cell and are hand held.
-
Inhalation of air with extreme concentrations of NO 2may irritate airways in the human respiratory system, and within a short time exacerbate respiratory sicknesses, for instance asthma, with signs such as difficulty in breathing, coughing, or wheezing [ 11, 27] . While longer exposures to huge quantities of NO 2 might increase vulnerability to respiratory infections [ 5, 22] . The result of sampling at Apapa for the presence and concentration of nitrogen (iv) oxide (NO 2) were less than 0.01 ppm thus within the NAAQS (FEPA 1991) stipulated limit of 0.113 ppm, while all CO and 30% of CO 2 measured were above specified limits ( Table 3). The most important oxides of sulphur are sulphur (iv) oxide (SO 2) and sulphur trioxide (SO 3), when SO 2softens inside water vapor in the atmosphere/sky to create acids as well as interrelate with other gas plus particles also to generate particles identified as sulphates, which in turn have unsympathetic impacts on human health and the ecosystem. The impacts of sulphur (iv) oxide (SO 2) are felt very swiftly, and most of the populace would experience the most awful signs within 10−15 min, after breathing it in. People with asthma or any similar health issue or health condition are at high risk of developing problems after exposure to sulphur (iv) oxide [ 1, 5] .
Table 3. Outcome of ambient air quality at Apapa Lagos.
Site/parameter PM10
(μg/m 3)PM25
(μg/m 3)CO
(ppm)NO 2
(ppm)H 2S
(ppm)CO 2
(ppm)VOC
(ppm)SO 2
(ppm)O 2
(%)Comb
(ppm)HM
(%)Temp
(°C)FMEnv limits 250 NS 0.03 0.313 0.008 425 8.53 0.01 NS NS NS NS 1 (Near gate) 10.9 5.2 < 0.10 < 0.01 < 0.1 417.1 0.014 < 0.01 21.1 < 0.01 62.3 35.1 2 (Generator) 8.1 4.3 < 0.10 < 0.01 < 0.1 398.2 0.013 < 0.01 20.8 < 0.01 61.1 33.9 3 (Sitting room) 5.3 2.1 < 0.10 < 0.01 < 0.1 401.9 0.019 < 0.01 20.9 < 0.01 60.9 29.0 4 (Water pump area) 12.1 6.9 < 0.10 < 0.01 < 0.1 692.8 0.357 < 0.01 21 < 0.01 63.2 34.1 5 (Laboratory zone) 9.2 6.3 < 0.10 < 0.01 < 0.1 460.1 0.162 < 0.01 21.1 < 0.01 67.2 31.9 6 (Tank Farm region) 10.8 7.9 < 0.10 < 0.01 < 0.1 397.9 0.000 < 0.01 21 < 0.01 68.9 32.0 7 (Water treatment) 8.9 4.1 < 0.10 < 0.01 < 0.1 468.2 0.194 < 0.01 21 < 0.01 69.0 31.8 8 (Water separator) 8.2 4 < 0.10 < 0.01 < 0.1 527.8 0.036 < 0.01 20.9 < 0.01 68.4 33.2 9 (Loading zone) 9.3 2 < 0.10 <0.01 < 0.1 575.4 0.194 < 0.01 20.8 < 0.01 61.9 35.3 10 (Jetty region) 7.2 3 < 0.10 < 0.01 < 0.1 397.9 0.056 < 0.01 21.0 < 0.1 65.3 35.0 Within limits (%) 100 0 100 100 70 100 100 − − − − Not within limits (%) 0 100 0 0 30 0 0 − − − − NS, Not Seen; −, NIL. Measurement for the presence of SO 2 at all sampled locations was less than 0.01 ppm which is less than the NAAQS (FEPA 1991) statutory limit of 0.3 ppm. The presence and amount of carbon monoxide (CO) and CO 2 in the environment might be allied from sources such as; reprehensively vented appliances with hydrocarbon fuel sources, outdoor vehicular hydrocarbon emissions, boilers, heating systems, or other industrial sources [ 4, 18] . CO might thus louden or accumulate within buildings where there is derisory aeration. Measurement for the presence of CO at all sampled locations were less than 0.1 ppm which is greater than the NAAQS (FEPA 1991) statutory limit of 0.03 ppm.
Hydrogen sulphide and suspended particulate matter (SPM)
-
Hydrogen sulphide is a colorless, monochrome, combustible, tremendously hazardous gas with a 'putrid egg' scent. It can be created by the cessation of animal/or human waste, for instance, sewage as well as organic matter. When exposed to small quantities it triggers eyes irritation, upper respiratory system issues, and its effects can be delayed. At moderate concentrations it causes more irritation of the eyes and respiratory effects, headache, dizziness, coughing, and vomiting. In contrast, at higher concentrations it causes shock, convulsion, coma, and potentially death. People with asthma may be at greater risk as a result of difficulty in breathing. Detection of hydrogen sulphide at all sampling points was less than 0.1 ppm. Particulates are tiny solid or liquid particles suspended in air. Particulates such as dust, smoke, diesel soot, and products resulting from burning can be emitted directly into the air. It might also be created via photochemical reactions, like polluting gases (nitrogen plus sulphur oxides). Particulates may have short as well as long-term effects on human health and the environment [ 5, 7, 22, 27] . These effects range from eye and throat irritation to chronic respiratory diseases to cancer. Fine particulates which are microscopic and less than 10 microns (PM10) are of greatest concern because of their ability to bypass the body's natural filtering system, thus posing a threat to the respiratory system. The concentration of particulate matter (PM10) at all the sampled locations ranged from 5 μg/m 3 at the Reception and Pump house to 12 μg/m 3 at the Water booster pump which is within the NAAQS (FEPA 1991) permissible limit of 250 μg/m 3. Particulate matter (dust) is generated from general cleaning operations and movement of tanker trucks. Although the particulate levels measured show they are within permissible limits, however, depending on the duration of exposure, particulate emissions can impact negatively on workers' health and exacerbate existing health conditions, e.g. asthma.
Noise scrutiny outcome
-
Noise is mostly sound that is anti-information intensity, which usually fluctuates erratically with time. Noise is the term frequently used to describe unwanted sound, which impedes with the sensitivity of wanted sound and is likely to be physiologically damaging. Environmental noise is the accretion of all noise available in a precise environment. Exposure to noise is correlated with numerous pessimistic health outcomes, based on the level of exposure, and extent [ 3, 8] . Noise might prop up cardiovascular sicknesses, hearing loss, sleep turbulence, high blood pressure, as well as birth defects. The ambient noise levels within the facility were measured in some selected locations with the use of a Mastech multi-environment survey meter as shown in Tables 4 & 5 and Fig. 3. The highest noise value recorded was 89.9d BA at site 2 (Generator house) while the lowest was 57.2 dBA at the Pump house. The noise level at the four sampled site locations was found to be above the WHO 2007 and FMEnv regulatory limit. High noise levels could be harmful to employees' hearing ability if exposed for prolonged periods without adequate hearing protection. Exposure to high noise levels is implicated in increased stress levels and high blood pressure, insomnia, partial hearing loss etc. Noise levels were measured at a range no more than 3 m from the source [ 2, 26] .
Table 4. Guideline limits.
WHO limits 2007 Biern et al. 2015 Receptor Noise level (dBA) Environ Health effect Noise level (dBA) Day
(7.00 am−22.00 pm)Night
(22.00 pm−7.00 am)Built-up, institutional, and education 55 45 Indoors bedroom Speech intelligibility, and moderate annoyance (daytime) 35 Business, shopping, marketable, indoors, outdoors and traffic region 70 70 Sleep fracas (Nocturnal) 30 Outside bedrooms Sleep fracas window open 45 Outdoor, living room Serious annoyance (night time) 55 Moderate annoyance
(day/evening time)50 Table 5. Outcome of ambient noise in Apapa Lagos during the day time.
Site GPS coordinate Noise level (dBA) Limit remarks 1 (Near gate) N 6°26'23.27649",
E 3°20'1.36792"61.42 Not 2 (Generator) N 6°26'20.63513",
E 3°20ʼ0.899"89.88 Not 3 (Sitting room) N 6°26'19.01821",
E 3°20'1.1585"59.48 Not 4 (Water pump area) N 6°26'18.85029",
E 3°20'1.72881"61.79 Within 5 (Laboratory zone) N 6°26'17.65008",
E 3°20'0.24541"67.12 Within 6 (Tank farm region) N 6°26'18.24981",
E 3°19'57.87729"63.42 Within 7 (Water treatment) N 6°26'16.64496",
E 3°19'57.845"62.79 Within 8 (Water separator) N 6°26'16.93323",
E 3°20'0.22097"66.4 Within 9 (Loading zone) N 6°26'17.69233",
E 3°20'0.54988"70.39 Not World Bank %: Within – 44.4%; % Not within – 55.6%. Outcome of effluent and hazardous materials
-
The analysis of effluent samples from the Oil Water Separator (OWS) showed that parameters such as Oil and Grease (0.04 mg/L), Total Dissolved Solids (78.0 mg/L) and Total Suspended Solids (0.11 mg/L) were found to be within their stipulated regulated limits. However, parameters such as COD (48.2, 47.9, and 48.1 mg/L), BOD 5 (11.4, 11.2, and 11.1 mg/L), ammonia (0.24, 0.23, and 0.23 mg/L), turbidity (22.1, 22.3, and 22.4 mg/L) and manganese (0.52, 0.51, and 0.53 mg/L) were above their prescribed limits as stated in Guidelines for Noise, Industrial Effluent, and Gaseous Emissions Limitations (FEPA 1991). The pH of 6.8 indicates that the sample is slightly acidic and also within the stipulated regulatory limit of 6.5−8.5 ( Tables 6− 8 ). Microbial analysis was also carried out on the raw water sample and the result for Salmonella was negative. Wastewater (effluent) from the region encompasses depot operations which arise from a mixture of minor spills and water as well as wastewater from the laboratory, kitchen, equipment maintenance etc. and can impact negatively on the environment if discharged directly into public drains without treatment. The contagions in such wastewater might encompass soluble macrobiotic chemicals creating exhaustion of heavy metals, DO, suspended solids plus volatile materials, hydrocarbons, bases, or acids (displayed as small or high pH). Though some depot's installed OWS works to skim out the oil from the water and ensure it is tested and treated before discharge. Hazardous materials within the study zone involve the storage of bulk quantities of petroleum products and in smaller quantities, chemicals such as foam, caustic, solvents, lubricants, etc. Hazardous materials carrying, storage, and management cause spills or other kinds of release with potentially negative effects on water, atmosphere, and soil resources. Besides, their combustibility and other impending hazardous physiognomies likewise present a threat of fire and blasts. Used/spent oil at some depots within the study zone is derived basically from maintenance operations of equipment and generators. The improper collection and disposal of used/spent oil will adversely impact the environment. Spilled oils on the floor can also cause slips and falls resulting in injuries if not properly cleaned and floors kept dry at all times.
Table 6. Outcome of effluent from oil water separator.
Variables Unit Sites Limits Compliant status (%) 1 2 3 EGASPIN 2018 FEPA 1991 Compliant Non-within Calcium mg/L 26.7 26.8 26.5 NS NS 100 0 Sulphate mg/L 15.7 15.6 15.8 NS 100 − − Dissolved oxygen mg/L 4.88 4.90 4.87 NS NS − − COD mg/L 48.2 47.9 48.1 NS 40 0 100 BOD mg/L 11.4 11.2 11.1 NS 10 0 100 Ammonia mg/L 0.24 0.23 0.23 NS 0.2 0 100 Total hardness mg/L 66.3 66.1 66.4 NS 200 100 0 Total nitrogen mg/L 0.53 0.54 0.53 NS 10 100 0 Total suspended solida mg/L 0.12 0.14 0.10 30 10 100 0 Total suspended matter mg/L 124.9 124.8 125.1 NS NS − − Conductivity μS/cm 155.9 156.1 156.0 NS 1,000 100 0 Total dissolved solids 78.2 78.0 79.8 < 2,000 500 100 0 Turbidity NTU 22.1 22.3 22.4 10 5 0 100 True colour/ Lovibond Hz 0.17 0.15 0.16 NS 7 100 0 pH 6.7 6.8 6.9 6.5−8.5 6.5−8.5 100 0 Temperature °C 24.8 24.9 25.1 Ambient ± 2 < 40 100 0 Total alkalinity mg/L 51.8 51.9 52.0 NS NS − − Total phosphorus mg/L 0.34 0.32 0.33 NS NS − − Salinity % 0.00 0.01 0.00 NS NS − − Sodium mg/L 5.82 5.84 5.83 NS NS − − Nitrate mg/L <0.01 <0.01 <0.01 NS NS − Hydroxide alkalinity mg/L 0.01 0.02 0.00 NS NS − Carbonate alkalinity mg/L 0.01 0.02 0.00 NS NS − Magnesium mg/L 9.67 9.68 9.69 NS NS − Manganese mg/L 0.52 0.51 0.53 NS 0.05 0 100 Chloride mg/L 14.7 14.8 14.9 NS 250 100 0 Silica (SiO 2) mg/L 1.12 1.13 1.11 NS NS − Acidity mg/L 1.12 1.13 1.11 NS NS − Nitrite mg/L 0.32 0.33 0.31 NS NS − Total iron mg/L 1.14 0.12 1.13 1.0 1.0 0 100 Total oil and grease mg/L 0.03 0.04 0.03 NS 10 100 0 Detergent mg/L ND ND ND NS NS − ND, Not Detected; NS, Not Seen; −, NIL. Table 7. Outcome of effluent (microbiological and others) from oil water separator.
Variables Unit Sites Limits Compliant status (%) 1 2 3 EGASPIN 2018 FEPA 1991 Compliant Non-within Salmonella in 25 mL Absent Absent Absent NS NS − − Shigella in 25 mL Present Present Present NS NS − − E. coli CFU/mL 7.1 7.0 7.1 NS NS − − Yeast and mould CFU/mL 27.9 28.0 28.1 NS NS − − Staphylococcus CFU/mL 9.2 9.0 9.1 NS NS − − Vibrio CFU/mL 12.0 12.2 12.1 NS NS − − Total coliforms CFU/mL 11.2 11.1 11.0 NS NS − − Aerobic plant count CFU/mL 9 8.9 9.0 NS NS − − Others BTEX mg/L < 0.001 < 0.001 < 0.001 NS NS − − PAH mg/L < 0.001 < 0.001 < 0.001 10 NS 100 0 Odour Objectionable NS NS Appearance Light brown with particles Colourless ND, Not Detected; NS, Not Seen; −, NIL. Table 8. Some contagions and effects.
Contagions Health impacts Short term Long term Ethylbenzene Dizziness, eye and throat irritation Blood disorders Benzene Skin blister and irritation, upper respiratory tract Developmental and reproductive disorders n-Hexane Headache, giddiness and nausea Blurred vision, fatigue, extremities and headaches Toluene Sleep difficulty, dizziness, skin and eyes irritation Birth defects Xylenes Nose, gastric and throat irritation, neurological, vomiting and nausea Nervous system disorders Outcome of water Attribute analysis
-
The outcomes of physicochemical variables obtained from groundwater within the project region ( Tables 9− 11 and Figs 4 & 5a− h) indicated that the conductivity (1094.0, 1695.0, and 1695.1 mg/L), calcium (109.1, 108.9, and 109.2 mg/L), ammonia (0.48, 0.47, and 0.49 mg/L), DO (2.07, 2.06, and 2.07 mg/L) and total dissolved solid (847.2, 847.4, and 847.3 mg/L) values were high, indicating freshwater aquifer. The turbidity values (1.00−1.13 NTU) reveal that all the sampled boreholes was well within the standard for hygienic water criteon of 5 NTU. The pH values measuring neutral were because of the bicarbonate quantity with values within 30.0−500.0 mg/L CaCO 3 WHO limit. The carbonate alkalinity perceived in the sampling was very low. TD values of the groundwater samplings vary between 51.8 mg/L CaCO 3 as well as 48.6 mg/L CaCO 3. Discrepancy between the TD values for the boreholes was low, signifying recharge from the equivalent origin. Hardness in water encompasses calcium plus magnesium as the key constituents. For instance, magnesium ions quantified in the groundwater varied from 39.7−39.8 mg/L respectively, small phosphate, chloride, and sulphate amounts were seen in groundwater samplings compared to the WHO limits. Likewise, small anions quantities substantiate the airiness of groundwater from the research site. Sulphide and nitrate ions were not perceived in the groundwater sampling. Oil and grease (O&G) were not detected within the facility area, two of the sample points were below the instrument detection limits. Total hydrocarbon was not detected in the ground water samplings of the project influence zone. The origin can, however, be ascribed to biogenic instead of anthropogenic involvement since petroleum hydrocarbon correlated deeds were not seen in the region at the period of this research. Heavy metals ascertained in the samplings displayed varied quantities with Cd having values of 0.02 mg/L in one of the points and not detected in the two other BH water samples. The concentration span of other metals is in the order of Cu < Pb < Zn < Ni < Mn < Fe. Zinc as well as copper displayed concentrations beneath their maximum tolerable limits in hygienic water, whereas Pb, Cr, Ni, Fe, Cd, Hg plus Mn were available at extreme concentrations than intervention and target WHO criterion level. The happening and concentrations of these metals in the samplings imitate the general physiognomies of groundwater systems in nearly all parts of Nigeria. The microbial characteristic of groundwater samplings from the research region is presented that the total coliform, fecal coliform fecal streptococci, and enterococci determined ranged from 1.9 × 10² to 2.0 × 10² CFU/100 mL, 0.5 × 10² to 1.2 × 10² CFU/100 mL, 0.29 × 10² to 0.82 × 10² CFU/100 mL, and 0.43 × 10² to 0.57 × 10² CFU/100 mL respectively, while no detection was recorded at GW2. Fungi are, however, not recorded in the sample, showing no growth. Fecal coliforms were not detected. For PAHs, it is branded that PAHs are comparatively intractable in soils, and some PAHs have been recognized as teratogens, carcinogens, or mutagens [ 4, 16] .
Table 9. Outcome of water attributes.
Variables Unit Sites Limits Compliant status (%) 1 2 3 FEPA WHO USEPA NIS EU Compliant Non-within pH 7.08 7.09 7.07 6.5−8.5 6.5−8.5 100 0 Conductivity μs/cm 1,694.9 1,695 1,695.1 1,000 − 1,000 1,000 2,500 0 100 Calcium mg/L 109.1 108.9 109.2 75 0 100 Phosphate mg/L 1.01 1.00 1 < 5.0 − − NS − 100 0 Ammonia mg/L 0.48 0.47 0.49 0.05 0 100 TSS mg/L 0.09 0.08 0.10 < 10 − − NS − 100 0 Temperature °C 25.4 25.5 25.3 Ambient 100 0 Turbidity NTU 0.01 0.02 0.01 5 5 5 5 − 100 0 Total acidity mg/L 61.4 61.3 61.4 NS − TDS mg/L 847.2 847.4 847.3 500 − 500 500 − 0 100 Total hardness mg/L 272.4 272.3 273.3 200 80−100 − 150 − 0 100 Total alkalinity mg/L 408.4 408.2 408.3 − − − 200 − 0 100 Total solids mg/L 1,039.9 1,040.2 1,040.3 NS − Magnesium mg/L 39.8 39.7 39.8 20 0 100 Sodium mg/L 10.7 10.8 10.6 200 Chloride mg/L 26.8 26.9 26.7 250 250 250 250 250 DO mg/L 2.07 2.06 2.07 2 Nitrite mg/L 0.13 0.14 0.12 0.2 Manganese mg/L 0.23 0.22 0.21 0.2 Total iron mg/L < 0.01 < 0.01 < 0.01 0.3 Sulphate mg/L 50.2 50.3 50.1 500 250 250 250 250 100 0 Silica mg/L 3.93 3.94 3.92 40 100 0 Salinity % 0.09 0.08 0.07 NS − Nitrate mg/L < 0.01 < 0.01 < 0.01 50 50 50 50 50 100 0 Total oil/grease mg/L 0.08 0.09 0.10 10 100 0 Colour TCU 0.17 0.16 0.18 15 100 0 Appearance Colourless Colourless Odour Objectionable Unobjectionable Taste Objectionable Unobjectionable ND, Not Detected; NS, Not Seen; −, NIL. Table 10. Outcome of water attributes (microbiological).
Variables Unit Sites Limits Compliant status (%) 1 2 3 FEPA WHO EU USEPA NIS Compliant Non-within Salmonella in 25 mL Absent Absent Absent NS − − − NS − − Shigella in 25 mL Absent Absent Absent − − − − NS − − E. coli CFU/mL 0.00 0.00 0.00 0 − − − 0 100 0 Yeast/mould CFU/mL 7 7.1 7 − − − − 0 100 0 Staphylococcu CFU/mL 0 0 0 NS − − − NS − − Vibrio CFU/mL 0 0 0 NS − − − NS − − Aerobic plate count CFU/mL 26 26.1 26.2 NS − − − 100 100 0 Nigerian Industrial Standards for Drinking Water (NIS 554:2015). NS, Not Seen; −, NIL. Table 11. Cluster scrutiny outcome.
Paramenter Initial Final C1 C2 C2 Cl 26.5 26.8 26.75 SO 2 15.8 15.6 15.65 DO 4.87 4.9 4.89 COD 48.1 47.9 48.05 BOD 11.1 11.2 11.3 AMMO 0.23 0.22 0.23 TH 66.4 66.1 66.2 Total Nitr 0.53 0.54 0.54 TSS 0.1 0.14 0.13 TSM 125.1 124.8 124.85 Cond 156 156.1 156 TDS 79.8 78 78.1 Tur 22.4 22.3 22.2 True Color 0.16 0.15 0.16 pH 6.9 6.8 6.75 T (°C) 25.1 24.9 24.85 TA 52 51.9 51.85 TPhos 0.33 0.32 0.33 Mg 9.69 9.68 9.68 Salinity 0 0.01 0.01 Na 5.83 5.84 5.83 HydrAlk 0 0.02 0.02 NO 2 0 0 0 Mn 0.53 0.51 0.52 Cl 14.9 14.8 14.75 SiO 2 1.13 1.11 1.12 CaCO 3 1.11 1.13 1.13 CarAlk 0.02 0 0.01 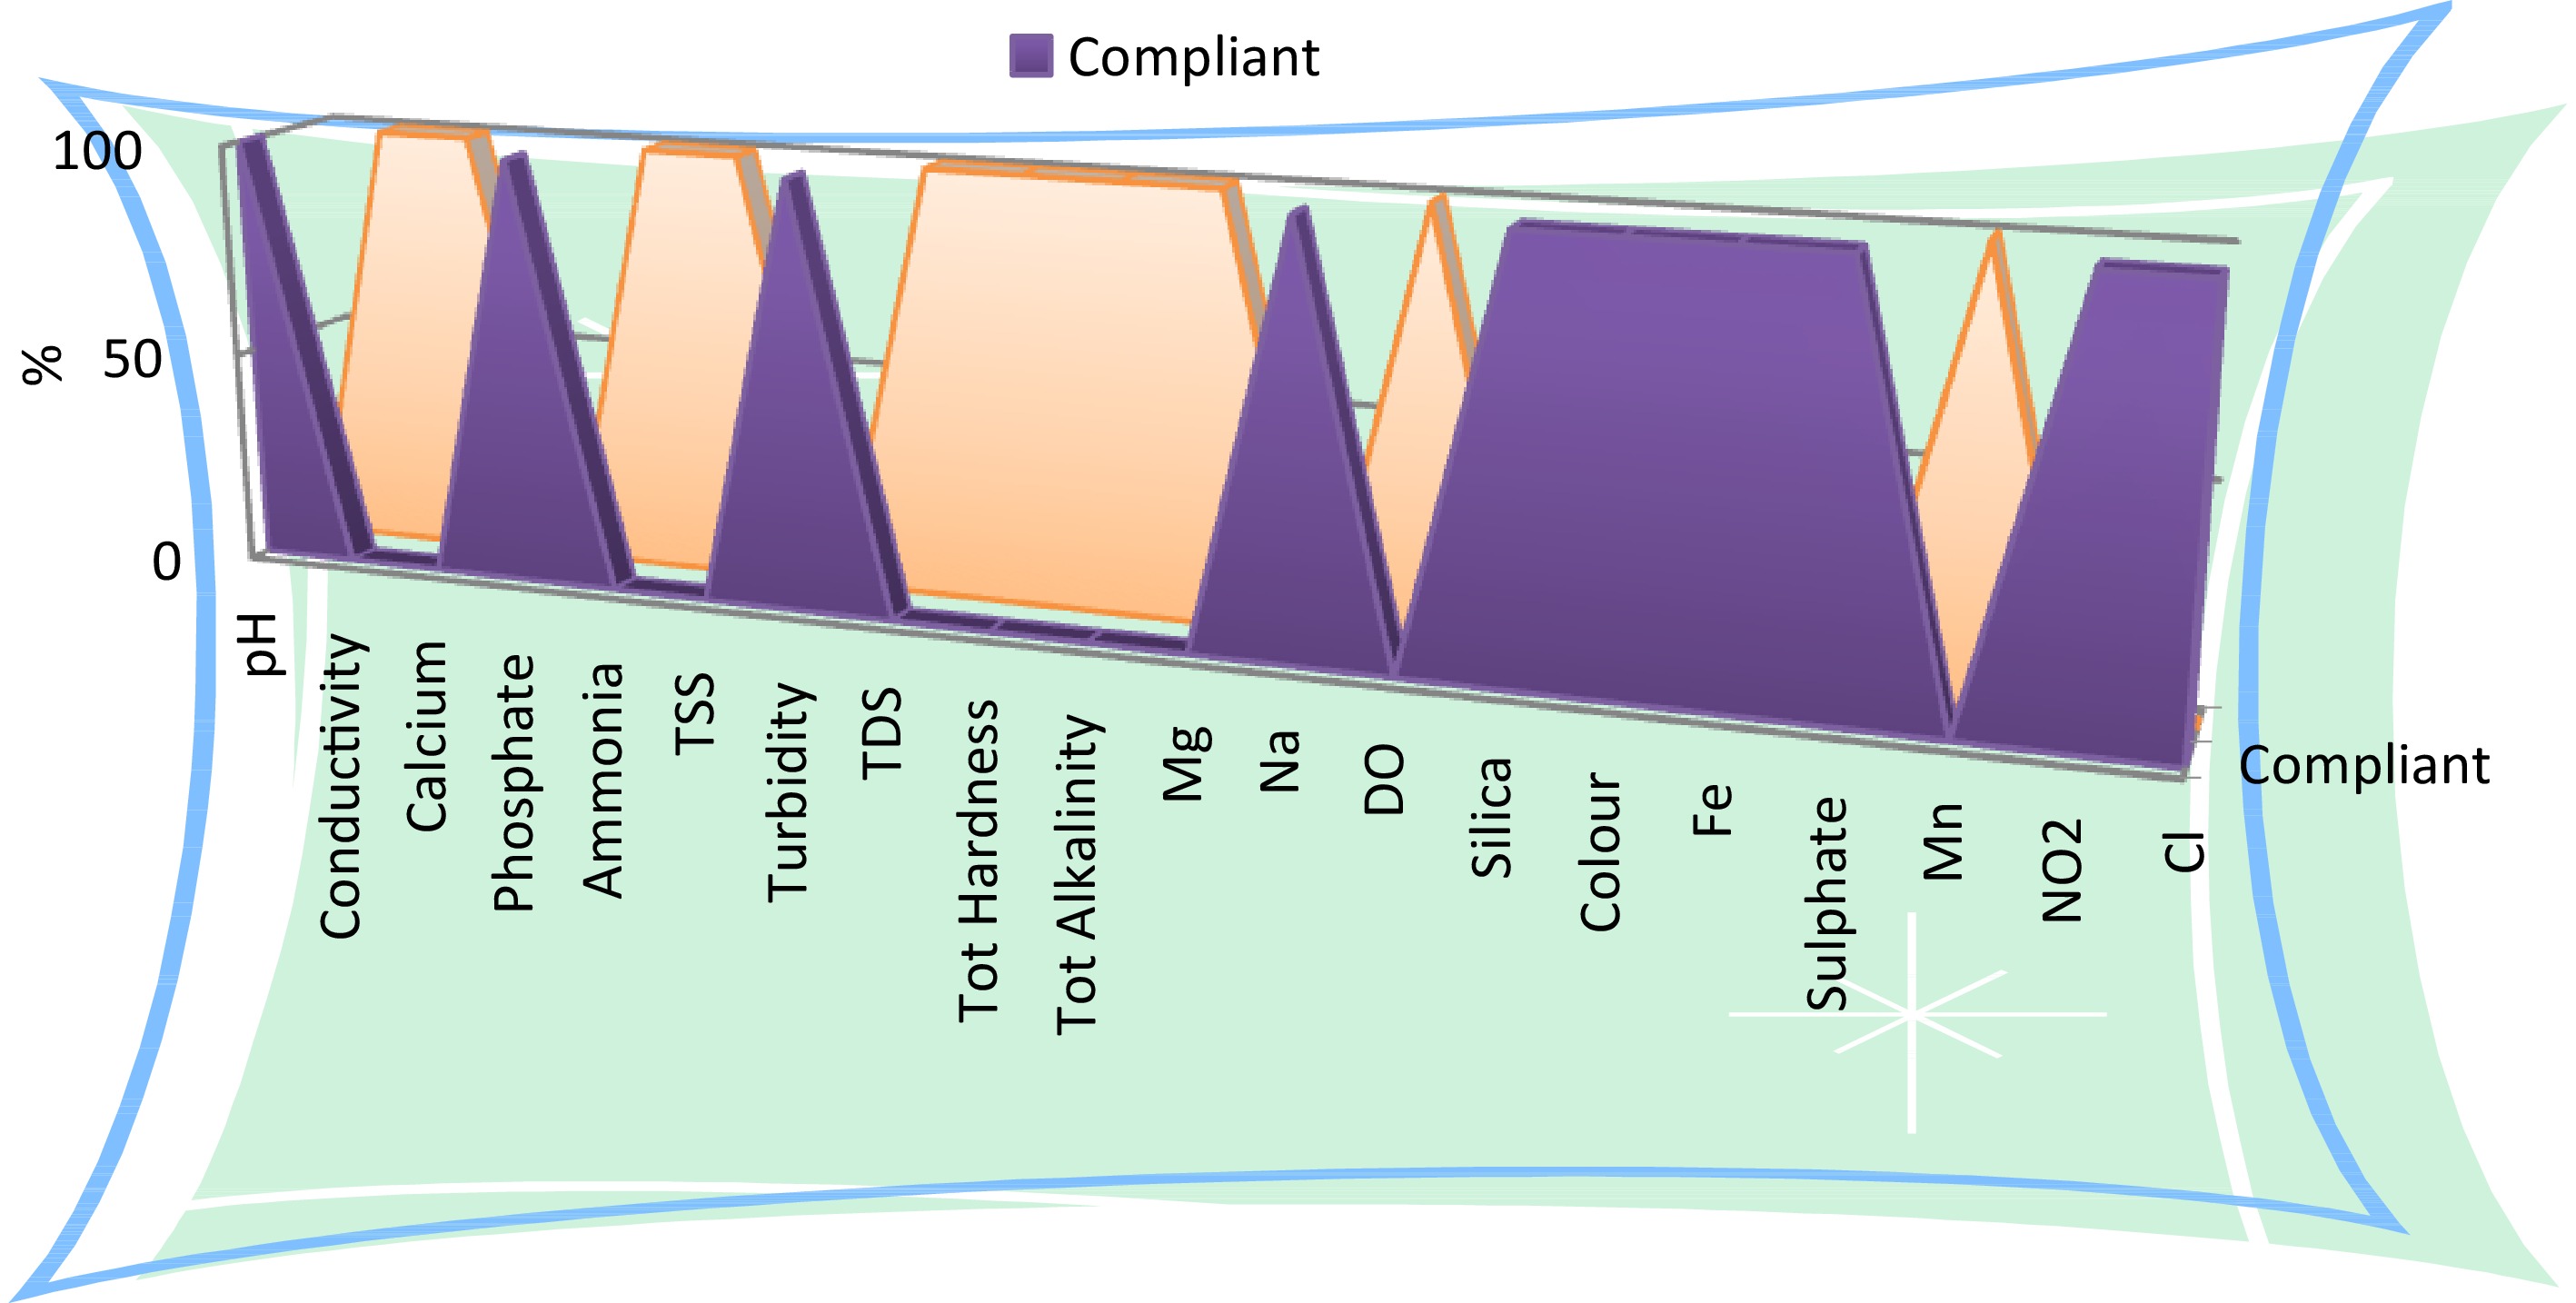
Figure 4.
Compliant and noncompliant levels of water attribute parameters.
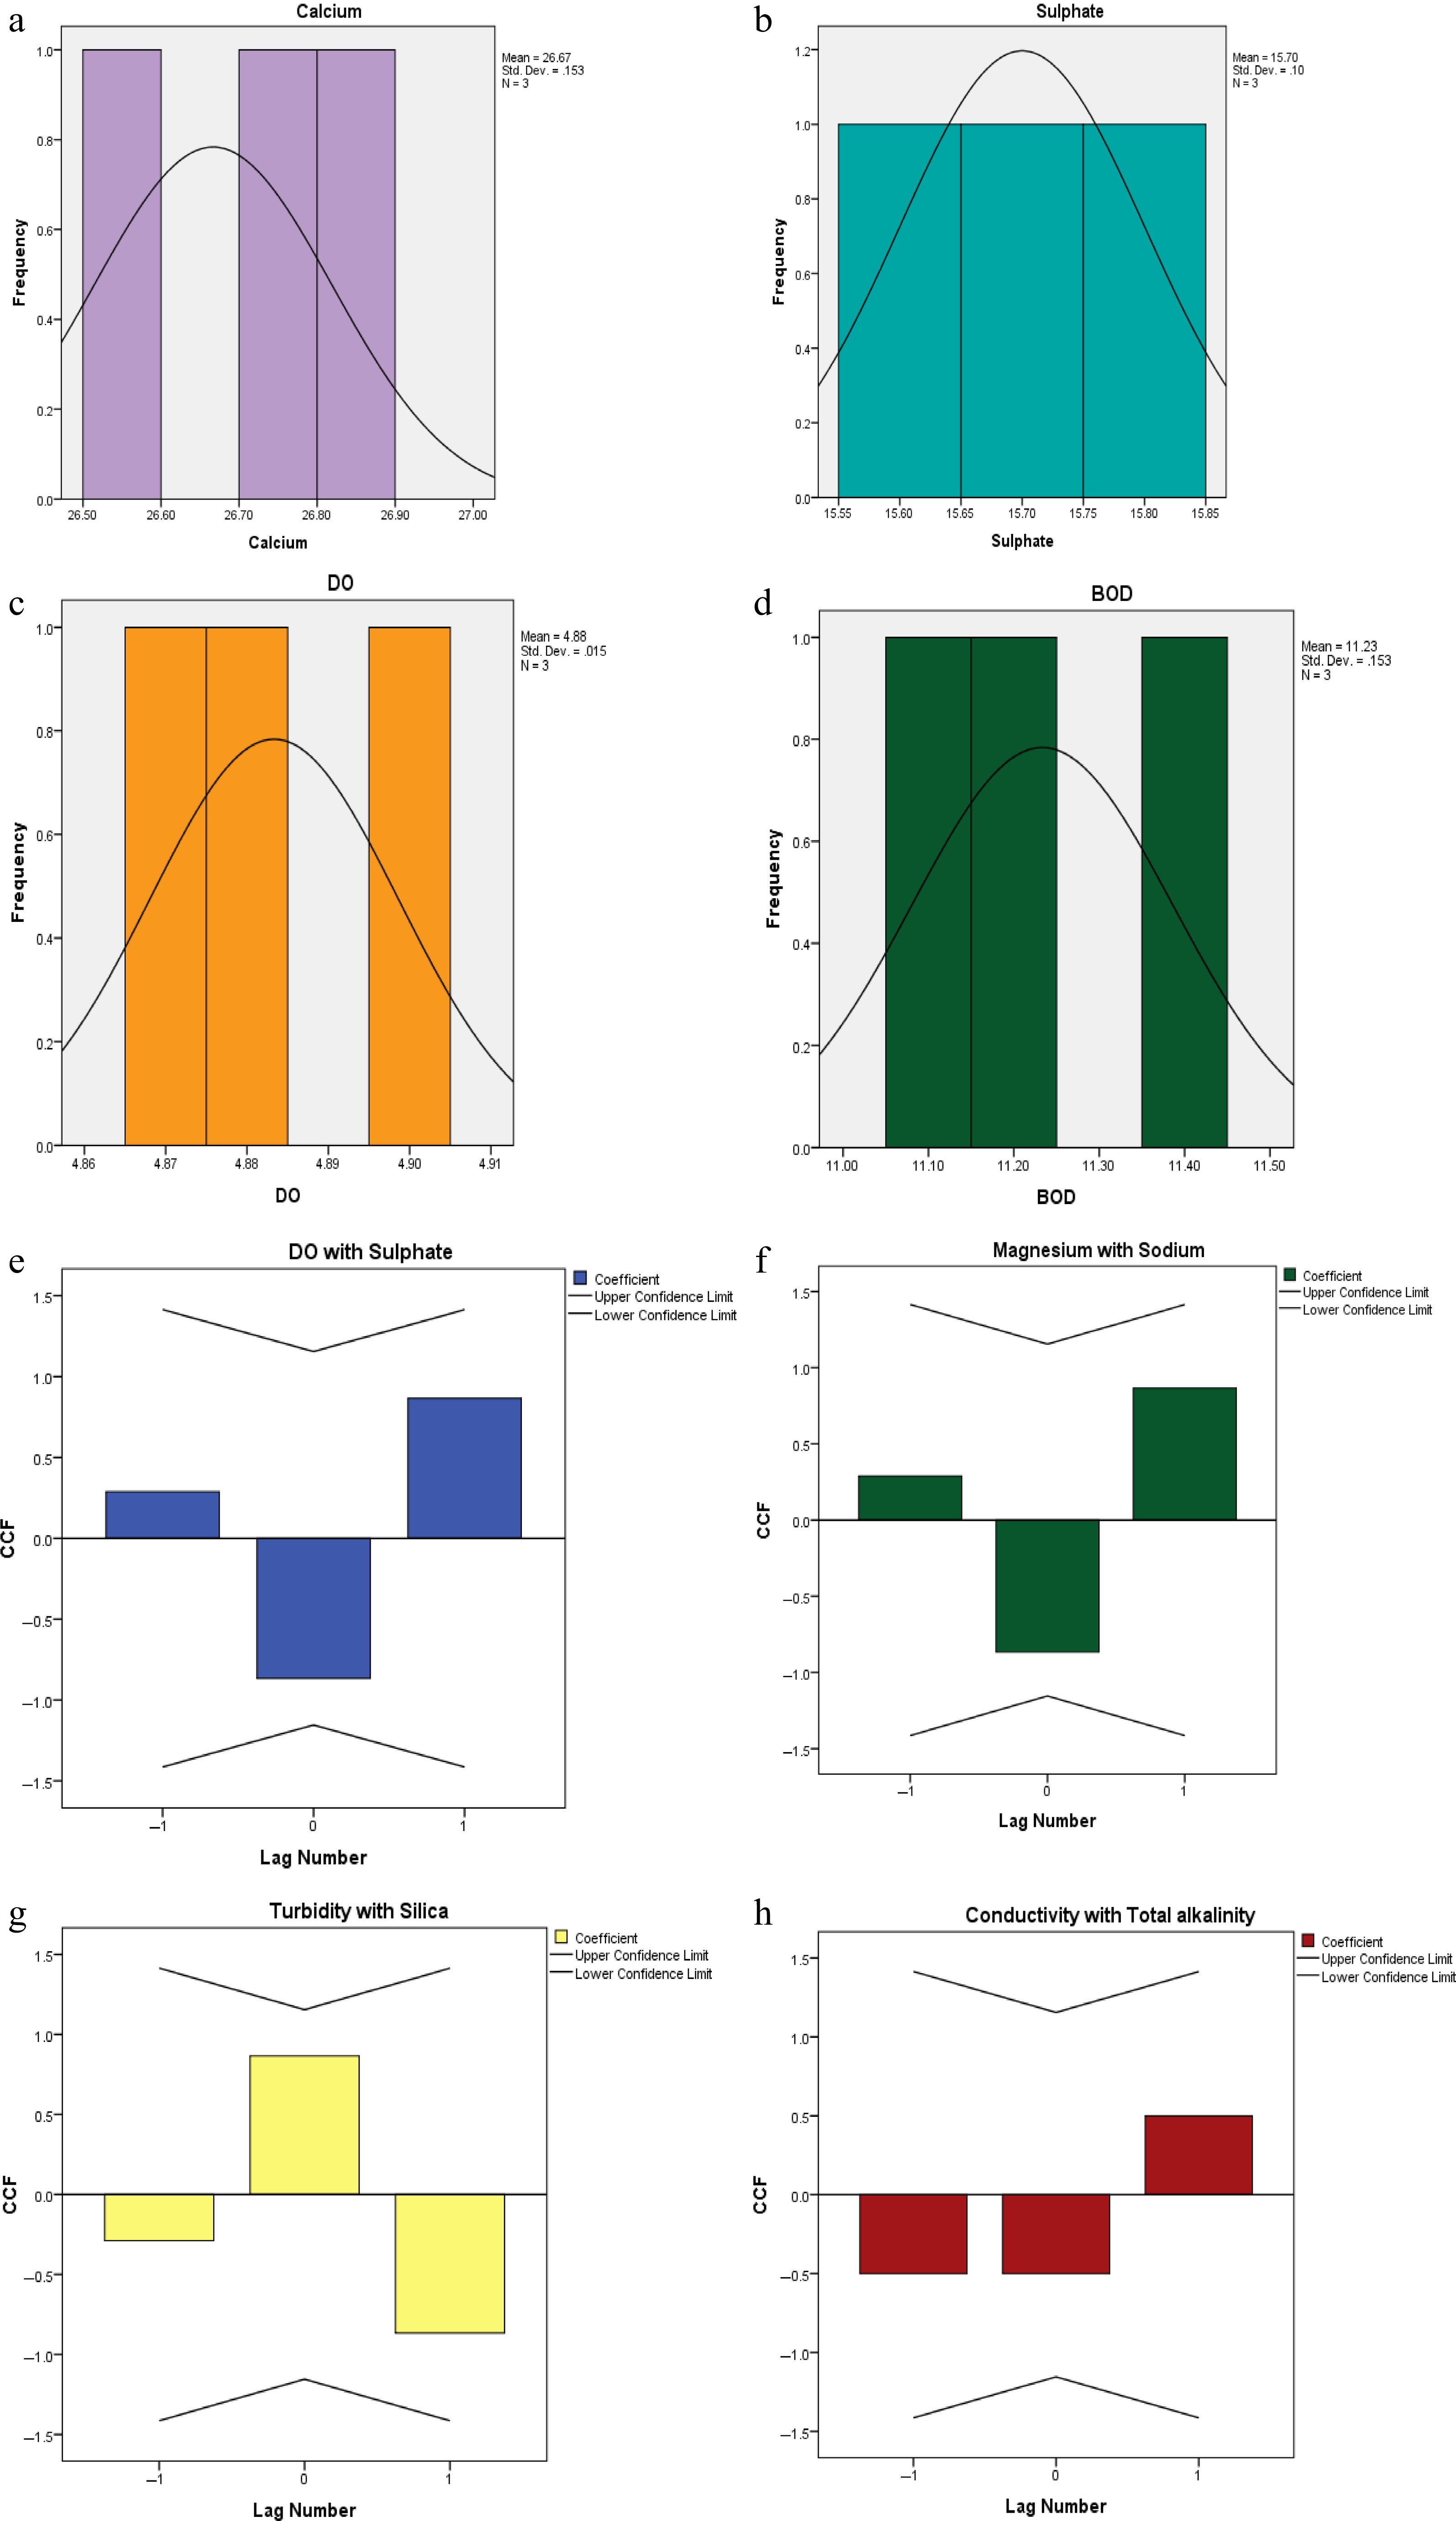
Figure 5.
Water attribute scrutiny outcome for some parameters.
Outcome of clustering scrutiny
-
Cluster analysis or clustering is the technique that groups unlabeled examples based on a similarity measure. It is the task of grouping a set of objects in such a way that objects in the same group (called a cluster) are more similar (in some specific sense defined by the analyst) to each other than to those in other groups (clusters). It is the main task of exploratory data analysis, and a common technique for statistical data analysis, used in many fields, including pattern recognition, image analysis, information retrieval, bioinformatics, data compression, computer graphics, and machine learning. Further scrutiny through algorithm cluster produces two steps with 28 inputs, cluster quality between 0.5−1.0 was classified as good and 0−0.5 as fair water ( Fig. 6a− c). Cluster A is heavily loaded with parameters like DO, conductivity, salinity, and ammonia, while Cluster B parameters are Turbidity, TDS, and TSS. Cluster quality displays that conductivity initial and final scrutiny was the highest (156 mg/L), followed by TSM with a value of 125.1 mg/L at initial and slightly reduced to 124.85 mg/L at final scrutiny. Most of these parameters are greatly influenced by the expulsion of produced effluent water that creates serious environmental threats to humans and the ecosystems. The use of technologies like highly proficient halophile oil-degrading microbes in genetic treatment must coalesced with membranes (SBR) genetic treatment systems for efficient management of generated water, since the Lagos (South-west Nigeria) crude oil is tart and contains heavy metals, the pipelines are creating serious problems via leaking, then causing substantial oil spills along the haulage line to the sea terminal at haven Nigeria necessitate appropriate monitoring plus maintenance. At the moment, most oil manufacturers re-inject created water or reclaim it for onshore wells at 98.0%. Conversely, 91.0% of created water from offshore wells is disposed of into the deep sea.
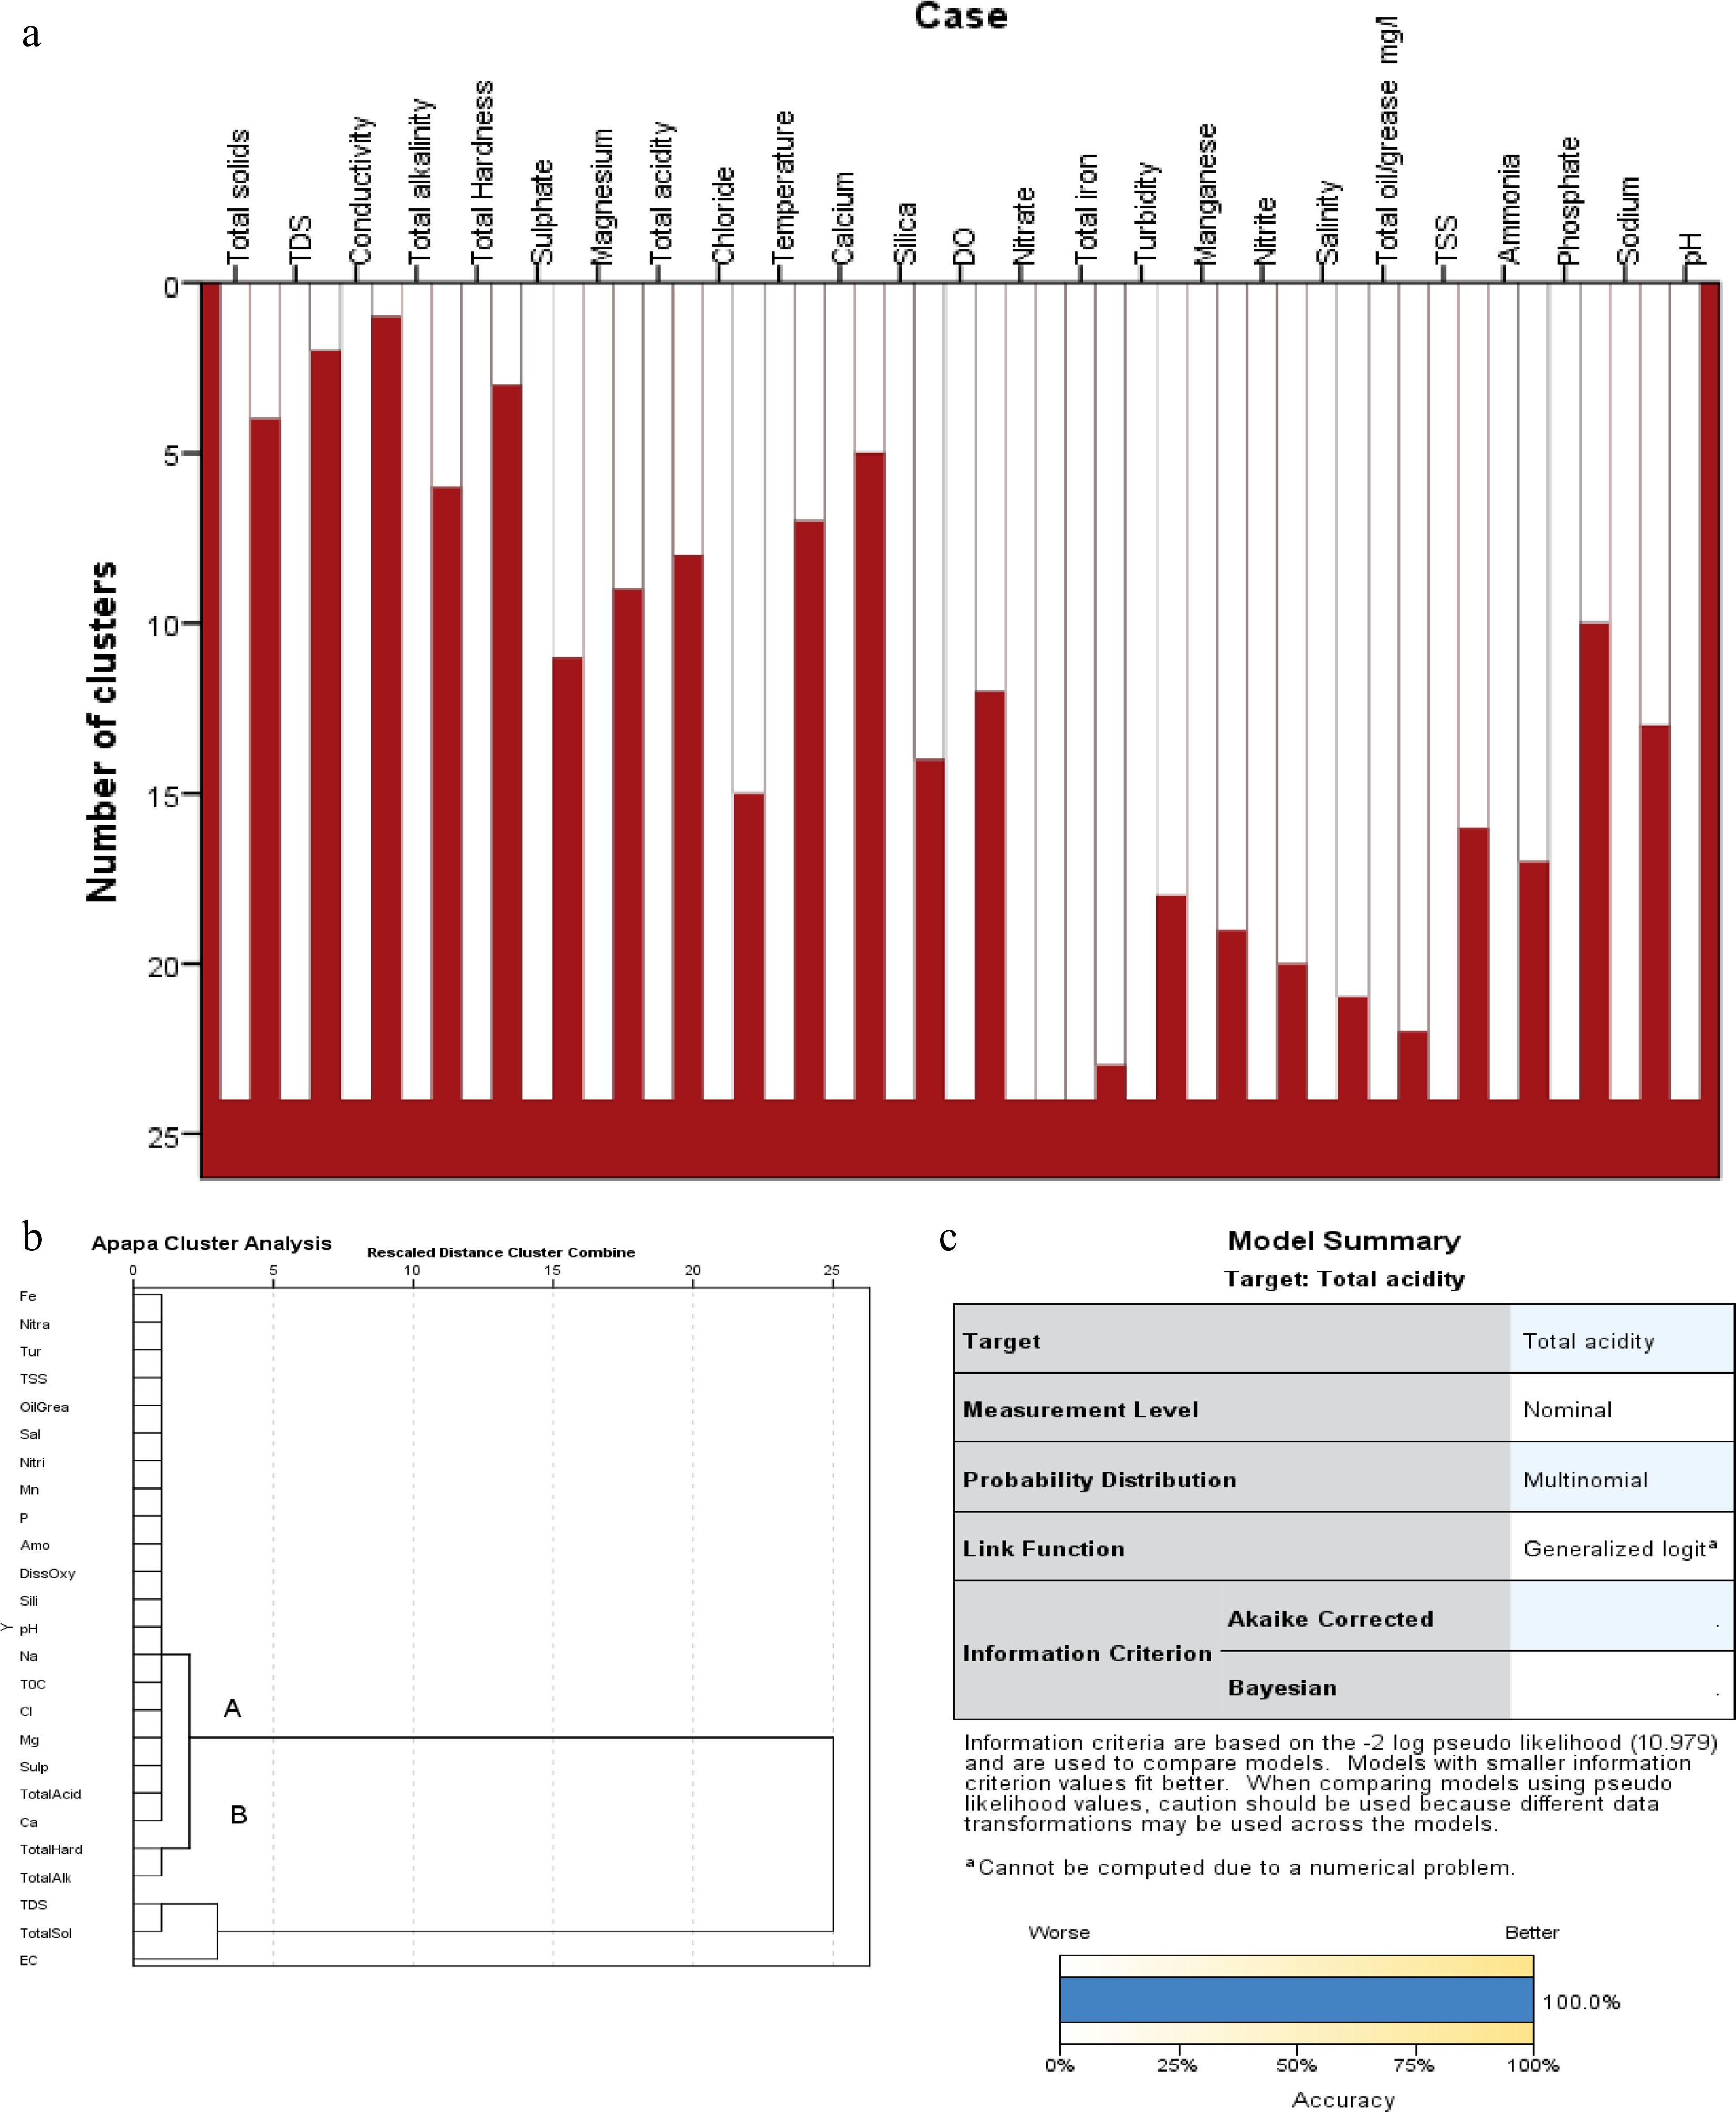
Figure 6.
Cluster investigation outcome of some parameters scrutinized.
Health and well-being in the Apapa communities
-
Table 11 and Fig. 7 display that the common health problems identified among the adult population were malaria (23%), upper respiratory infections (i.e., cough, catarrh, sore throats etc., 27%), typhoid (21%), dysentery/diarrhea (22%), and sores/injuries (7%). Among the children the most common health problems are malaria (27%), dysentery/diarrhoea (25%), worm infestation (6%), and typhoid (23%), while upper respiratory infections (cough, catarrh, sore throats, etc. accounted for 19%). Most of the diseases recorded are those that have been endemic in the communities since the inception of the communities apart from upper respiratory tract infection which is associated with mining activities, cement production, and heavy vehicular movement in the area.
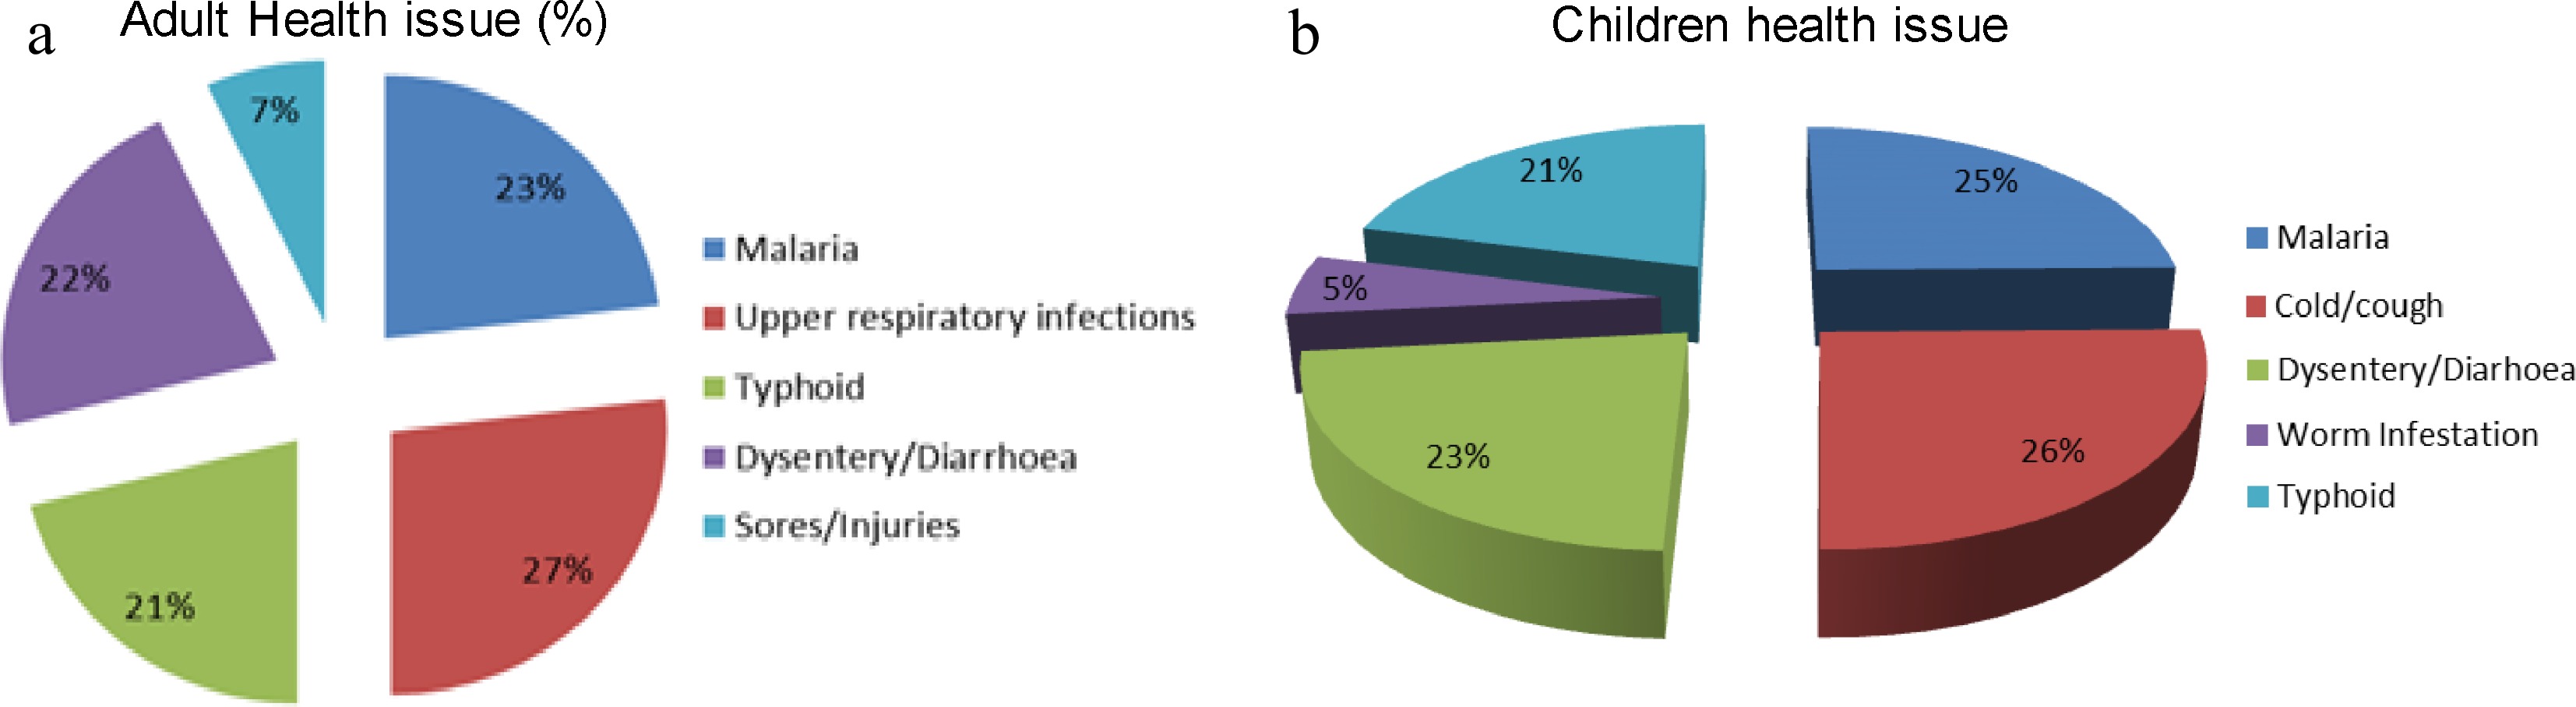
Figure 7.
Common health problems among the (a) adult and (b) children population.
-
Secretion and air attribute monitoring programs afford information that might be utilized for assessing the efficacy of emissions management stratagems. The systematic planning of air attribute monitoring is vital to ensuring that the data gathered are ample for their wished-for-rationales. The effluent and water attribute monitoring program that have tolerable resources and management oversight must be created. Also elements such as: monitoring parameters (that indicate contagions apprehension should encompass variables that are synchronized under the Standards for Noise, Industrial Effluent, and Gaseous Emissions Limitations and Environmental Guidelines for the Petroleum Industry in Nigeria's acquiescence requirements), monitoring kind and rate of recurrence (monthly/quarterly effluent monitoring that will take into consideration the discharge physiognomies from the operation of the depots and any other area with more potential for spills), monitoring locations (effluent sampling positions should be located at the final discharge point from the Oil Water Separator, also process expulsion must not be diluted preceding or after treatment), data quality (application of nationally approved techniques for sampling gathering, preservation, and analysis). Besides, samples must be carried out under or by trained individuals and tests to be performed by accredited laboratories or by the entities allowed or expert for this rationale. Although opportunities for water savings in industrial processes are highly industry-specific, there are opportunities for water-use monitoring in the Apapa Lagos State. Thus the indispensable elements of a water management program should encompass: an upgrade of treatment processes to meet needs for domestic purposes e.g., hand washing etc., classification, recurring measurement, and demo of principal flow within the region. This can be achieved through the installation of flow meters. Also constant similarity of water flows with functioning targets to ascertain where action must be taken to lessen water usage and water metering should accentuate zones with peak water usage [ 2, 13] .
-
In the last decades, spill out from aging, ailing maintained or incapacitated pipelines have upsurge and no clear inclination with respect to nosh-up, that is the number of happenings or total of spilled-out oil. This scrutiny displays the secretion of effluents, particulates contagions, and anions from Apapa, Lagos Nigeria. The outcomes flaunt that the presence and concentration of nitrogen (iv) oxide (NO 2) were less than 0.01 ppm thus within the stipulated limit of 0.113 ppm, whereas 100% CO and 30% of CO 2 measured was above the regulatory limits. Similarly, the highest noise value recorded was 89.9 dBA at the Generator house while the lowest was 57.2 dBA at the Pump house. The noise level at four sites of the sampled locations was found to be above the WHO 2007 and FMEnv regulatory limit. The concentration span of other metals arrangements is in the order of Cu < Pb < Zn < Ni < Mn < Fe. Zinc as well as copper displays concentrations beneath their maximum tolerable limits in hygienic water, whereas Pb, Cr, Ni, Fe, Cd, Hg plus Mn were available at extreme concentrations than intervention and target WHO criterion levels. Furthermore, the inhabitants of the shoreline regions disturbed by the spill-out are also indirectly or diametrically exposed to the oil chemicals and are facing economic together with social consequences of the spill-out. For this reason, epidemiologic research that centered on threat appraisal must consider all the variables ascribed to exposure to oil spills-out, no matter what the source, as these are indispensable for thorough appraisal of the possible impacts on human healthiness at various levels and also launch proper precautionary programs.
-
The authors confirm contribution to the paper as follows: study conception and design: Igibah CE, Agashua OJL; data collection: Ilaboya IR, Iyeke SD; analysis and interpretation of results: Igibah CE, Ufuah E, Agashua OJL; draft manuscript preparation: Igibah CE, Ufuah E, Agashua OJL, Ilaboya IR, Iyeke SD. All authors reviewed the results and approved the final version of the manuscript.
-
All data generated or analyzed during this study are included in this published article.
-
The authors appreciate the authorities of Apapa Local Government Area Lagos State, for creating the environment for this study and Bosean Equipment Company for providing the equipment for this research.
-
The authors declare that they have no conflict of interest.
- Copyright: © 2024 by the author(s). Published by Maximum Academic Press on behalf of Nanjing Tech University. This article is an open access article distributed under Creative Commons Attribution License (CC BY 4.0), visit https://creativecommons.org/licenses/by/4.0/.
-
About this article
Cite this article
Igibah CE, Ilaboya IR, Iyeke SD, Ufuah E, . 2024. Health effects of oil and waste pollutants on Delta Nigeria inhabitants' well being and its mitigation. Emergency Management Science and Technology 4: e017 doi: 10.48130/emst-0024-0015 

Health effects of oil and waste pollutants on Delta Nigeria inhabitants' well being and its mitigation
- Received: 10 August 2023
- Revised: 20 April 2024
- Accepted: 17 June 2024
- Published online: 03 September 2024
Abstract: Water quality, trace gas (SO 2, CO 2, and NO 2), particulate matter (PM 10 as well as PM2.5), and effluent emissions were quantified near cement and oil factories and nearby suburban areas within Delta Nigeria. Results display that ambient air particulate matter PM2.5 varies between 2.1 to 7.9 μg/m 3 and VOC (0.013−8.53 μg/m 3), while CO and CO 2 were 100% and 30% respectively not within regulatory limits, consequently leading to asthma, coughing, and difficulty breathing. Four out of nine sites investigated for noise effects were above WHO stipulated limits. While some parameters such as BOD and COD display critical levels for effluent scrutiny and conductivity, calcium, TDS, total hardness, DO (Dissolved oxygen) and total alkalinity were also above clean water specifications. Wastewater consists of spills and other water effects which produce pollutants such as soluble organic chemicals that deplete dissolved oxygen, anions, volatile materials, and other heavy metals. Based on age, the greatest impact (52%) was seen in ages varying from 0 to 16 while that of the age set 16 to 60 was 45%. Curbing of oil and cement particulate pollutants and requesting a buffer region between the cement and oil depots and neighborhoods, complemented with regulatory enforcement and persistent monitoring, should be a top precedence to the regulatory authority.
-
Key words:
- Emission /
- Particulate /
- Combustible /
- Monoxide /
- Contagion