-
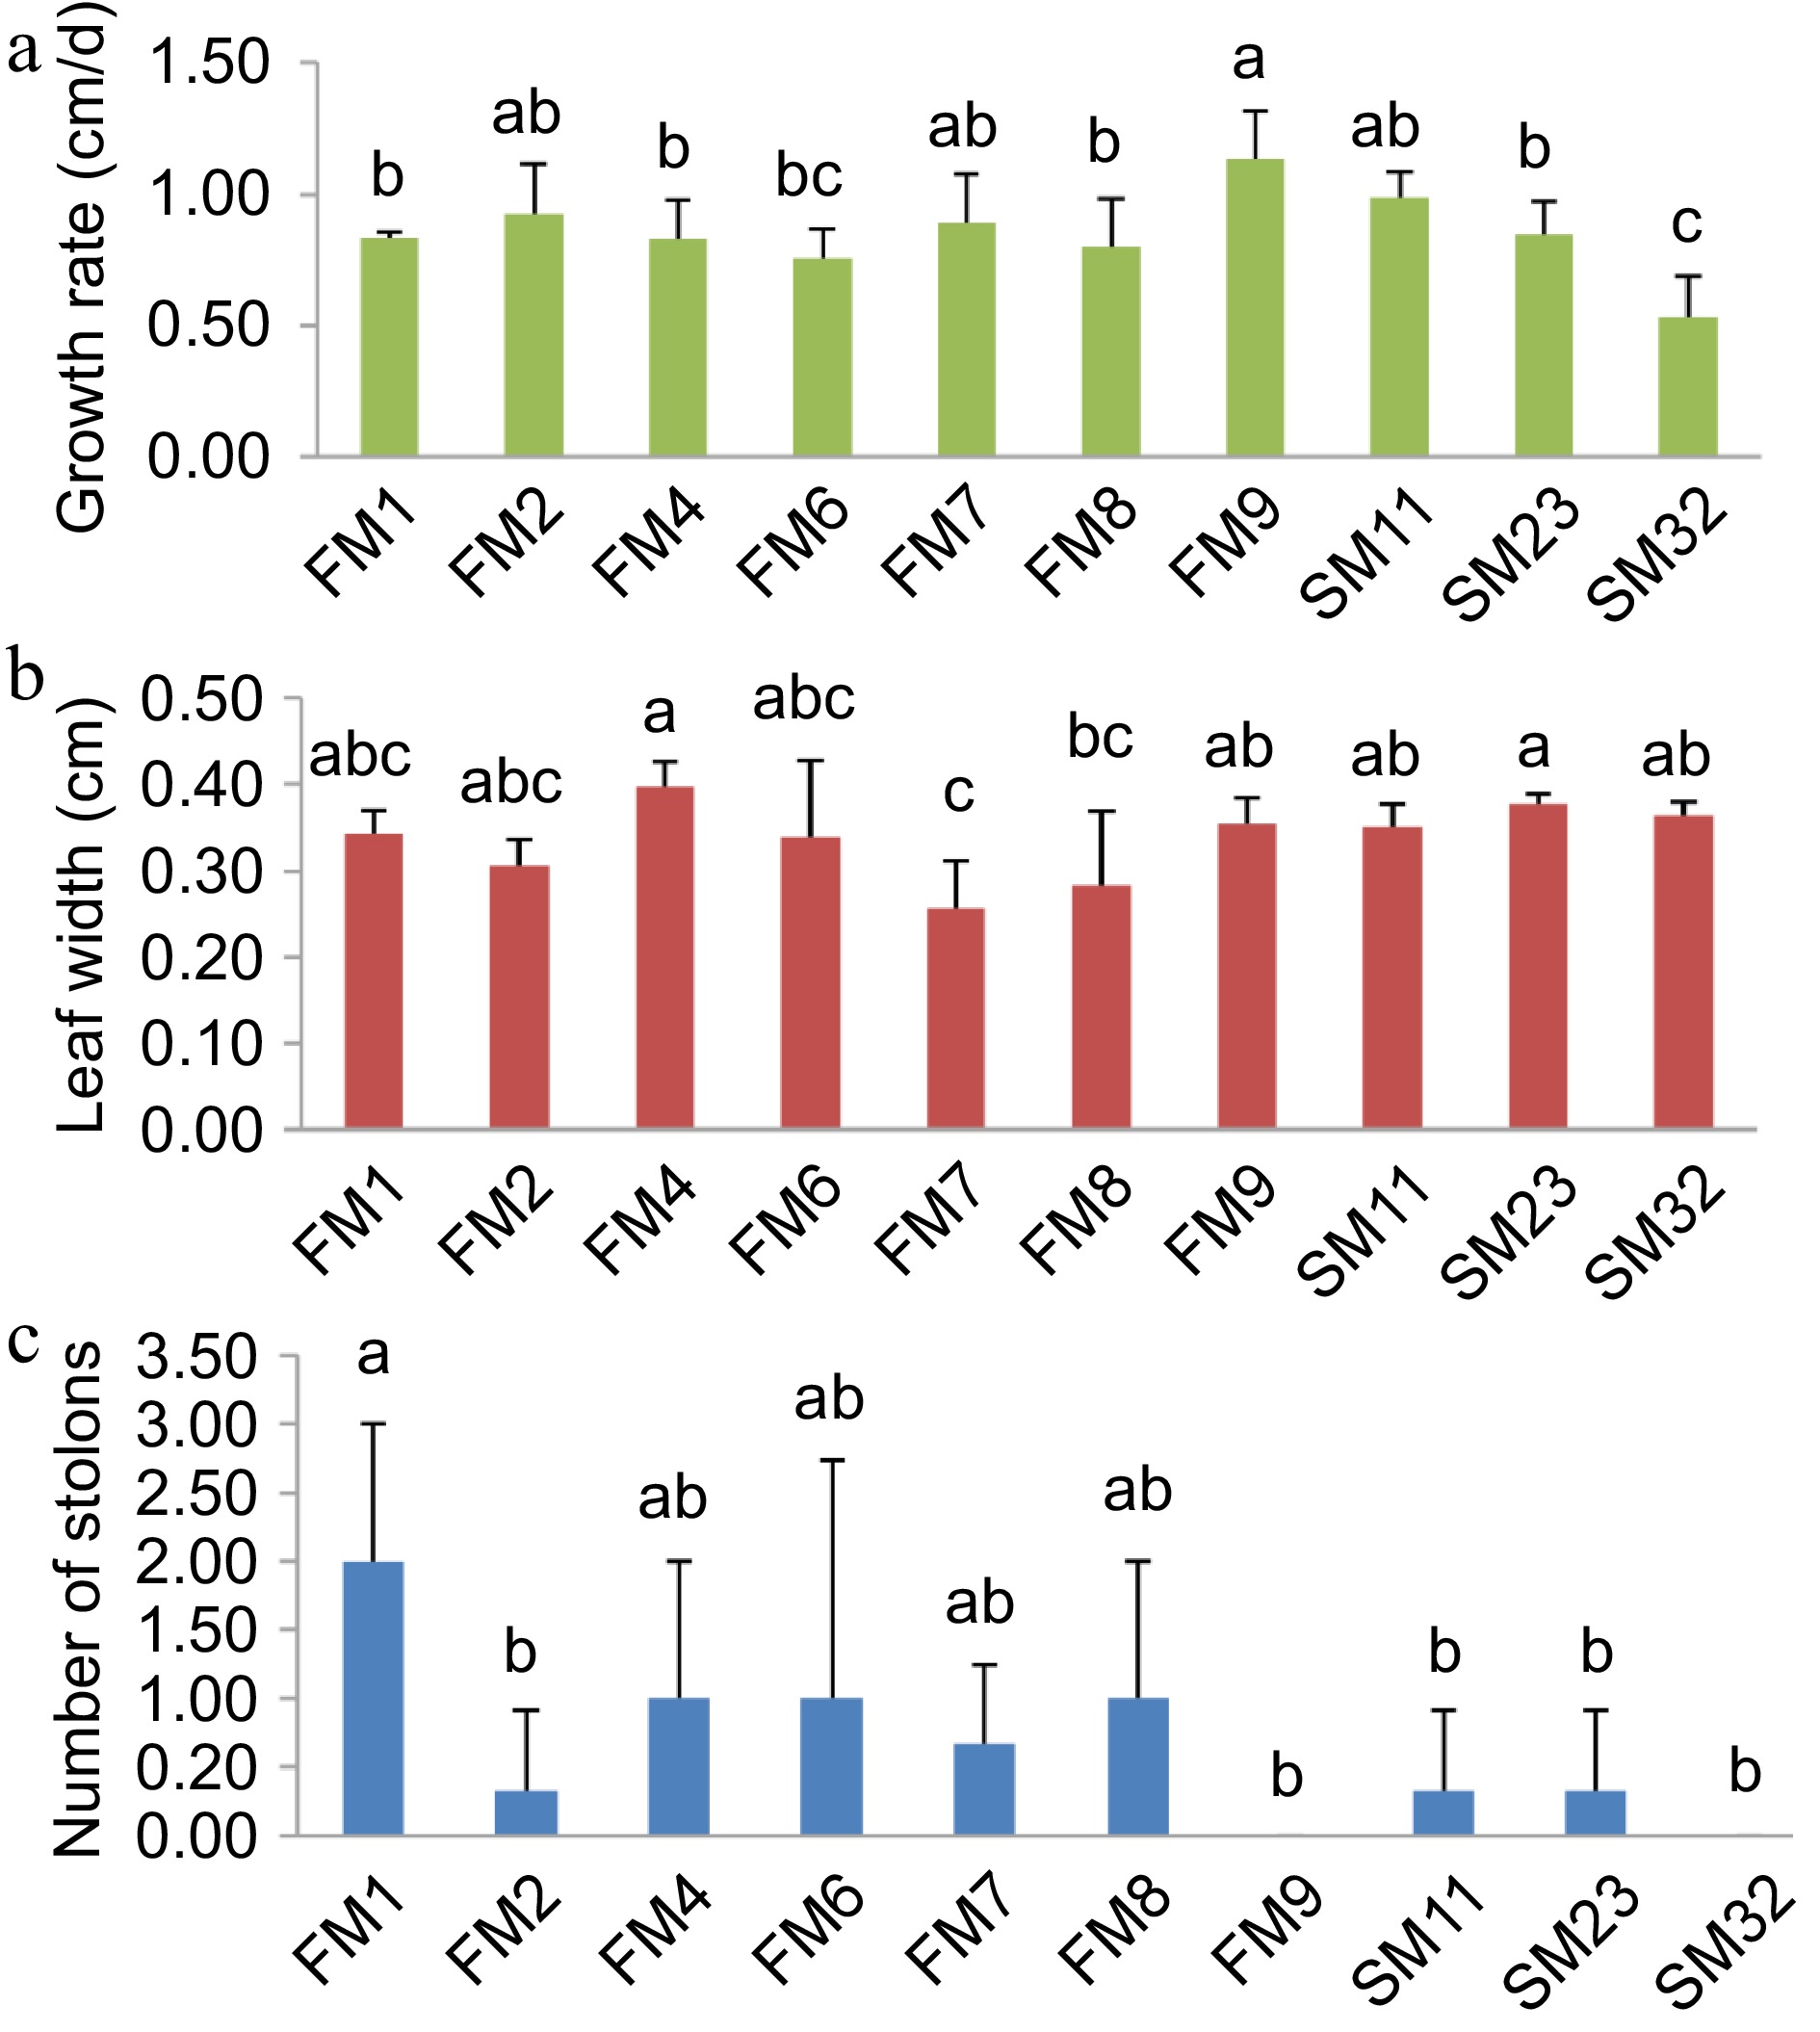
Figure 1.
Growth of different Zoysia grass. (a) Zoysia grass growth rate. (b) Zoysia grass leaf width. (c) Number of Zoysia grass stolons. Error bars represent ± SD. Significance analysis was performed with 1-way ANOVA (p < 0.05).
-
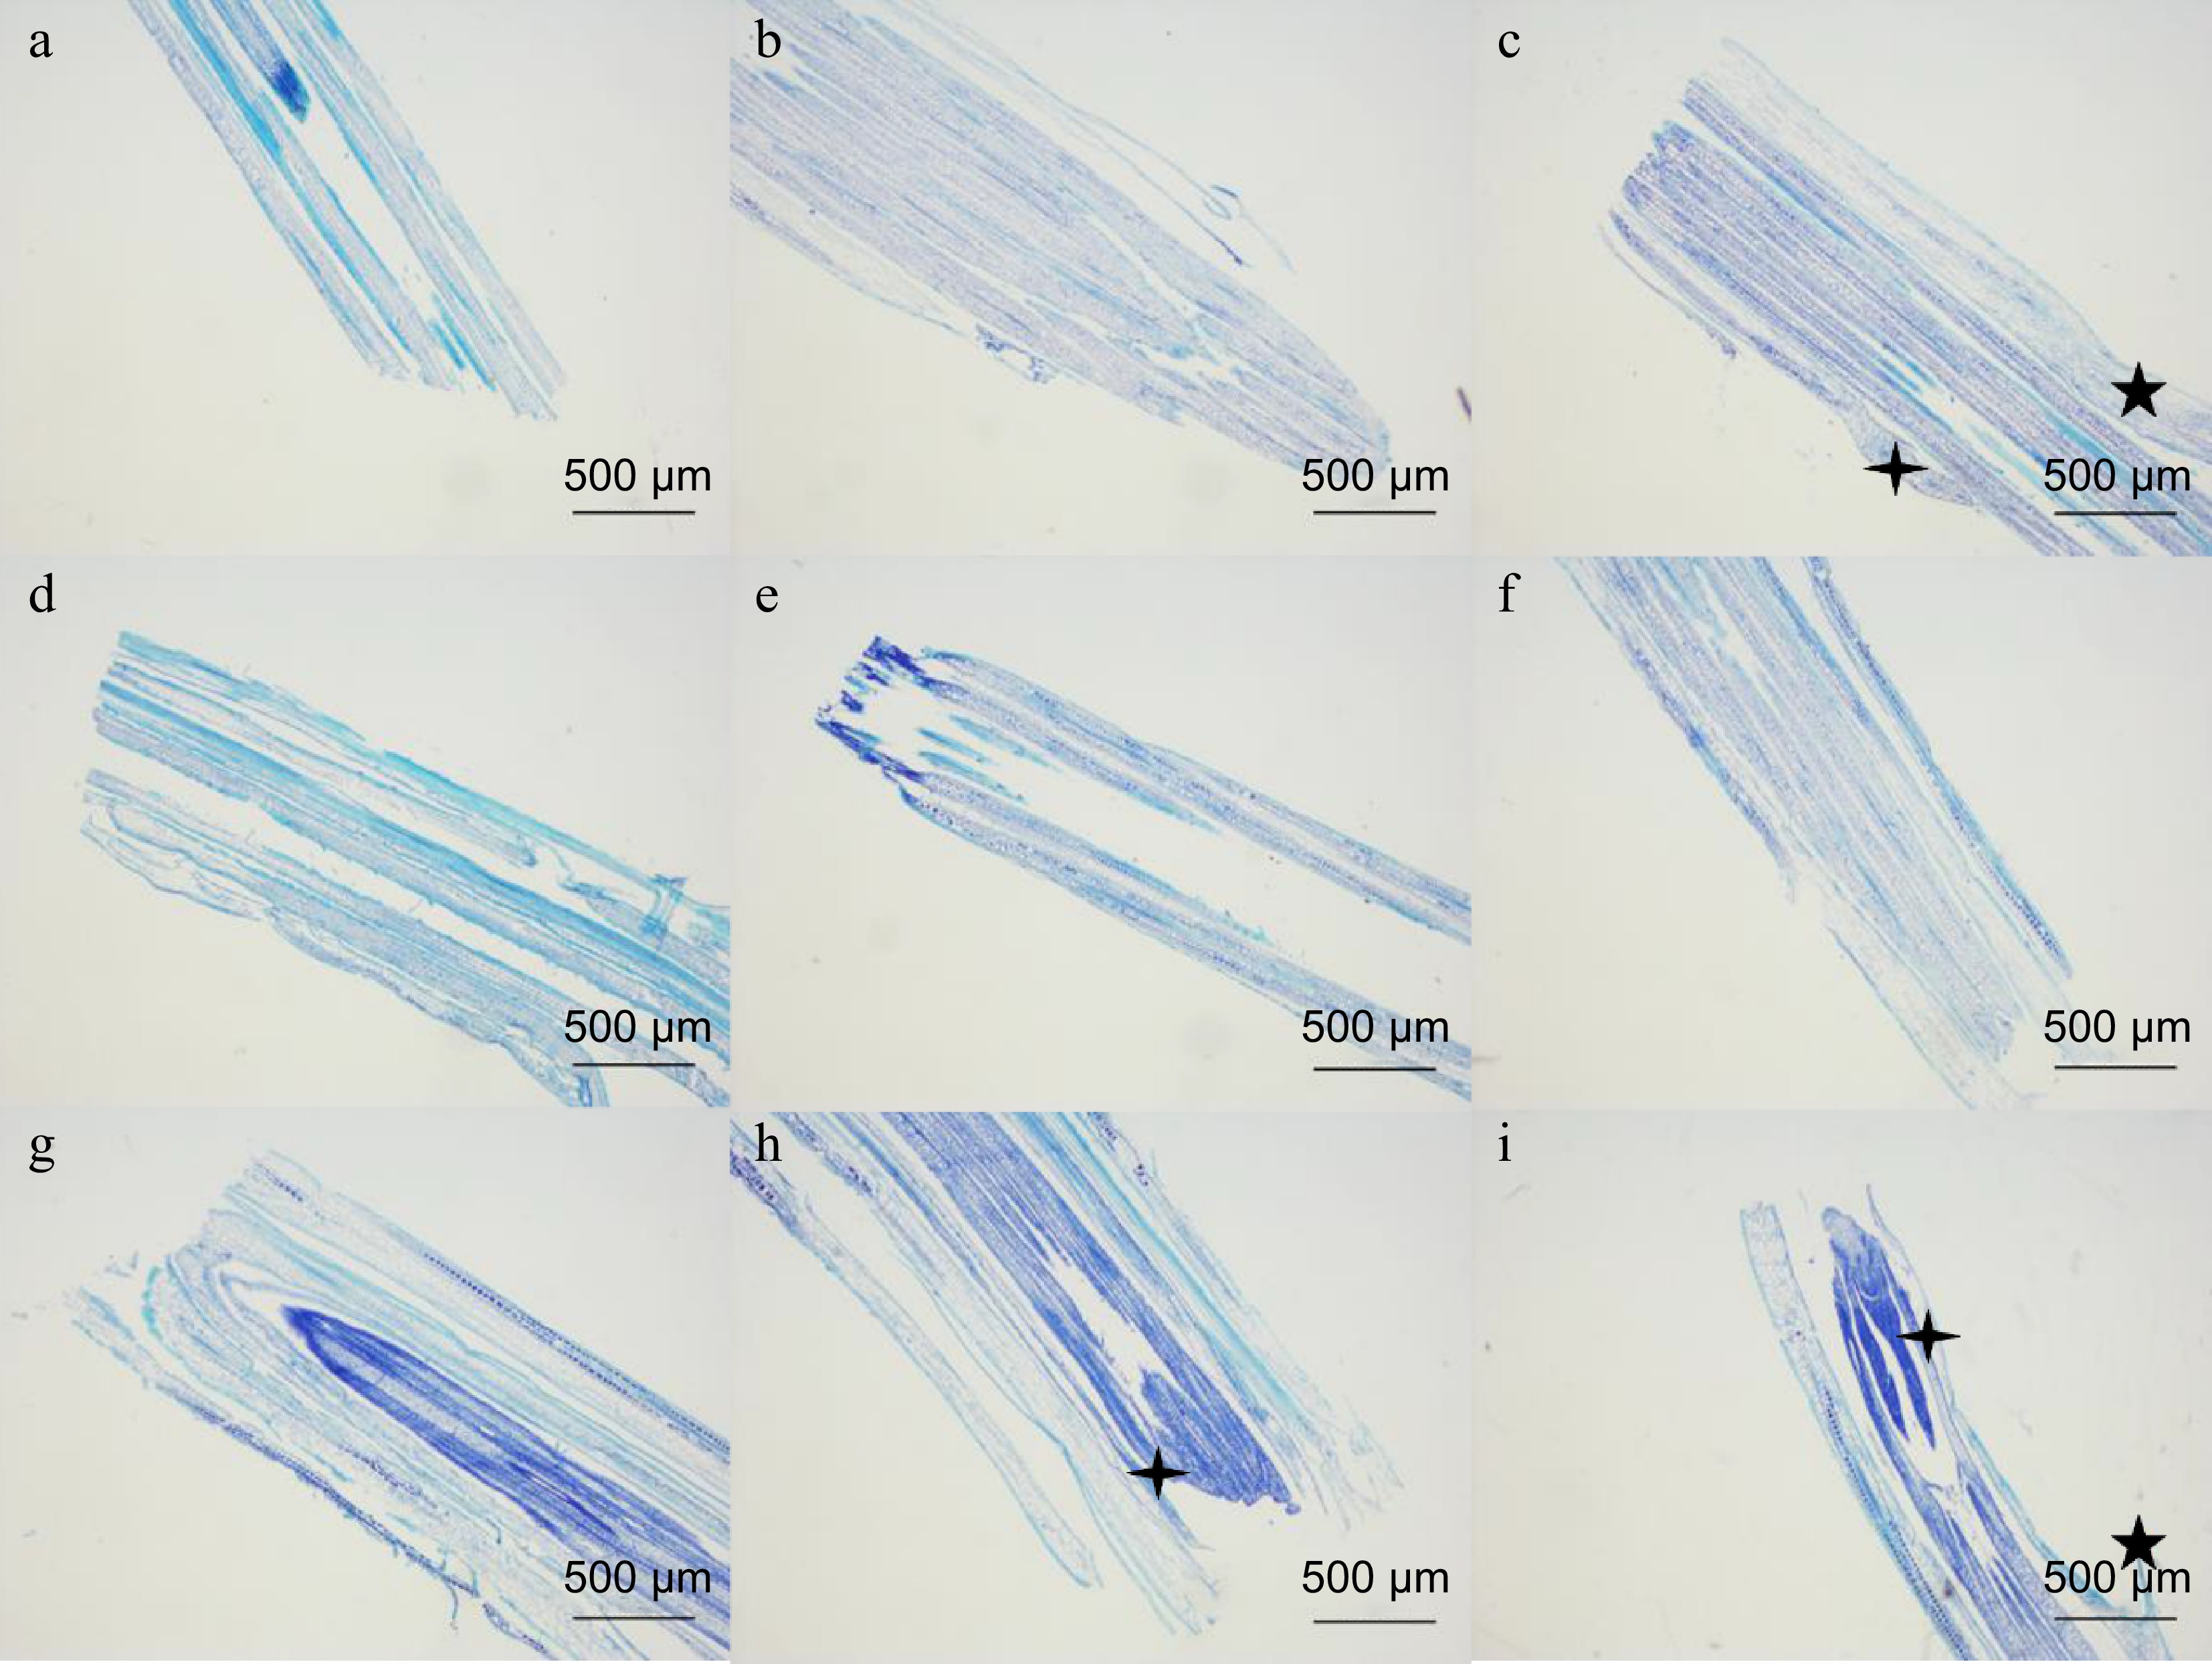
Figure 2.
Microstructural changes of tip meristems after mowing of FM1 and SM232. (a)−(c) Tip meristems at 0, 2, and 6 h after FM1 mowing. (d)−(i) Tip meristems at 0, 2, 6, 12, 24, and 48 h after SM232 mowing.


-
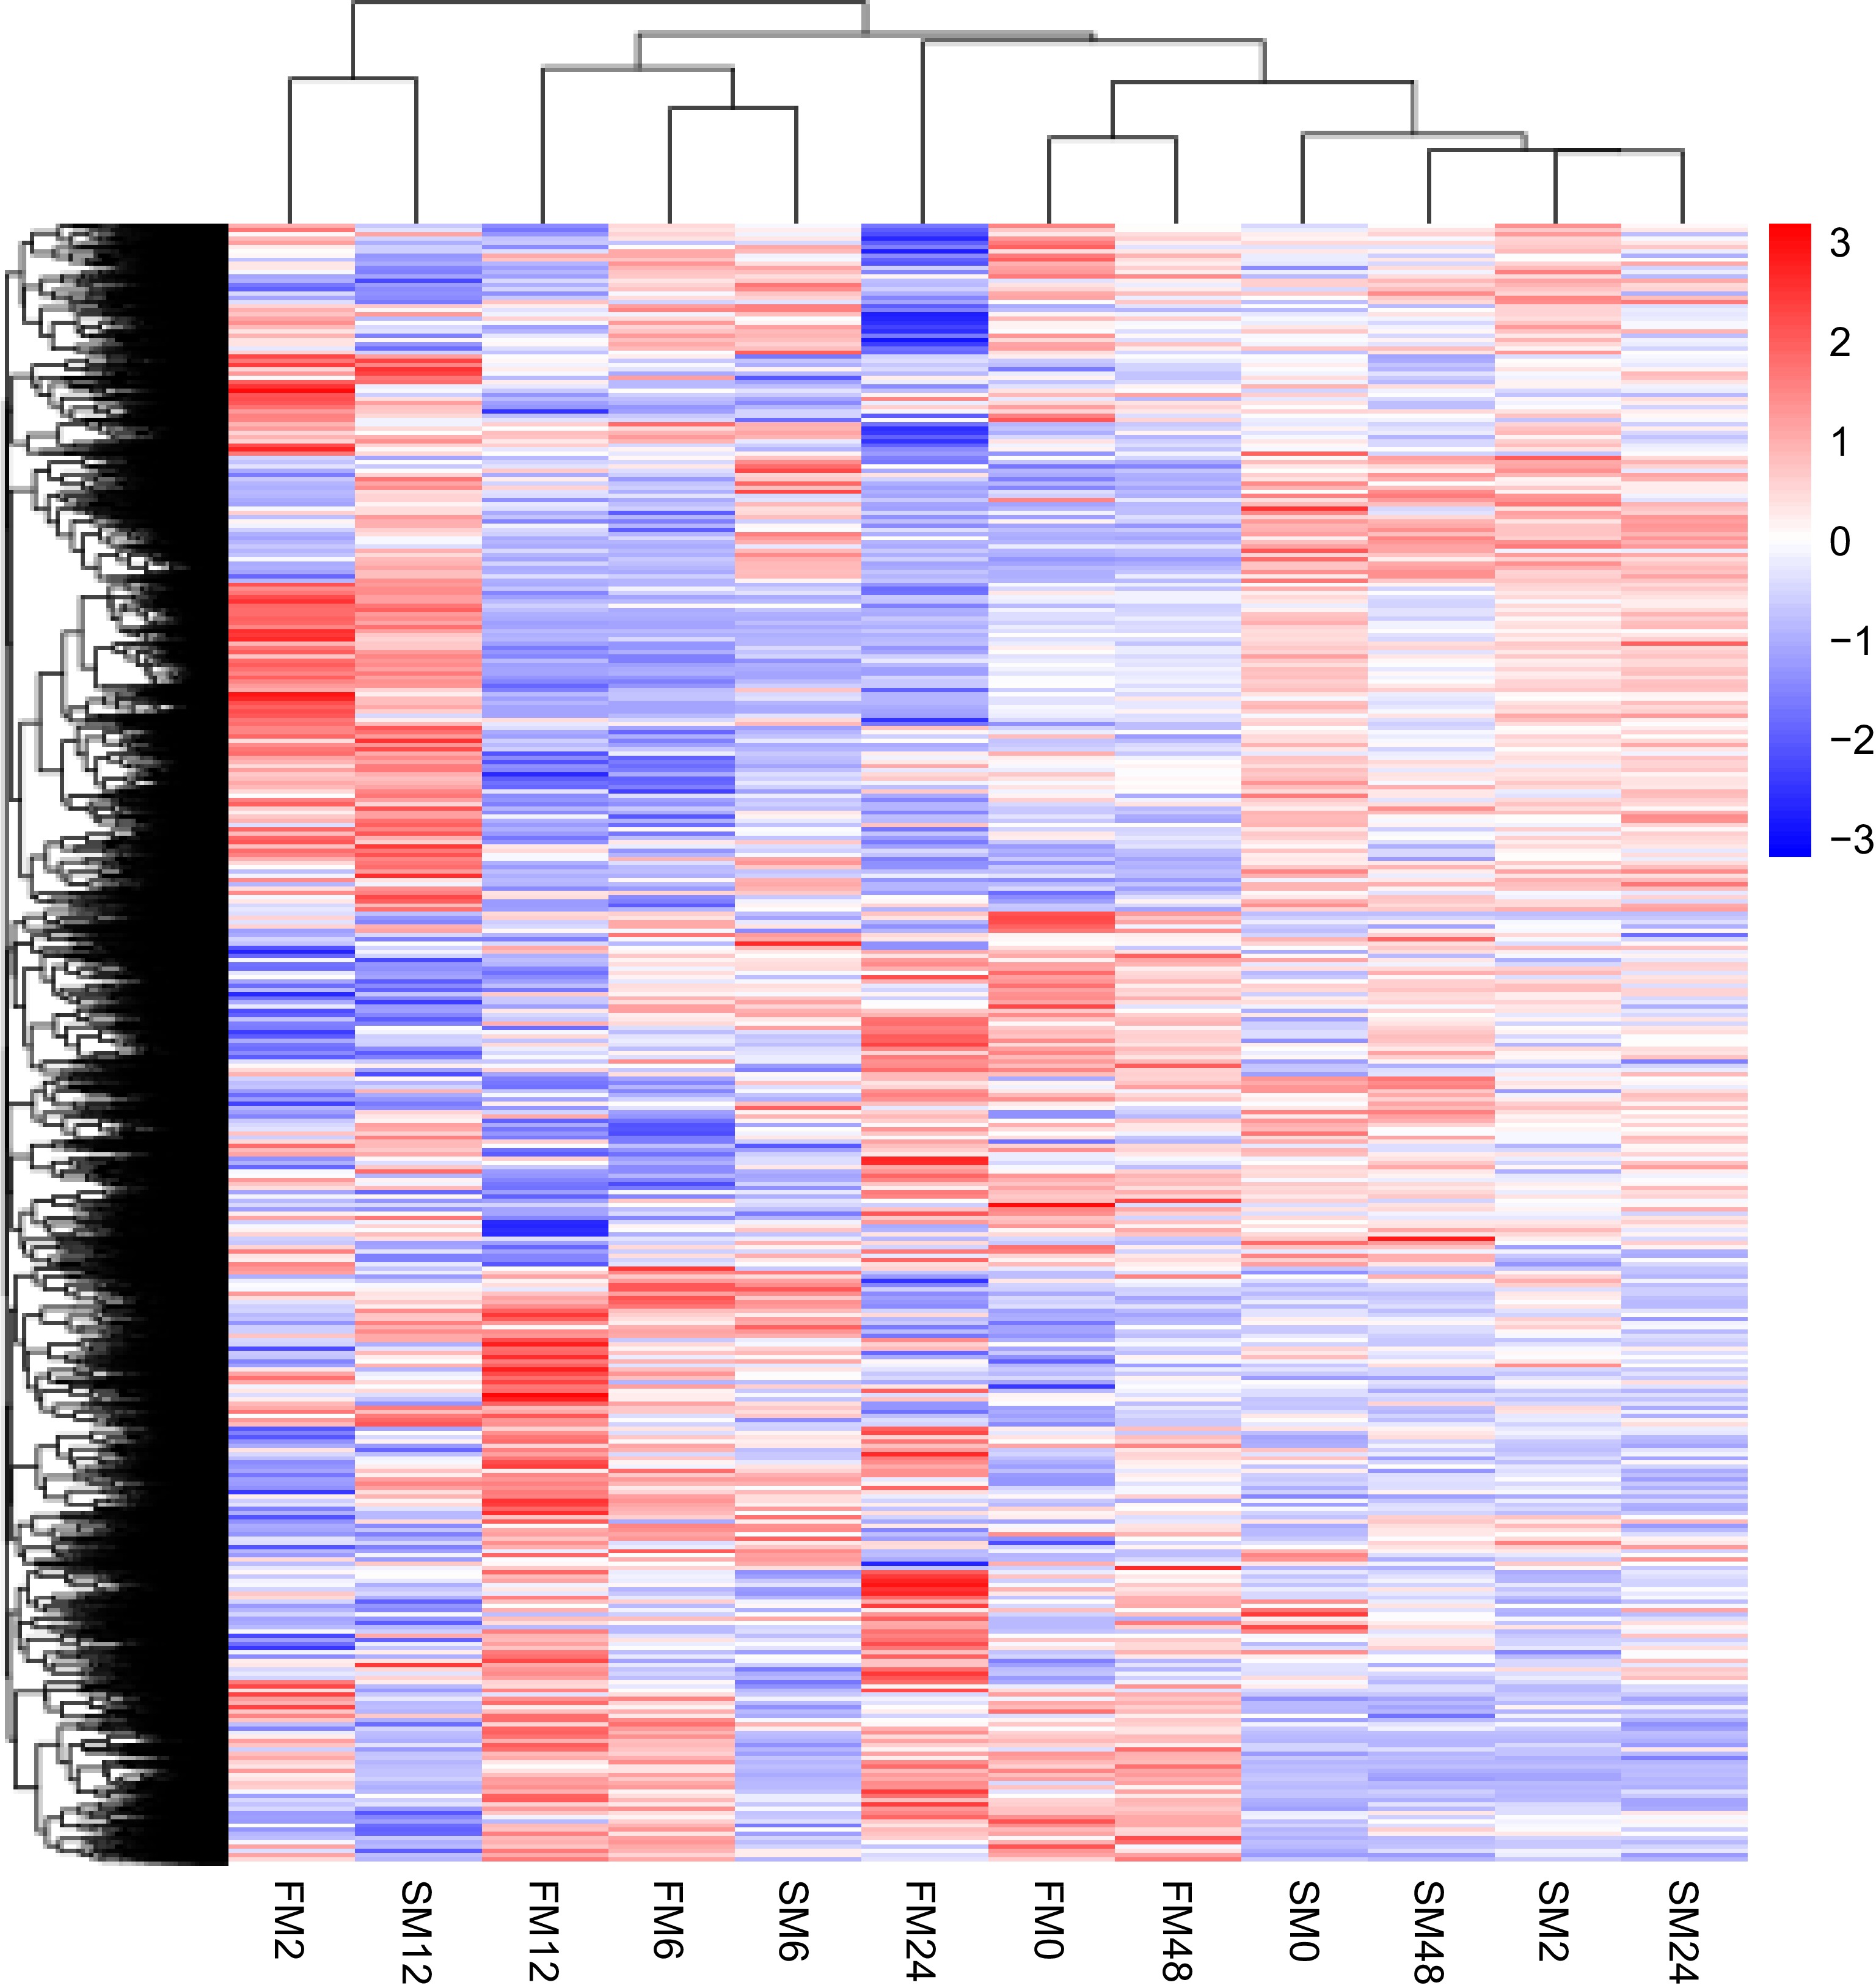
Figure 3.
Clustering of DEGs based on pairwise comparison among the 12 libraries (FM1-2h, FM232-6h, SM232-2h etc.). The fold changes of the DEGs expression levels are hierarchically clustered and shown in a heat-map. The expression level differences are represented by a color scale from blue (down-regulated expression) to red (up-regulated expression), as indicated by the scale bar. Made by novomagic (
https://magic.novogene.com ). -
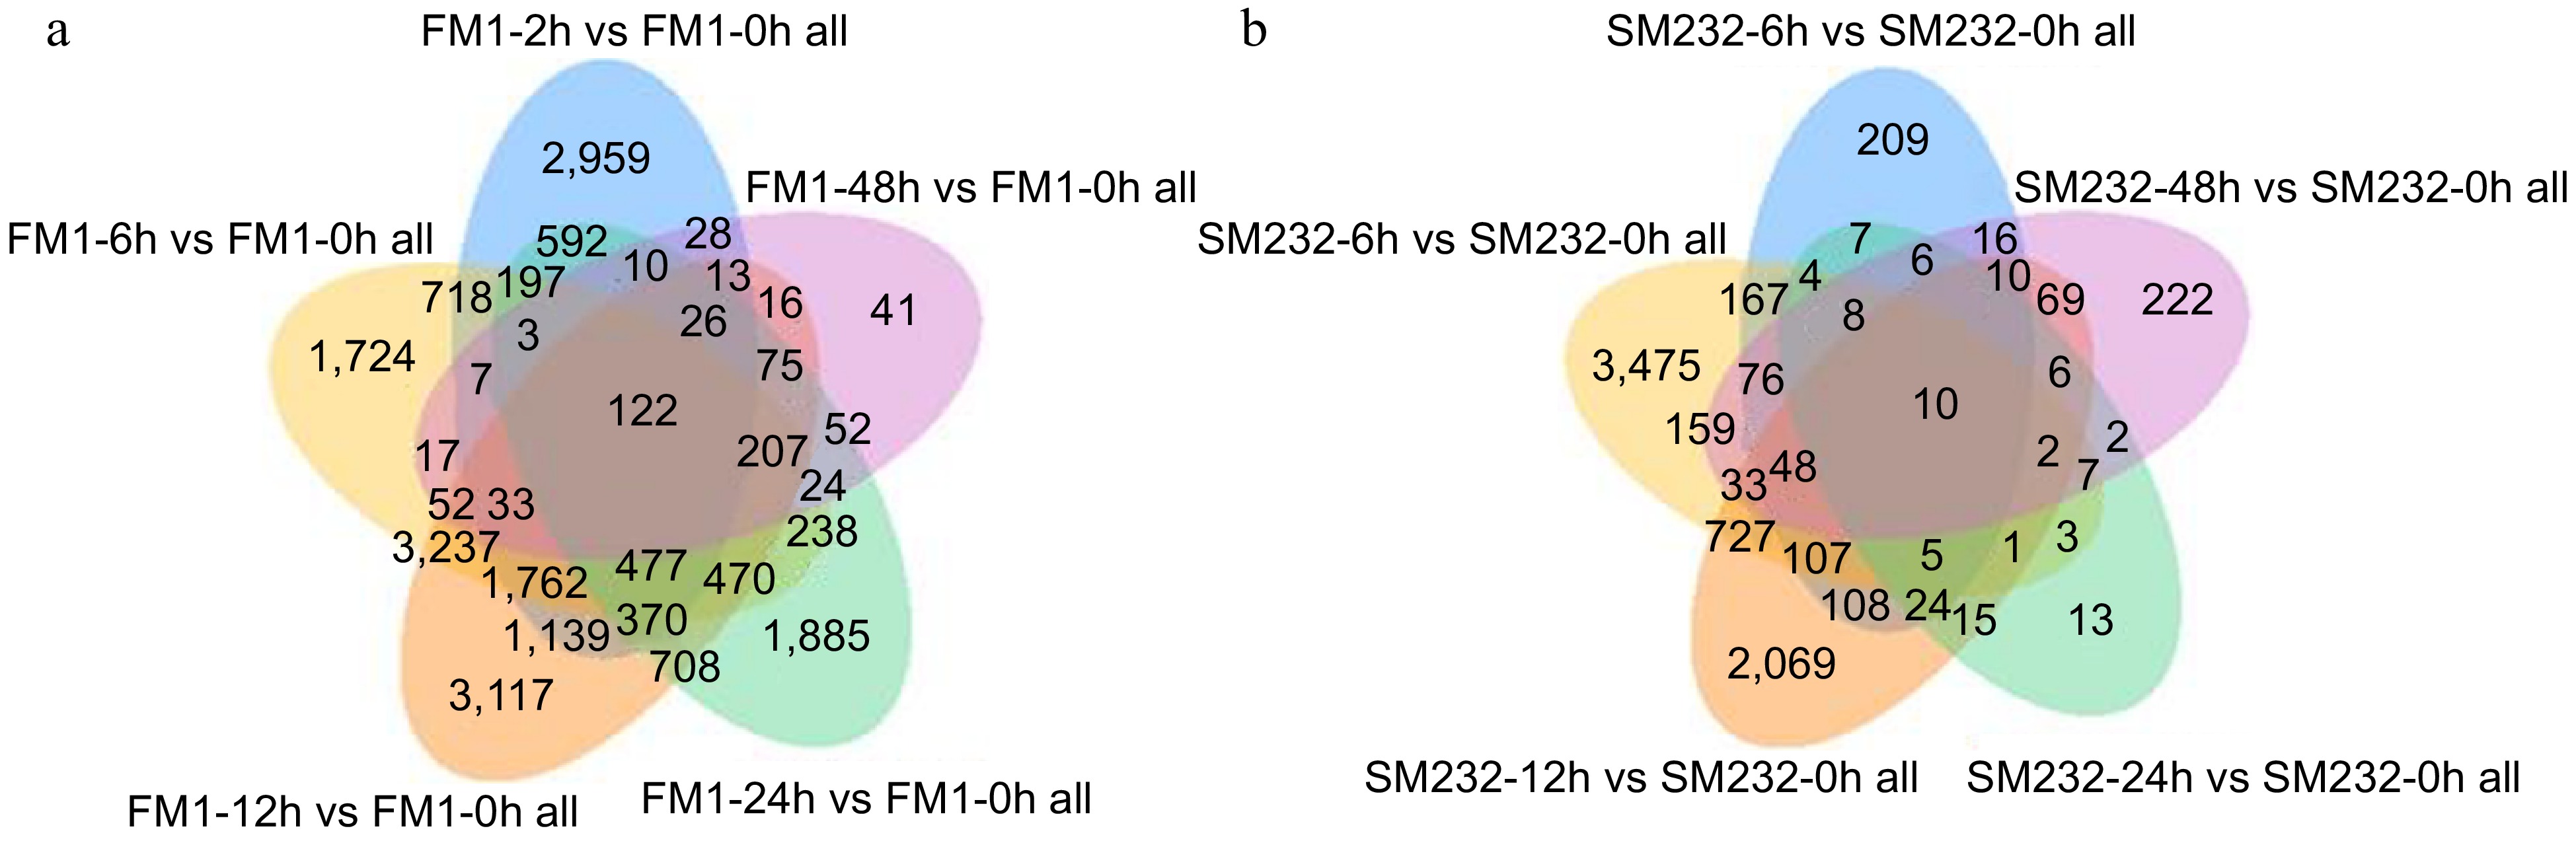
Figure 4.
Venn diagram of differential genes of FM1 and SM232 at different times after mowing. (a) Number of differential genes of FM1 at 2, 6, 12, 24, and 48 h after mowing. (b) Number of differential genes of SM232 at 2, 6, 12, 24, and 48 h after mowing.
-
Figure 5.
KEGG enrichment bubble plots of differentially expressed genes at different times after mowing in FM1. (a) KEGG pathway analysis of DEGs at FM1-2h compared to FM1-0h. (b) KEGG pathway analysis of DEGs at FM1-6h compared to FM1-0h. (c) KEGG pathway analysis of DEGs at FM1-12h compared to FM1-0h. (d) KEGG pathway analysis of DEGs at FM1-24h compared to FM1-0h.
-
Figure 6.
KEGG enrichment bubble plots of differentially expressed genes at different times after construction in SM232. (a) KEGG pathway analysis of DEGs at SM232-2h compared to SM232-0h. (b) KEGG pathway analysis of DEGs at SM232-6h compared to SM232-0h. (c) KEGG pathway analysis of DEGs at SM232-12h compared to SM232-0h. (d) KEGG pathway analysis of DEGs at SM232-48h compared to SM232-0h.
-
Figure 7.
Trends of IAA and CTK in FM1 and SM232 after mowing. (a) IAA content of FM1 and SM232 after mowing. CTK content of FM1 and SM232 after mowing. (b) iP, (c) iPR, (d) cZ, (e) czR, (f) tZ, (g) tzR.
-
Figure 8.
Gene expression of IAA- and CTK-related hormones in FM1 and SM232. (a) Changes in IAA-related gene expression at different times after FM1 mowing. (b) Changes in CTK-related gene expression at different times after FM1 mowing. (c) Changes in IAA-related gene expression at different times after SM232 mowing.
Figures
(8)
Tables
(0)