-
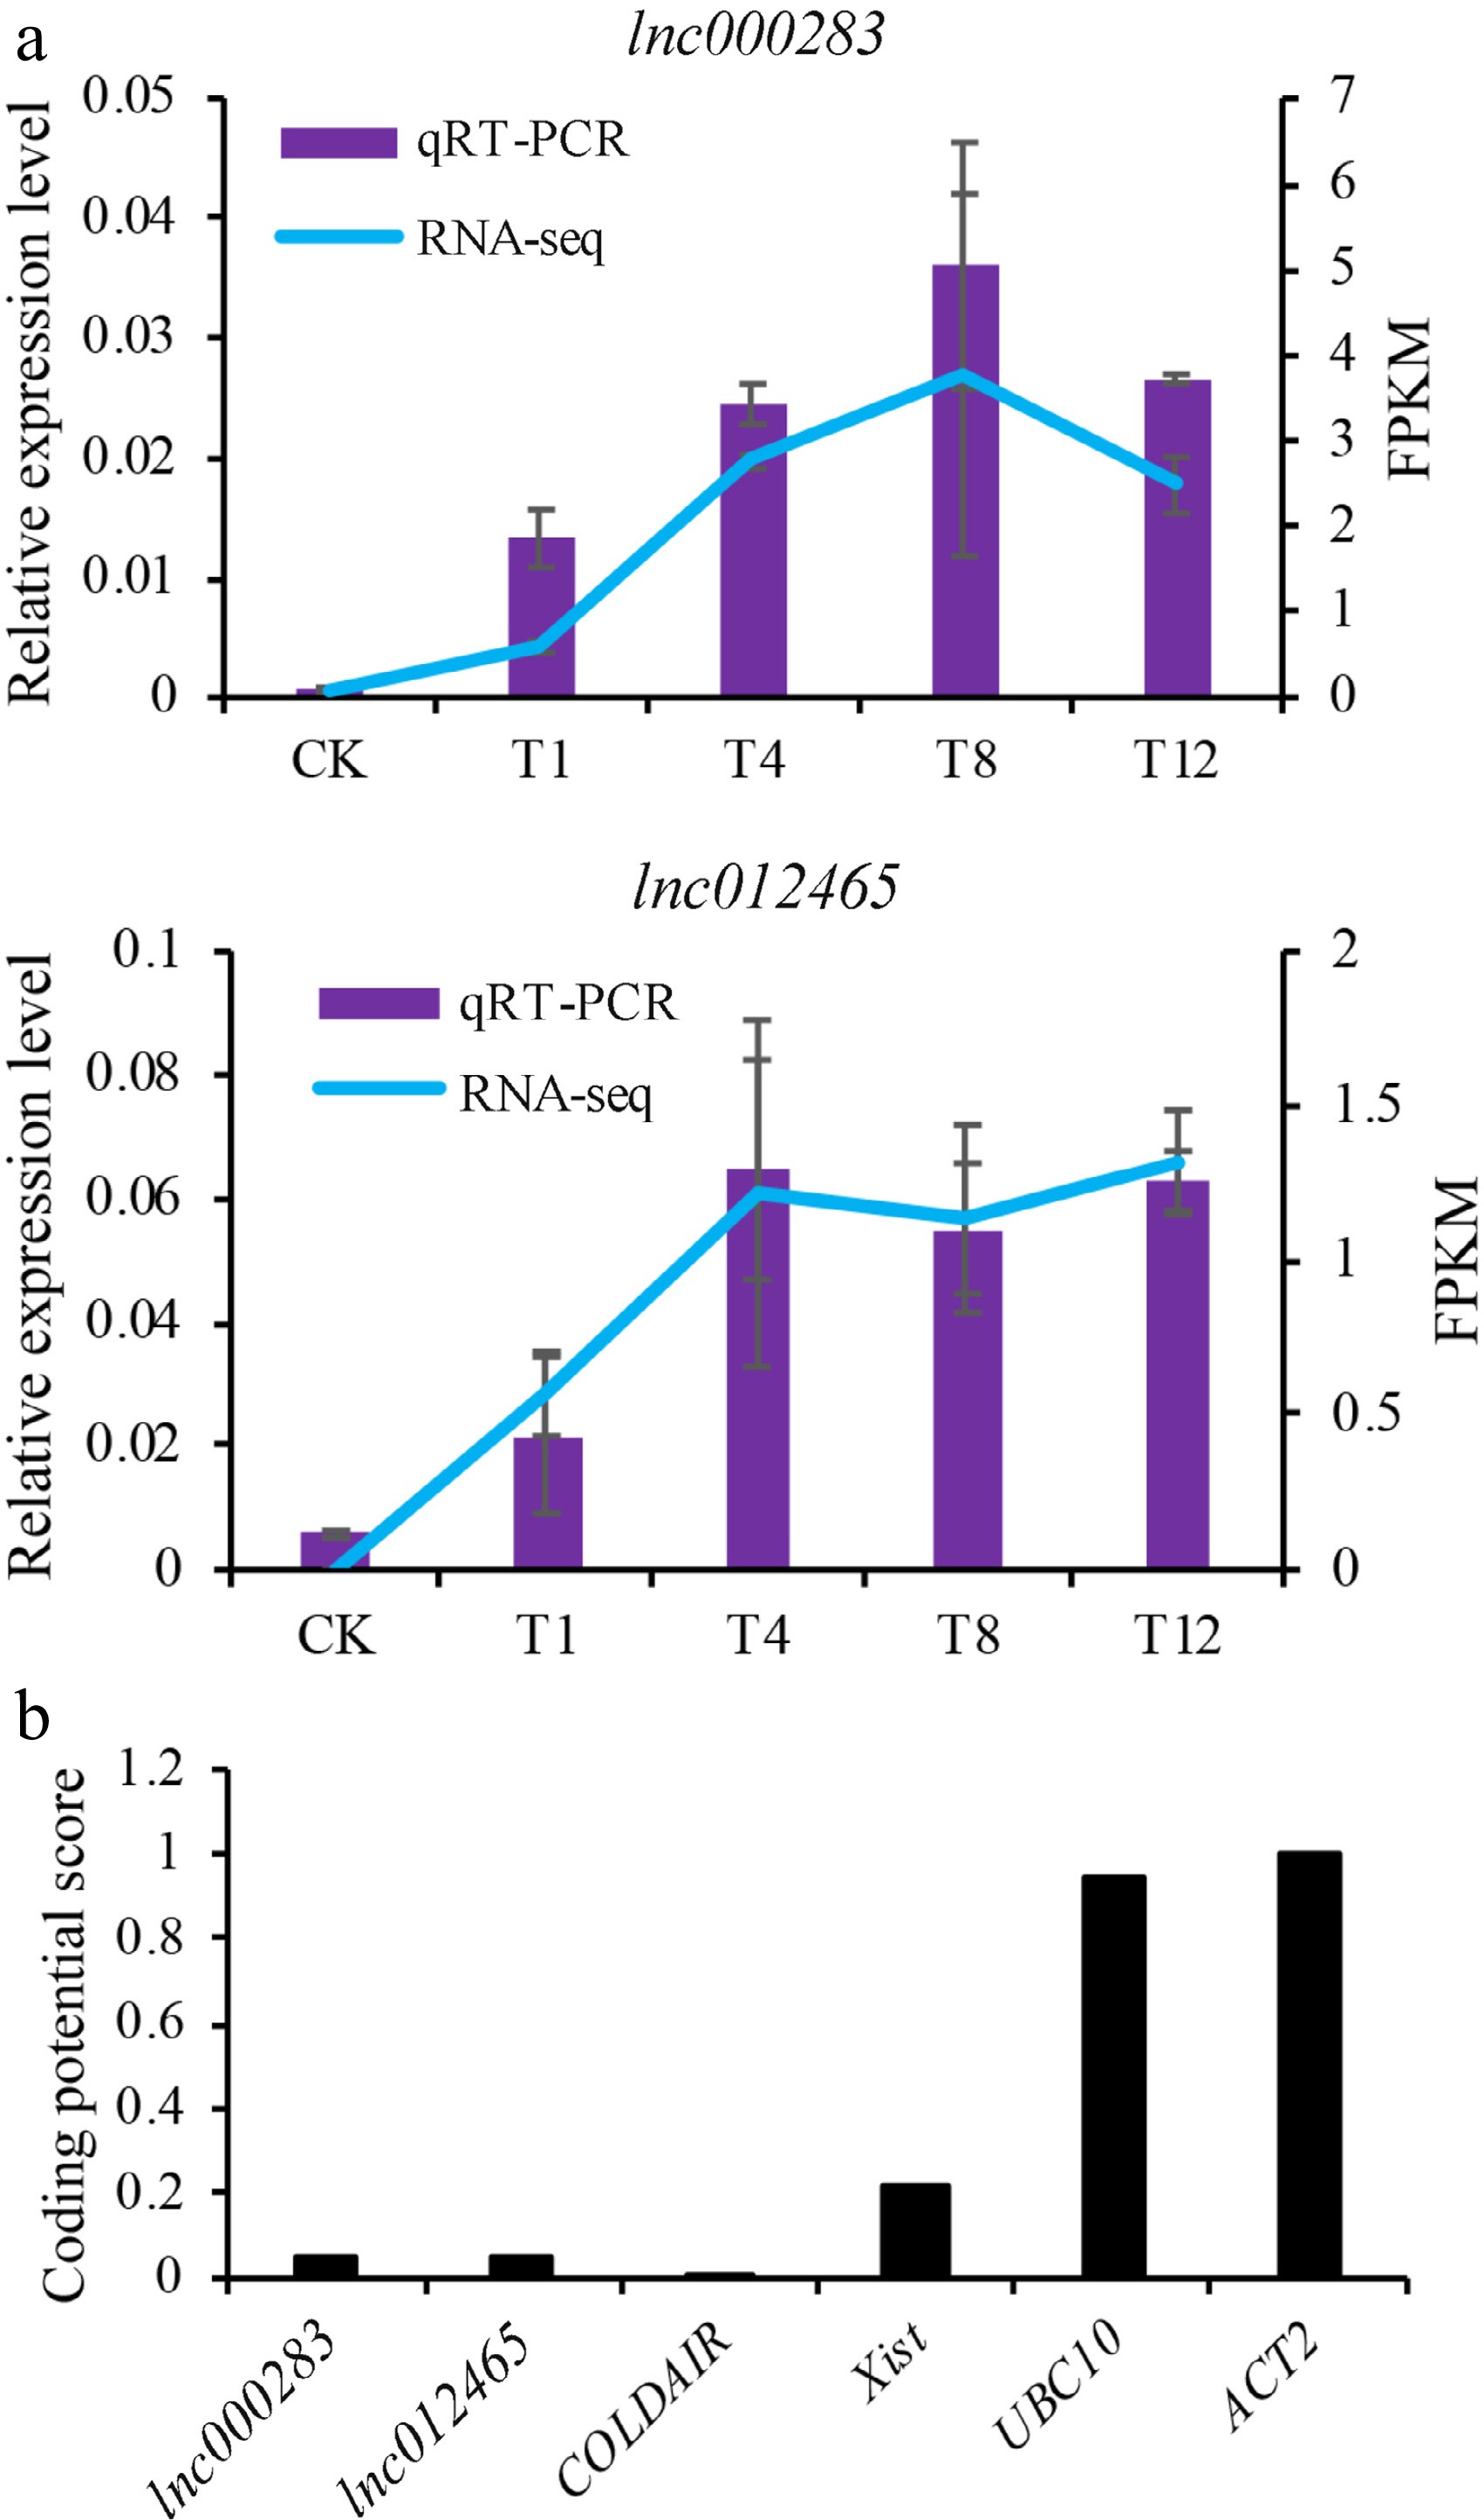
Figure 1.
Characteristics of lnc000283 and lnc012465. (a) Expression level of lnc000283 and lnc012465 in Chinese cabbage leaves treated at 38 °C at different time points, as determined by qRT-PCR and RNA-seq. CK is a representative plant before heating, and T1, T4, T8, and T12 denote plants that were subjected to 38 °C for 1, 4, 8, and 12 h, respectively. The expression levels were normalized to the expression level of Actin. (b) Analysis of coding potential for lnc000283 and lnc012465. The coding potential scores were calculated using the CPC program. UBC10 (At5g53300) and ACT2 (At3g18780) are positive controls that encode proteins. COLDAIR (HG975388) and Xist (L04961) serve as negative controls, exhibiting minimal protein-coding potential.
-
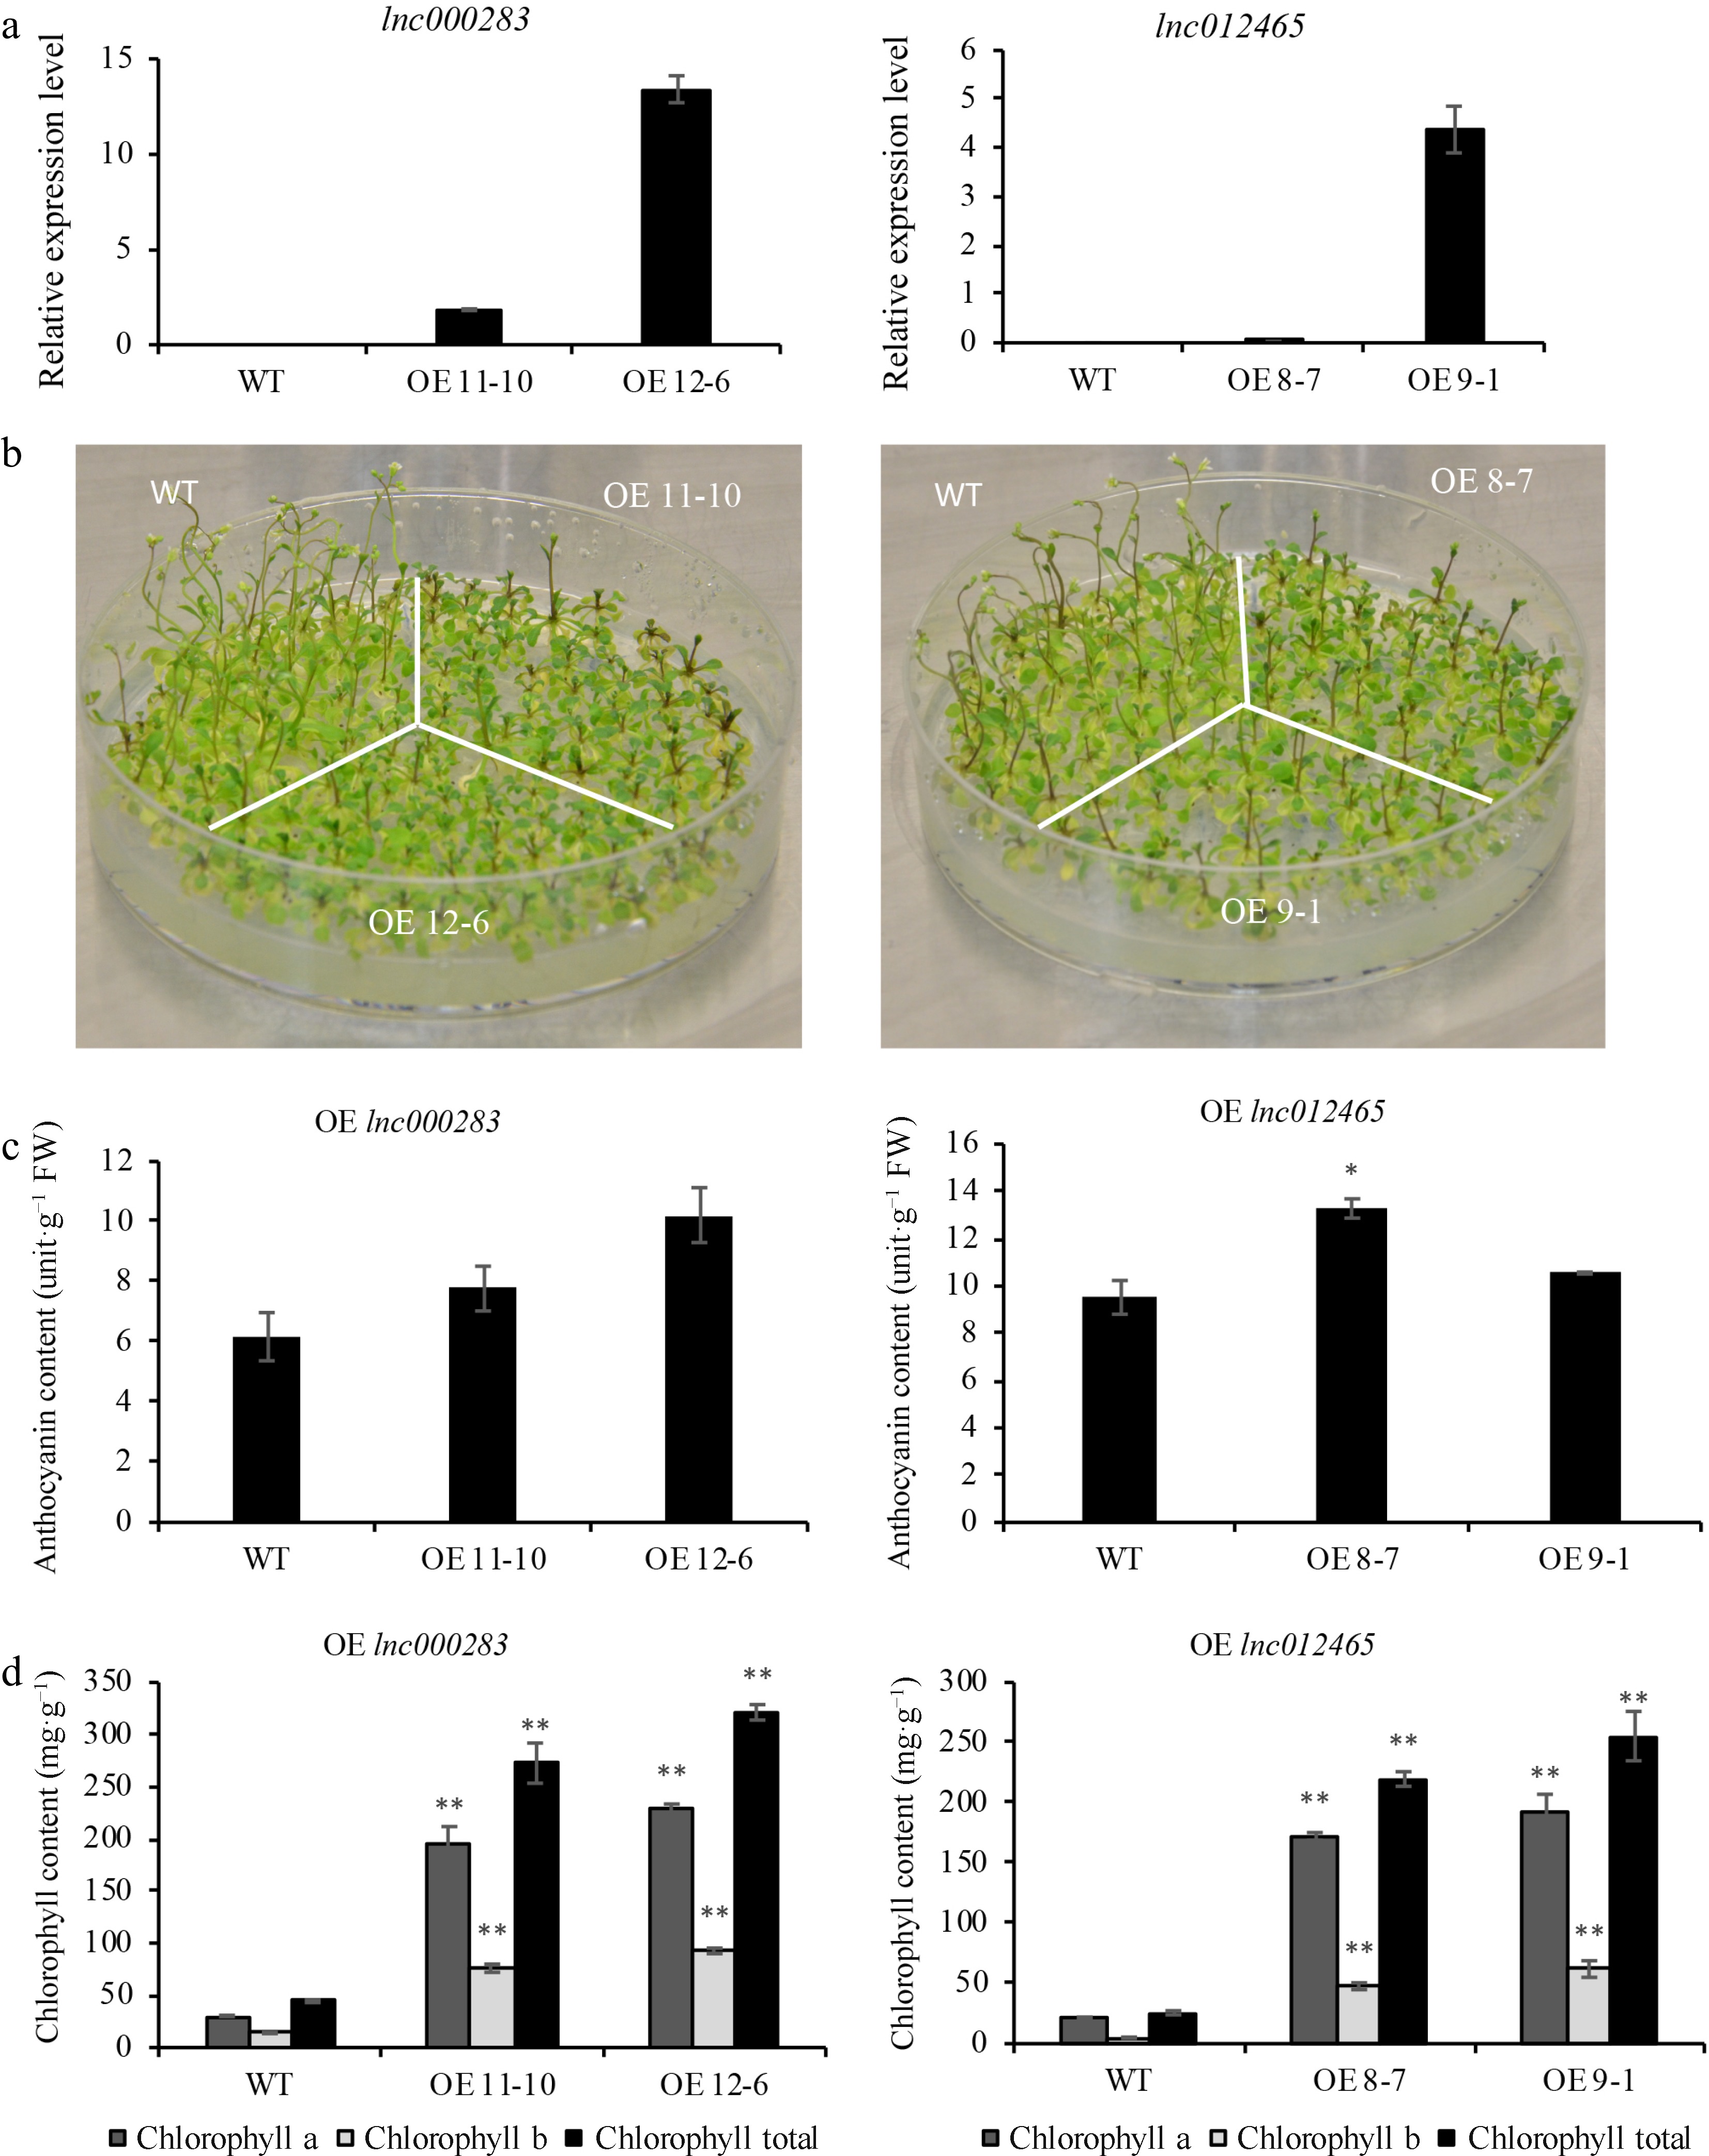
Figure 2.
Arabidopsis plants overexpressing lnc000283 and lnc012465 had higher anthocyanins and chlorophyll content. (a) The relative expression level of lnc000283 and lnc012465 in WT and different transgenic lines. UBC10 (At5g53300) was used as an internal control. Each value is mean ± sd (n = 3). (b) The phenotype of WT and Arabidopsis overexpressing lnc000283 or lnc012465 grown on 1/2 MS medium 50 d after sowing. The (c) anthocyanin and (d) chlorophyll content of WT and transgenic Arabidopsis overexpressing lnc000283 or lnc012465. The asterisks above the bars indicate statistical significance using Student's t-test (*, p < 0.05; **, p < 0.01).
-
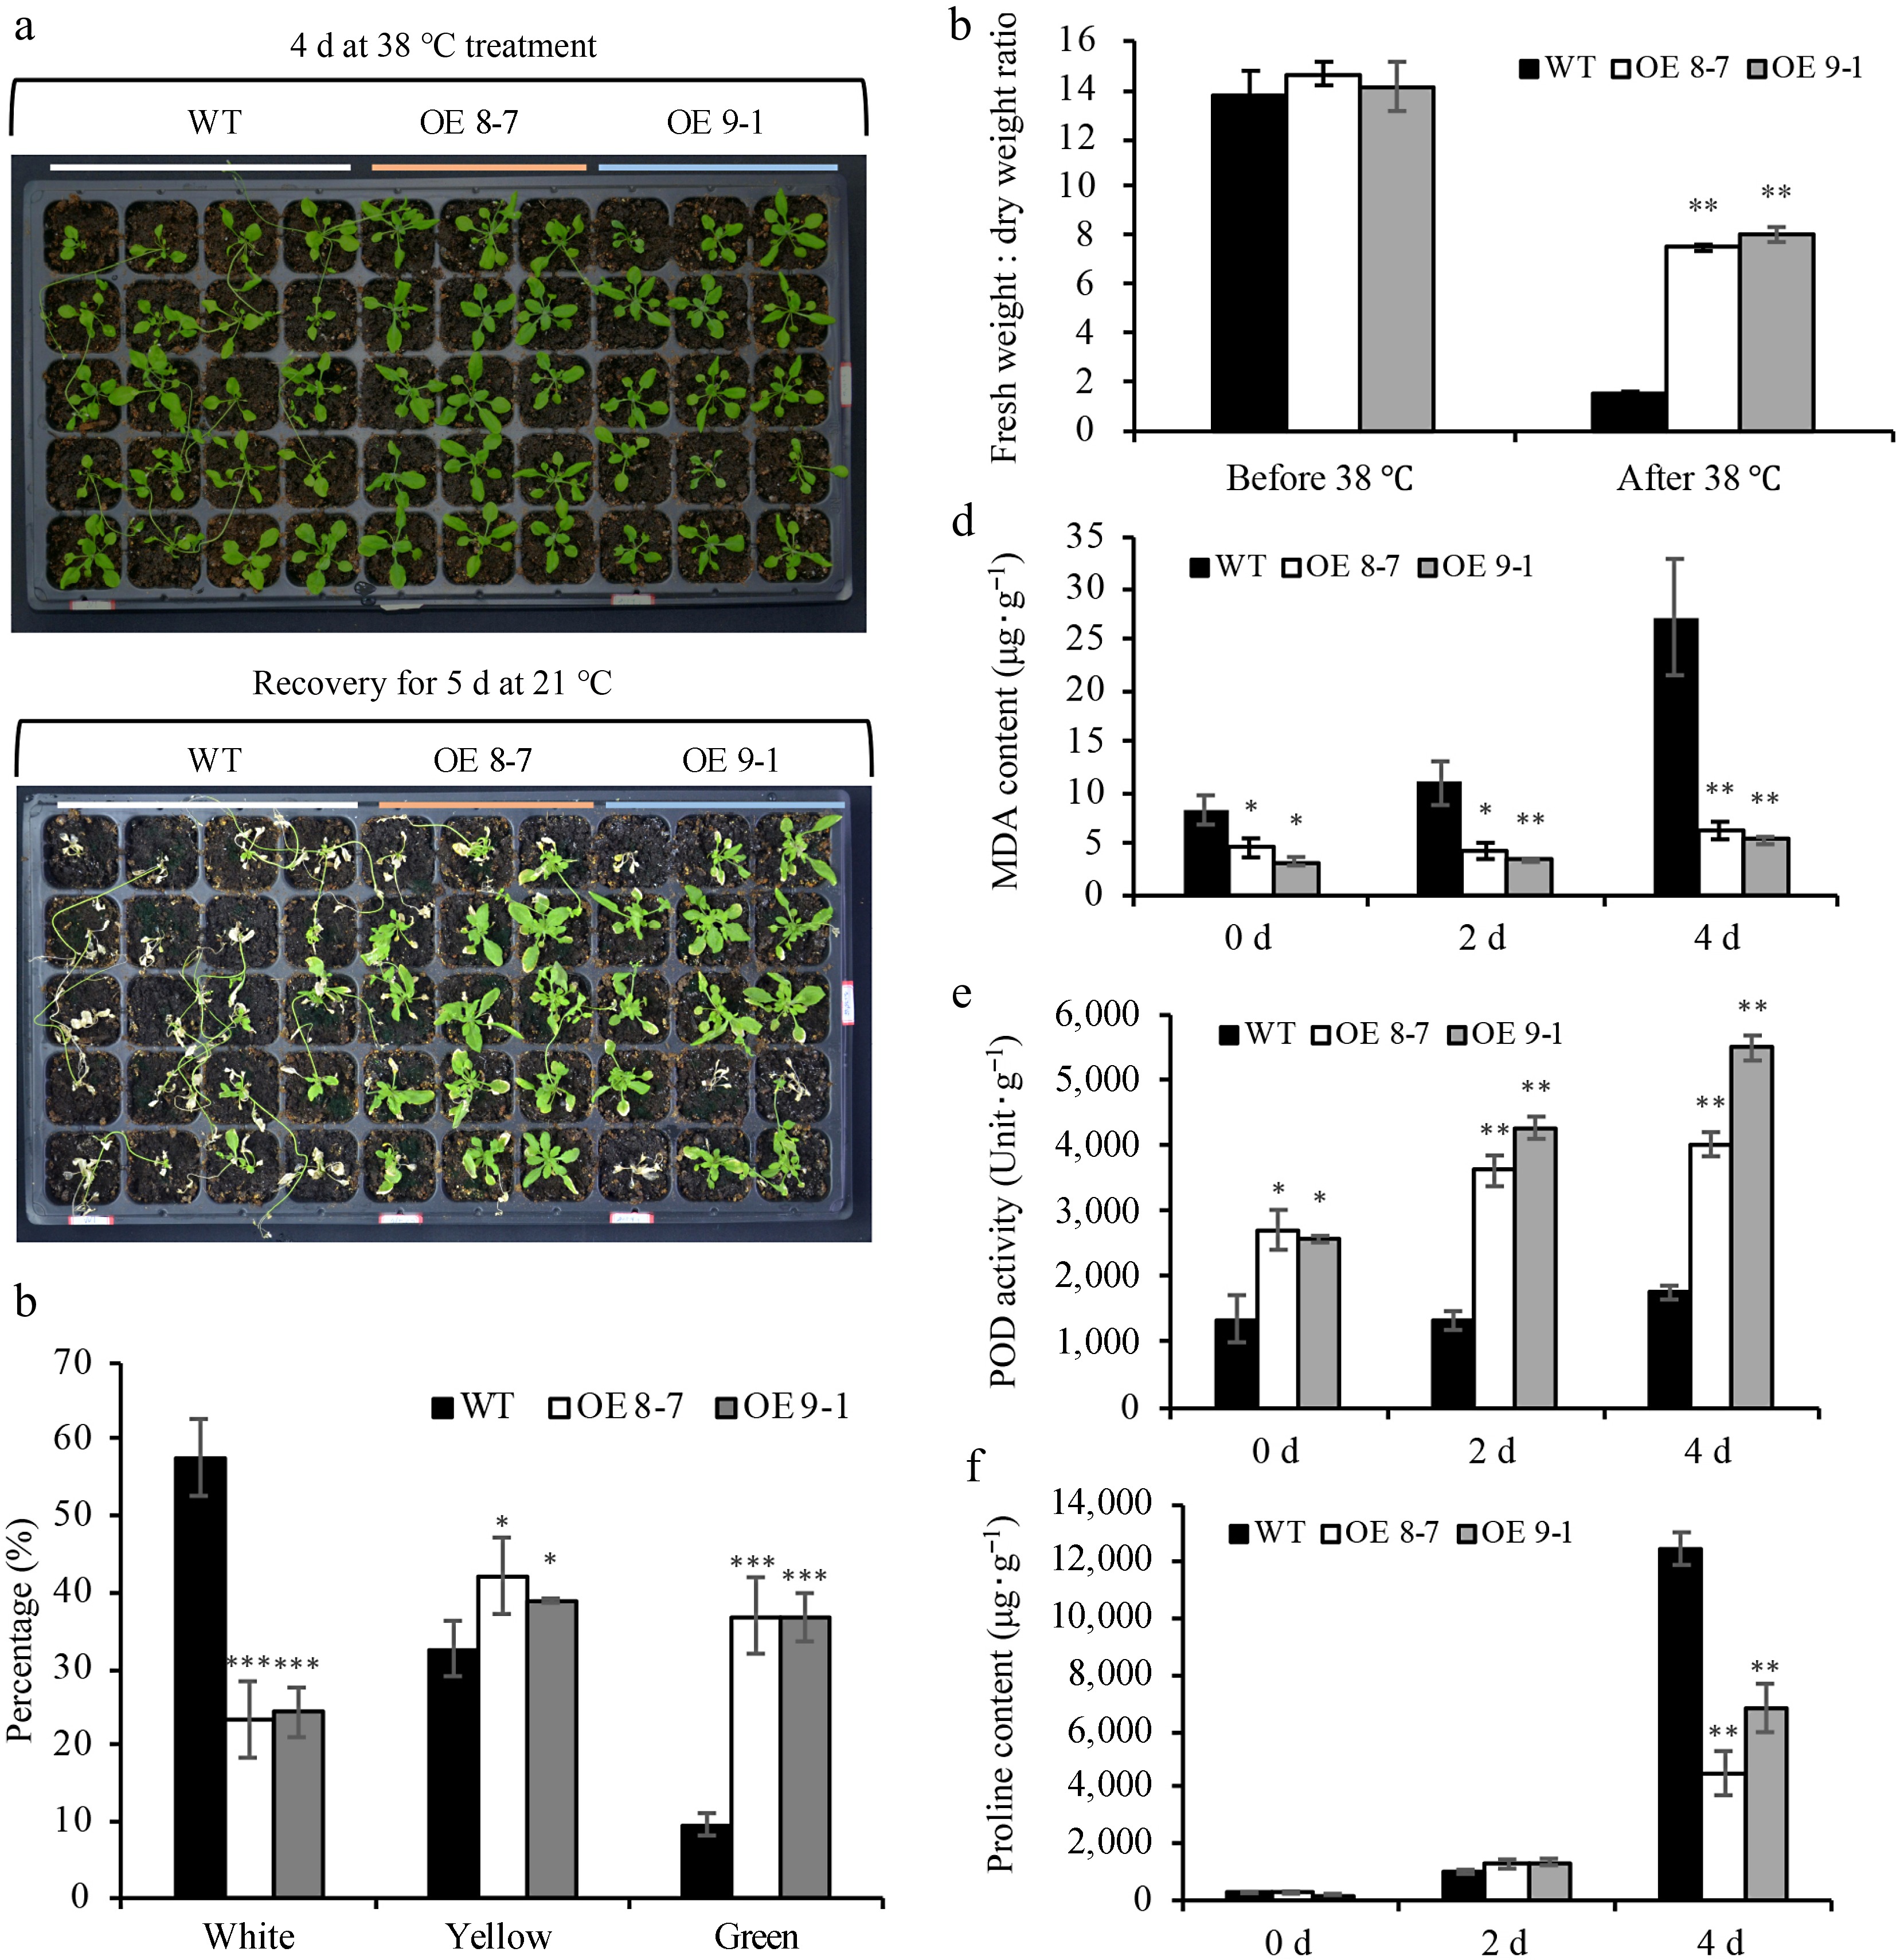
Figure 3.
Overexpressing lnc012465 lines are more tolerant to heat stress. (a) Phenotypes of WT and OE lnc012465 plants were assessed before and after exposure to heat stress. The heat treatment was applied to 25-day-old Arabidopsis plants. (b) The percentage of leaves with different colors in Arabidopsis after heat treatment and recovery for 5 d. (c) The fresh-to-dry weight ratio of Arabidopsis leaves was measured before and after 38 °C heat treatment. (d)−(f) depict the MDA content, POD activity, and proline content in Arabidopsis leaves at varying durations of heat stress. The asterisks above the bars indicate statistical significance using Student's t-test (*, p < 0.05; **, p < 0.01; ***, p < 0.001).
-
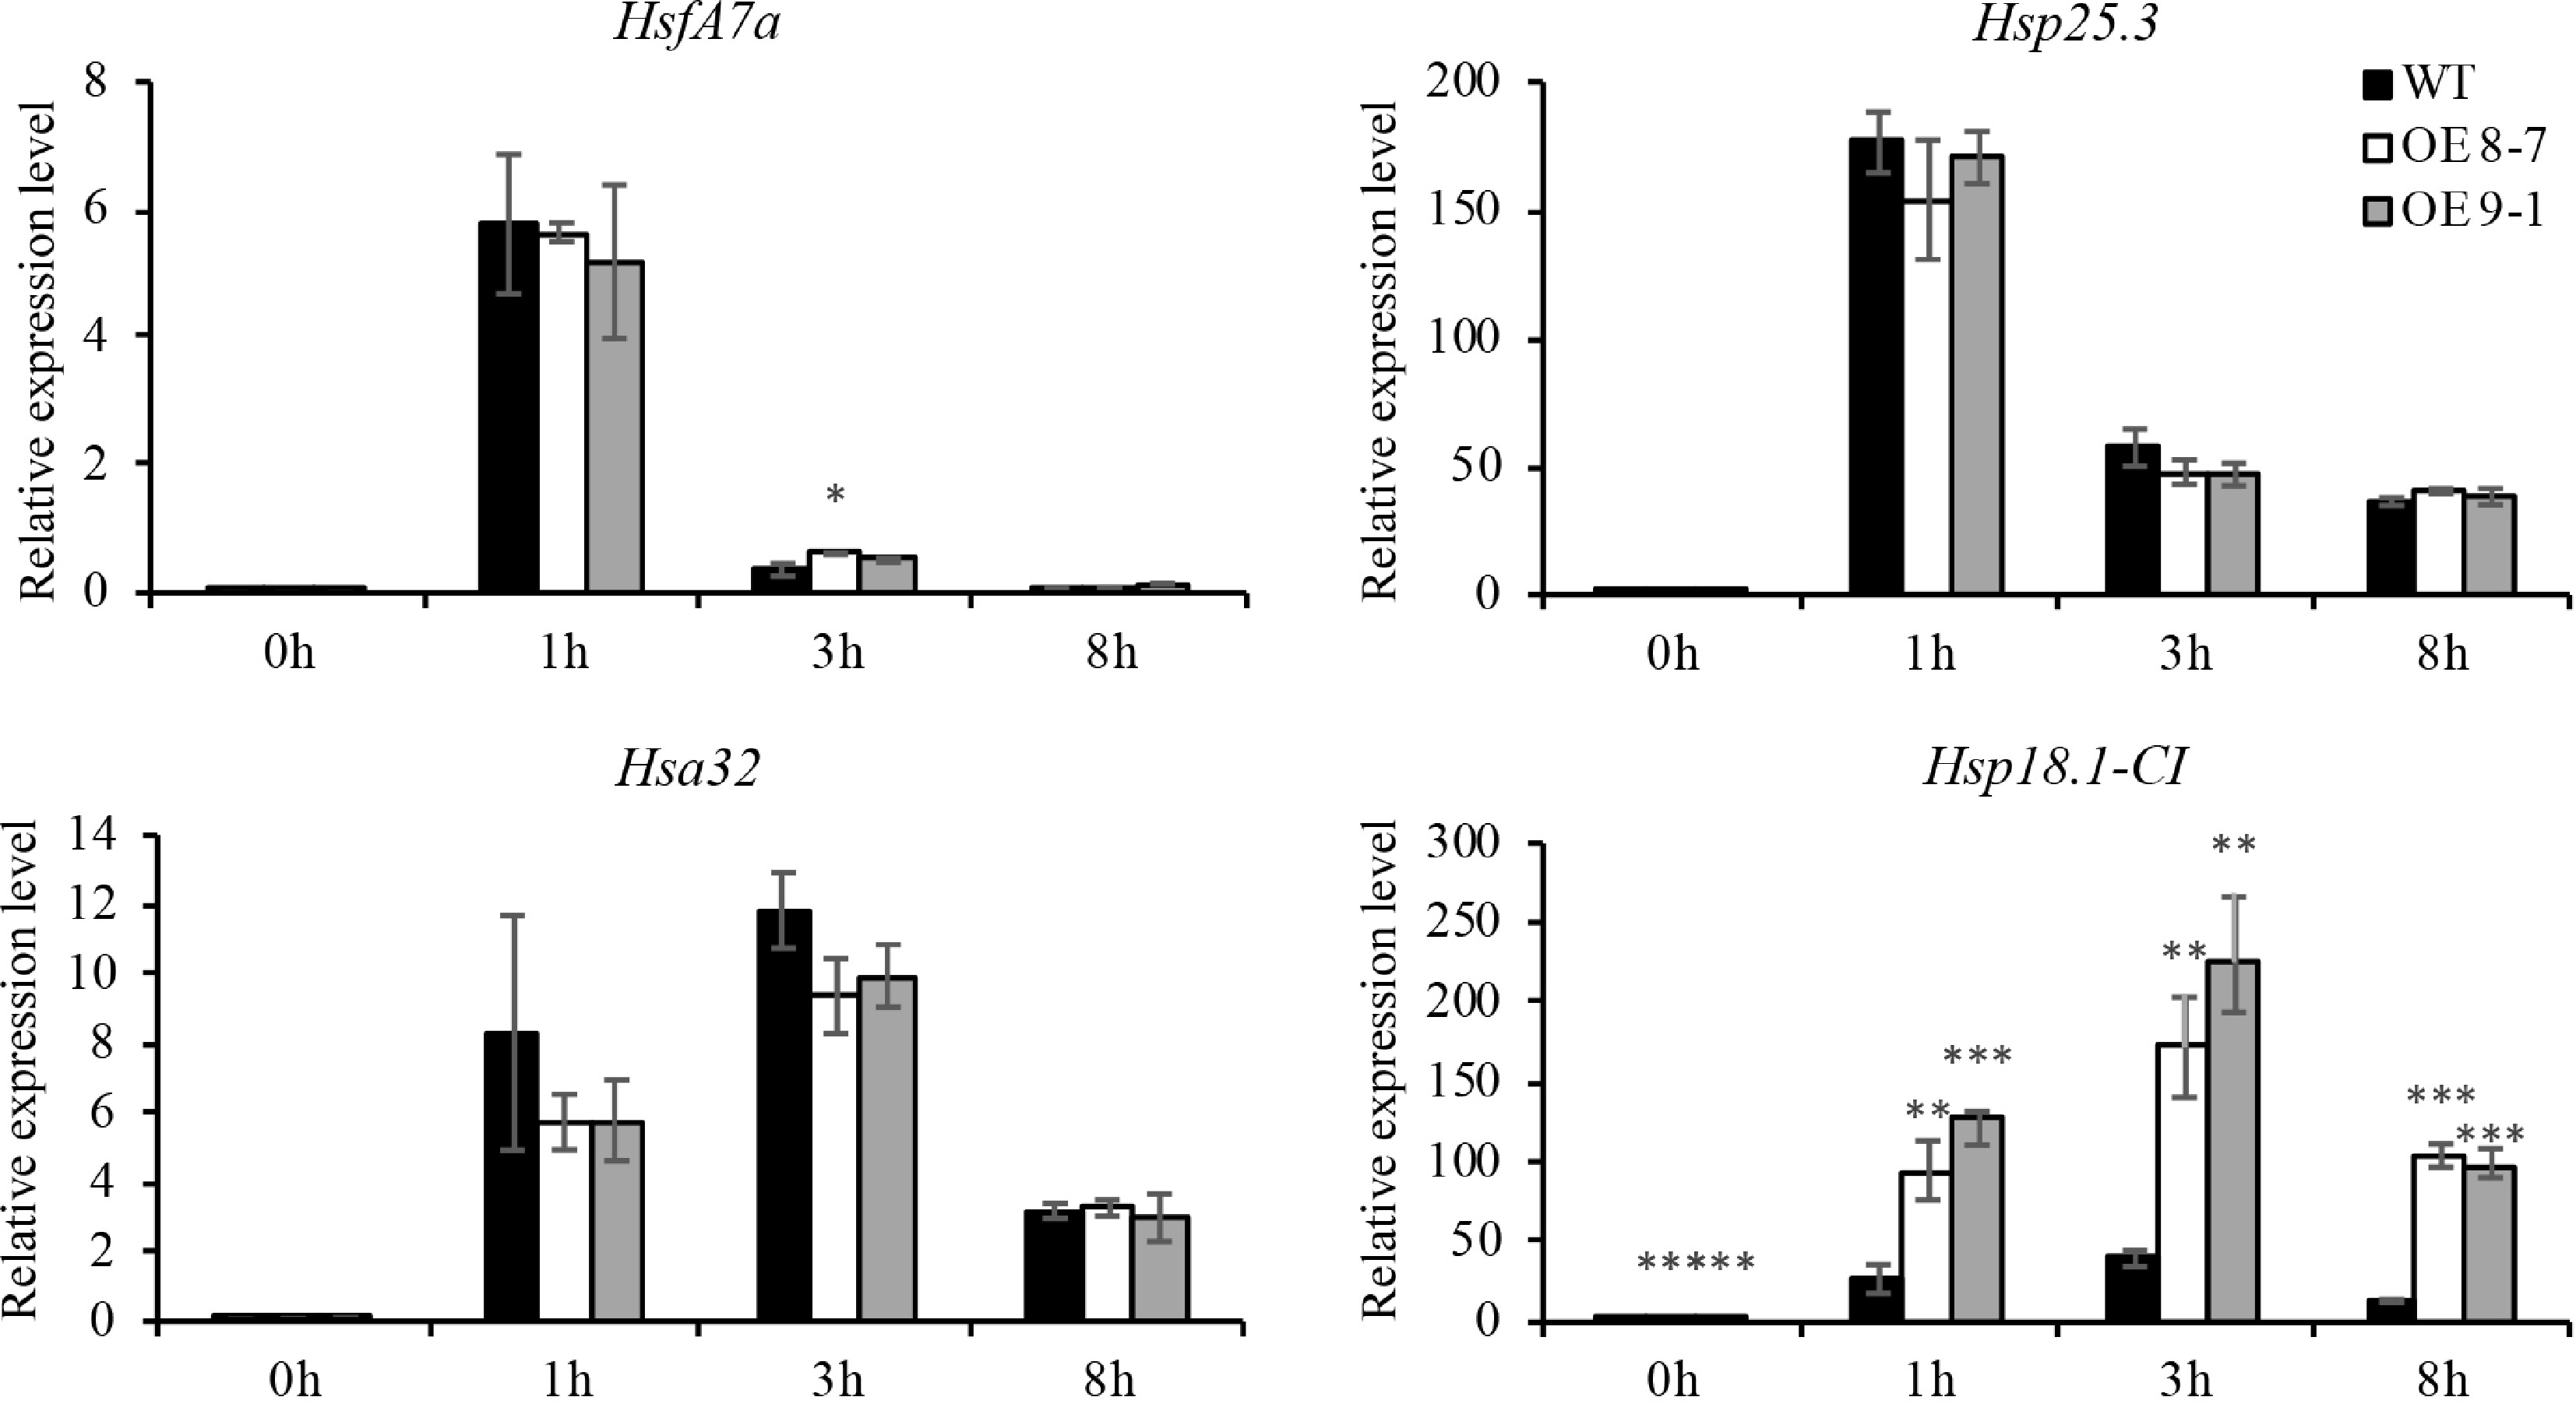
Figure 4.
The expression of HSF and HSP genes in lnc012465 overexpressing lines before and after different heat treatment times. Gene expression levels were quantified using RT-qPCR and normalized to UBC10 (At5g53300). Each value represents the mean ± standard deviation (n = 3). The asterisks above the bars indicate statistical significance using Student's t-test (*, p < 0.05; **, p < 0.01; ***, p < 0.001).
-
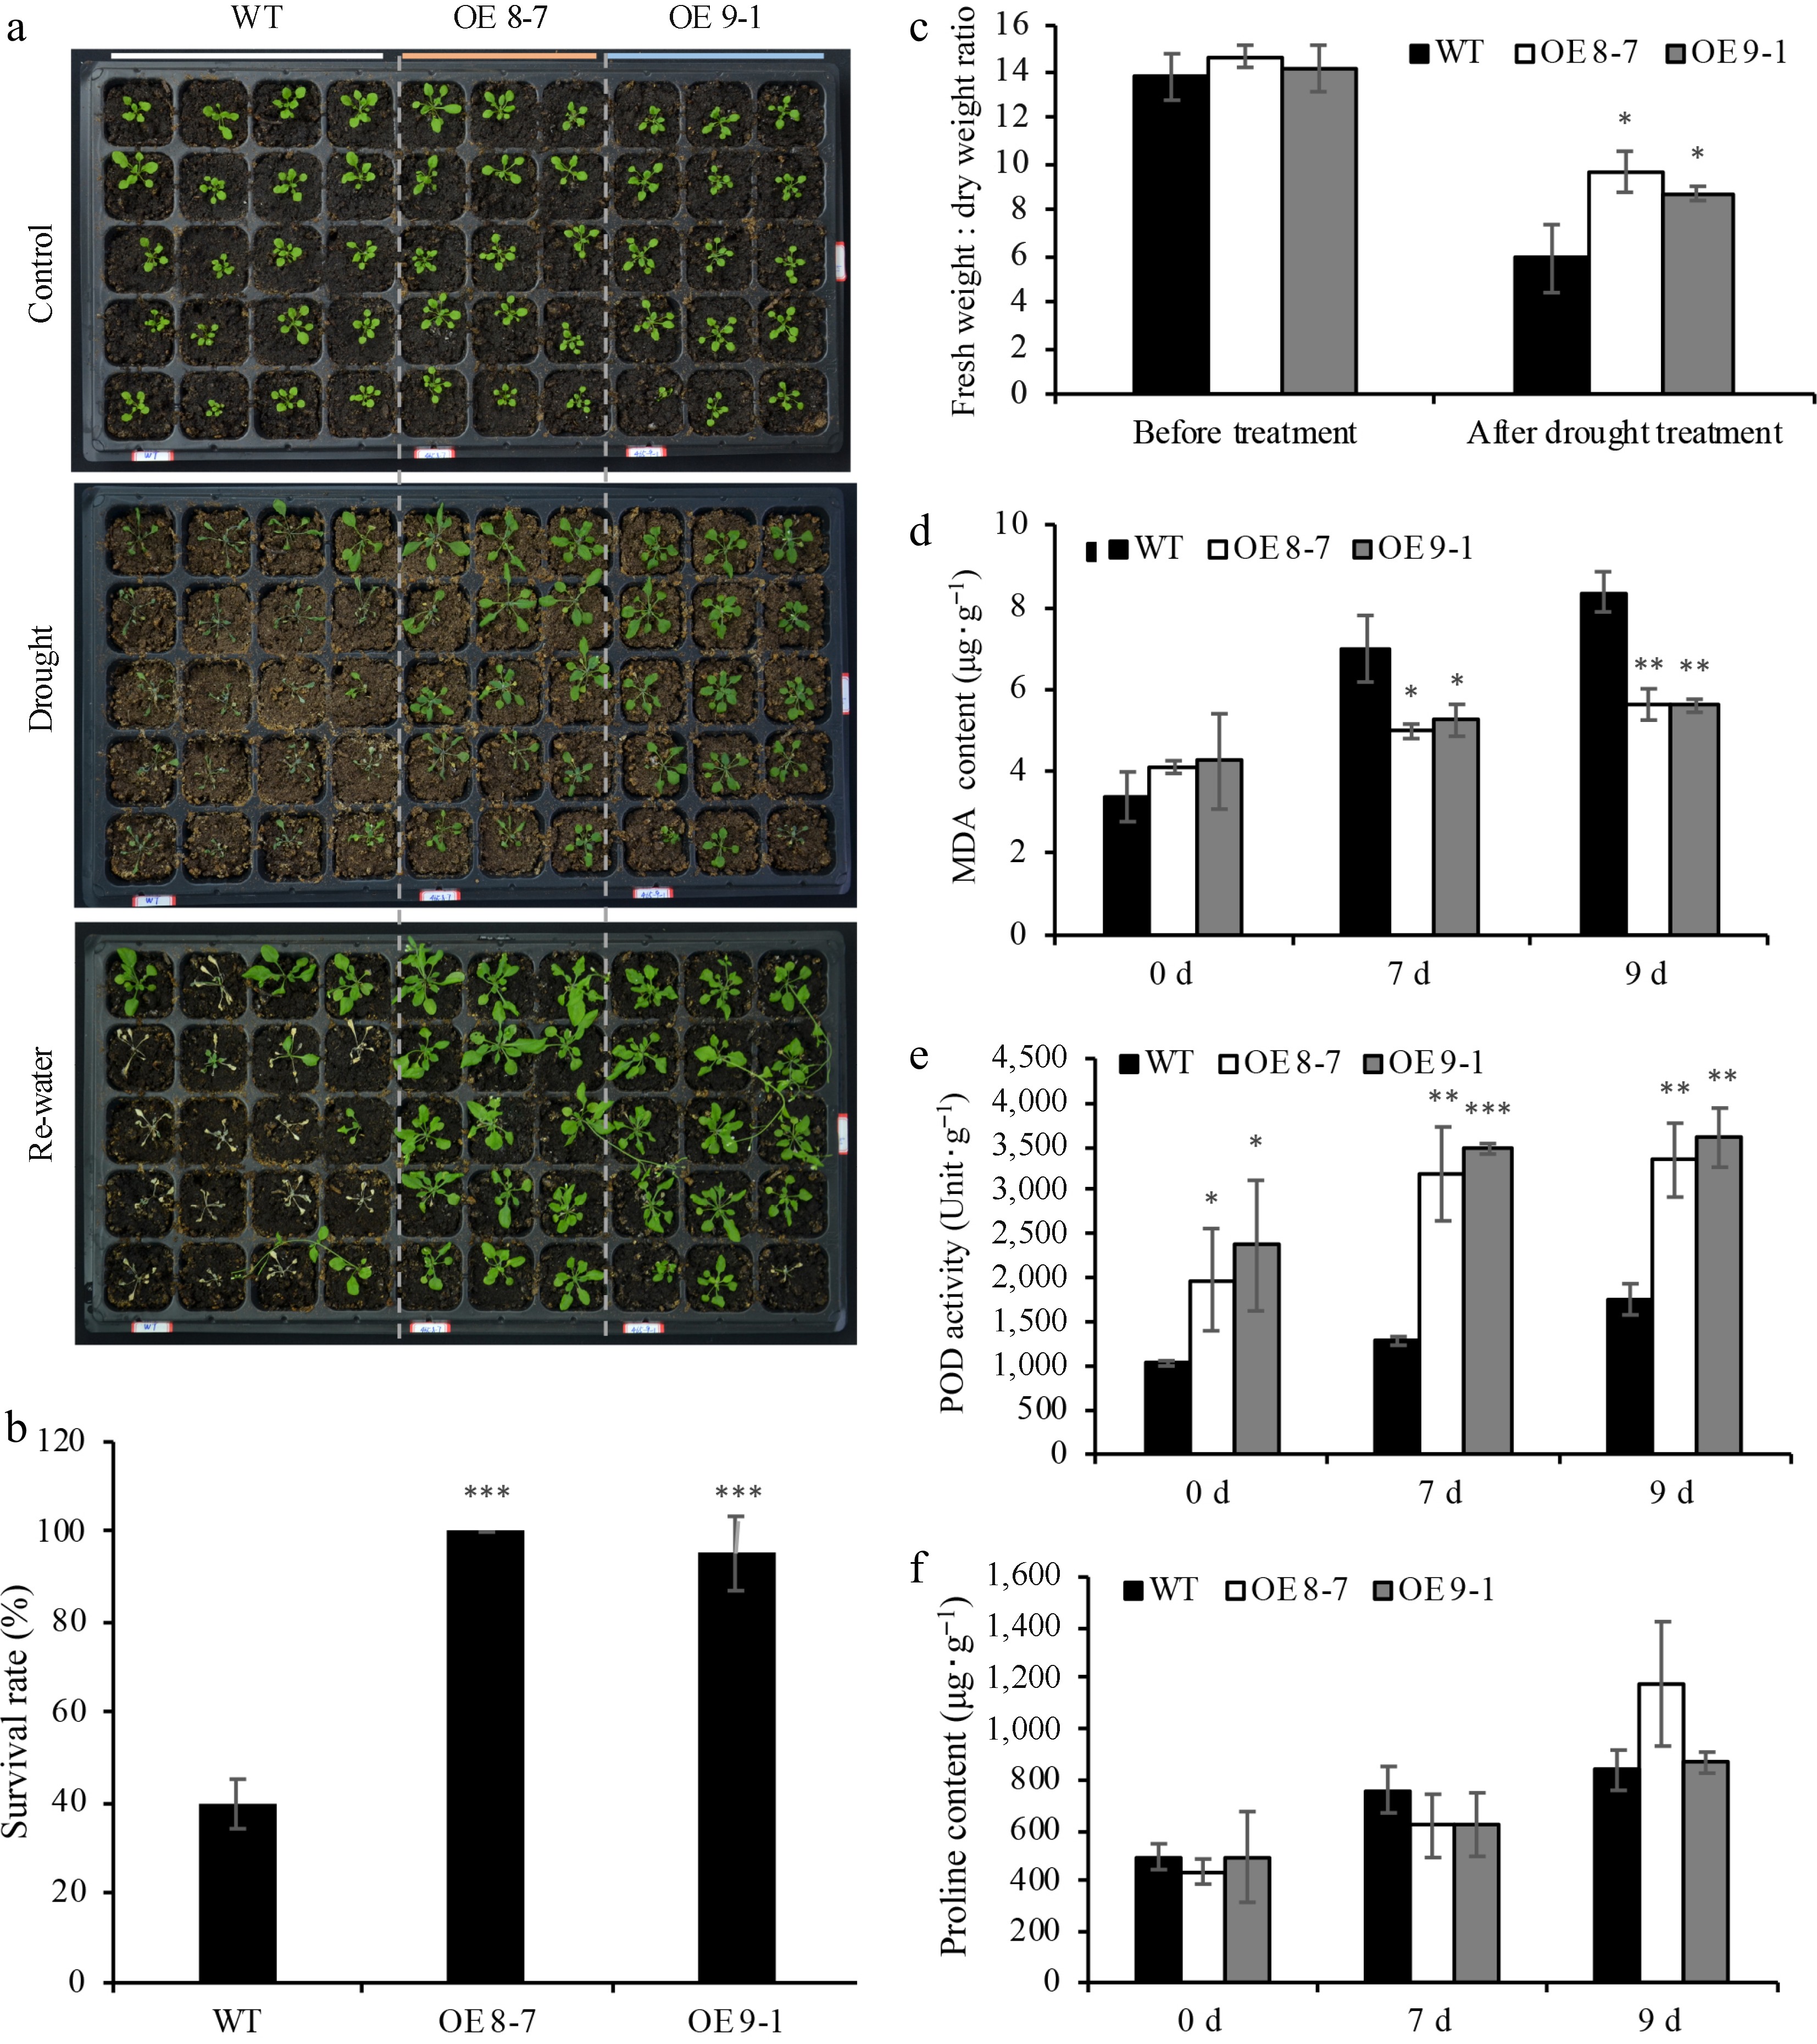
Figure 5.
Overexpressing lnc012465 lines are more tolerant to drought stress. (a) Phenotype of WT and OE lnc012465 plants before and after subjecting to drought stress. Drought treatment was carried out on 20-day-old Arabidopsis plants. (b) The percentage of leaves with different colors in Arabidopsis after heat treatment and recovery for 5 d. (c) The fresh weight to dry weight ratio of Arabidopsis leaves before and after undergoing 38 °C heat treatment. (d)−(f) MDA content, POD activity, and proline content in Arabidopsis leaves under different times of heat stress. The asterisks above the bars indicate statistical significance using Student's t-test (*, p < 0.05; **, p < 0.01; ***, p < 0.001)
-
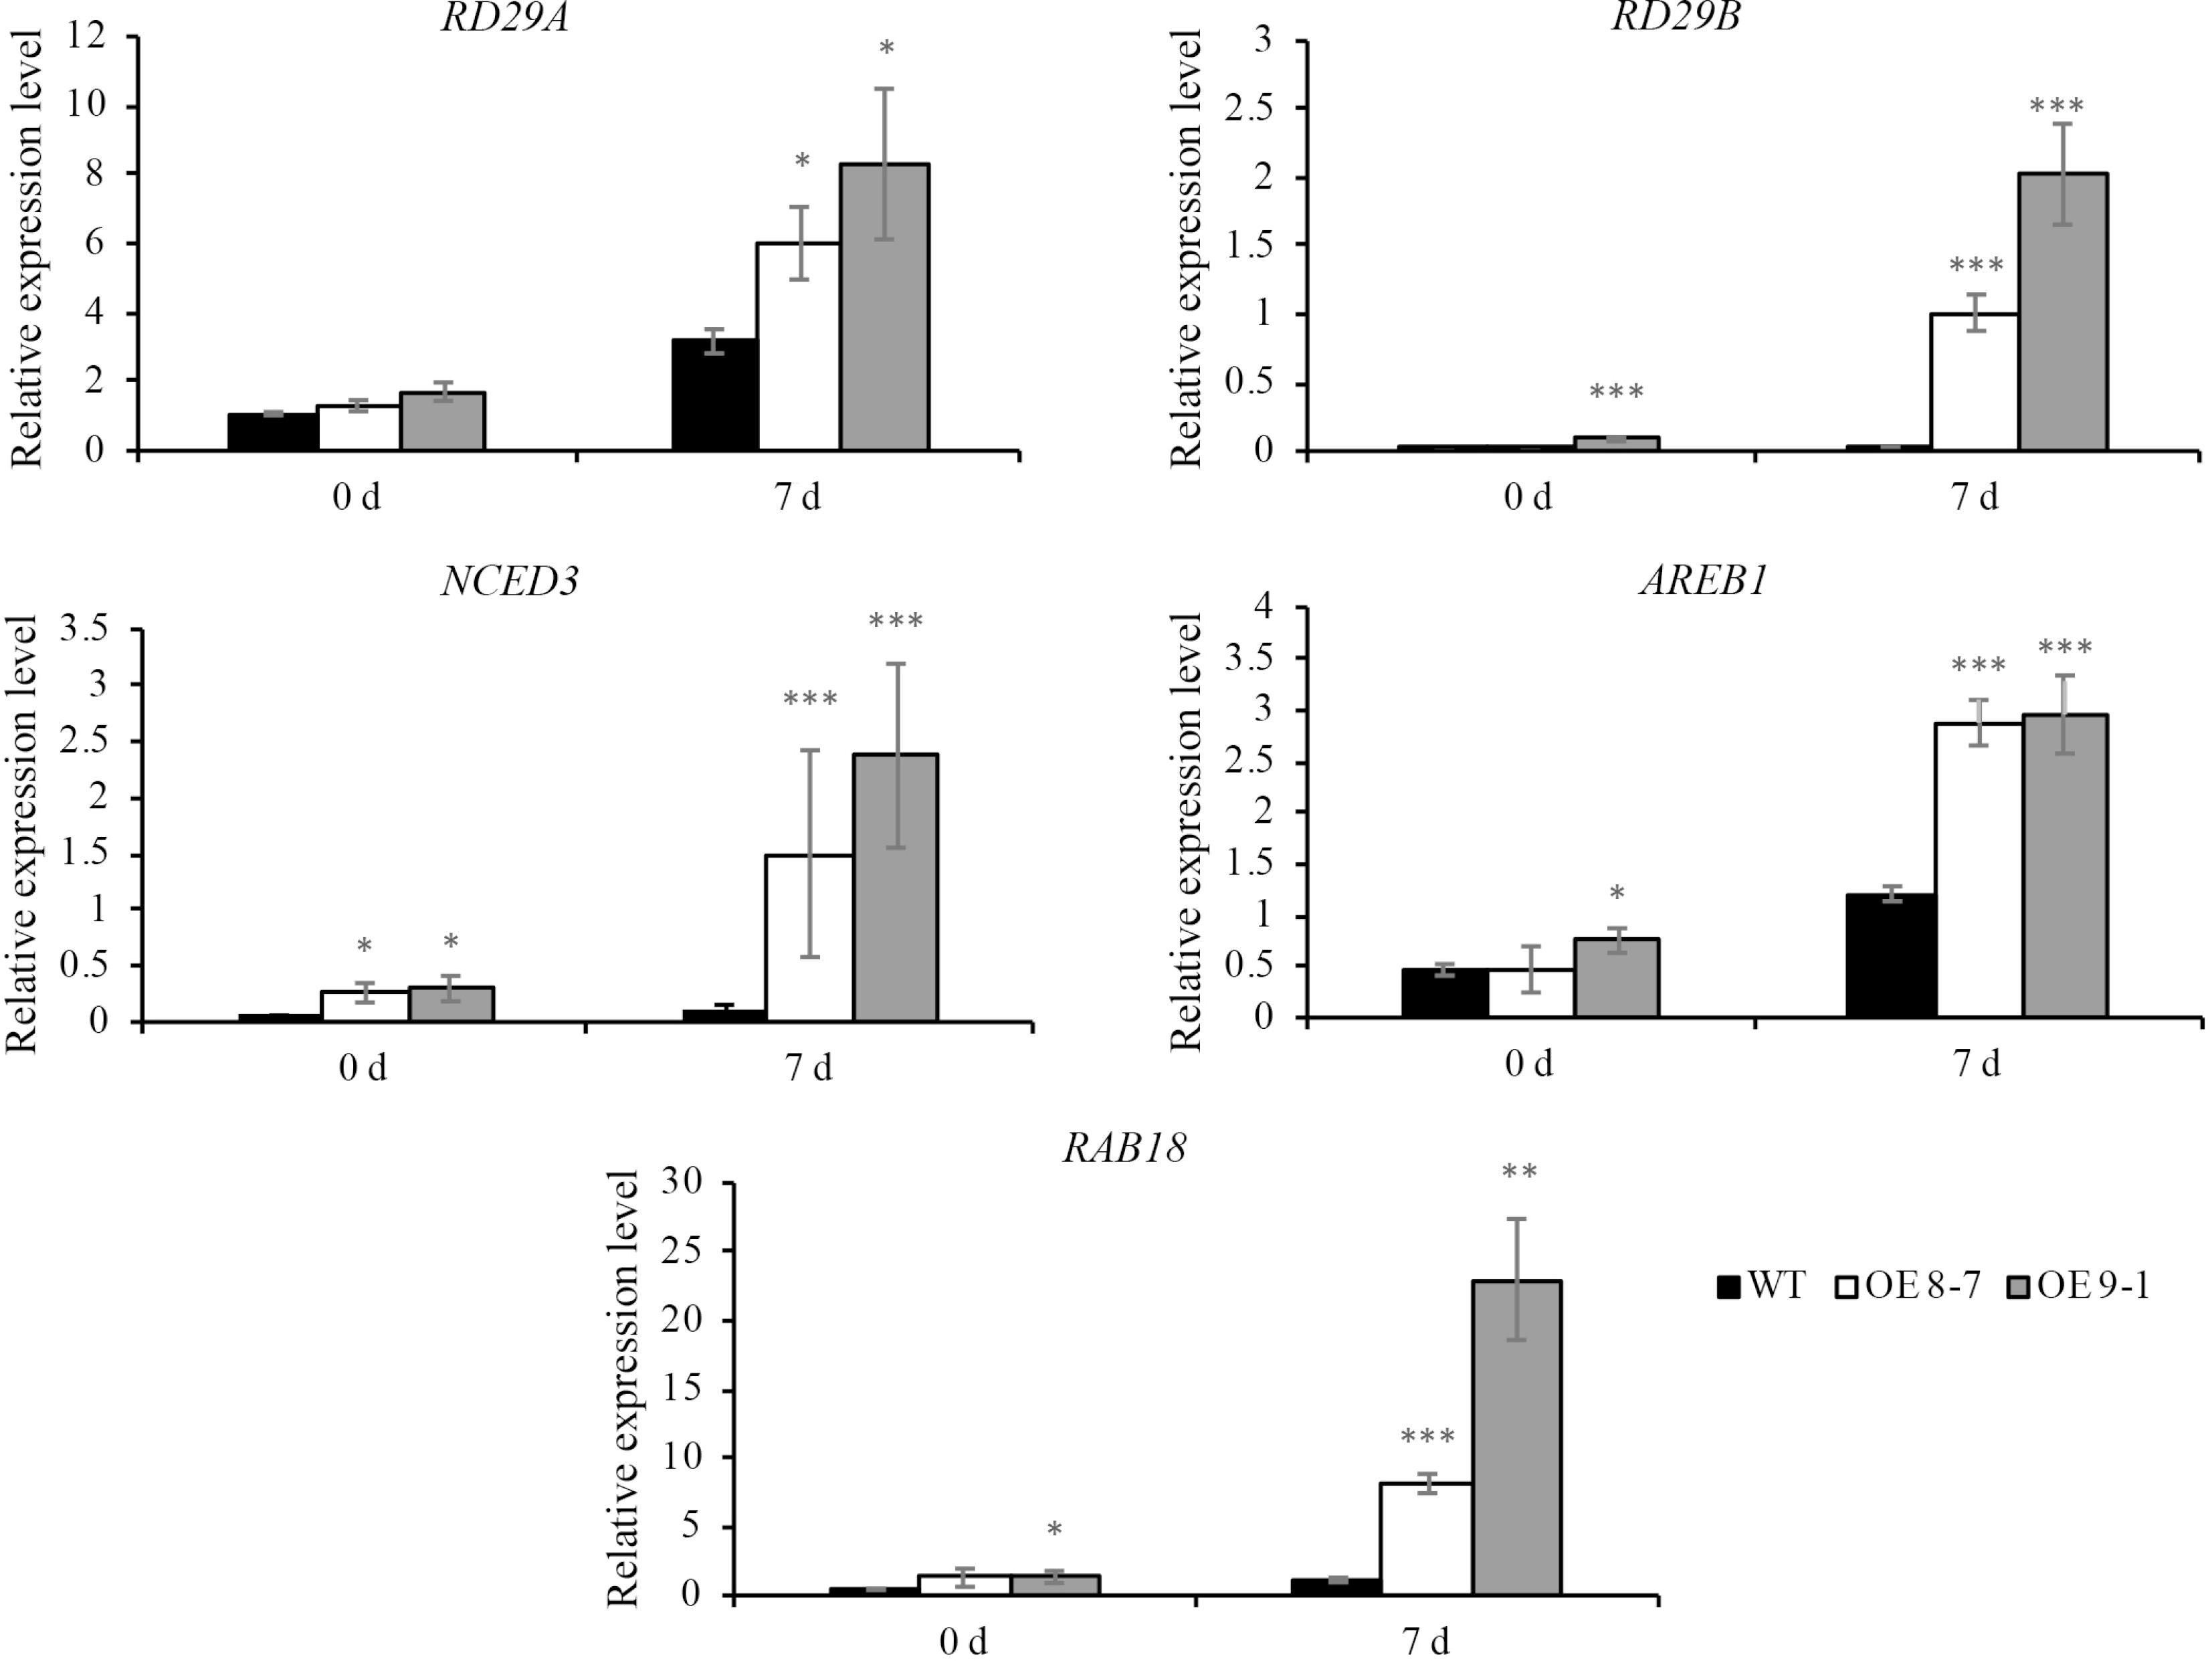
Figure 6.
The expression of drought-responsive genes in lnc012465 overexpressing lines before and after different drought treatment time. Gene expression levels were determined by qRT-PCR normalized against UBC10 (At5g53300). Each value is mean ± sd (n = 3). The asterisks above the bars indicate statistical significance using Student's t-test (*, p < 0.05; **, p < 0.01; ***, p < 0.001).
Figures
(6)
Tables
(0)