-
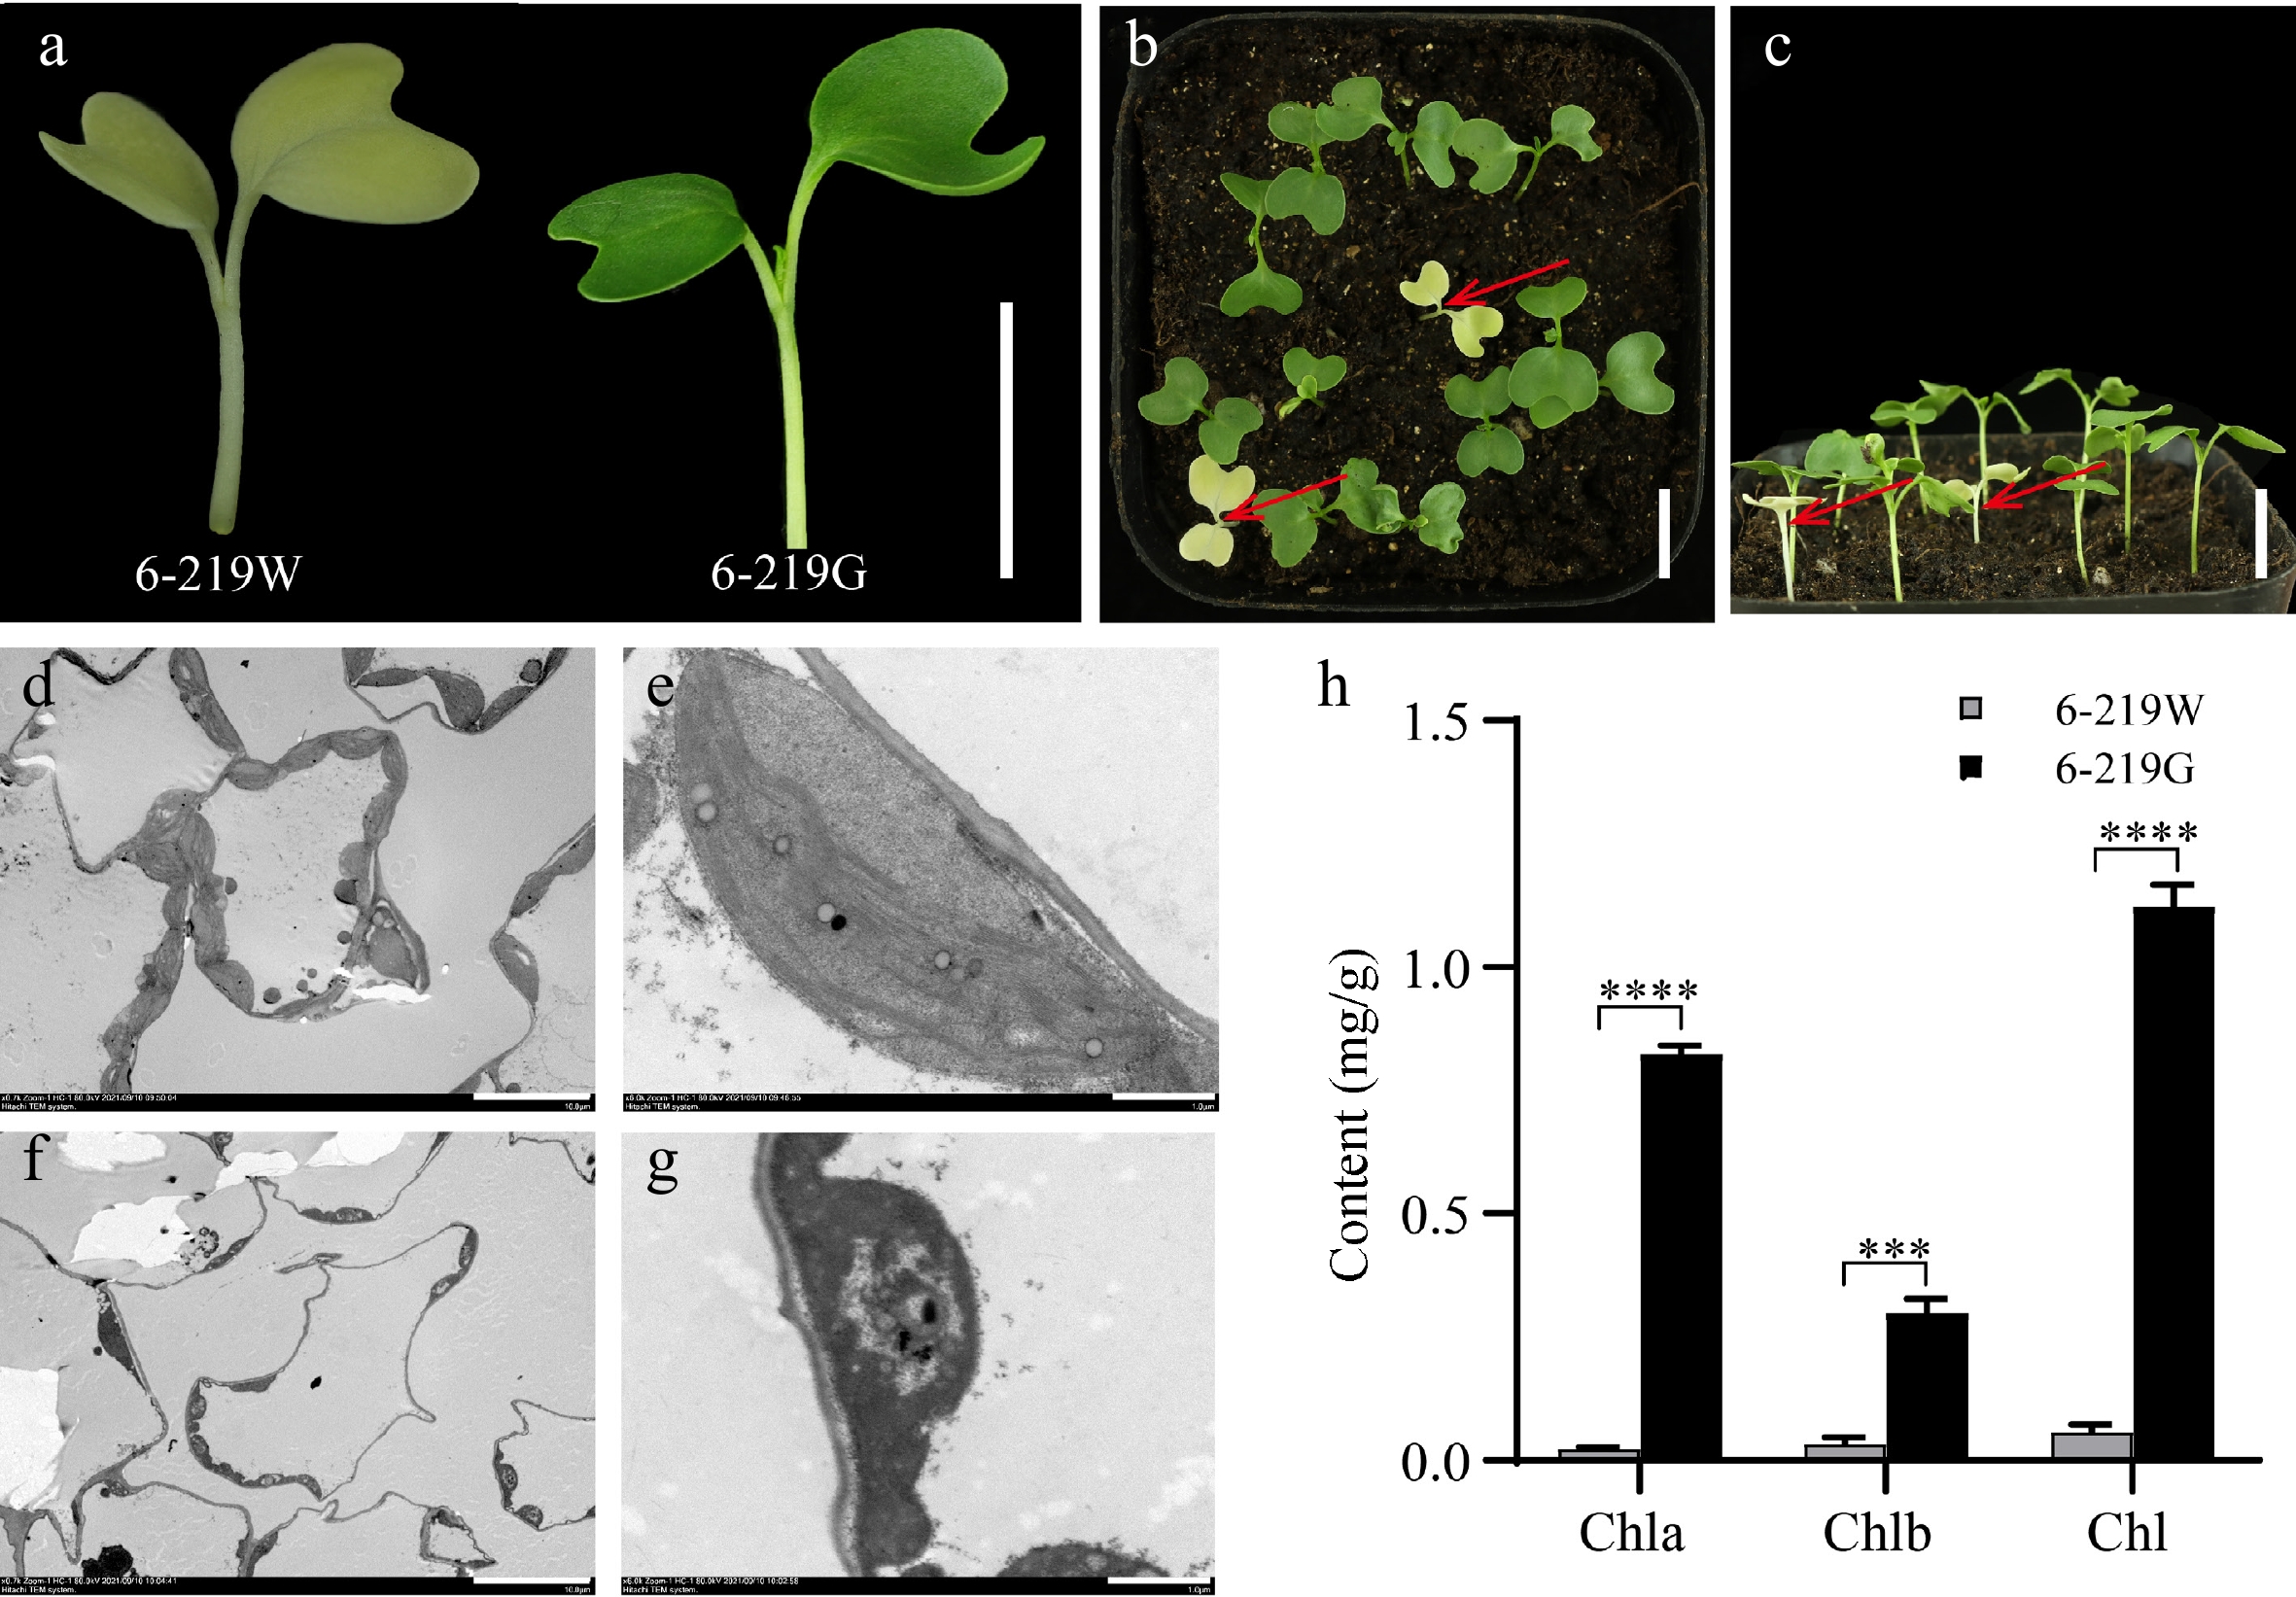
Figure 1.
Phenotypic characterization of wild-type 6-219W and mutant 6-219G. (a) 7-day-old seedlings of 6-219W and 6-219G. (b), (c) 10-day-old seedlings of 6-219W and 6-219G. The red arrows point to 6-219W. (d), (e) Ultrastructure of chloroplasts in 6-219G. (f), (g) Ultrastructure of chloroplasts in the albino 6-219W. Transmission electron microscopy was carried out on 7-day-old leaves of 6-219W and 6-219G. (h) Chlorophyll a (Chla), chlorophyll b (Chlb), and total chlorophyll (Chl) content in the 6-219W and 6-219G groups. The asterisk represents the magnitude of the difference: *** p < 0.001 and **** p < 0.0001. Scale bars: (a)−(c) 1 cm; (e), (g) 10 μm; (f), (h) 1 μm.
-
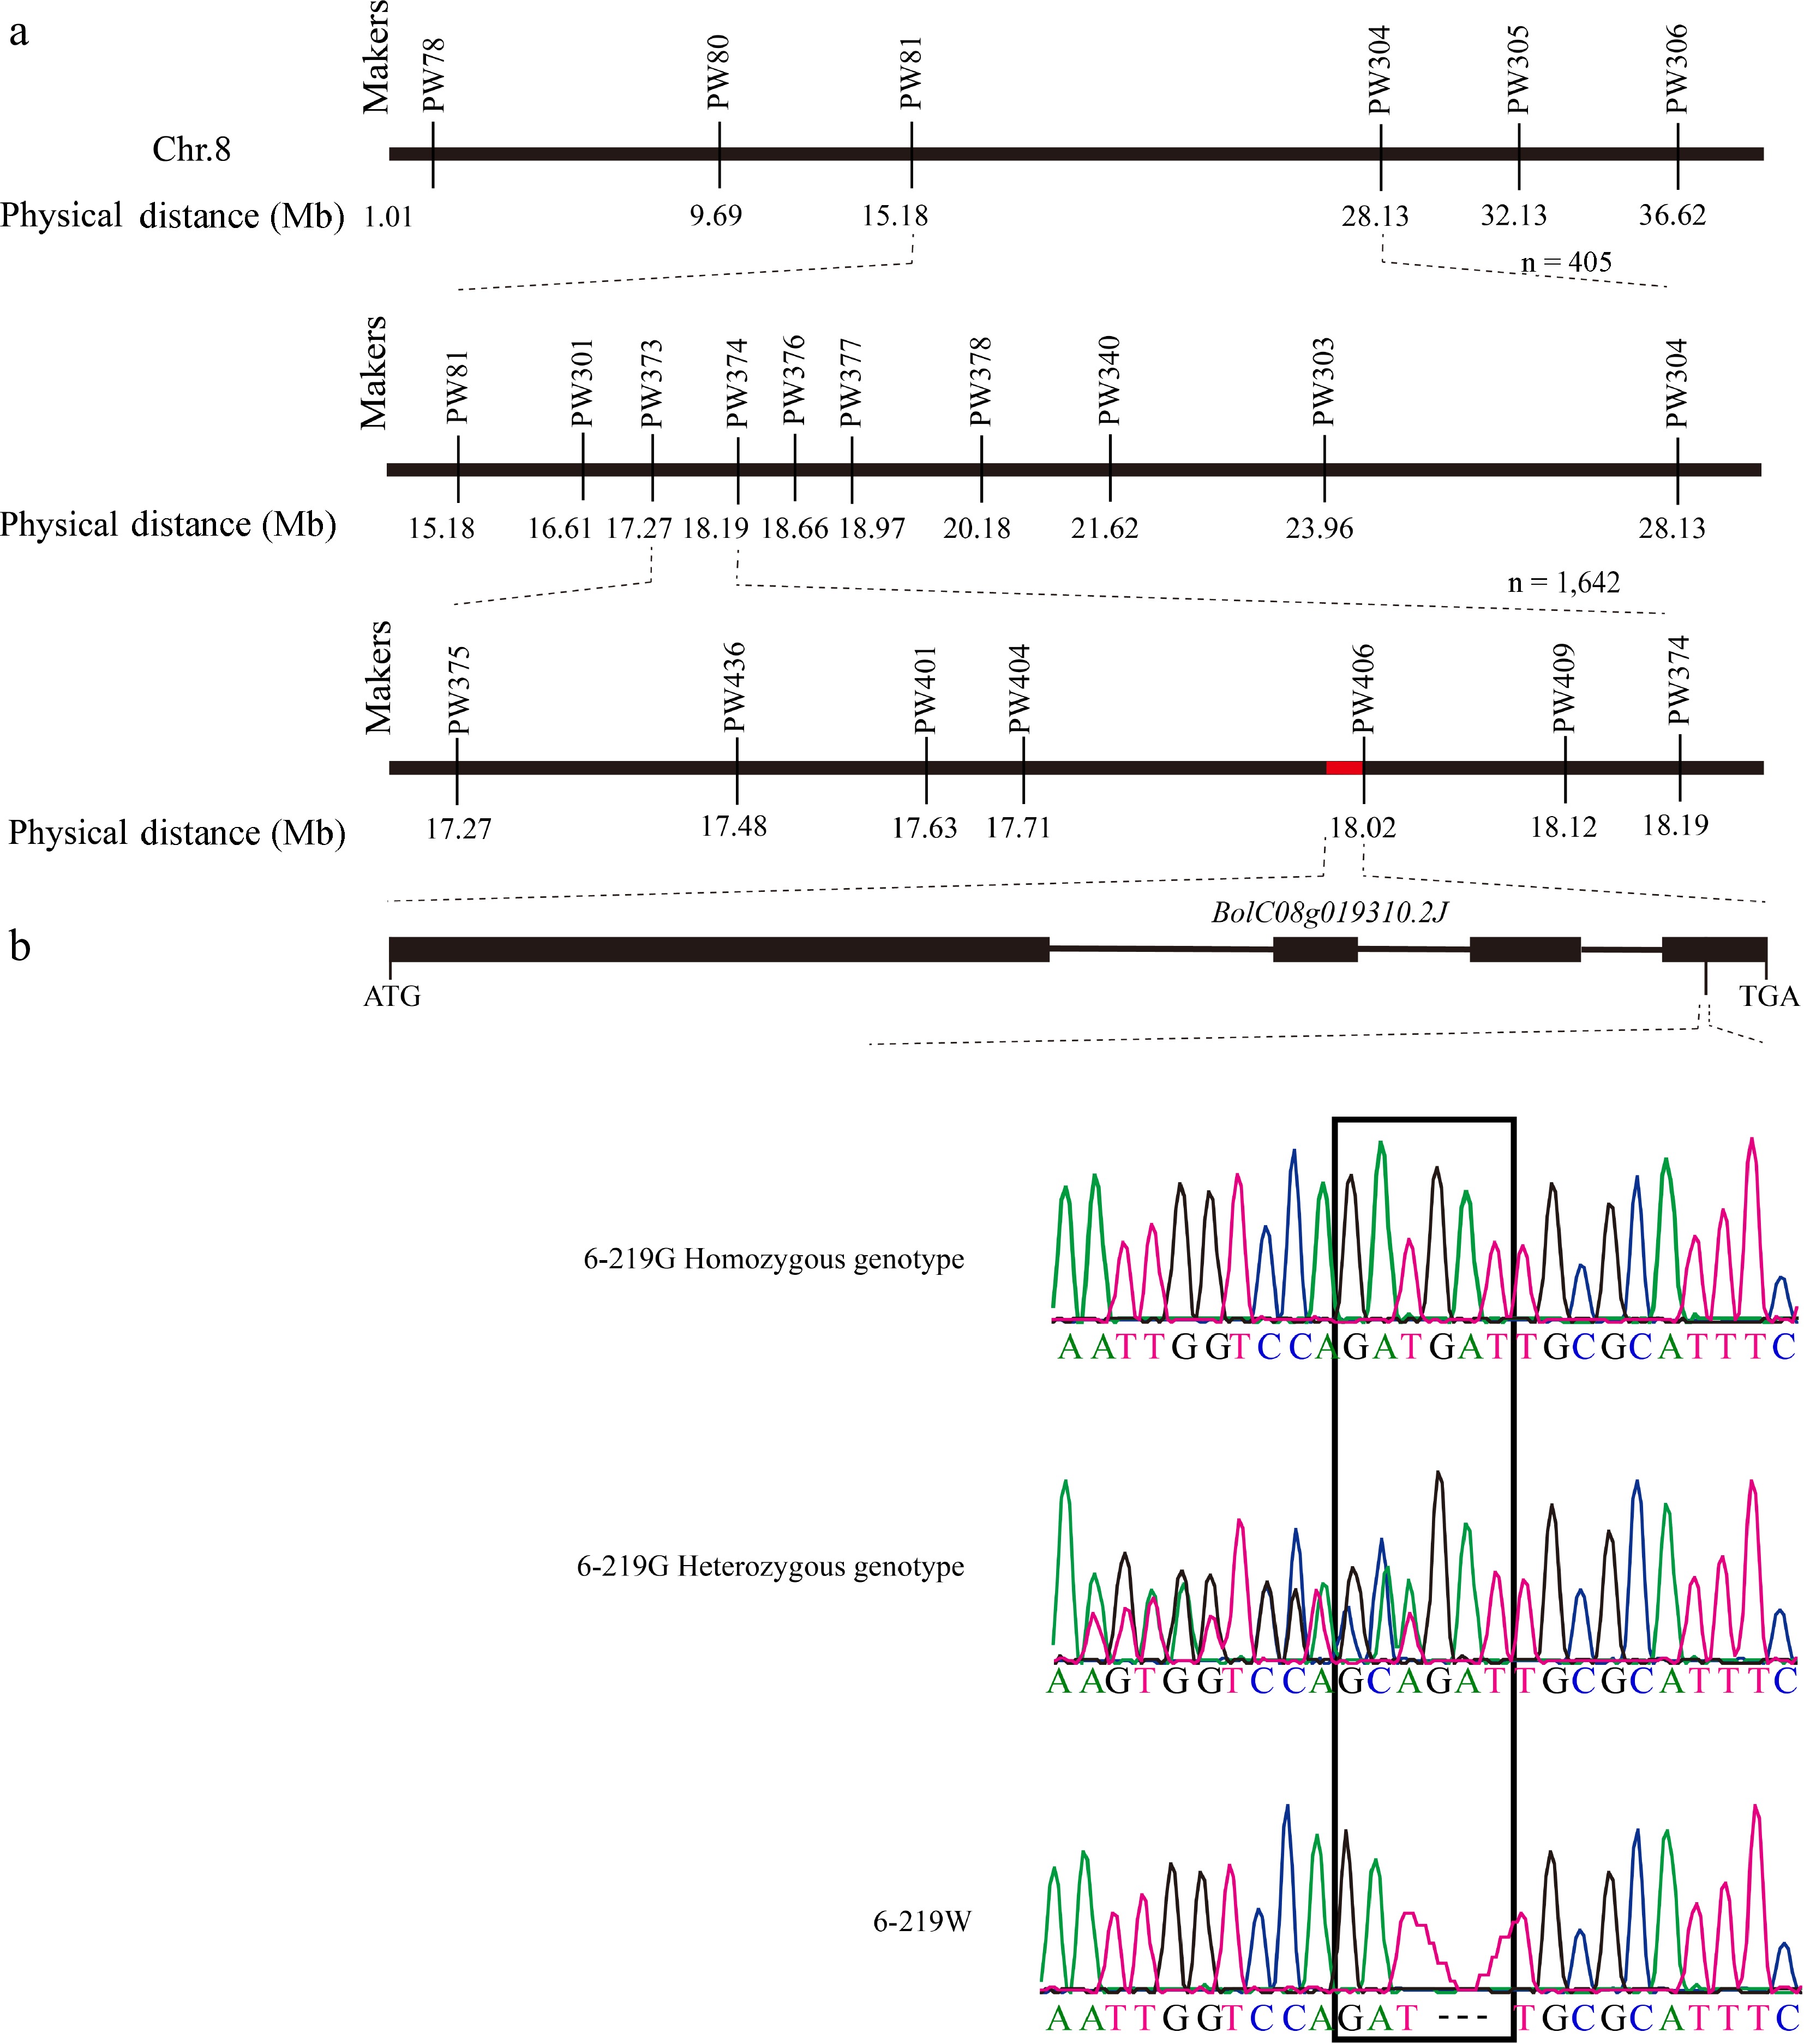
Figure 2.
Map-based cloning of BoAP1. (a) Fine mapping of BoAP1 with InDel markers. The solid red rectangle represents the position of BolC08g019310.2J. (b) The schematic diagram depicts the exons (solid black boxes) and introns (black lines) of BoAP1. The nucleotide sequence and sequence mapping show the point mutation in 6-219W. The black frame represents the location of the boap1 mutation.
-
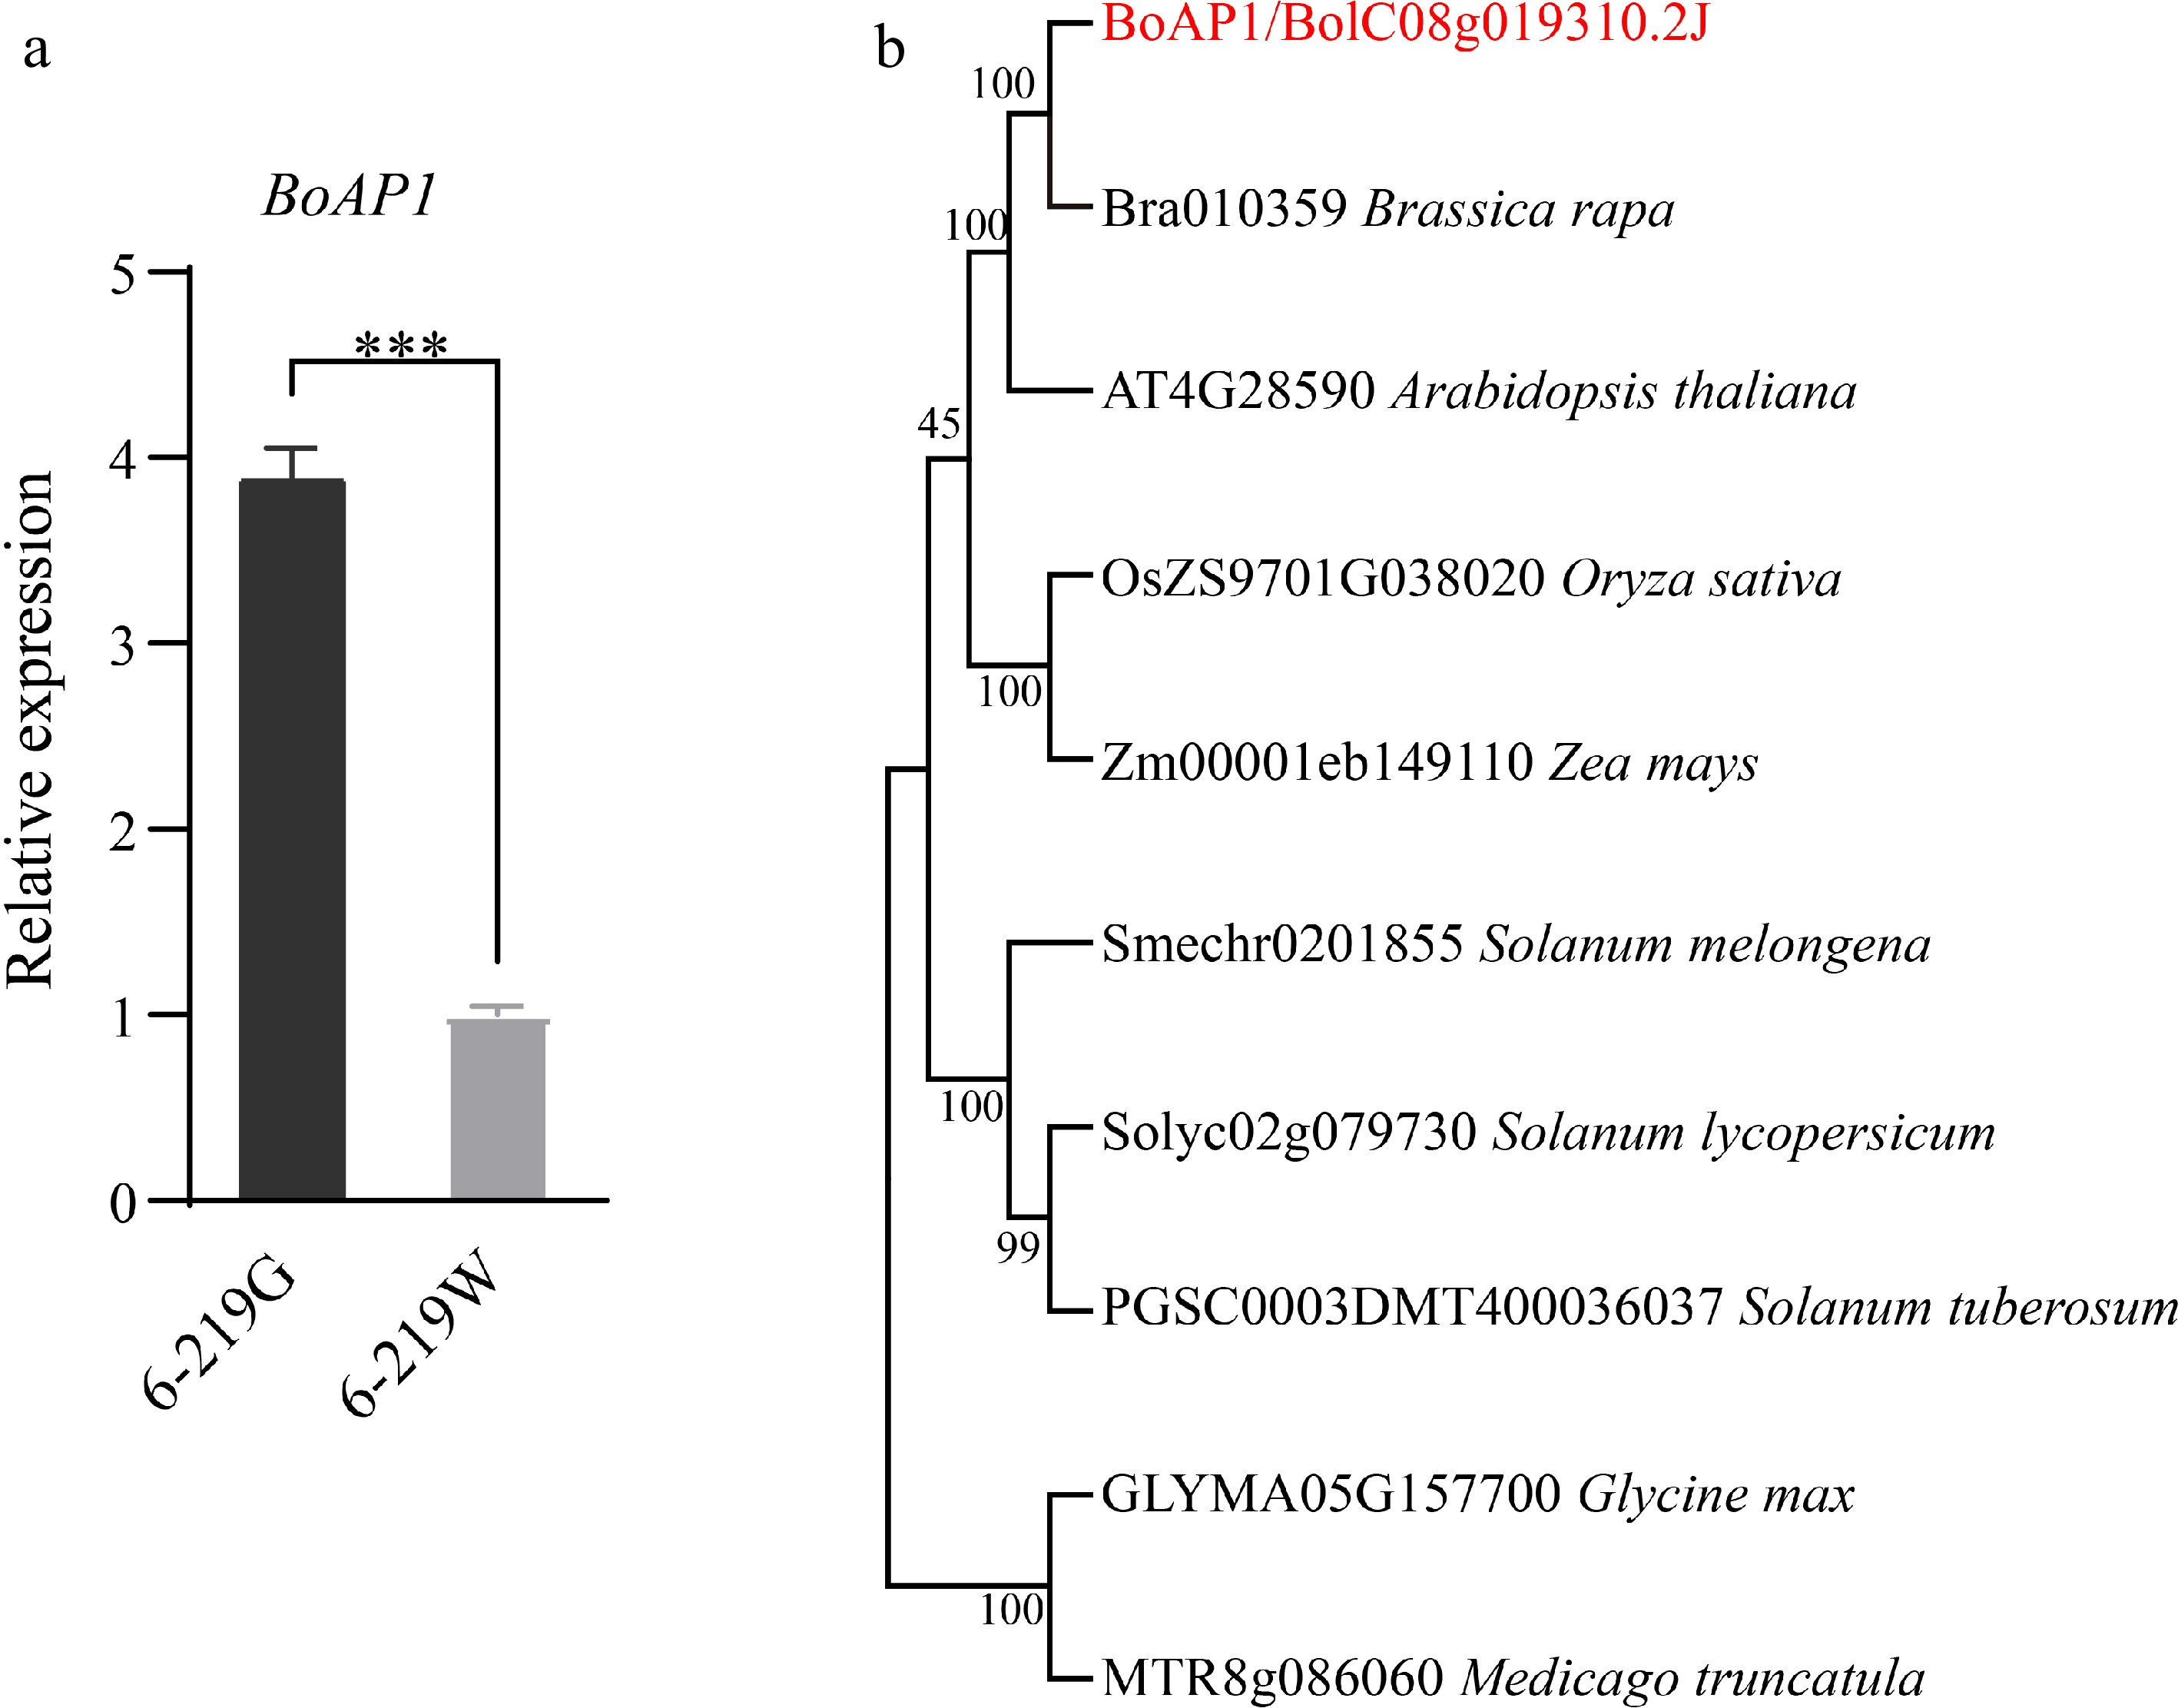
Figure 3.
Gene expression patterns of BoAP1. (a) Expression levels of BoAP1 in the 6-219G and 6-219W. The asterisk represents the magnitude of the difference (***, p < 0.001). (b) Phylogenetic analysis of BoAP1 and its related proteins.
-
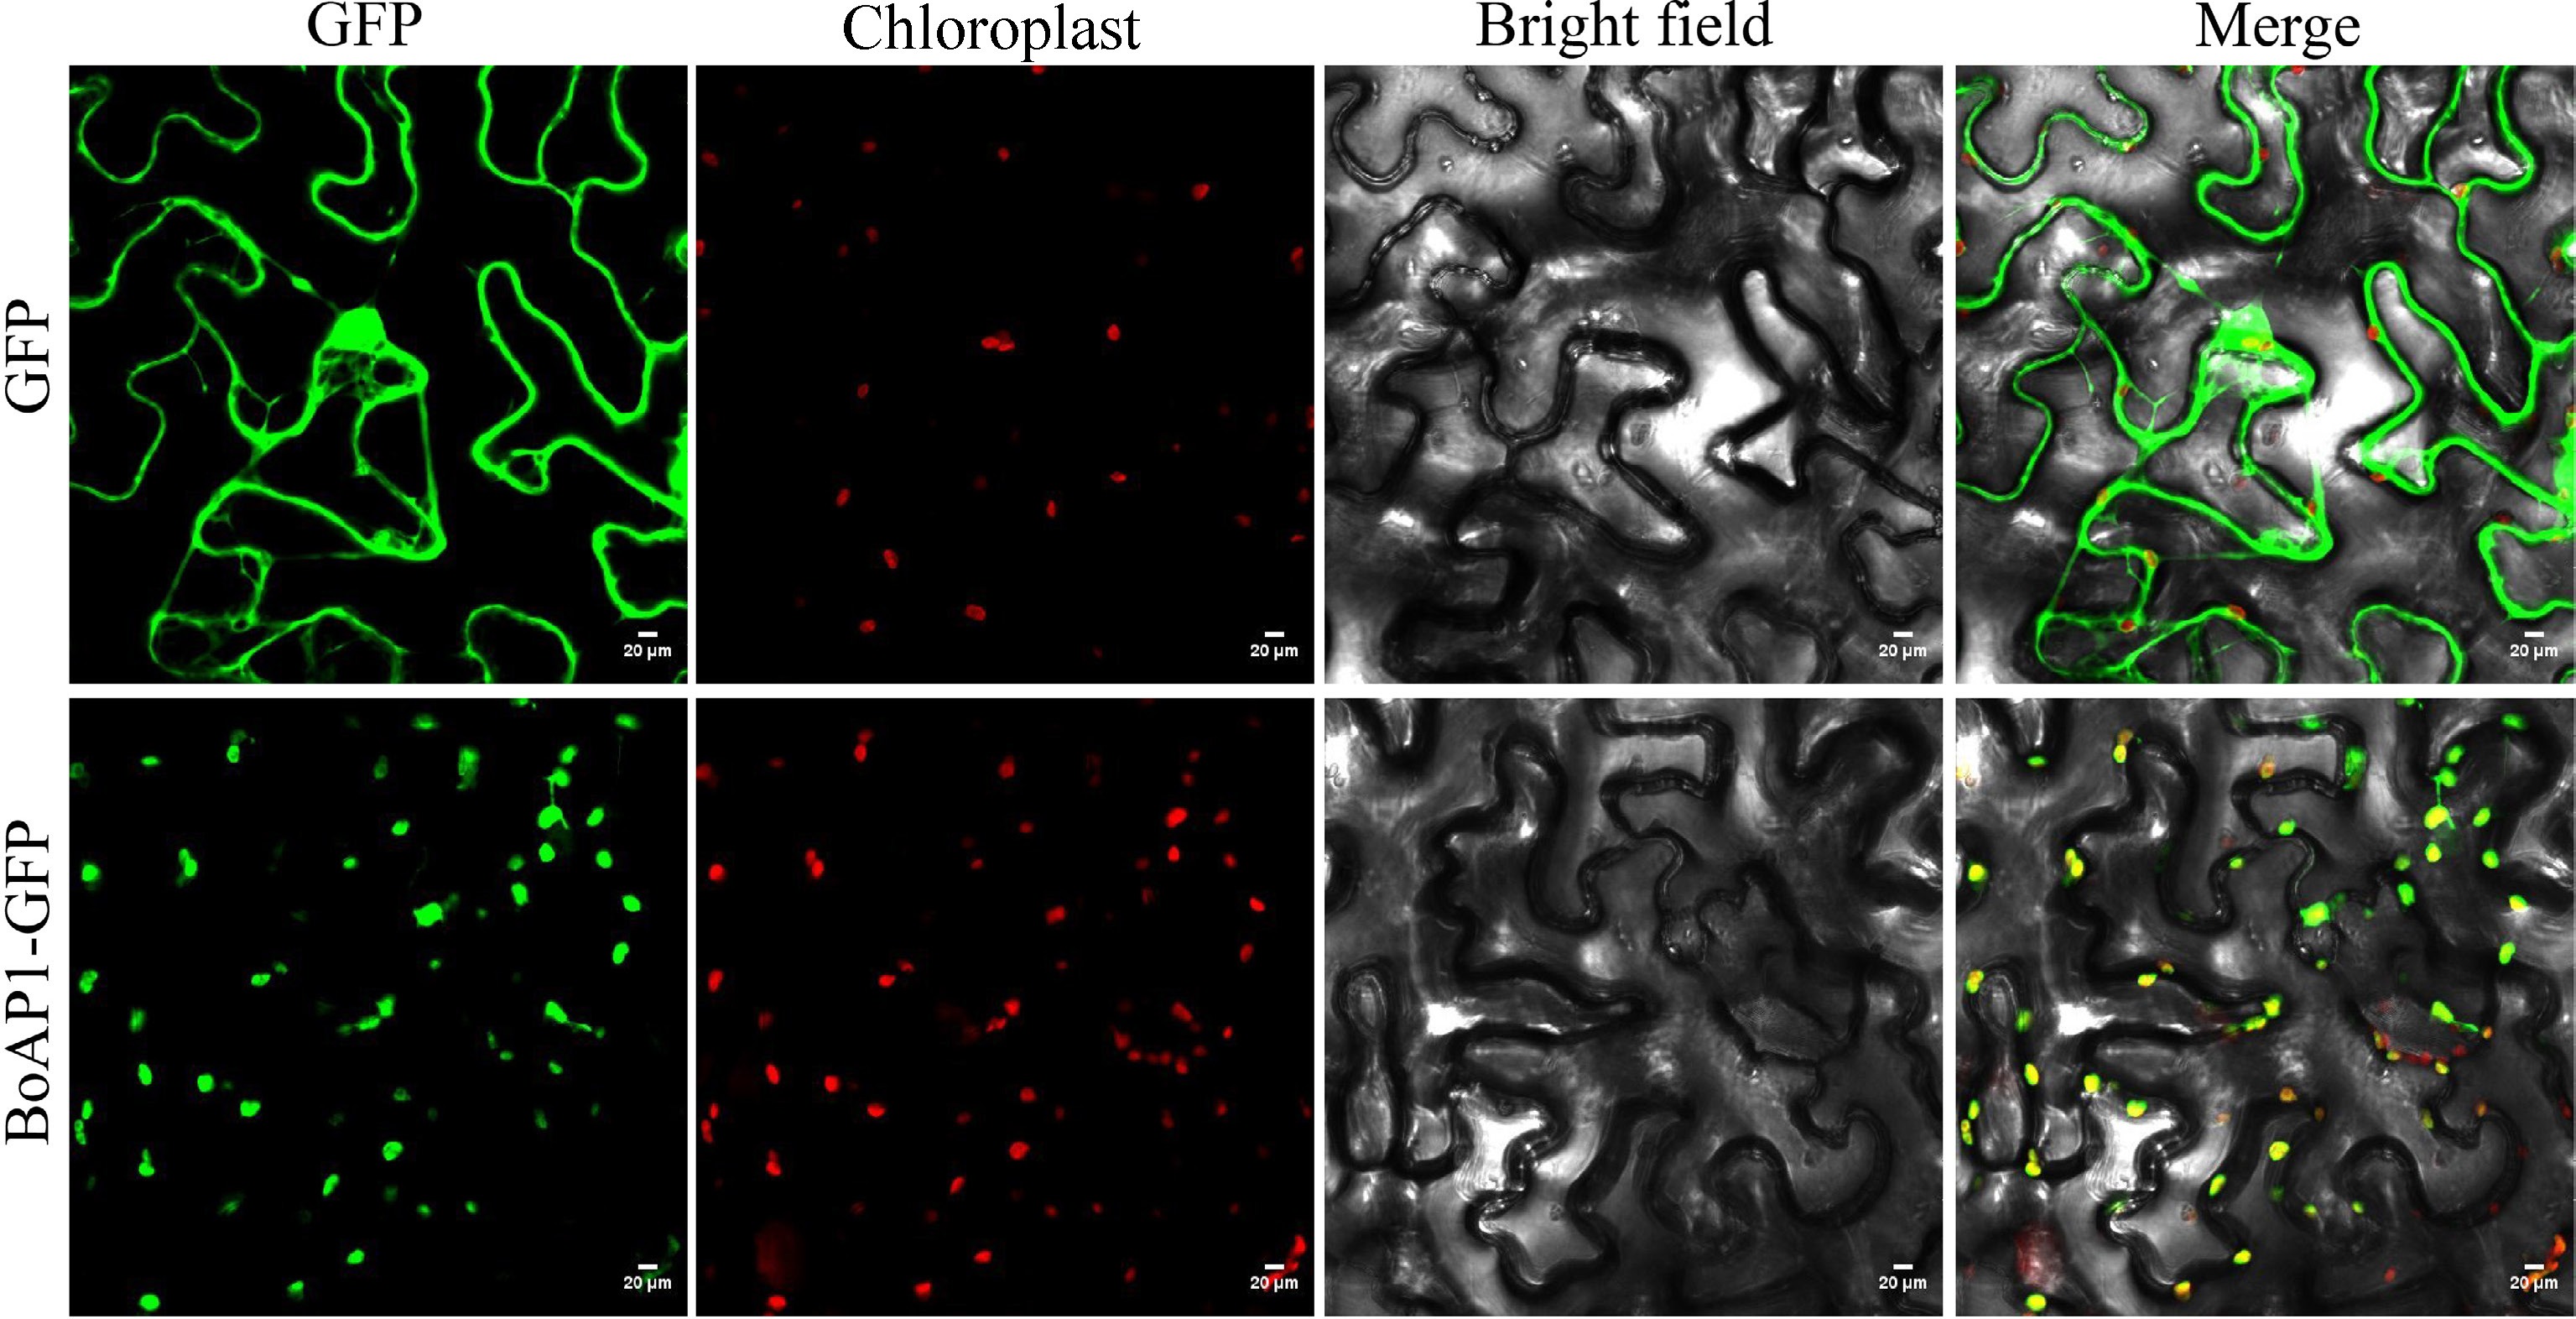
Figure 4.
Subcellular localization analysis of BoAP1. The tobacco leaves were transformed with the empty GFP vector and BoAP1-GFP fusion protein. From left to right: fluorescence of the empty GFP vector and BoAP1; spontaneous fluorescence in chloroplasts; bright-field image; merged image of the first three images. Scale bars = 20 μm.
-
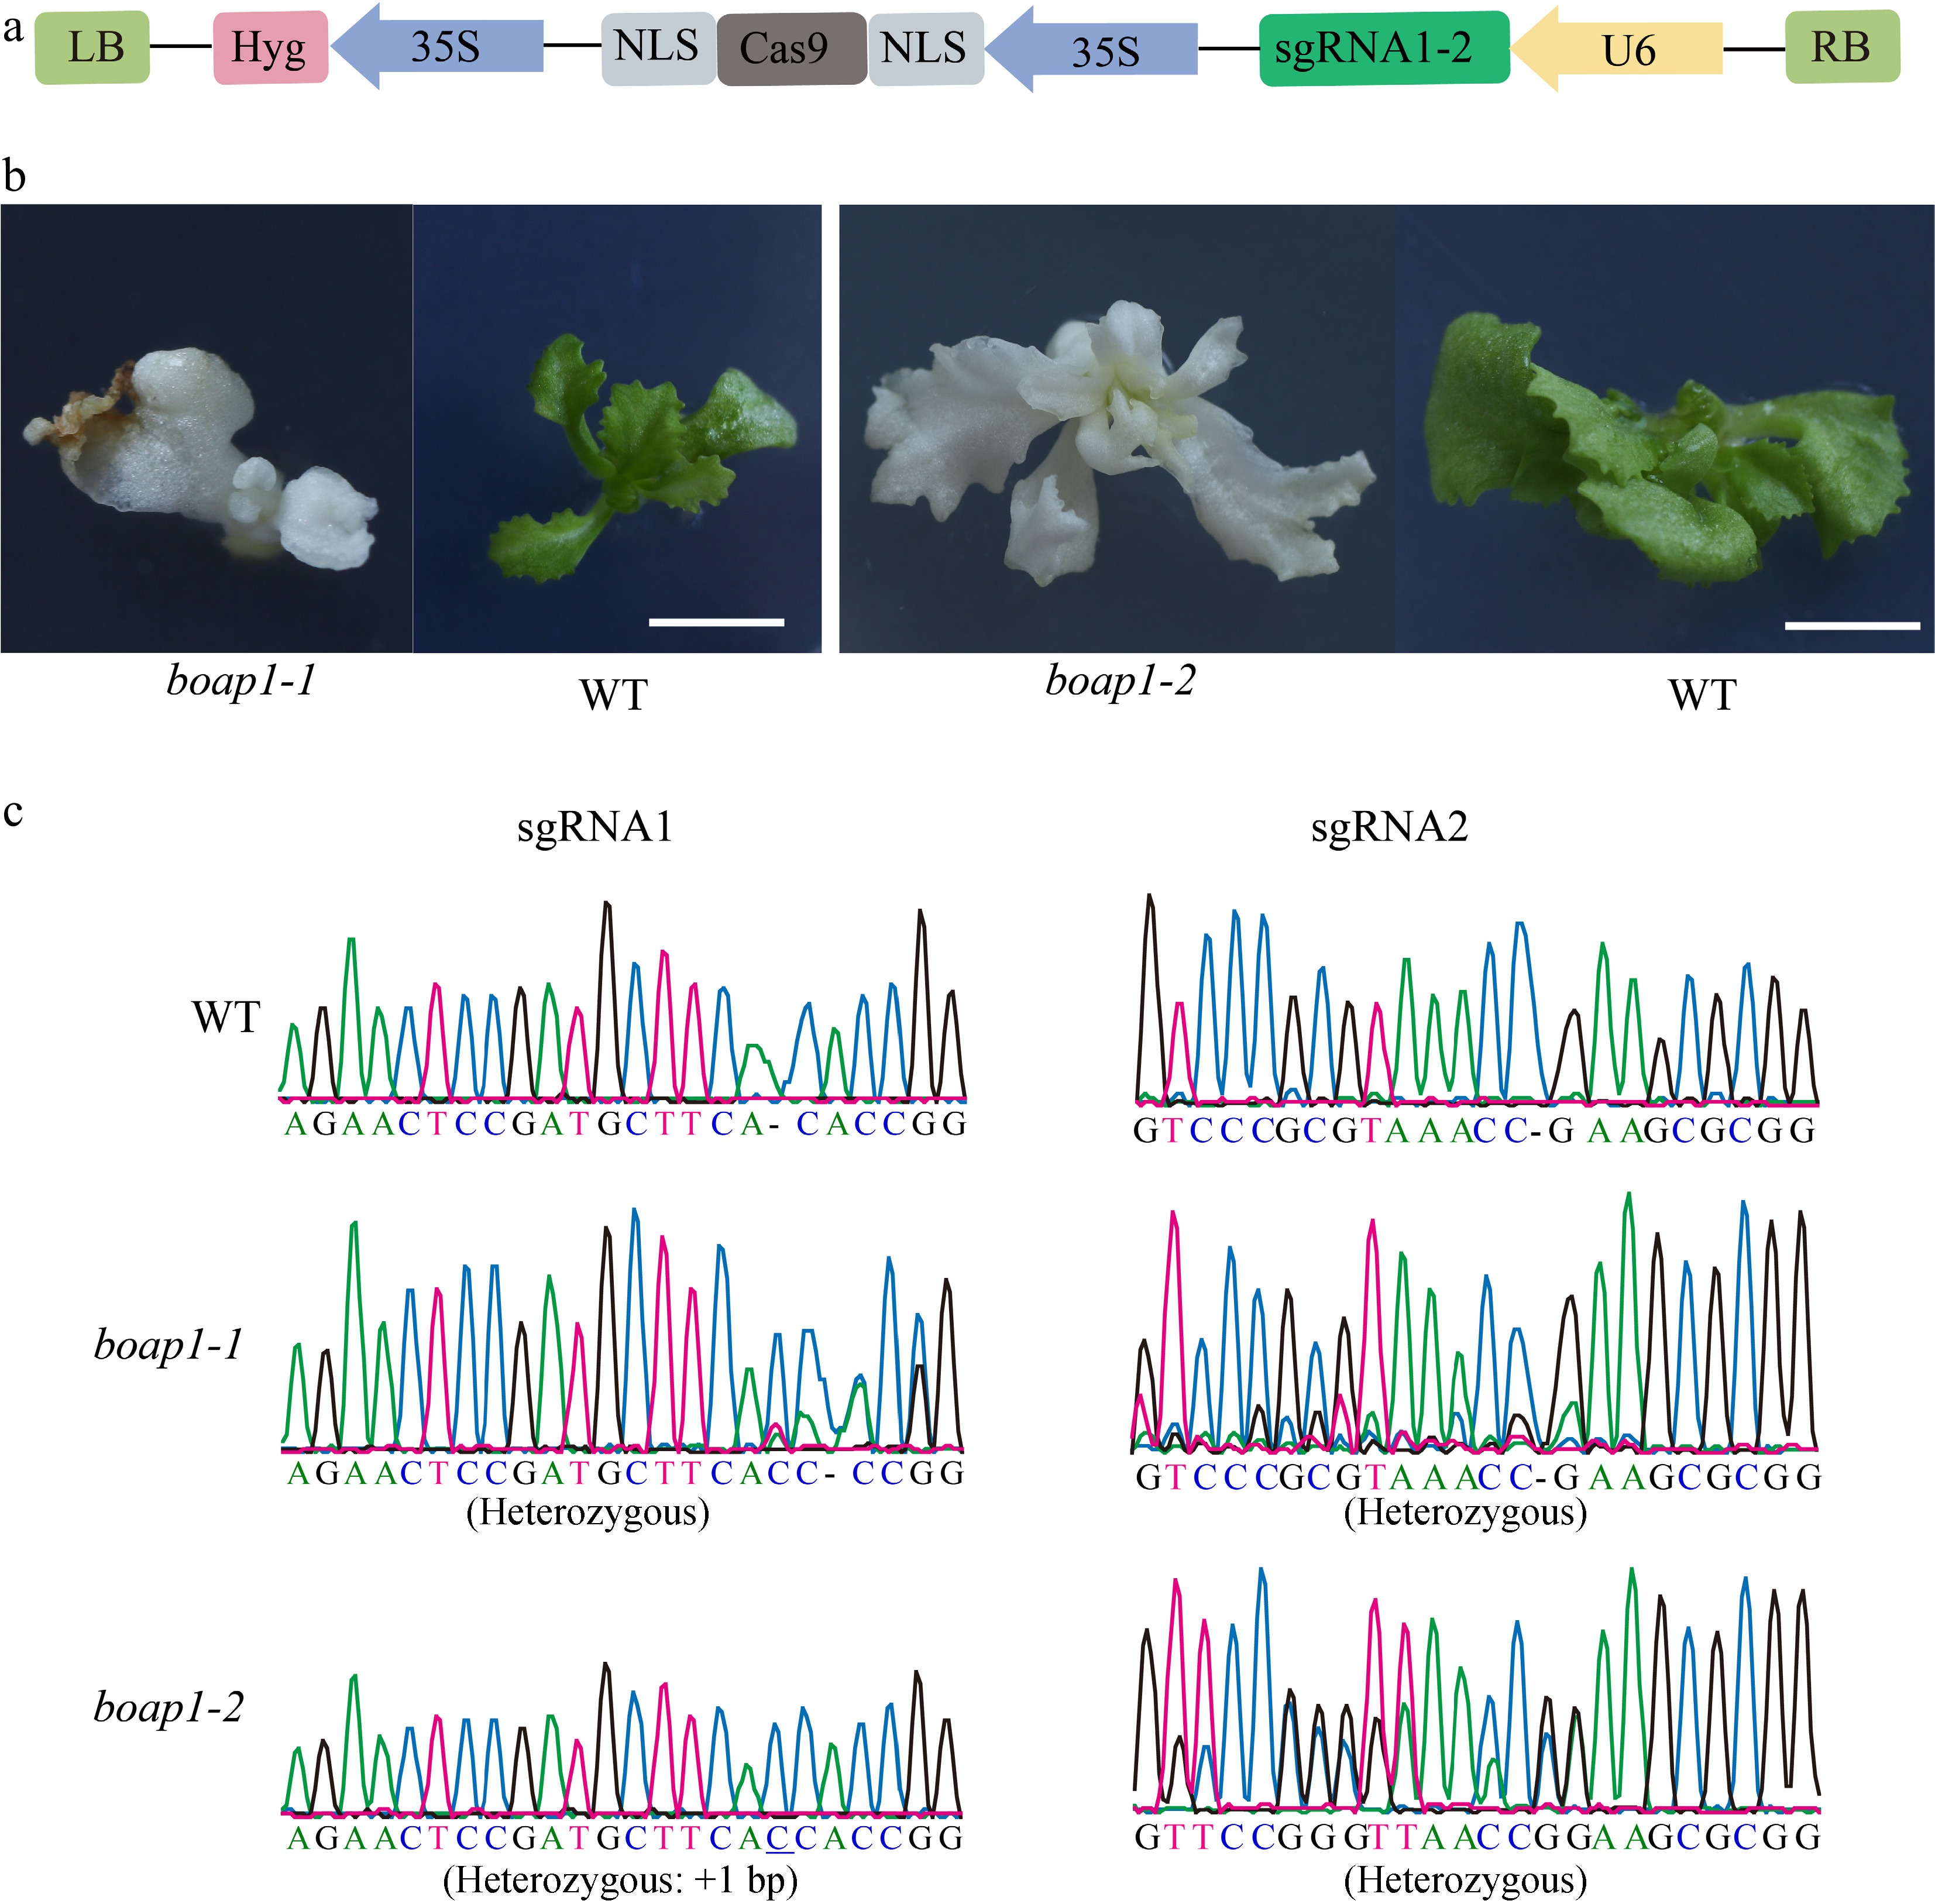
Figure 5.
Functional confirmation of BoAP1. (a) Schematic diagram of the pCas9-BoAP1 genome-editing vector targeting BoAP1. Hyg, hygromycin resistance gene; U6, Arabidopsis U6 promoter. (b) Phenotypes of the WT, boap1-1, and boap1-2. Scale bar: 0.5 cm. (c) Sequence mapping of the WT, boap1-1, and boap1-2 on the target region.
Figures
(5)
Tables
(0)